
The Credit Card Debt Debate
Does it even matter?
If there is one area that the fearmongers and people that have been screaming a recession is coming since 2022, keep going back to is credit card debt. I hear and see this discussed everyday. It’s impossible not to see or hear it debated daily on television or on social media.
So what exactly is credit card debt telling us right now? And does it even matter?
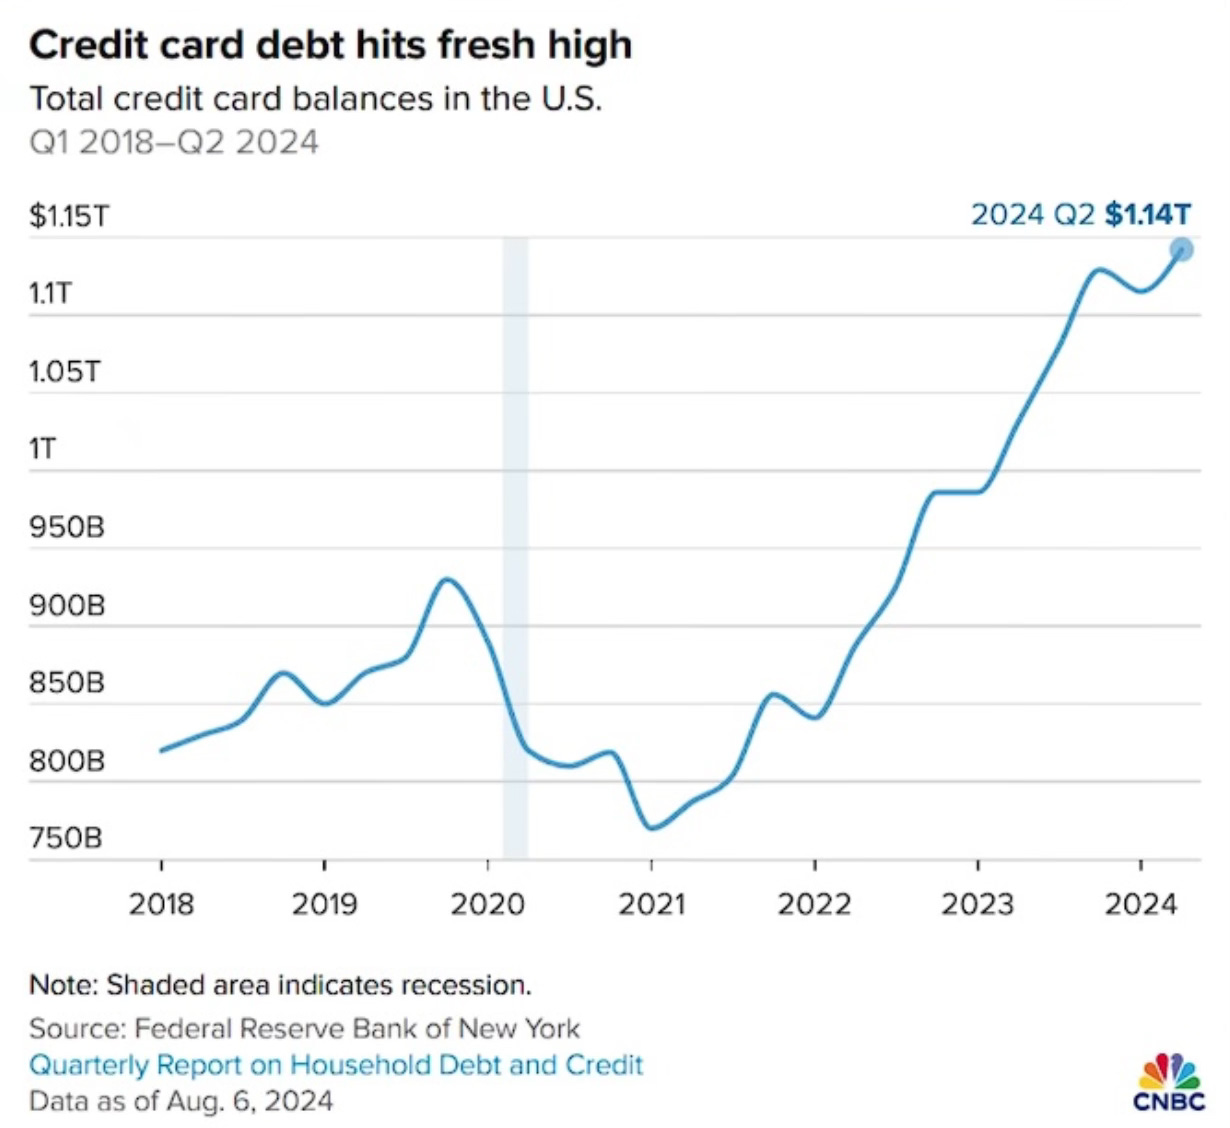
This is the most referenced chart that’s discussed when the topic of credit card debt is brought up.
It’s the, “oh my gosh, can you believe that credit card debt has hit a new all-time high?” chart. The most recent update as of Q2 2024 shows us that total credit card balances in the U.S. is at $1.14 trillion. A giant number, yes
Now I think you have to then put that number in context a little bit. I like what Ben Carlson did here with this chart that shows inflation-adjusted credit card debt in the U.S.
It goes back a bit farther than the earlier chart, but you can see that credit card debt now is still below 2007-2008 levels. Ben also points out the following.
On an inflation-adjusted basis, total credit card debt in the US is up just 1.8% since 2020
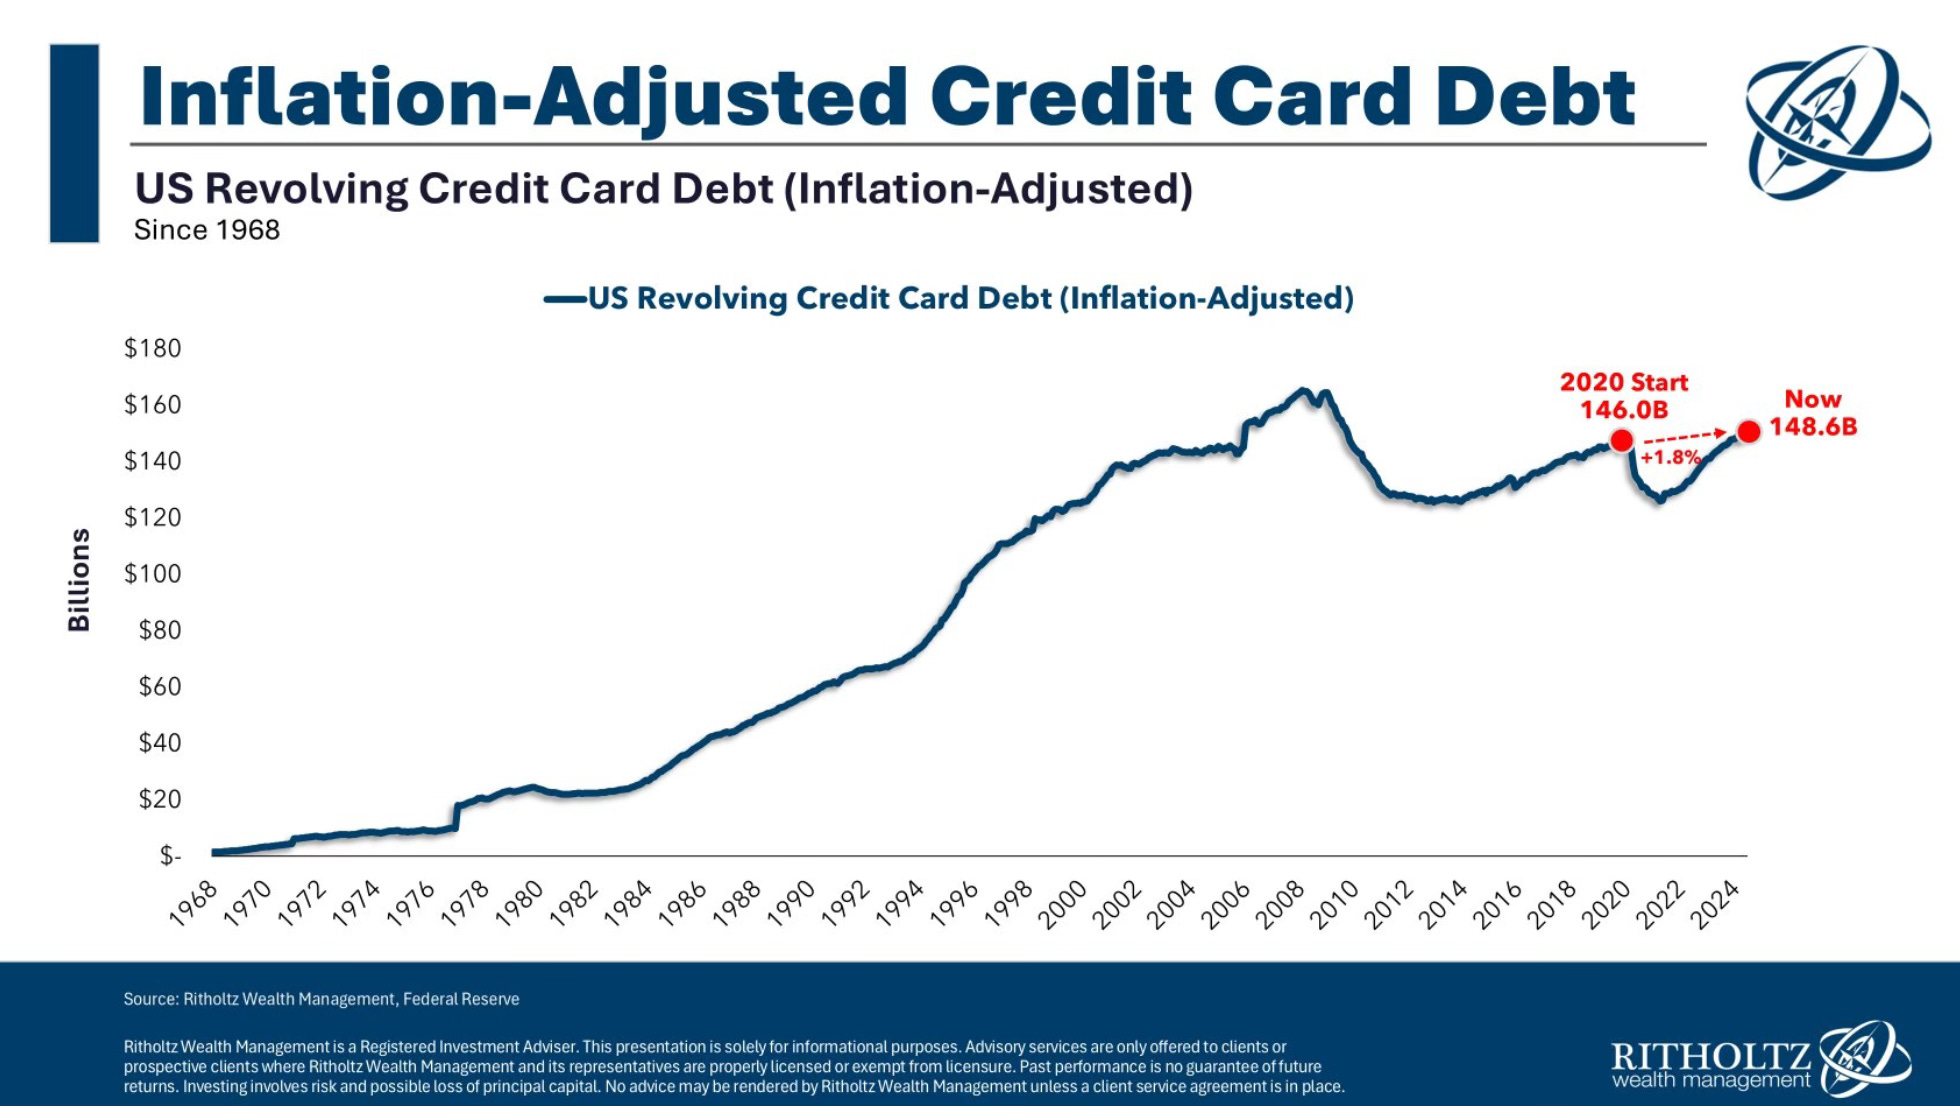
Simply put, things cost way more. We know the inflation story. So the amount of money spent is naturally going to be more in dollar terms. People’s income and assets have also risen dramatically. The overall amount of credit card debt isn’t near as important as the number suggests.
To me that doesn’t paint the picture of a weak or even weakening consumer. I’d argue that shows the consumer is in better shape now than in the years past.
Next is the credit card delinquencies part of credit card debt. This is an area that has a bit more bite to it.
I think of all the charts on the U.S. credit card debate, this is one of the most important. It shows credit card debt balances in serious delinquencies (90+ days).
As you can see, now about 11% of credit cards are delinquent 90+ days. In looking back at history, it suggests an economy that was already in a recession.
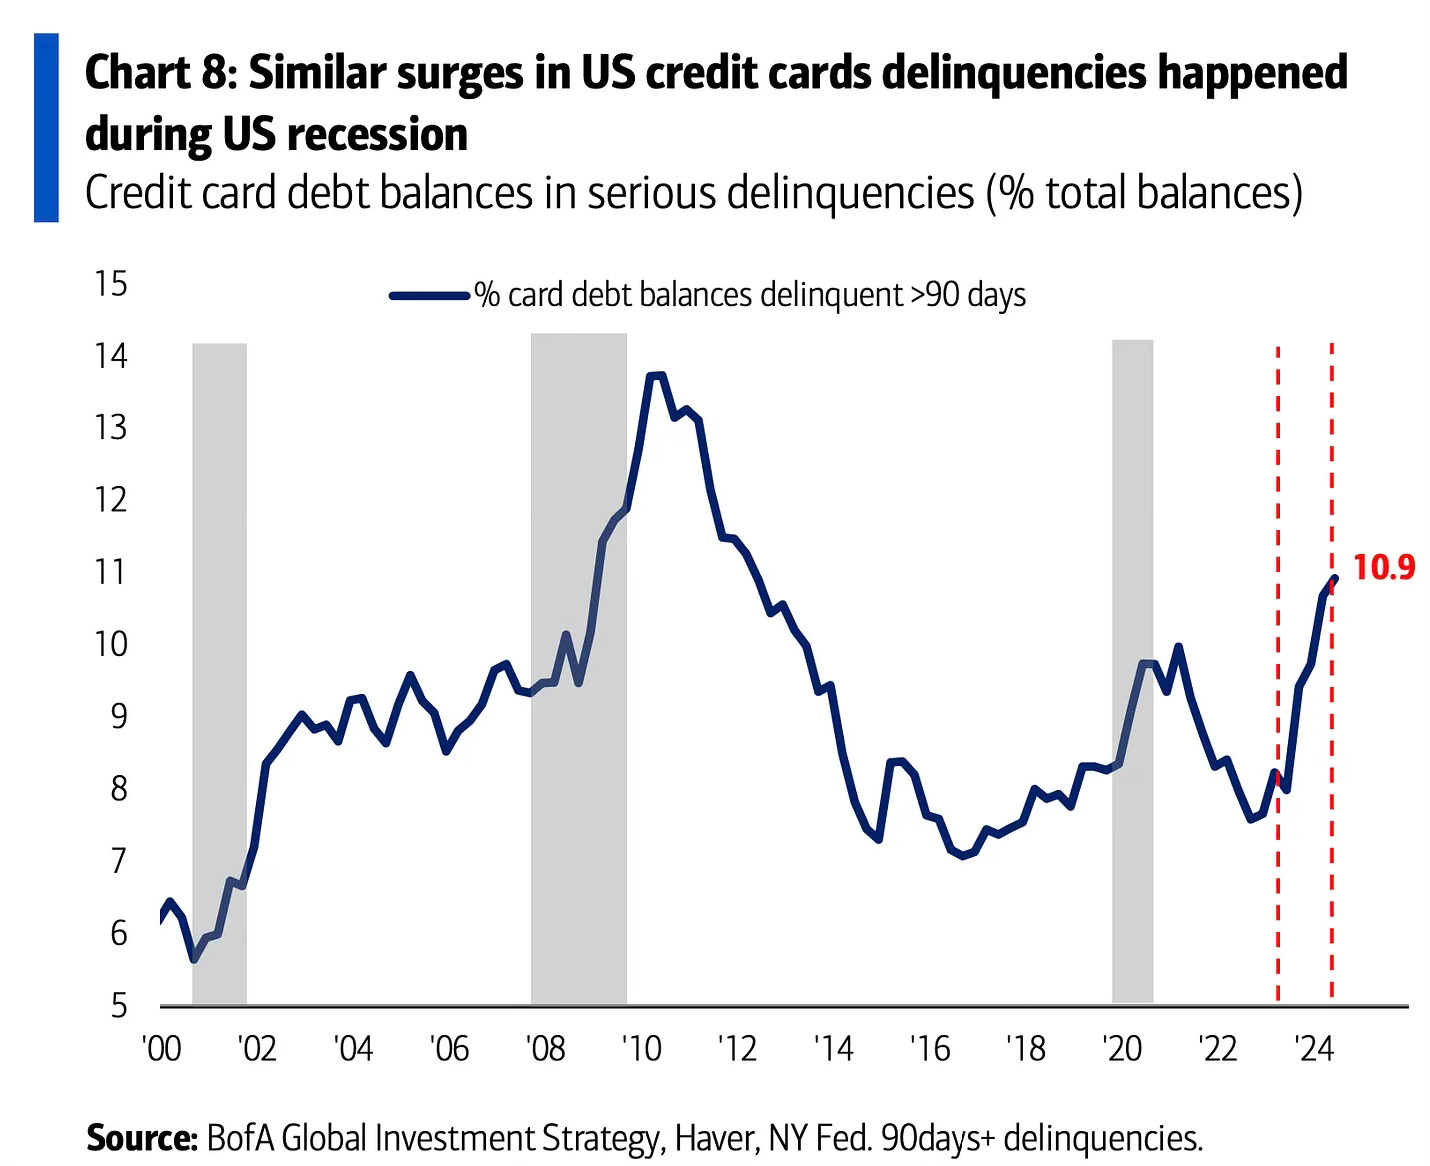
If you’re a fearmonger or someone that believes we’re in or are calling for a recession, this is the chart you would keep bringing up. It may as well be your screensaver on your computer and the background of your phone.
Whether you think it matters or not, you have to acknowledge that it isn’t painting a good picture. 11% is getting up there. A little more than 1 out 10 people are 90+ days delinquent.
Or it could have peaked and may be coming down. Or it may even get worse. Nobody knows.
Maybe down the road this will be what is pointed to as the recession indicator that not enough people paid attention to.
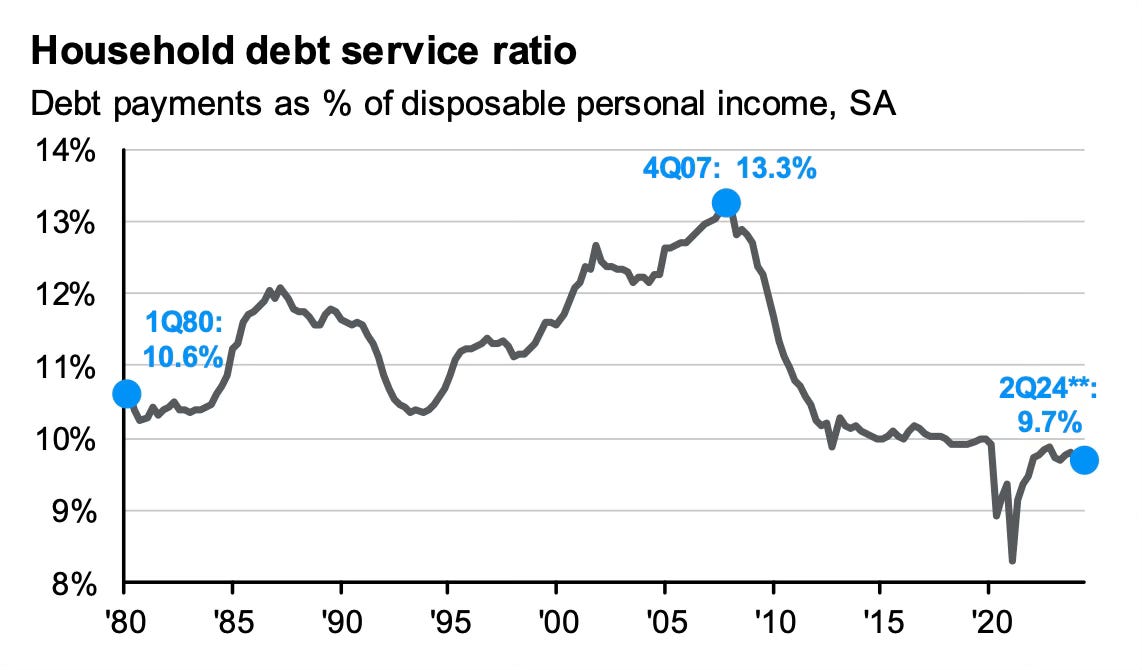
Now if there is one chart that can be brought up to combat the previous, it’s this one.
It’s the household debt service ratio chart. This shows that debt payments as a percentage of disposable personal income is still quite low at 9.7%. Very low if you look at the percentages historically.
One chart can tell one story and another chart can tell another. Both can be important and matter. In time we will know what story is told.
For now though, the debate wages on.
The Coffee Table ☕
Kyla Scanlon who writes Kyla’s Newsletter wrote an excellent piece called Home Insurance is a Really Big Problem. This is the best thing I have read on the home insurance issues and what’s happening. It’s going to continue to be a problem and the talk will only get louder until things get addressed.
Sometimes you read things that make you think or you find yourself nodding in agreement. That’s what the post The Most Important Question of Your Life by Mark Manson did for me. It really makes you look at where you’re at and what’s next. A great piece of writing.
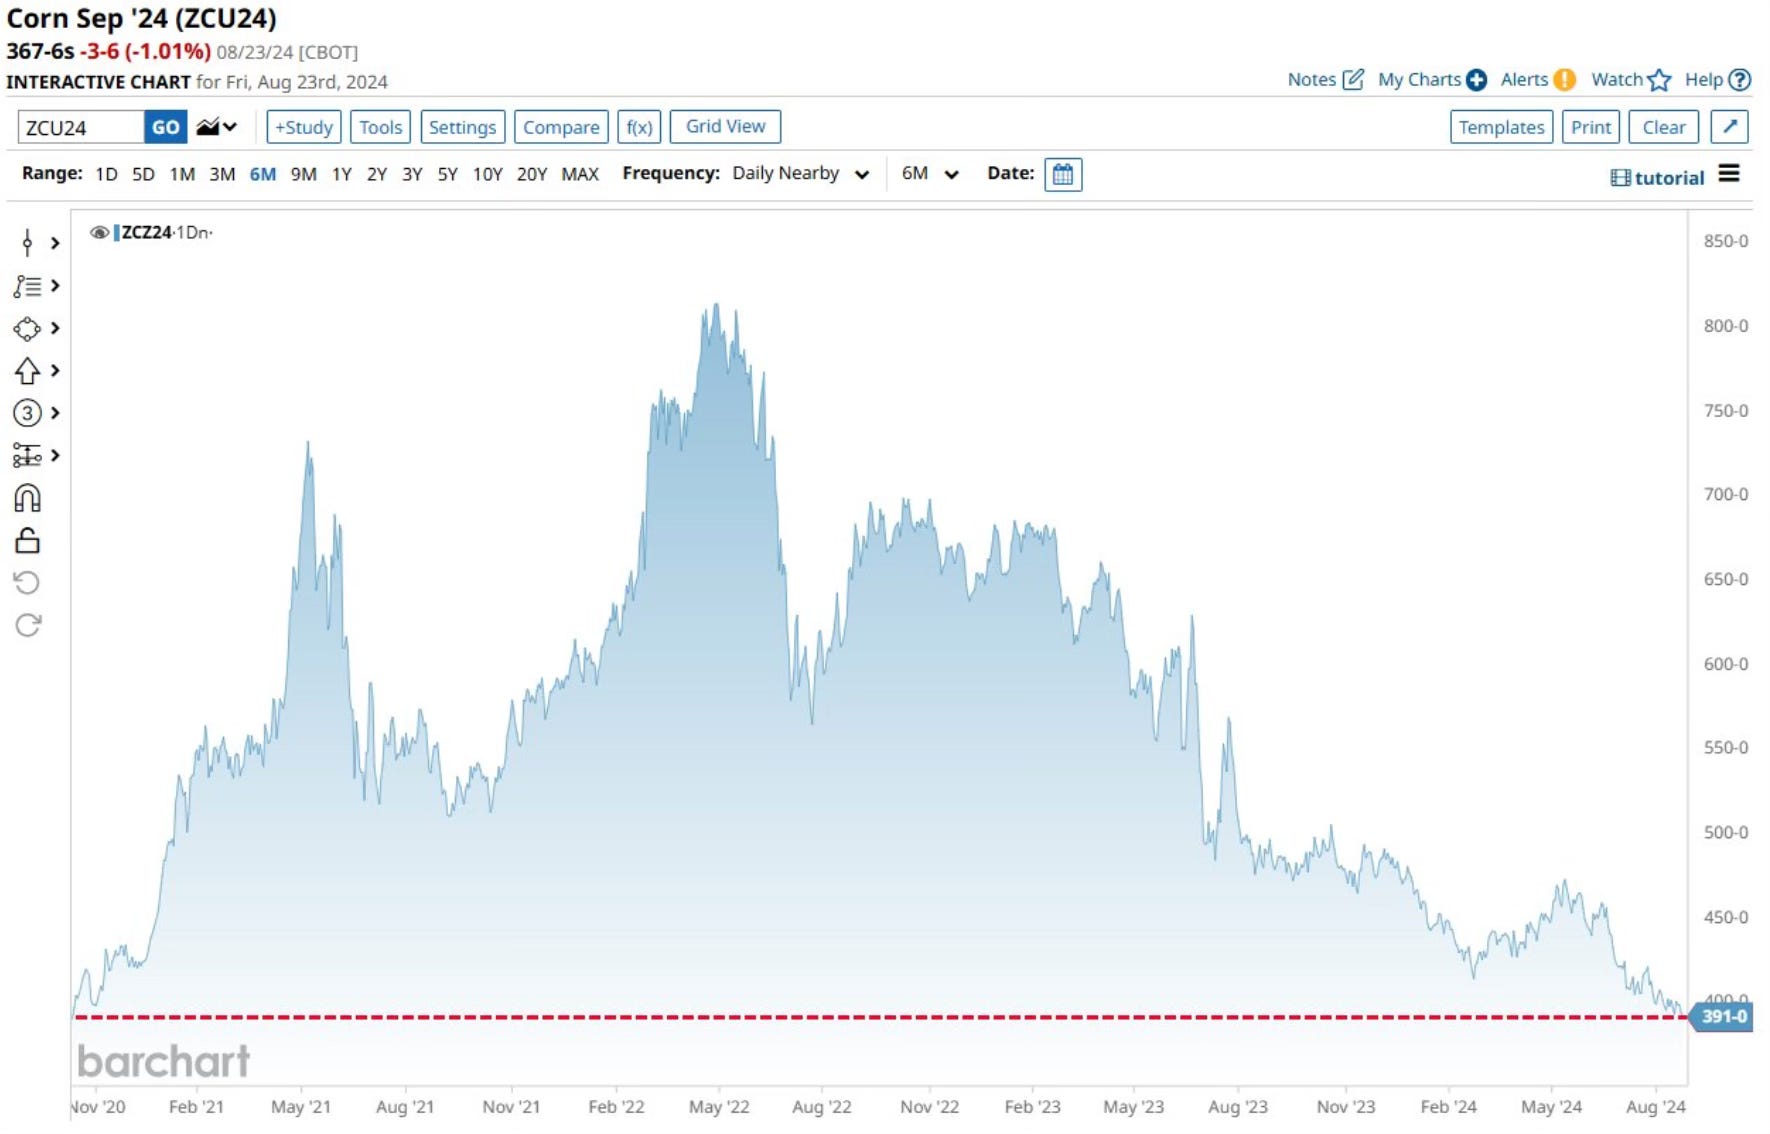
Corn isn’t so sweet right now. The price of corn continues to tumble. It just closed at the lowest level since October 2020.

Source: Barchart
Thank you for reading! If you enjoyed Spilled Coffee, please subscribe.
Spilled Coffee grows through word of mouth. Please consider sharing this post with someone who might appreciate it.