Investing Update: A Look At My Portfolio
What I'm buying, selling & watching
Friday was the worst day for the stock market in 2025. In fact, it was the biggest daily drop for the S&P 500 and Russell since December 18th.
Fridays have not been very kind lately to investors. Stocks haven't had an up Friday since early January.
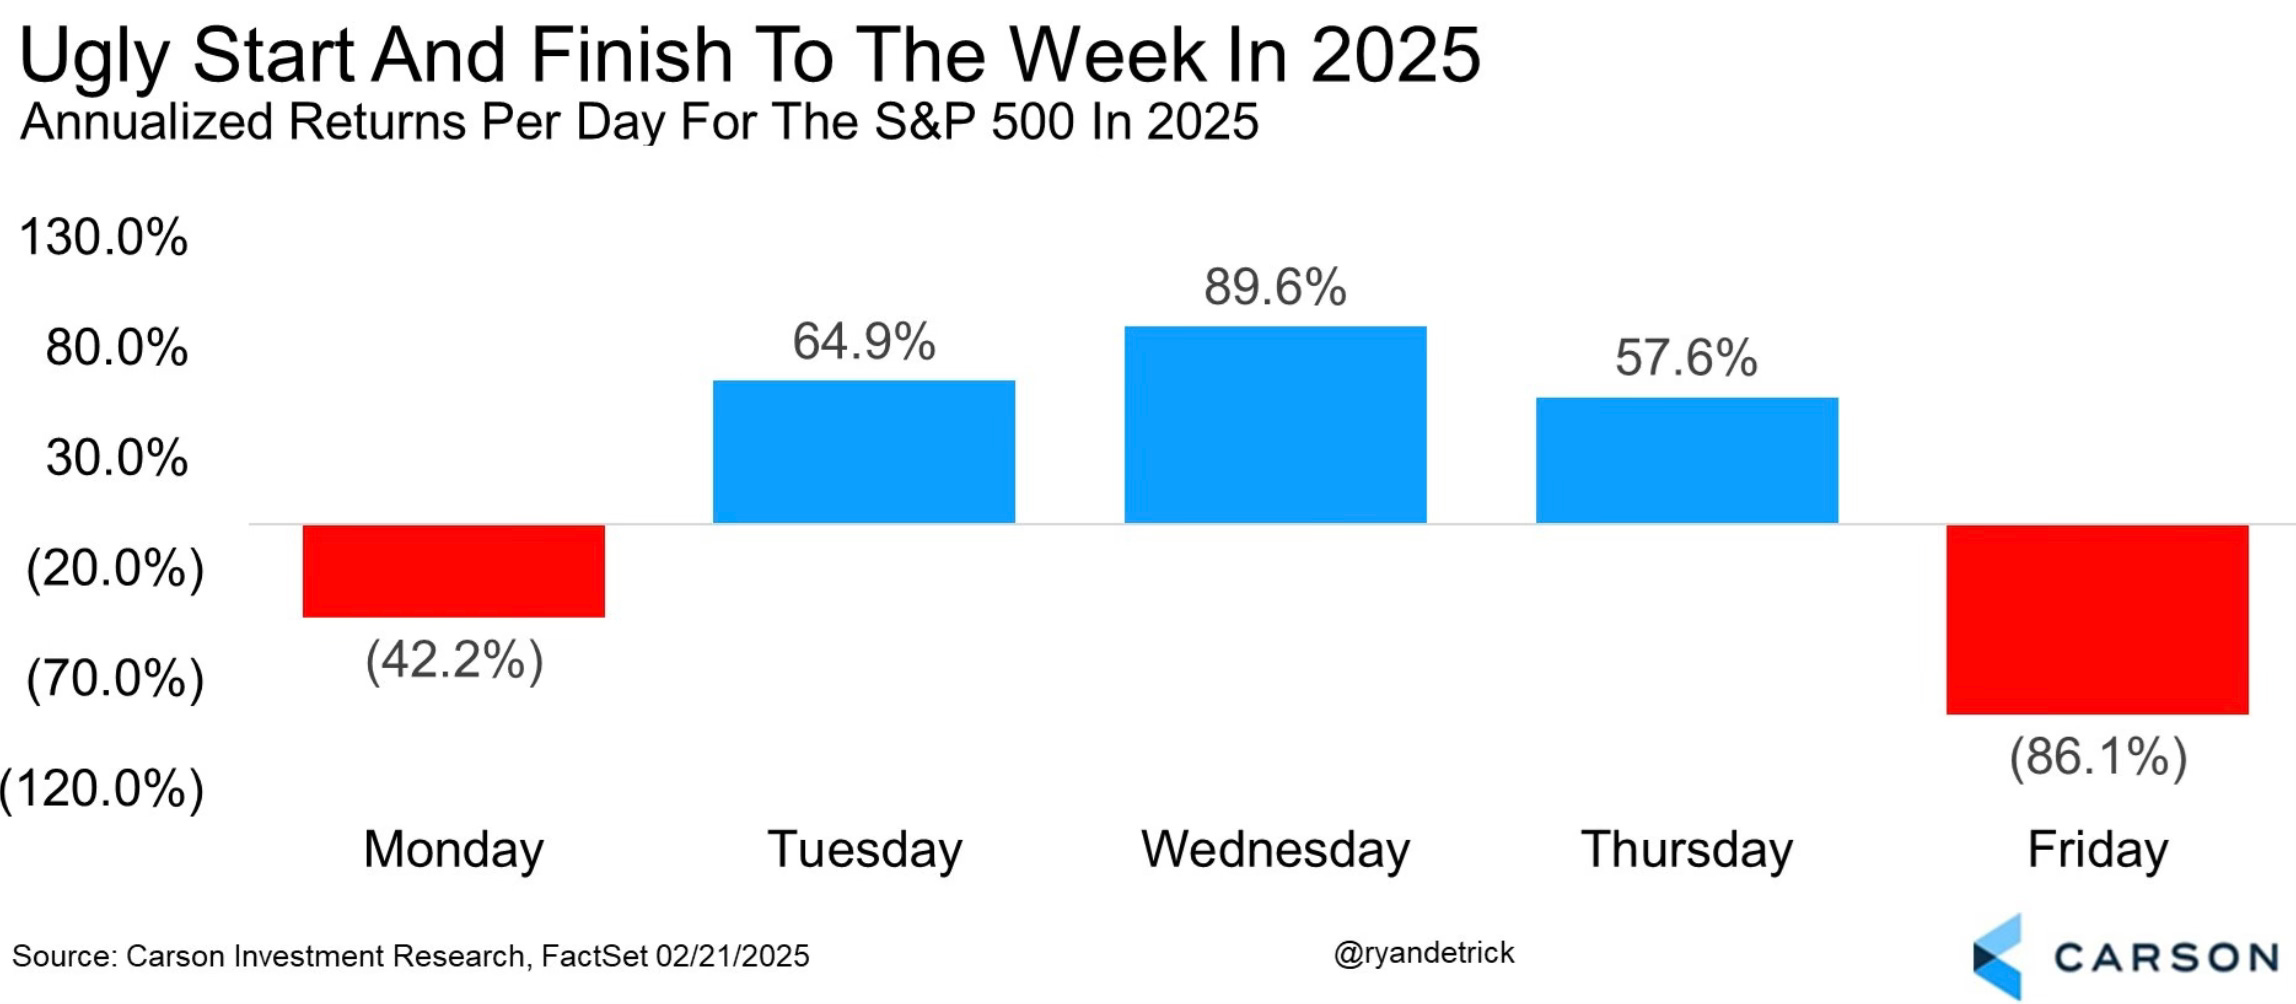
Here is some great data from Ryan Detrick on just how bad Fridays have been.
After today, the S&P 500 is down an annualized 86.1% on Friday. Only 1937 was worse.
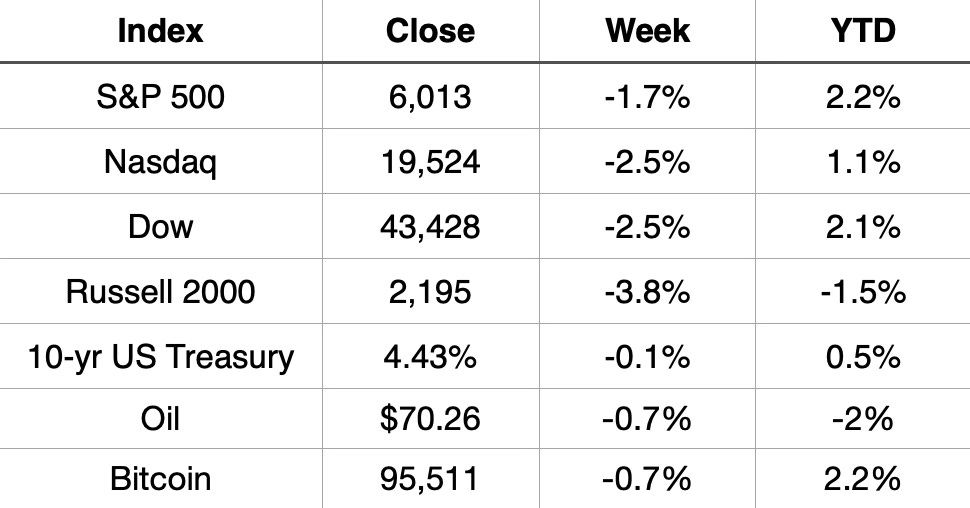
For the week, all three major indices finished sharply lower. They’re now just slightly positive YTD. The Russell 2000 is now negative YTD.
Market Recap
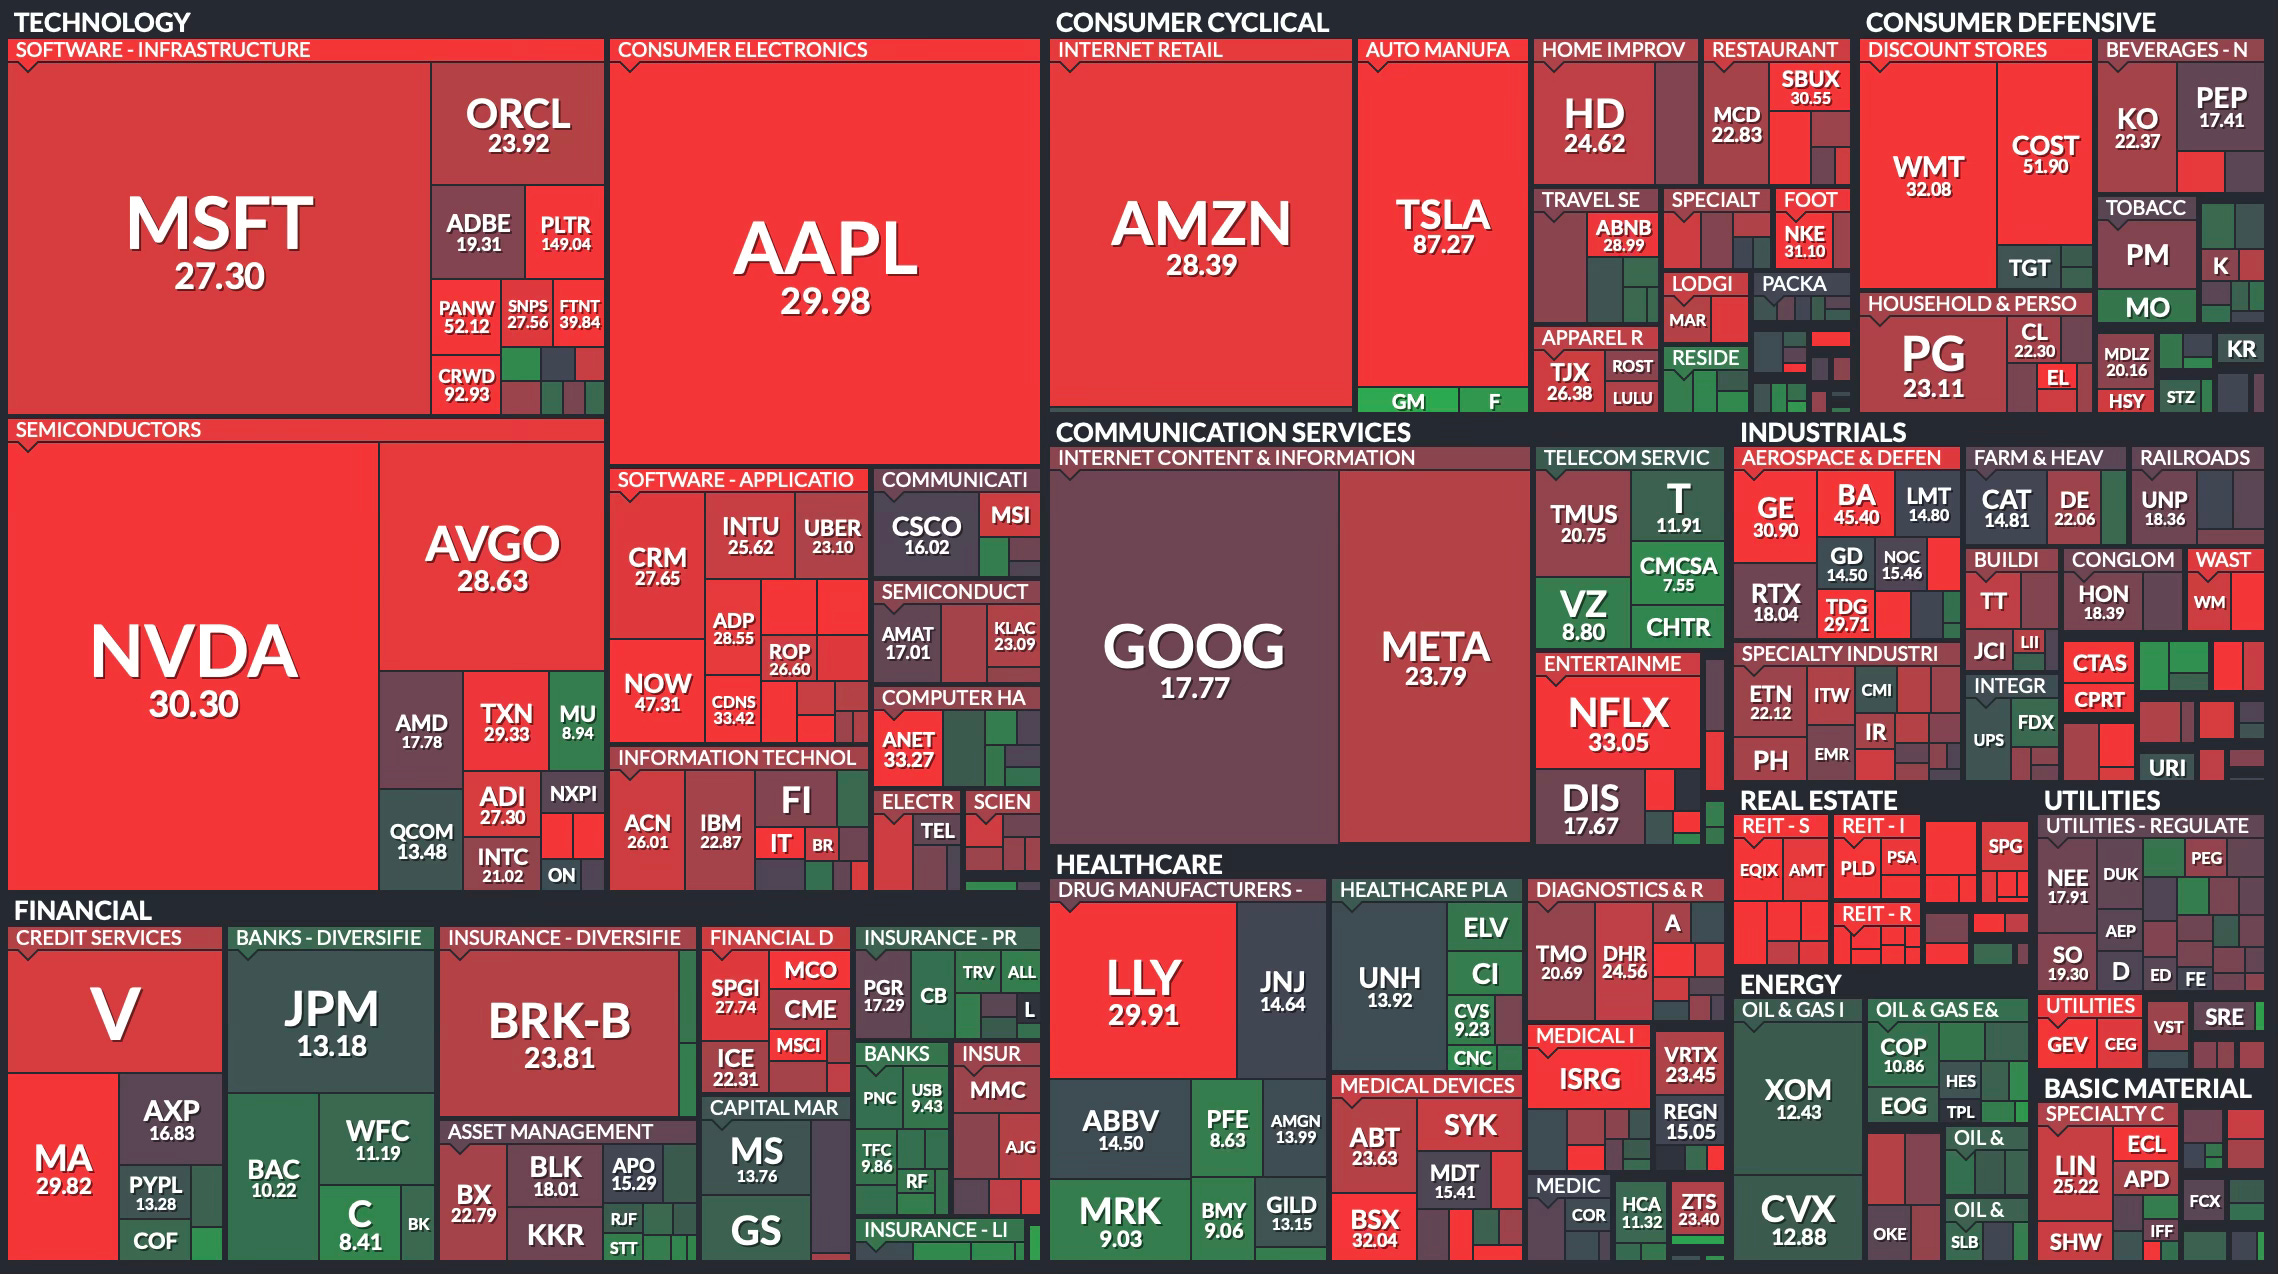
Weekly Heat Map Of Stocks
So far in 2025 the Magnificent 7 have been lagging behind. They’re actually last behind all the others.
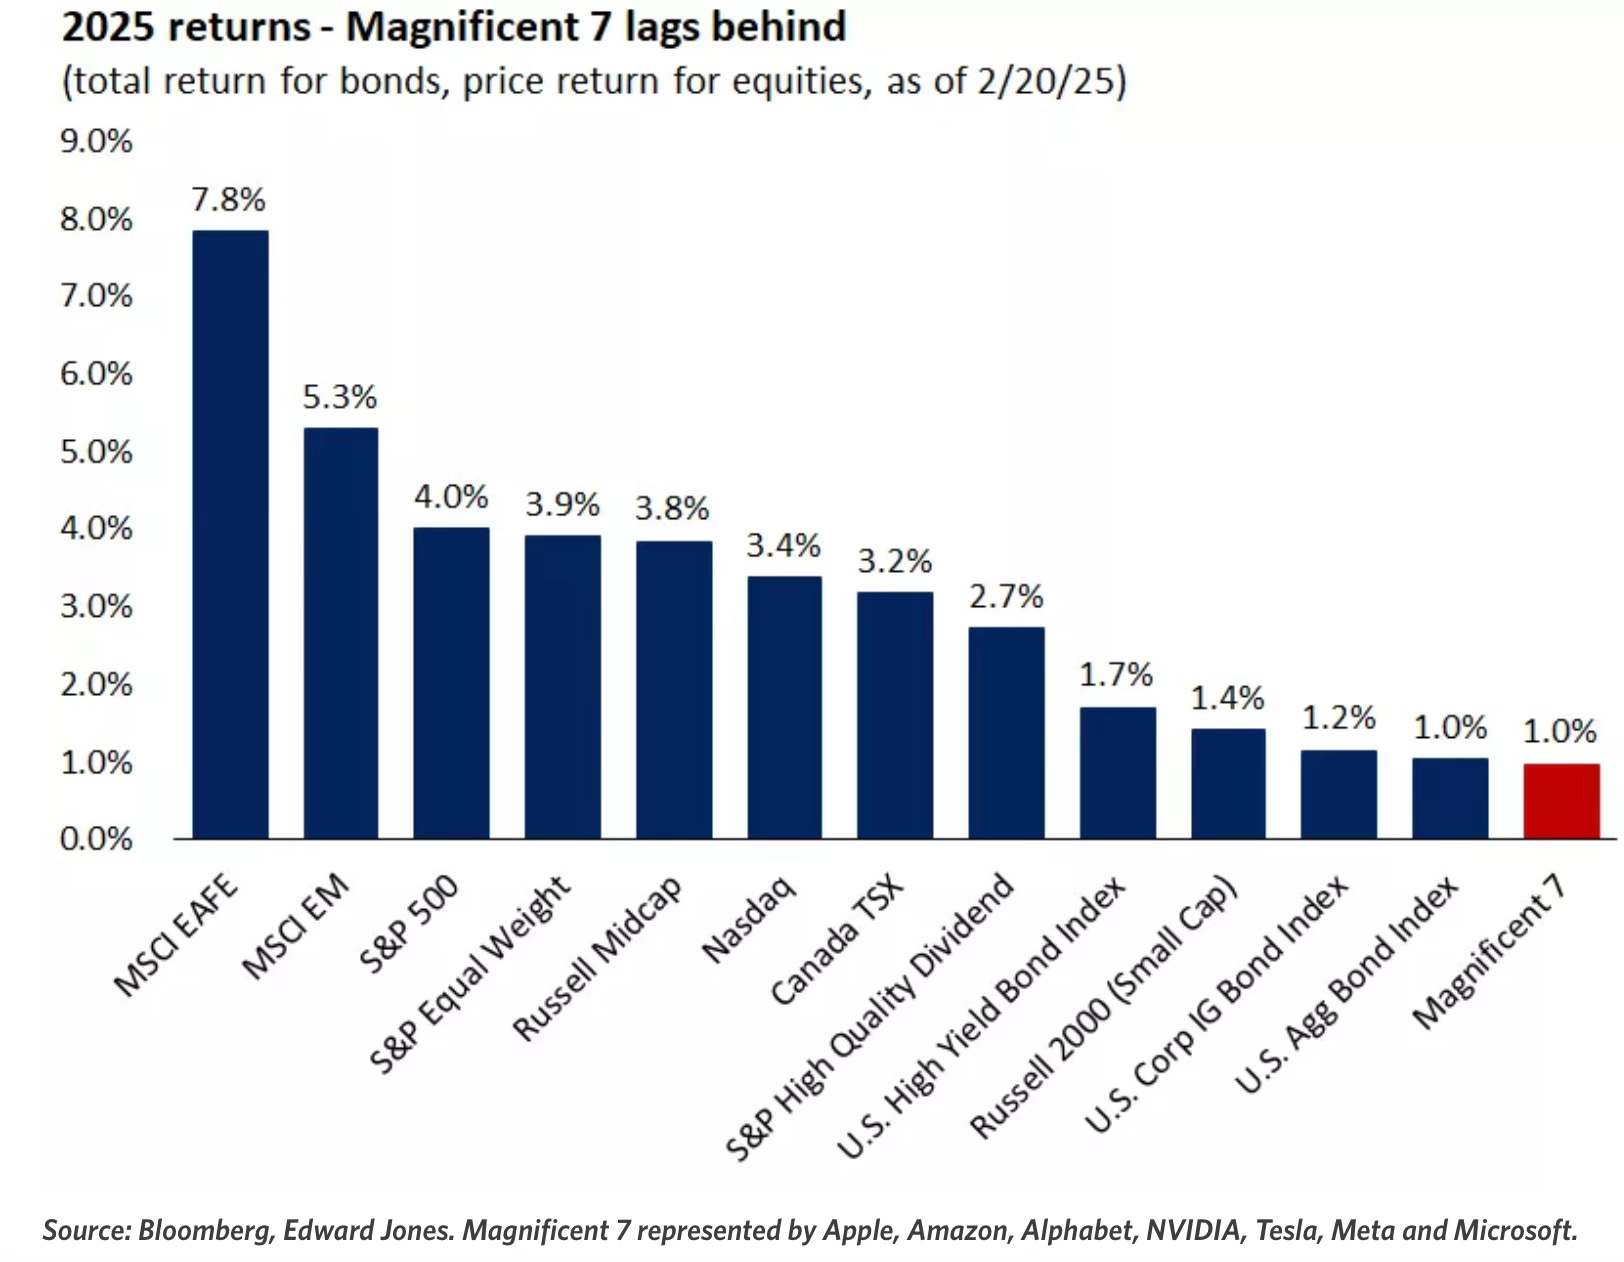
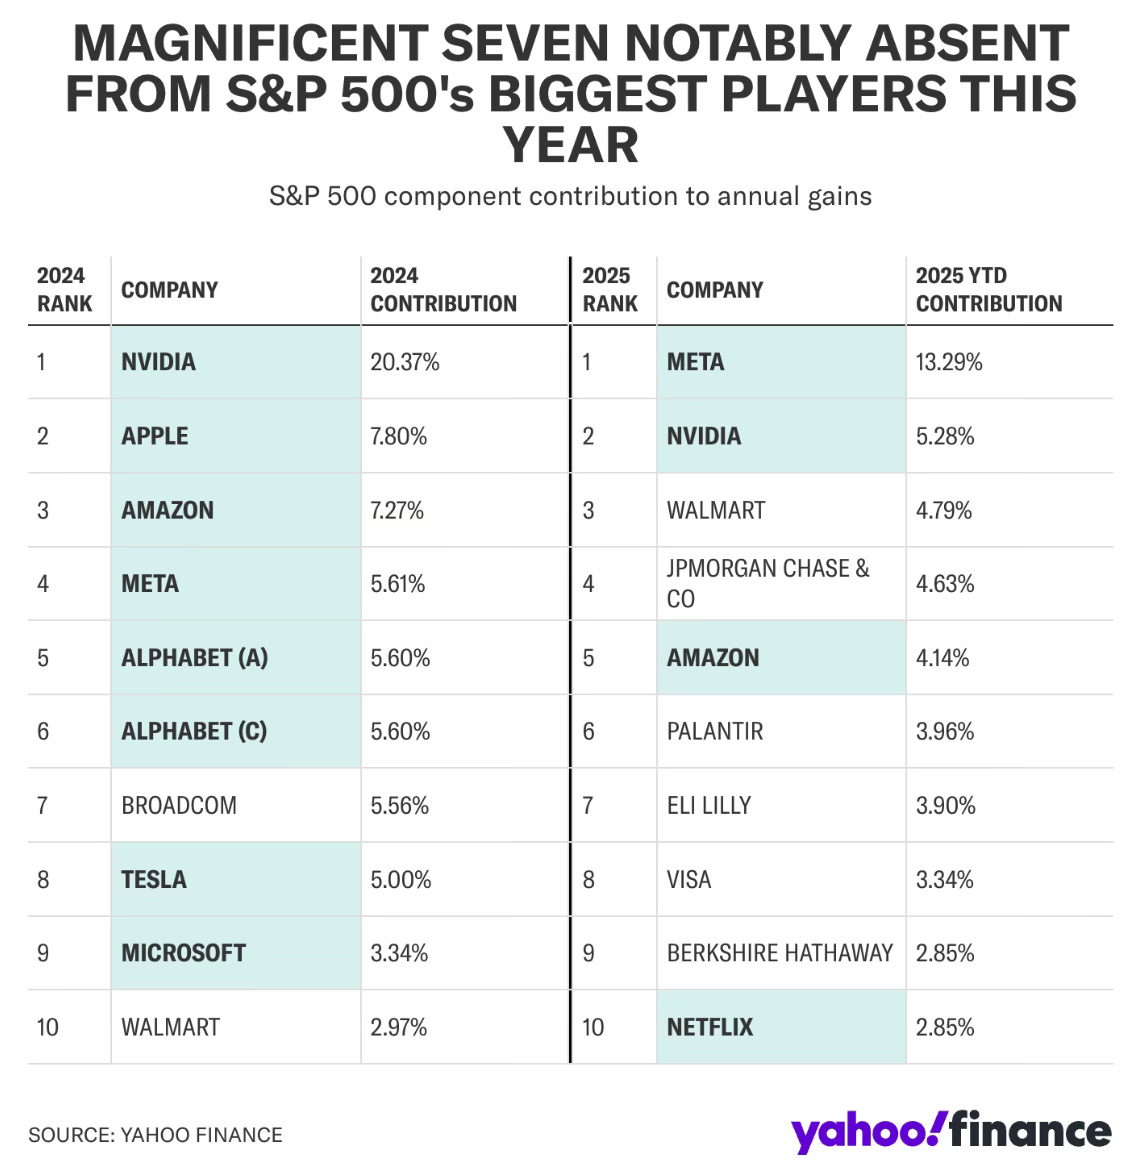
That’s quite a change from how much of an overall contribution they made to the S&P 500 annual gains in 2024. It’s very early in the year and I do believe they are taking a rest while other areas pick up the slack in a broadening bull market.
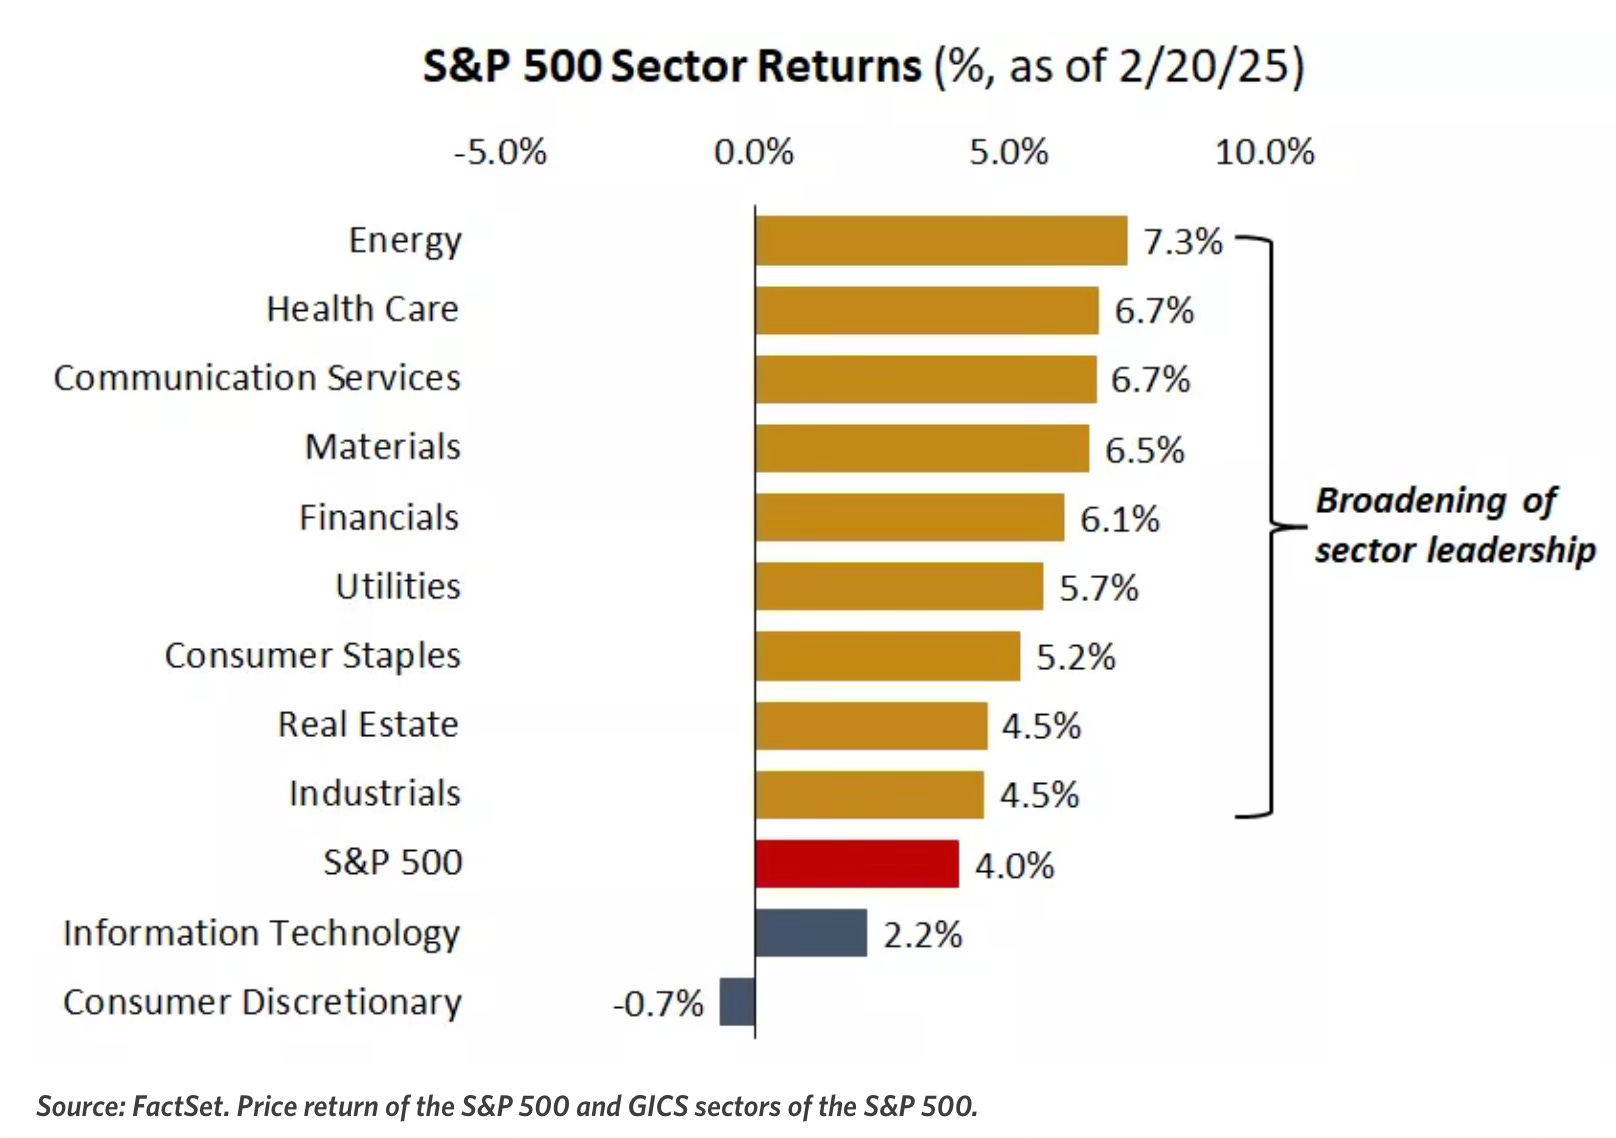
You can see that bull market broadening evidence here by what sectors have been doing the leading.
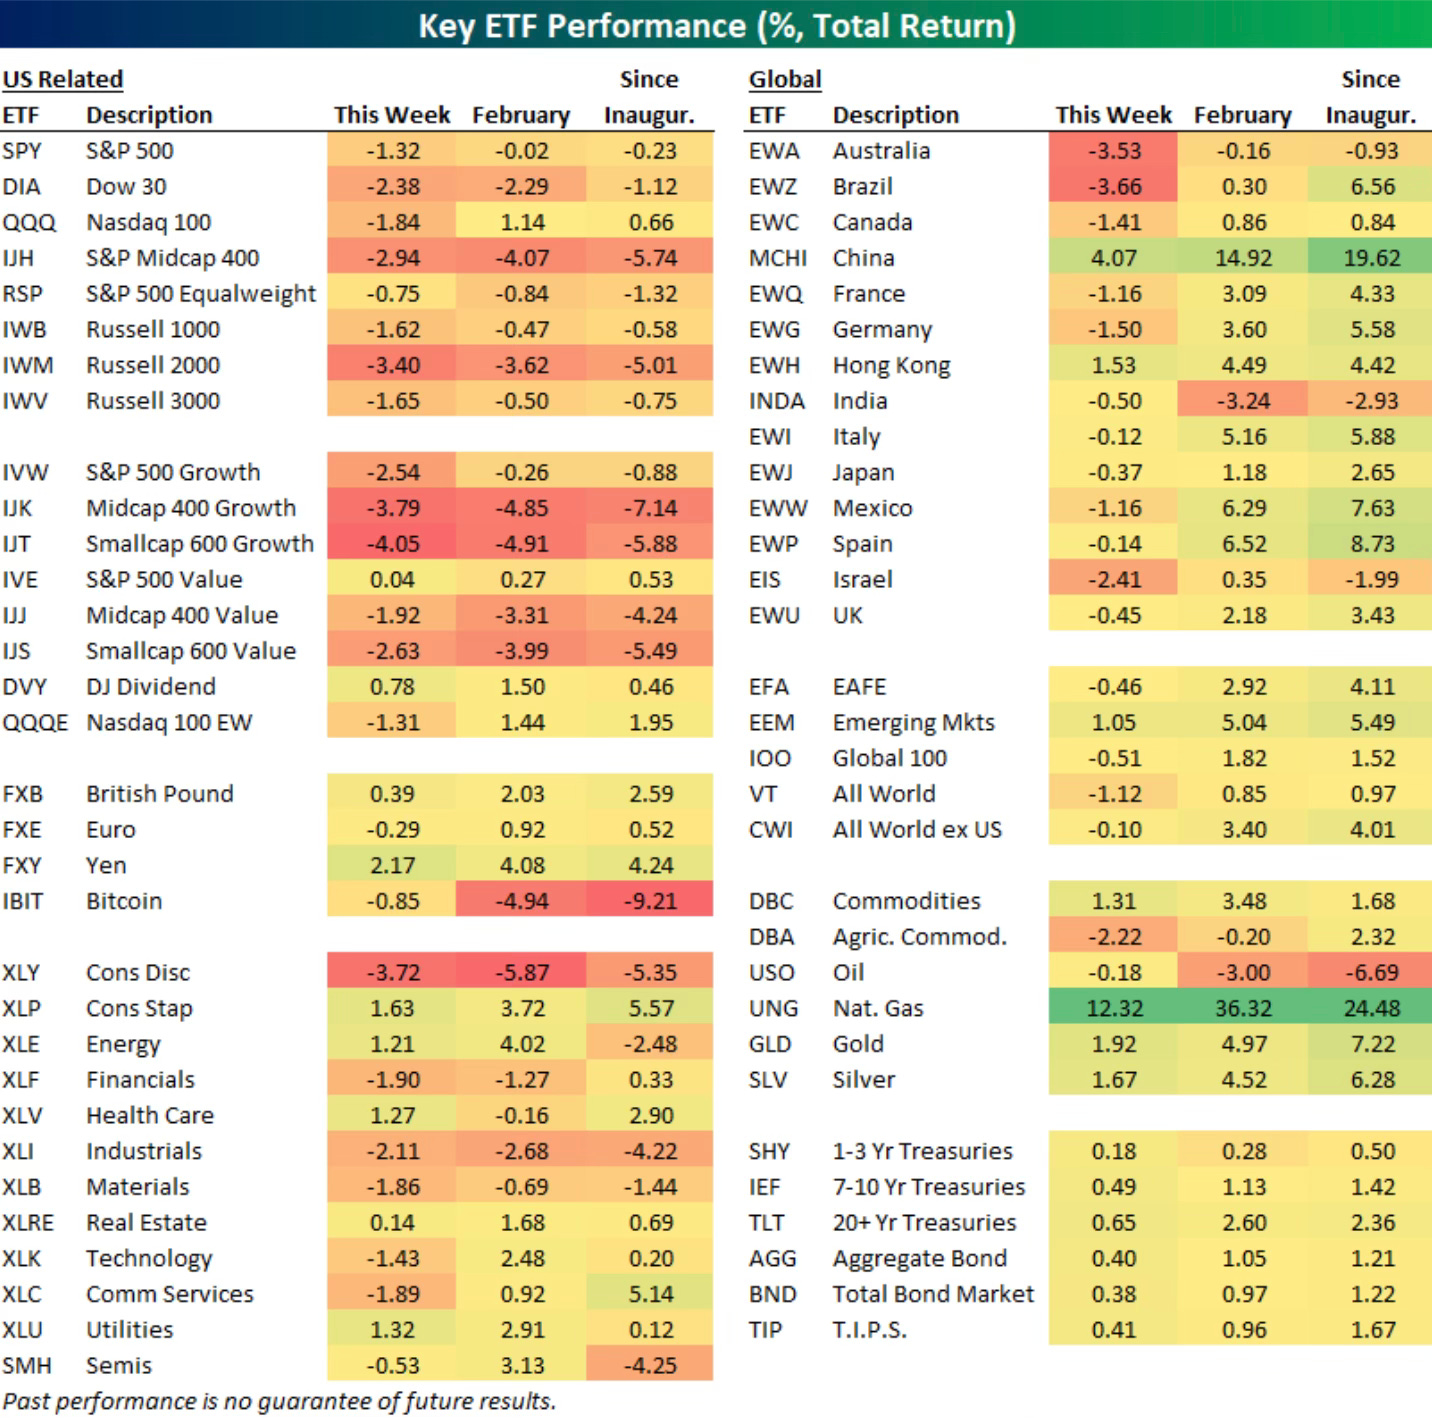
Here is a good breakdown of ETF performance over the last week, month and since the inauguration.
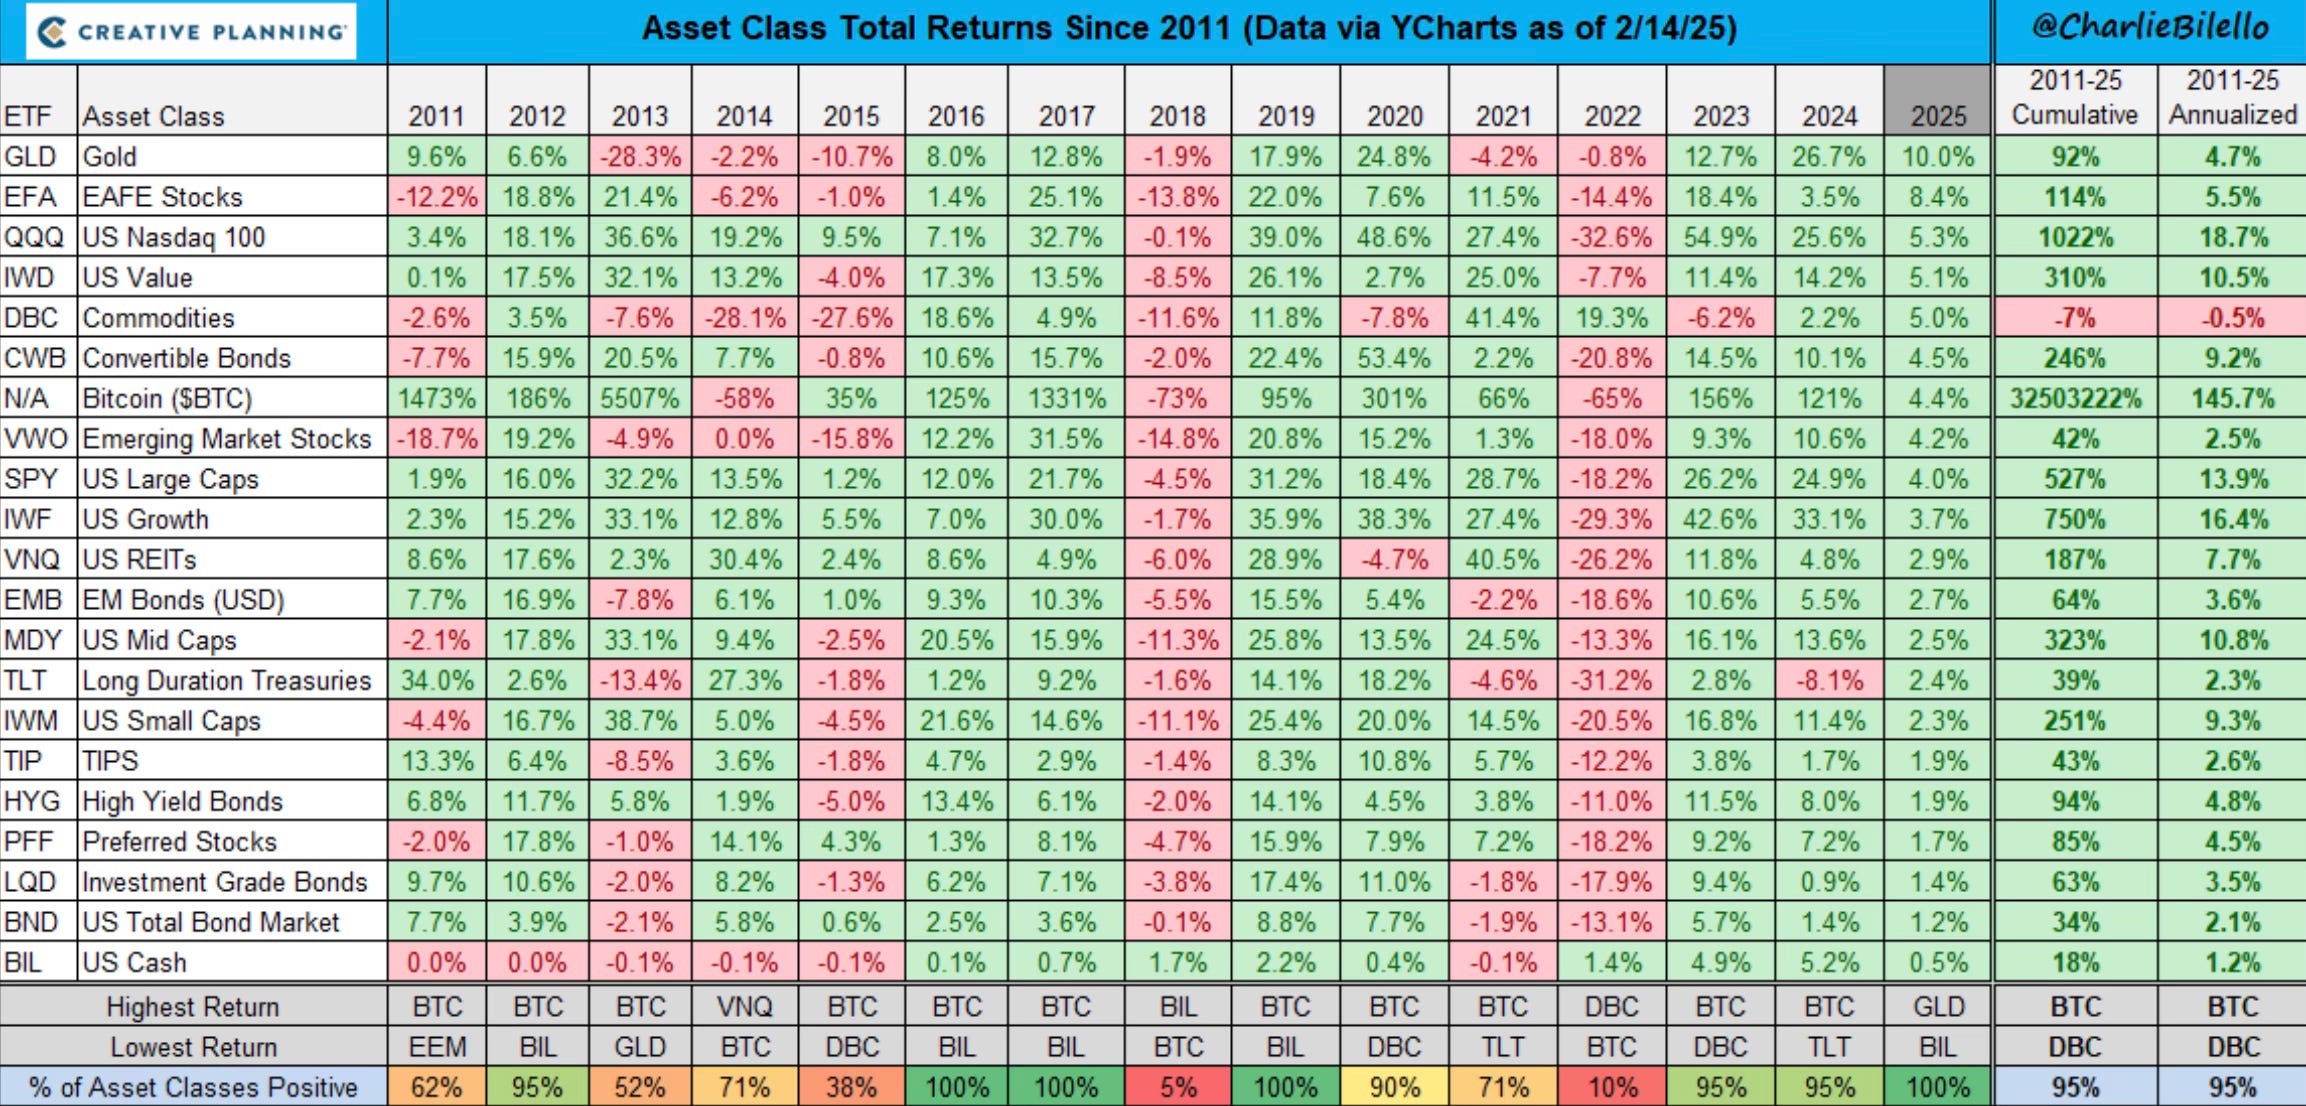
Then we have one of my favorite charts which shows the asset class returns since 2011 and where all the assets performance has been so far in 2025. As you can see in 2025 everything has been green YTD. We will see if that can continue all year.
It’s A Baby Bull Market
Nothing is more bullish than all-time highs. That’s what we saw again this week as the S&P 500 made its 2nd all-time high of 2025. It’s what happens during a bull market.
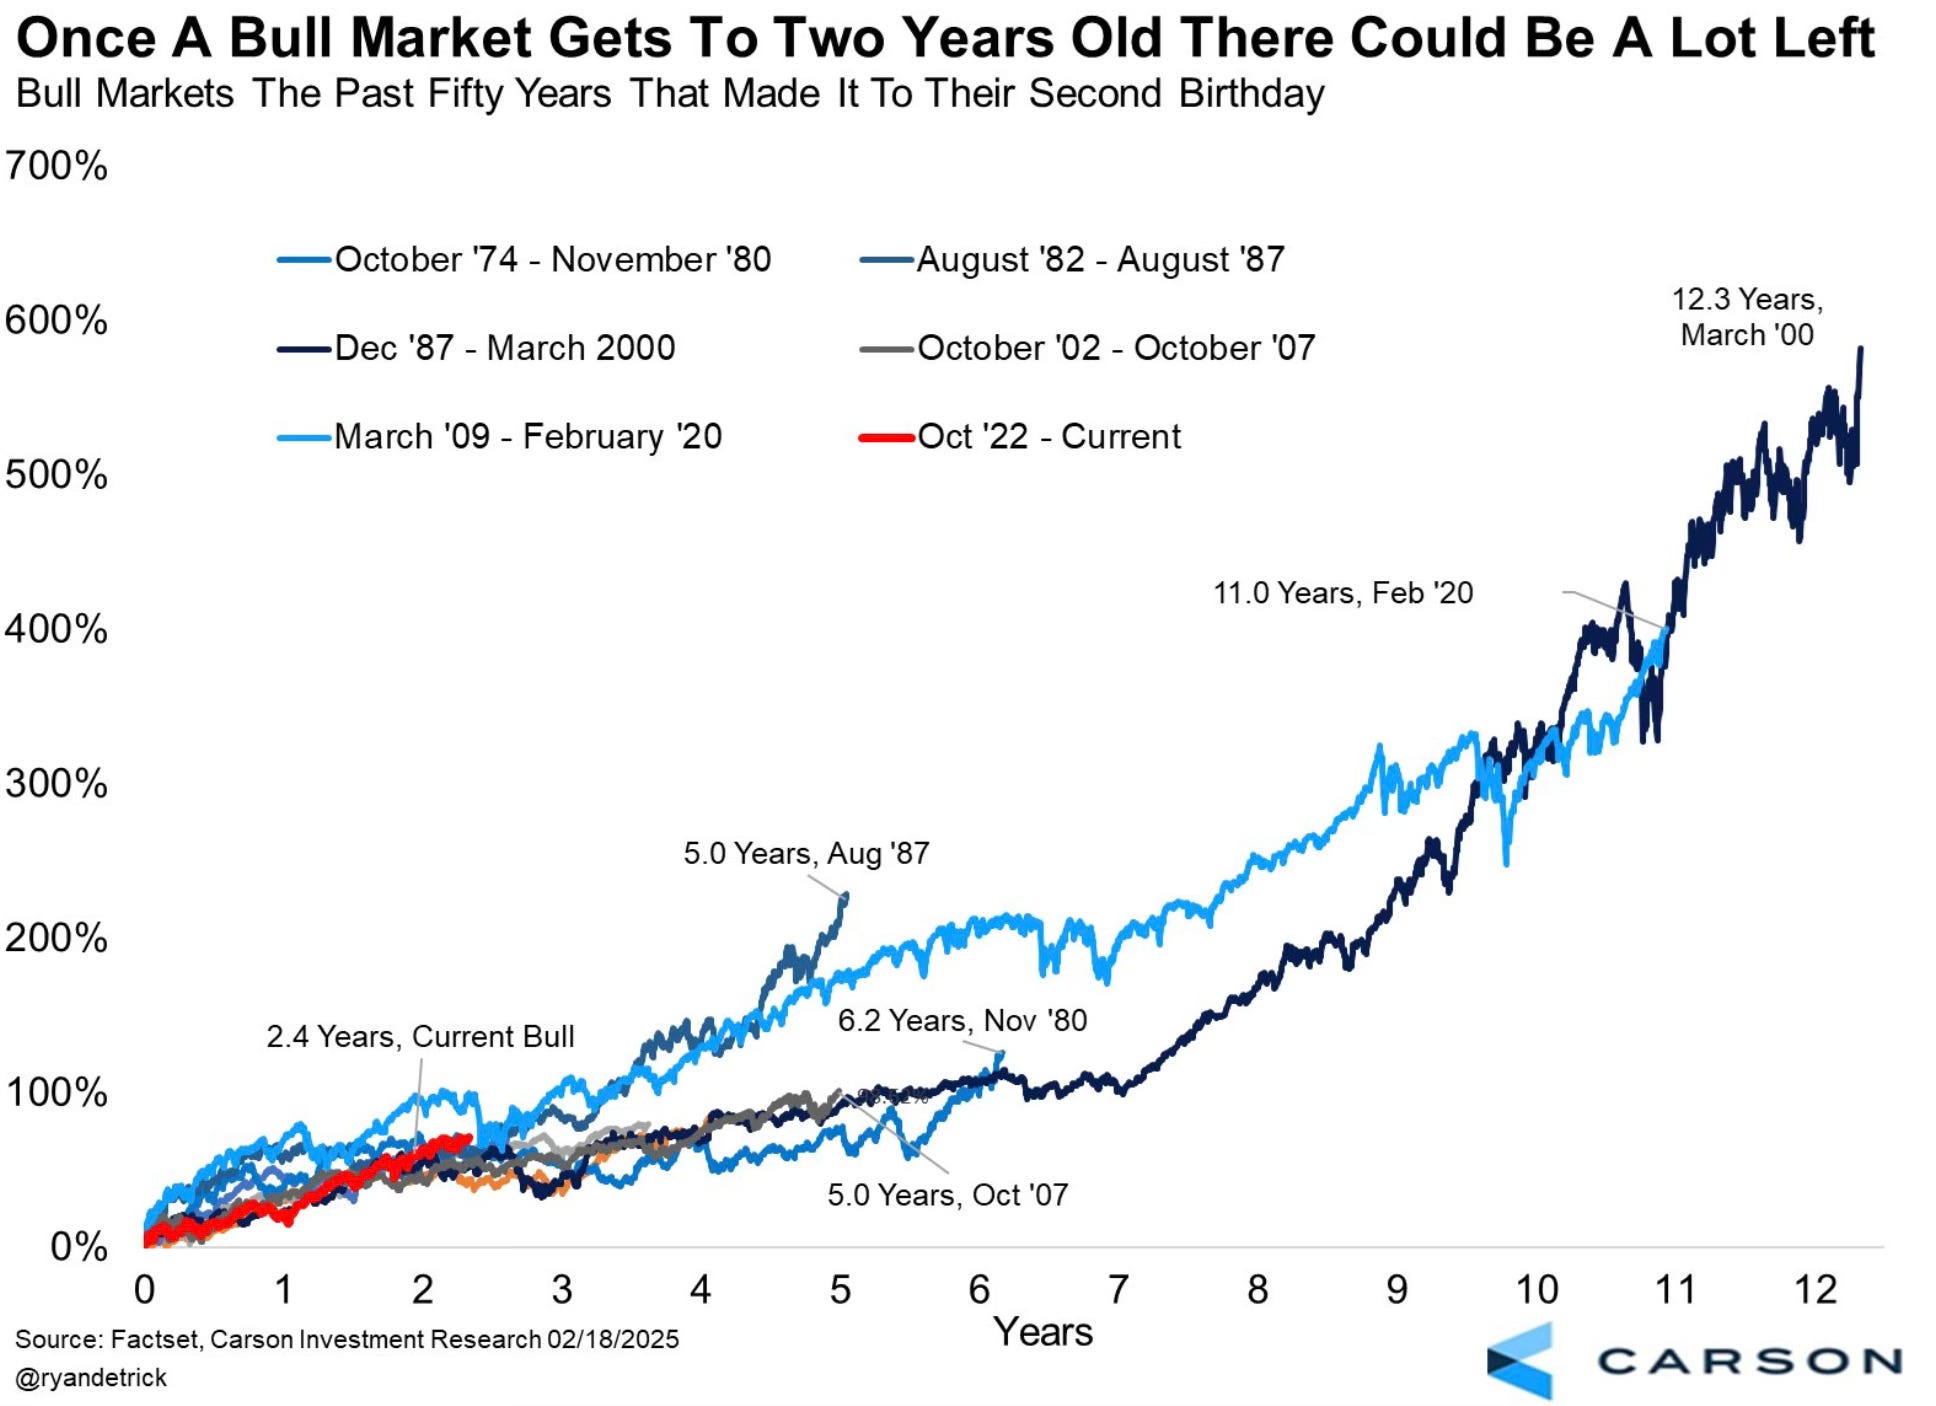
Let’s not forget just how young this bull market is. It’s really still just a baby.
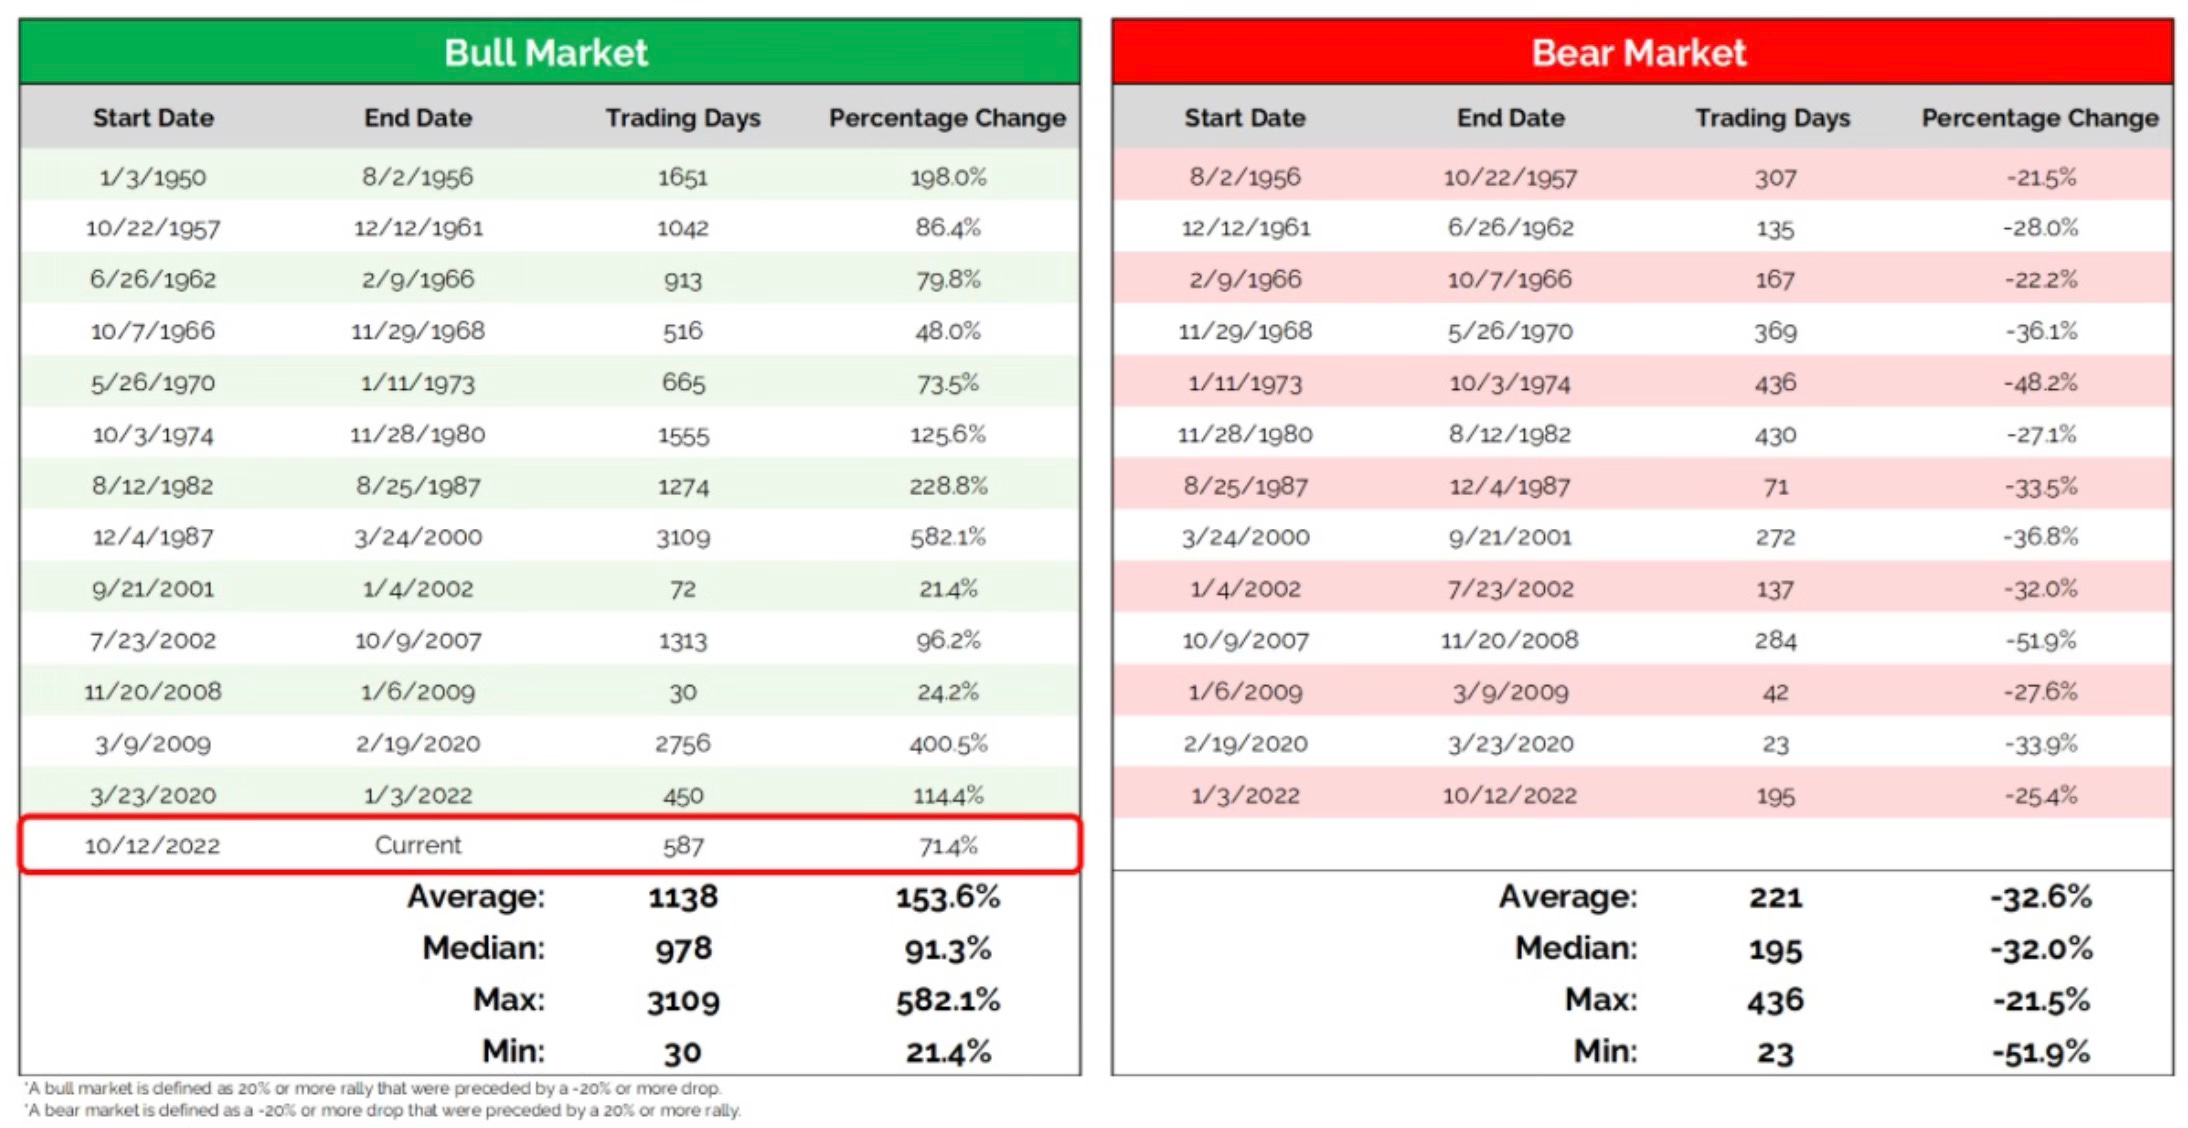
I liked this info and chart from Grant Hawkridge.
Over the last 587 trading days, this bull market has delivered a remarkable return of 71.4%. However, it’s important to note that the average bull market lasts around 1,138 trading days and typically achieves a return of 153%. Consequently, this bull market, while strong, is still below the average in terms of both duration and overall return.
Remember that once bull markets get into their 3rd year, there is a lot of runway ahead. Over the past 50 years, bull markets that reach the 3rd year, last an average of 8 years.