
Investing Update: 1st Half Recap & 2nd Half Outlook
What I'm buying, selling & watching
The holiday shortened week ended with a bang for the stock market heading into the 4th of July. The week saw the S&P 500 set its 5th, 6th and 7th all-time high of 2025.
The S&P 500 is now up 6.8%, the Nasdaq up 6.7% and the Dow up 5.4%. Now even the Russell 2000 has joined the party as it turned positive, up 1% on the year.
Market Recap

Weekly Heat Map Of Stocks

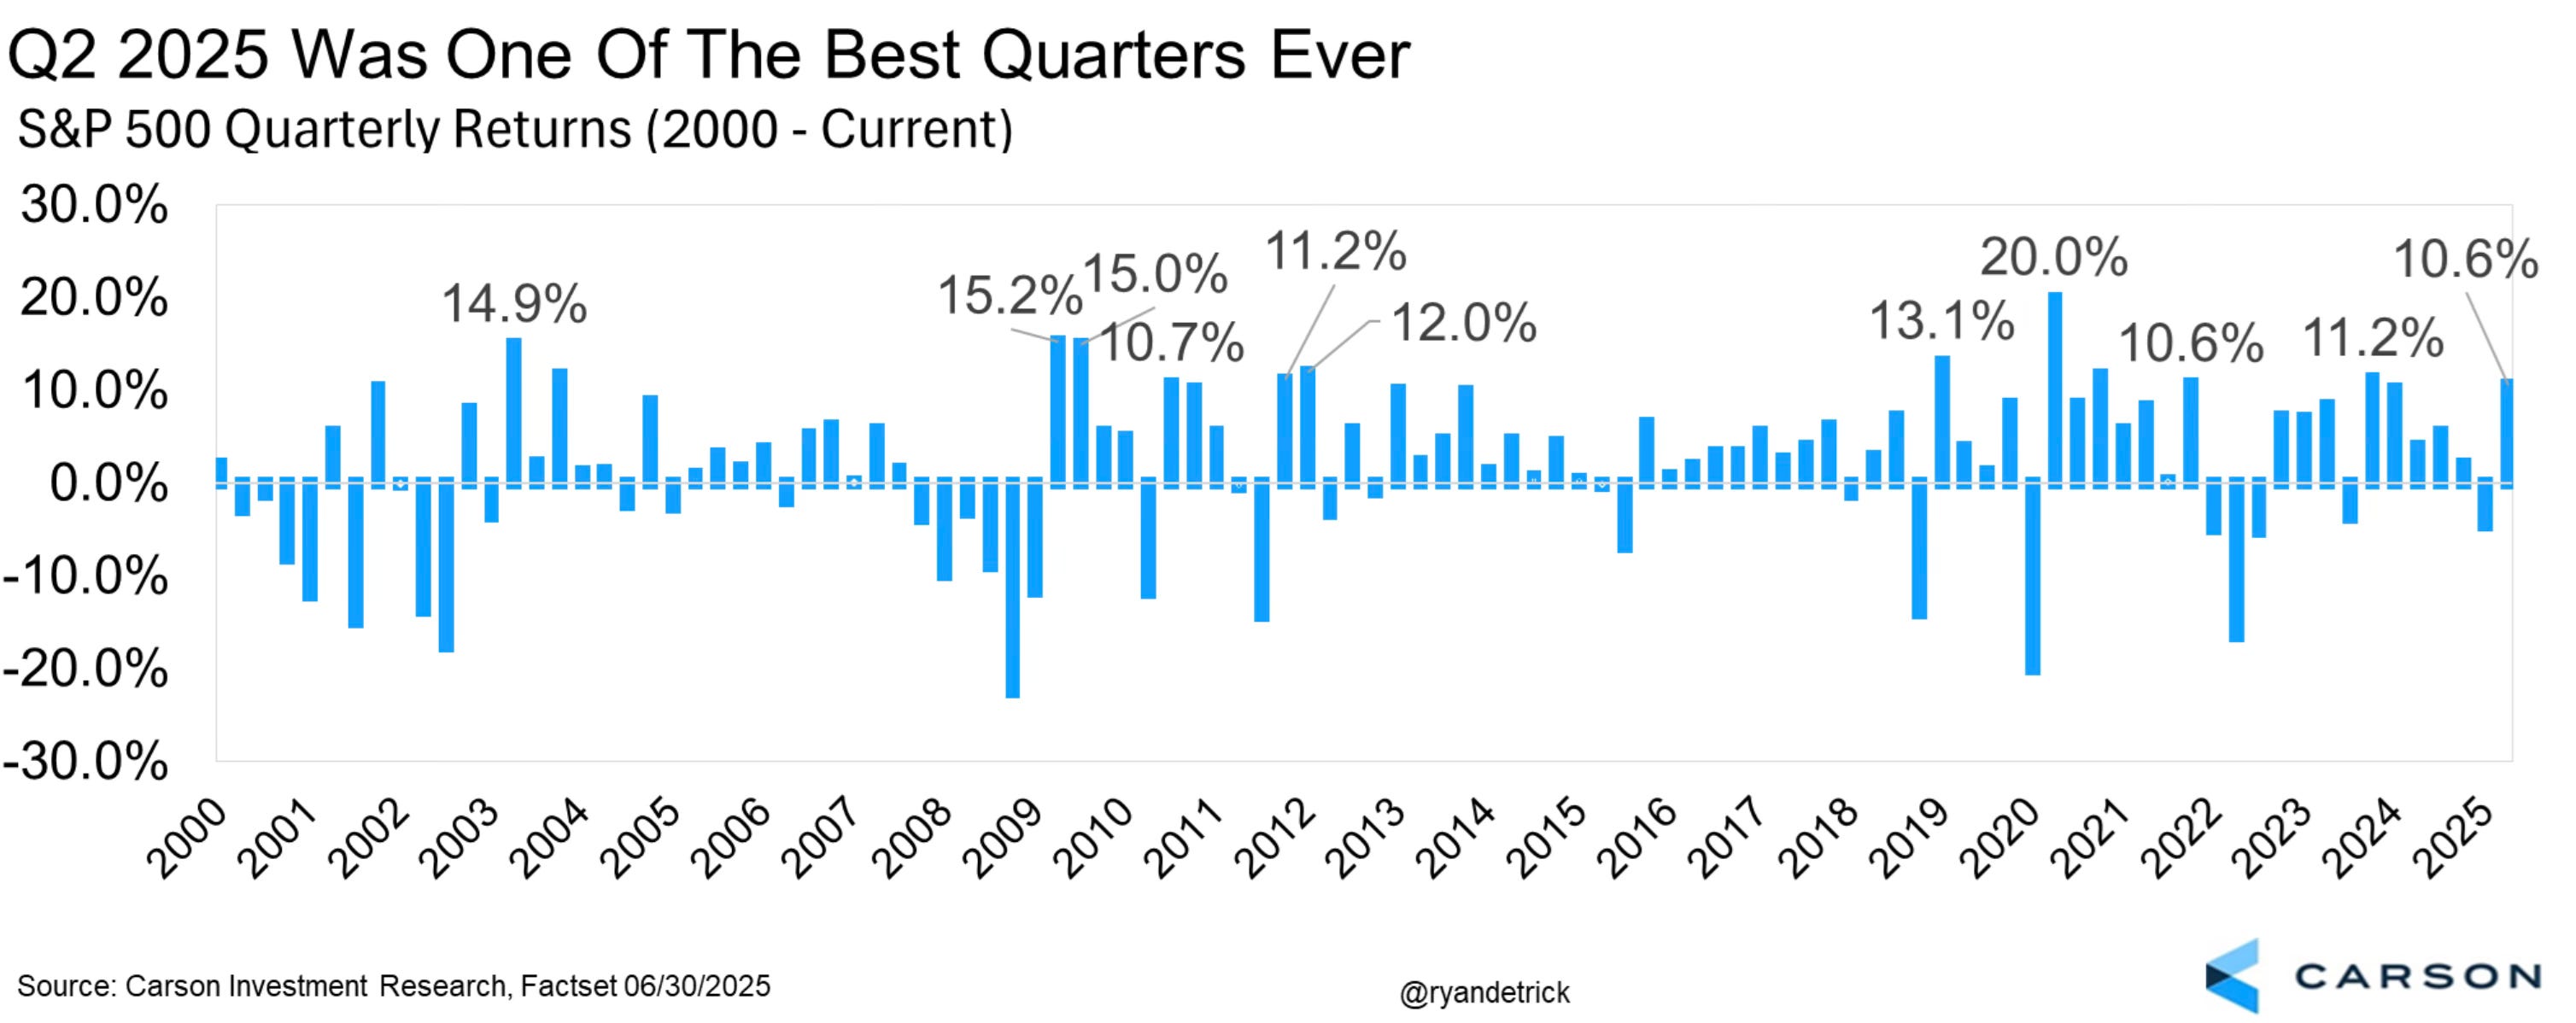
Q2 turned out to be one of the better quarters ever up 10.6%. That’s the best quarter since Q4 2023.
If you like green, you love July. Historically July has been the best performing month of the year. Try 10 straight positive years in July.
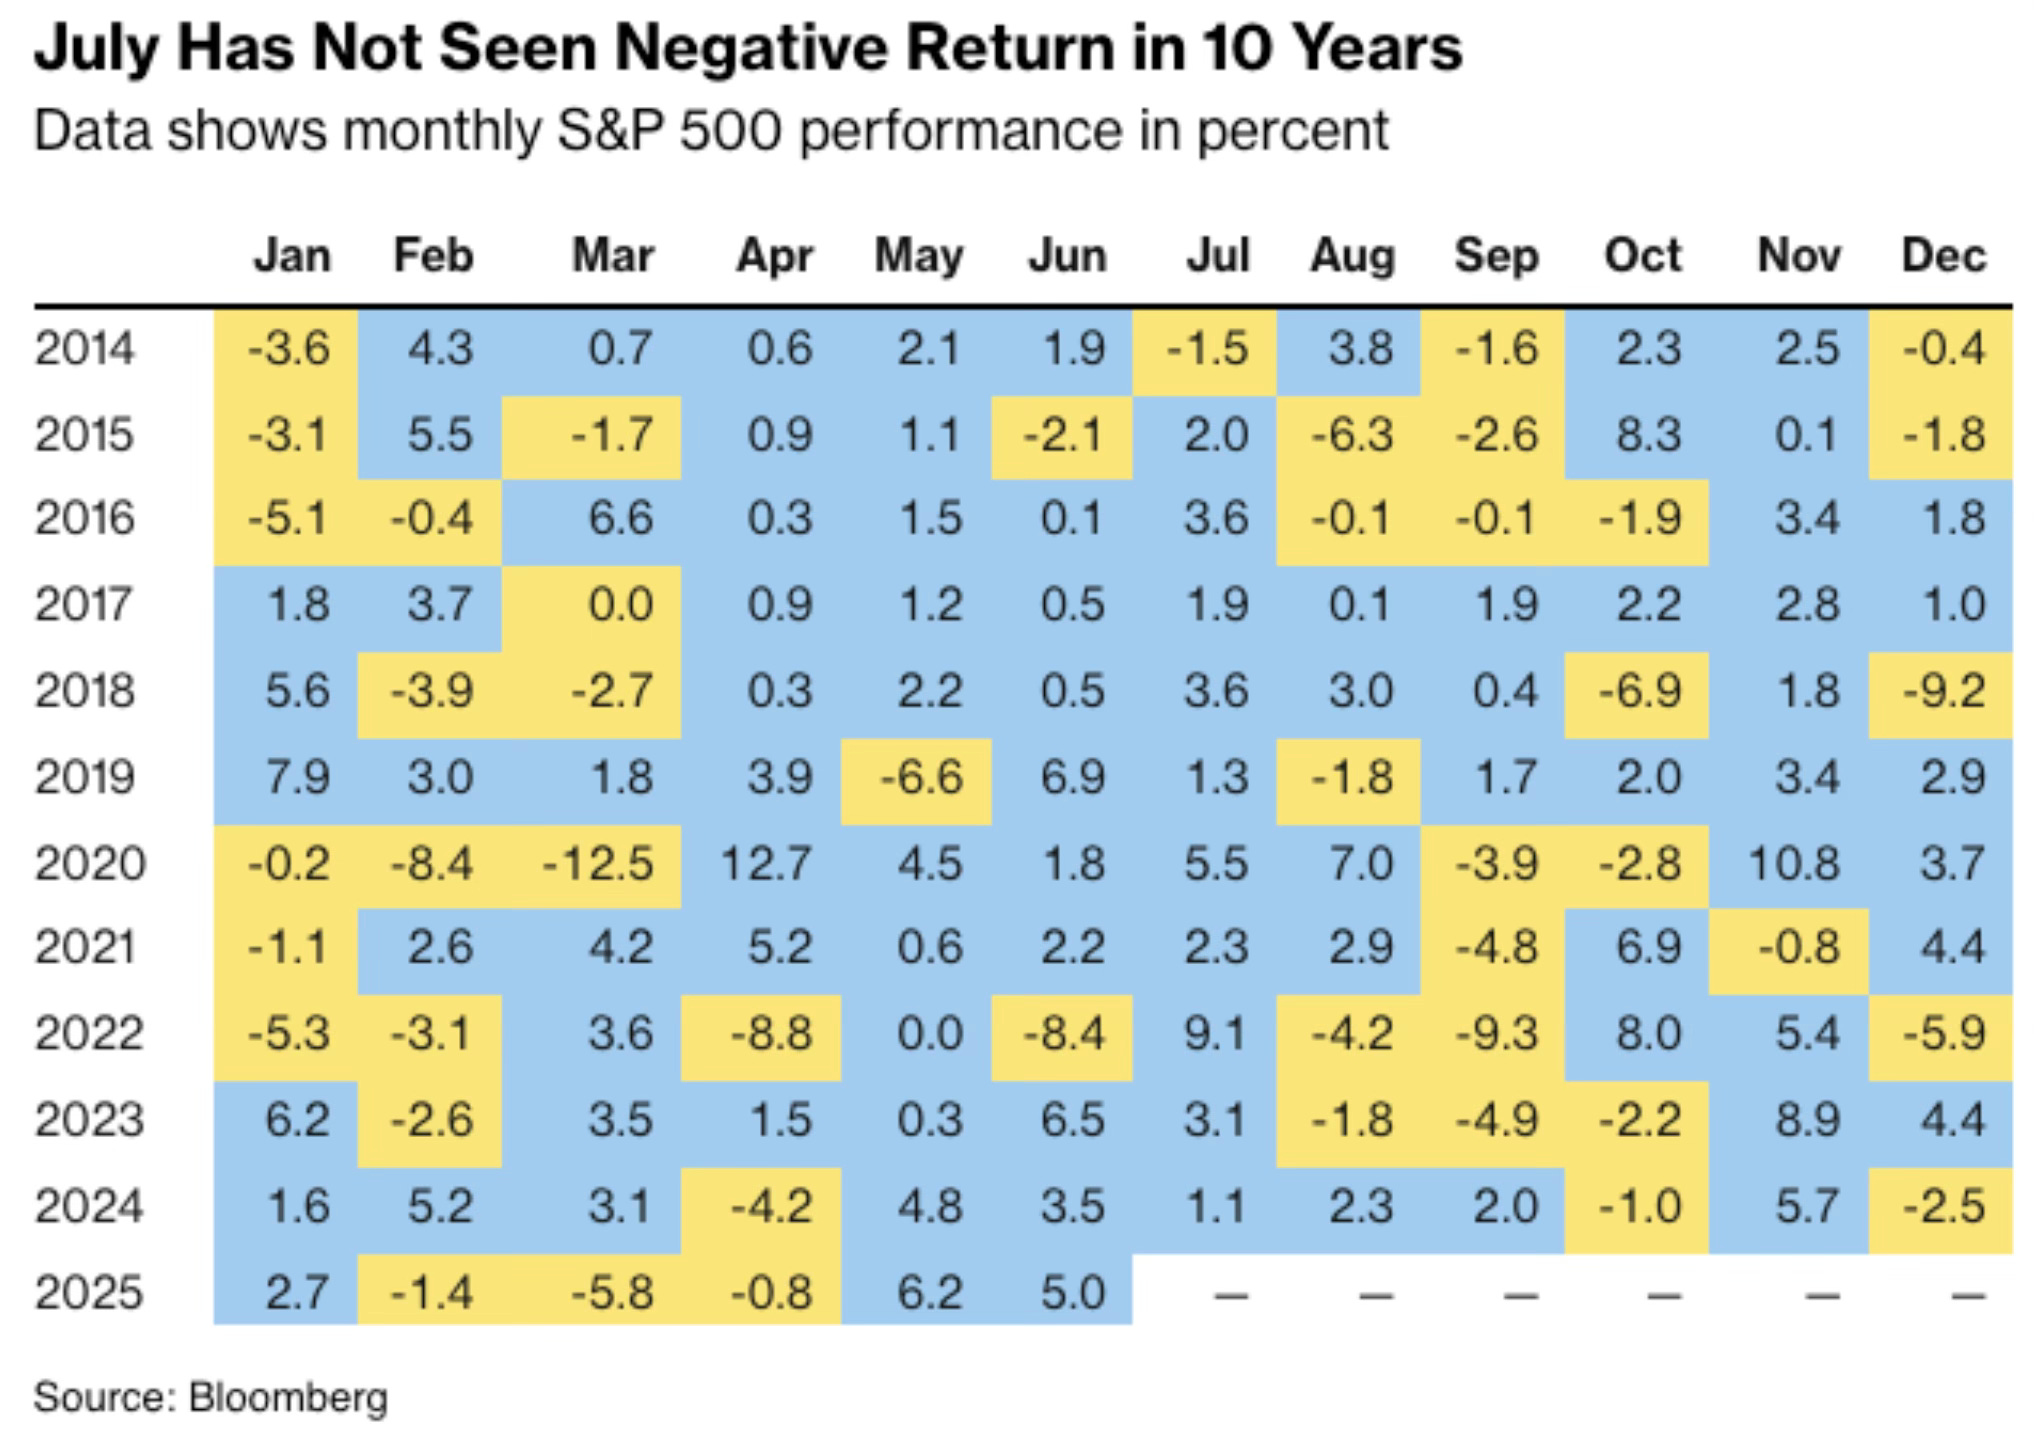
Expect July to continue that streak and make it 11 straight.
1st Half Recap
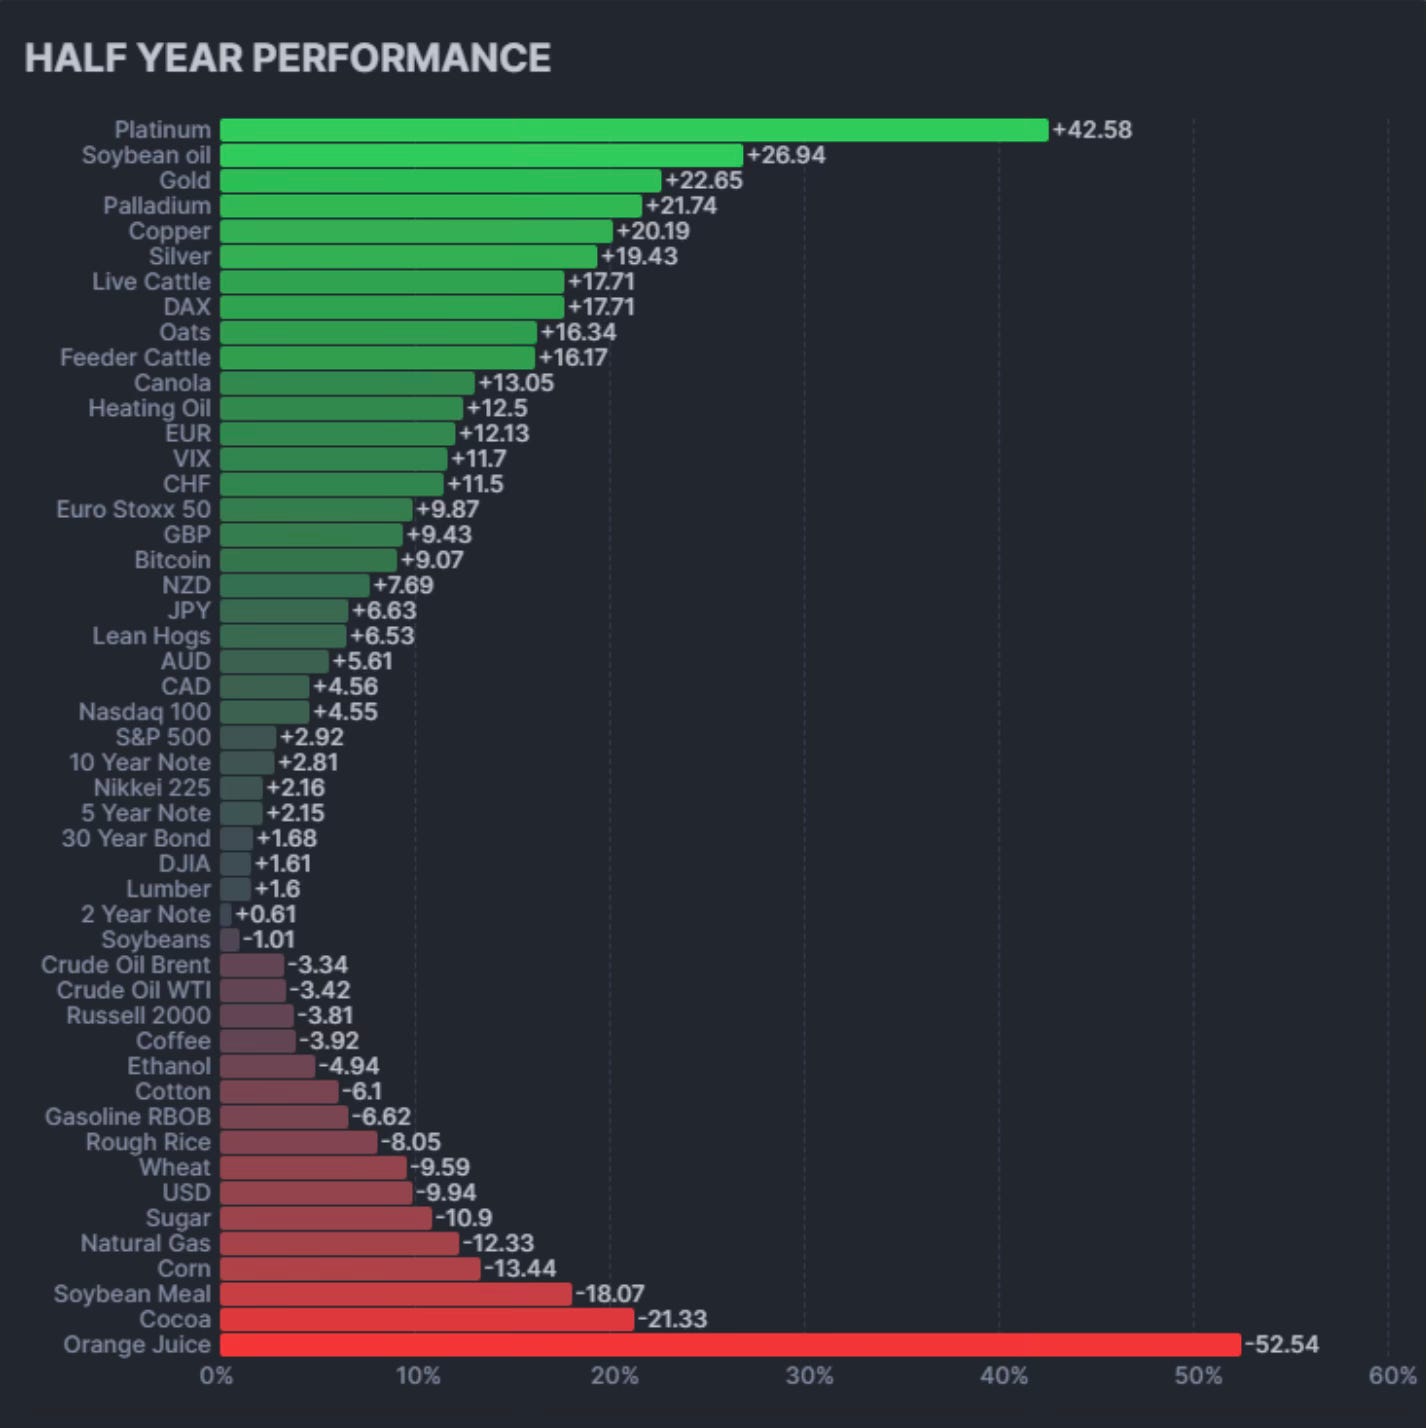
At the half way point of the year, platinum, soybean oil and gold lead the returns. Orange juice and cocoa have had a rough 2025.
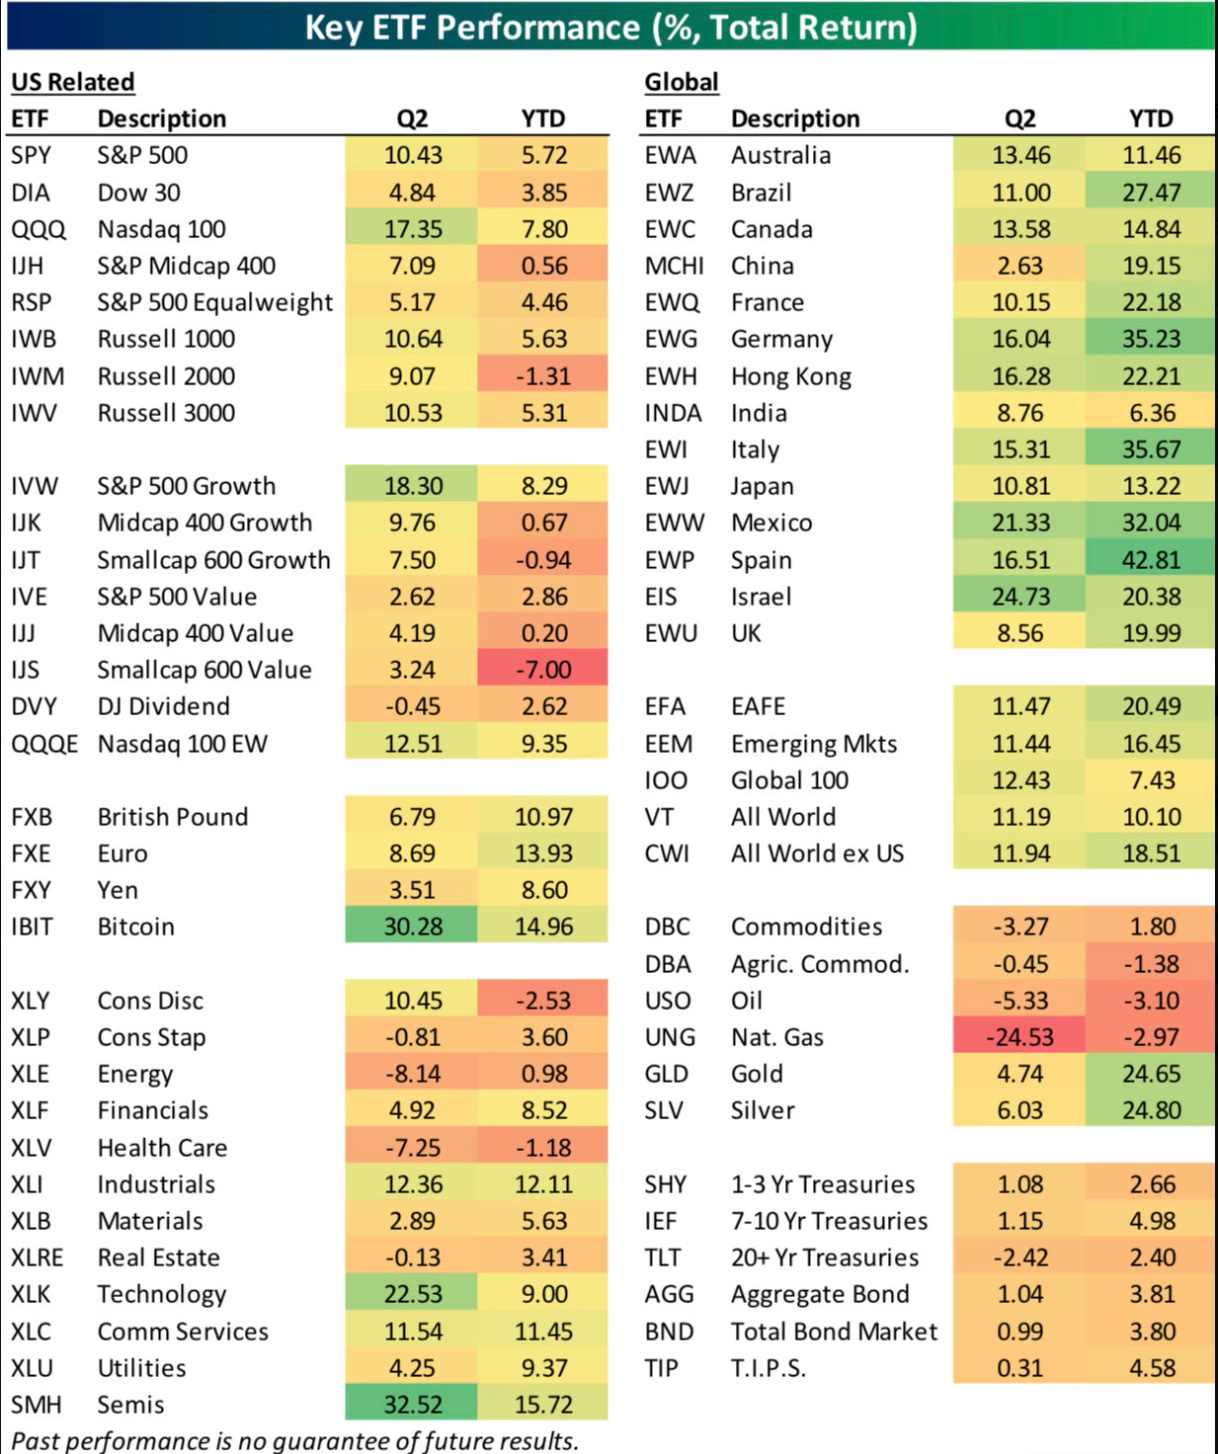
I love this chart from Bespoke which shows returns from all the key ETFs. Pay attention to how good global returns have been. It has been a long time since we’ve seen this much green across the globe. Emerging markets, gold, and silver are all part of the party in 2025. Very little is in the red at the midway point.
This shows from a sector standpoint how bad things were earlier this year. The drawdowns across all sectors were pretty brutal. Now with the market at all-time highs, returns across almost all sectors have turned around. Did you know that industrials are the leader YTD? 6 of the 11 sectors are outperforming the S&P 500.

This is a great chart from Grant Hawkridge. It shows all the Dow stocks sorted by return. Then pay attention to all the other data he added. Just a great chart with all the info on the 30 Dow stocks.
I bet you didn’t know that IBM is the Dow leader in 2025. UnitedHealth is by far the worst. The most surprising is that the 3rd worst performer is Apple. Does that continue?

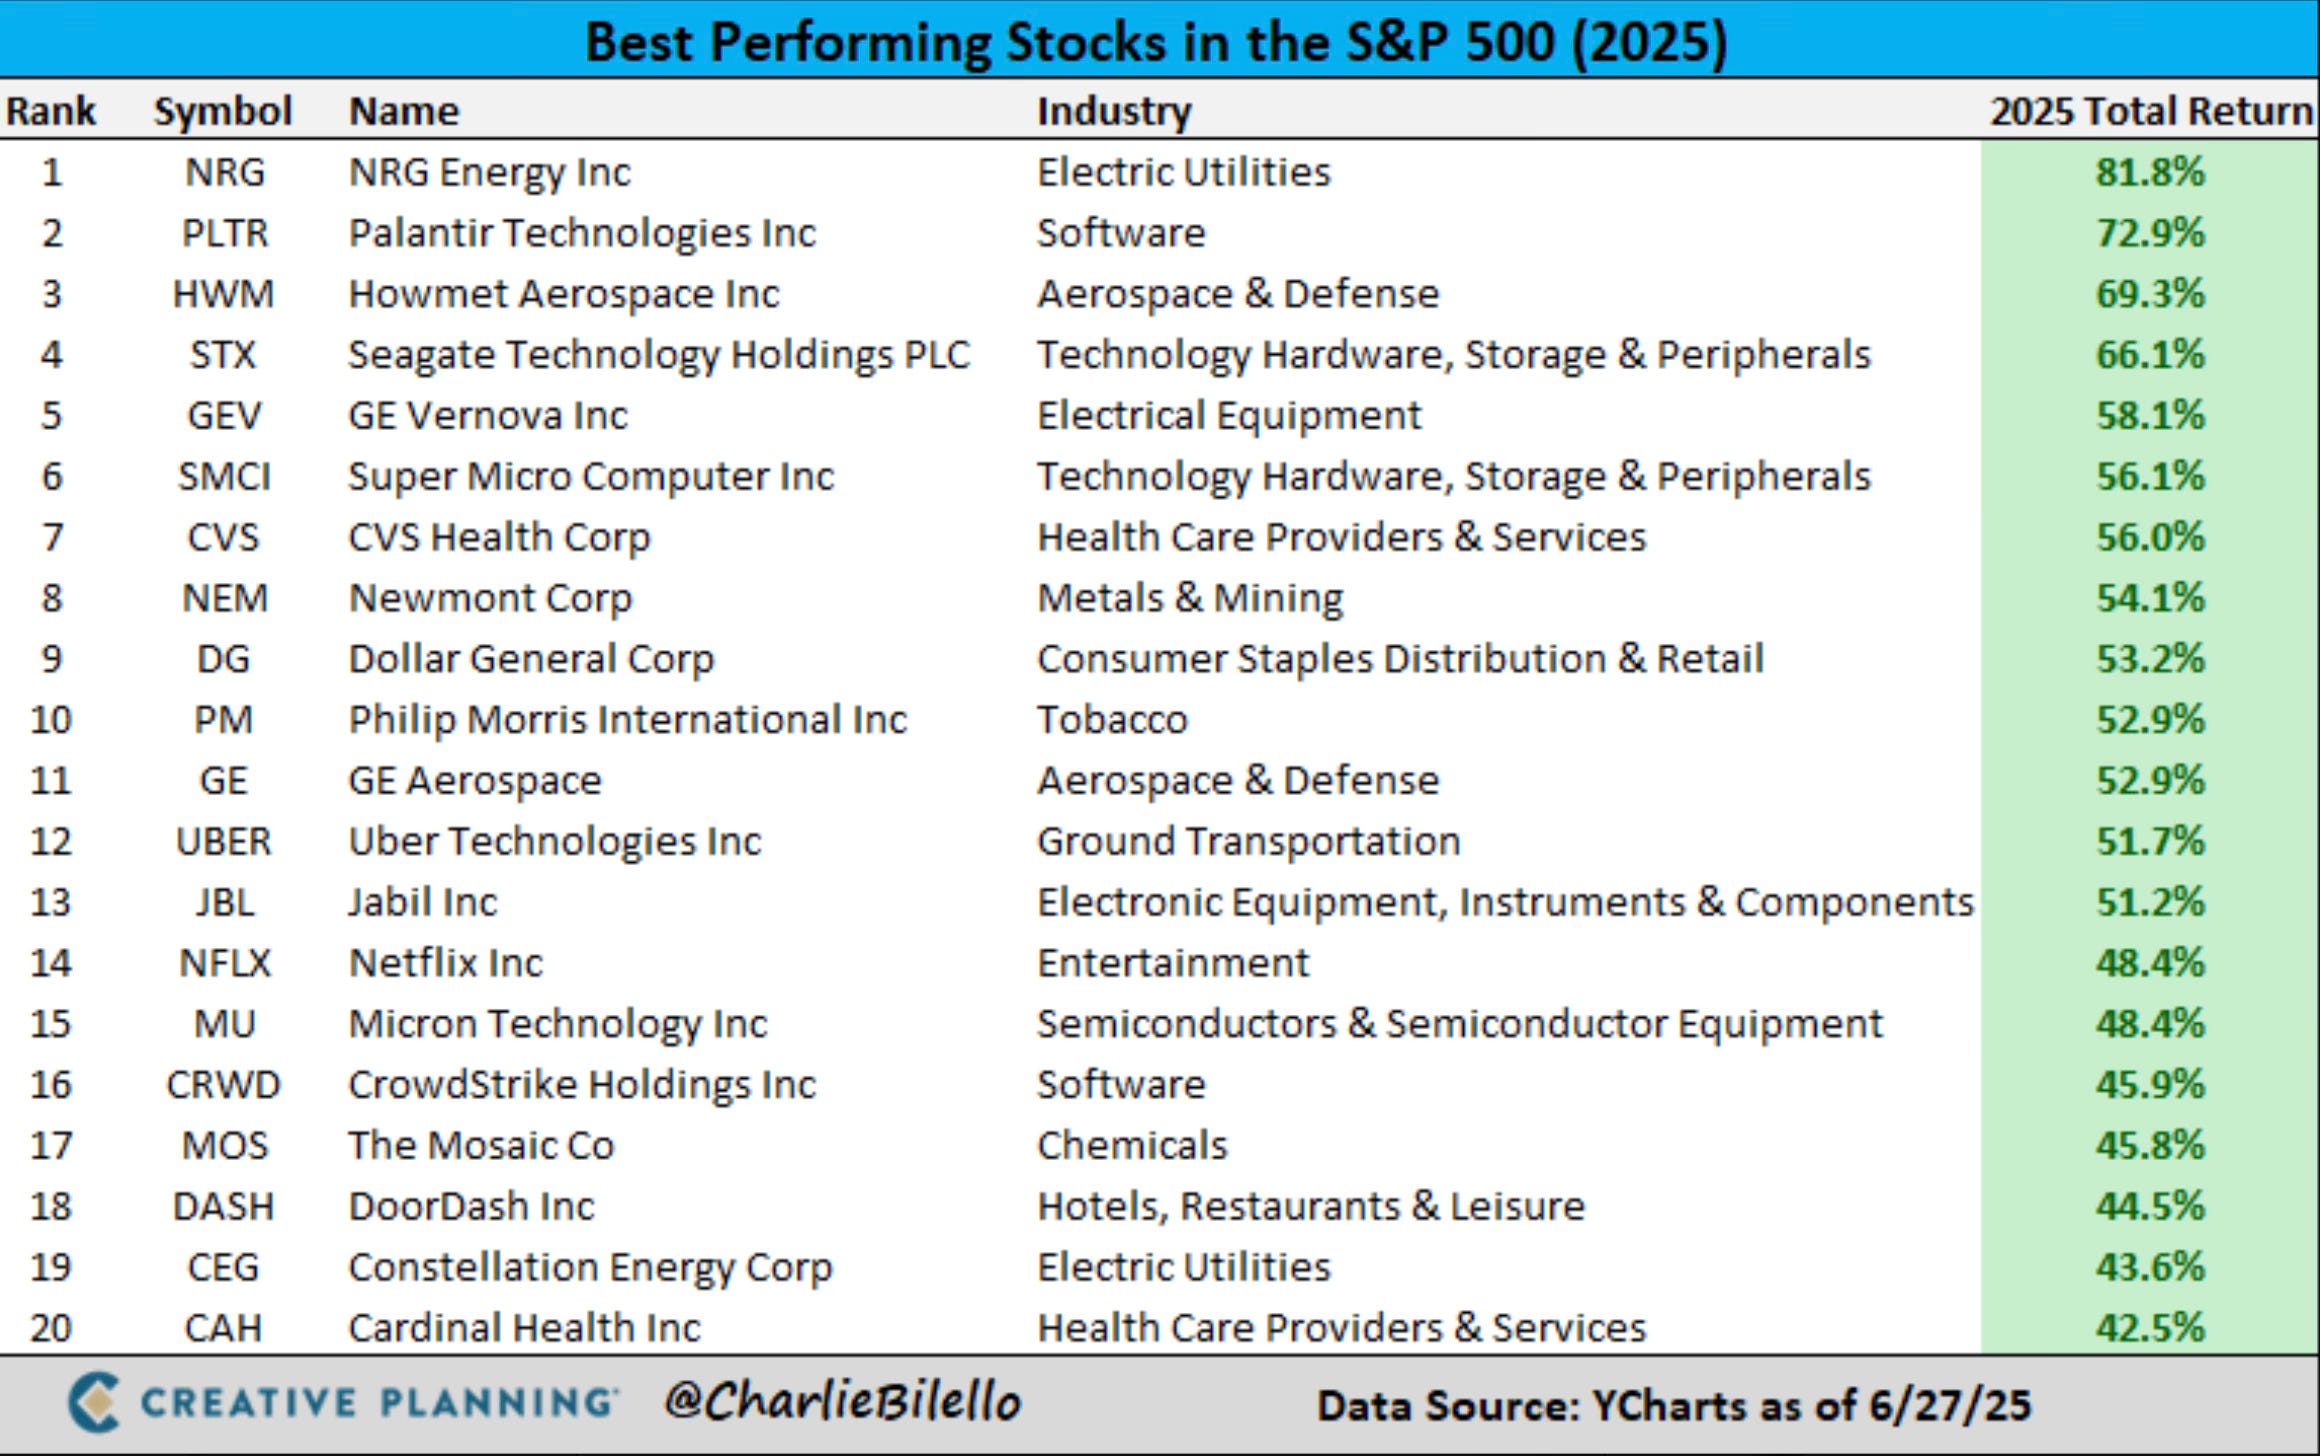
Here are the top S&P 500 stocks. Palantir had the lead for most of the first half until NRG Energy recently took the lead up 81.8%. Two of my largest holdings Uber 12th and CrowdStrike 16th both appear in the top 20.
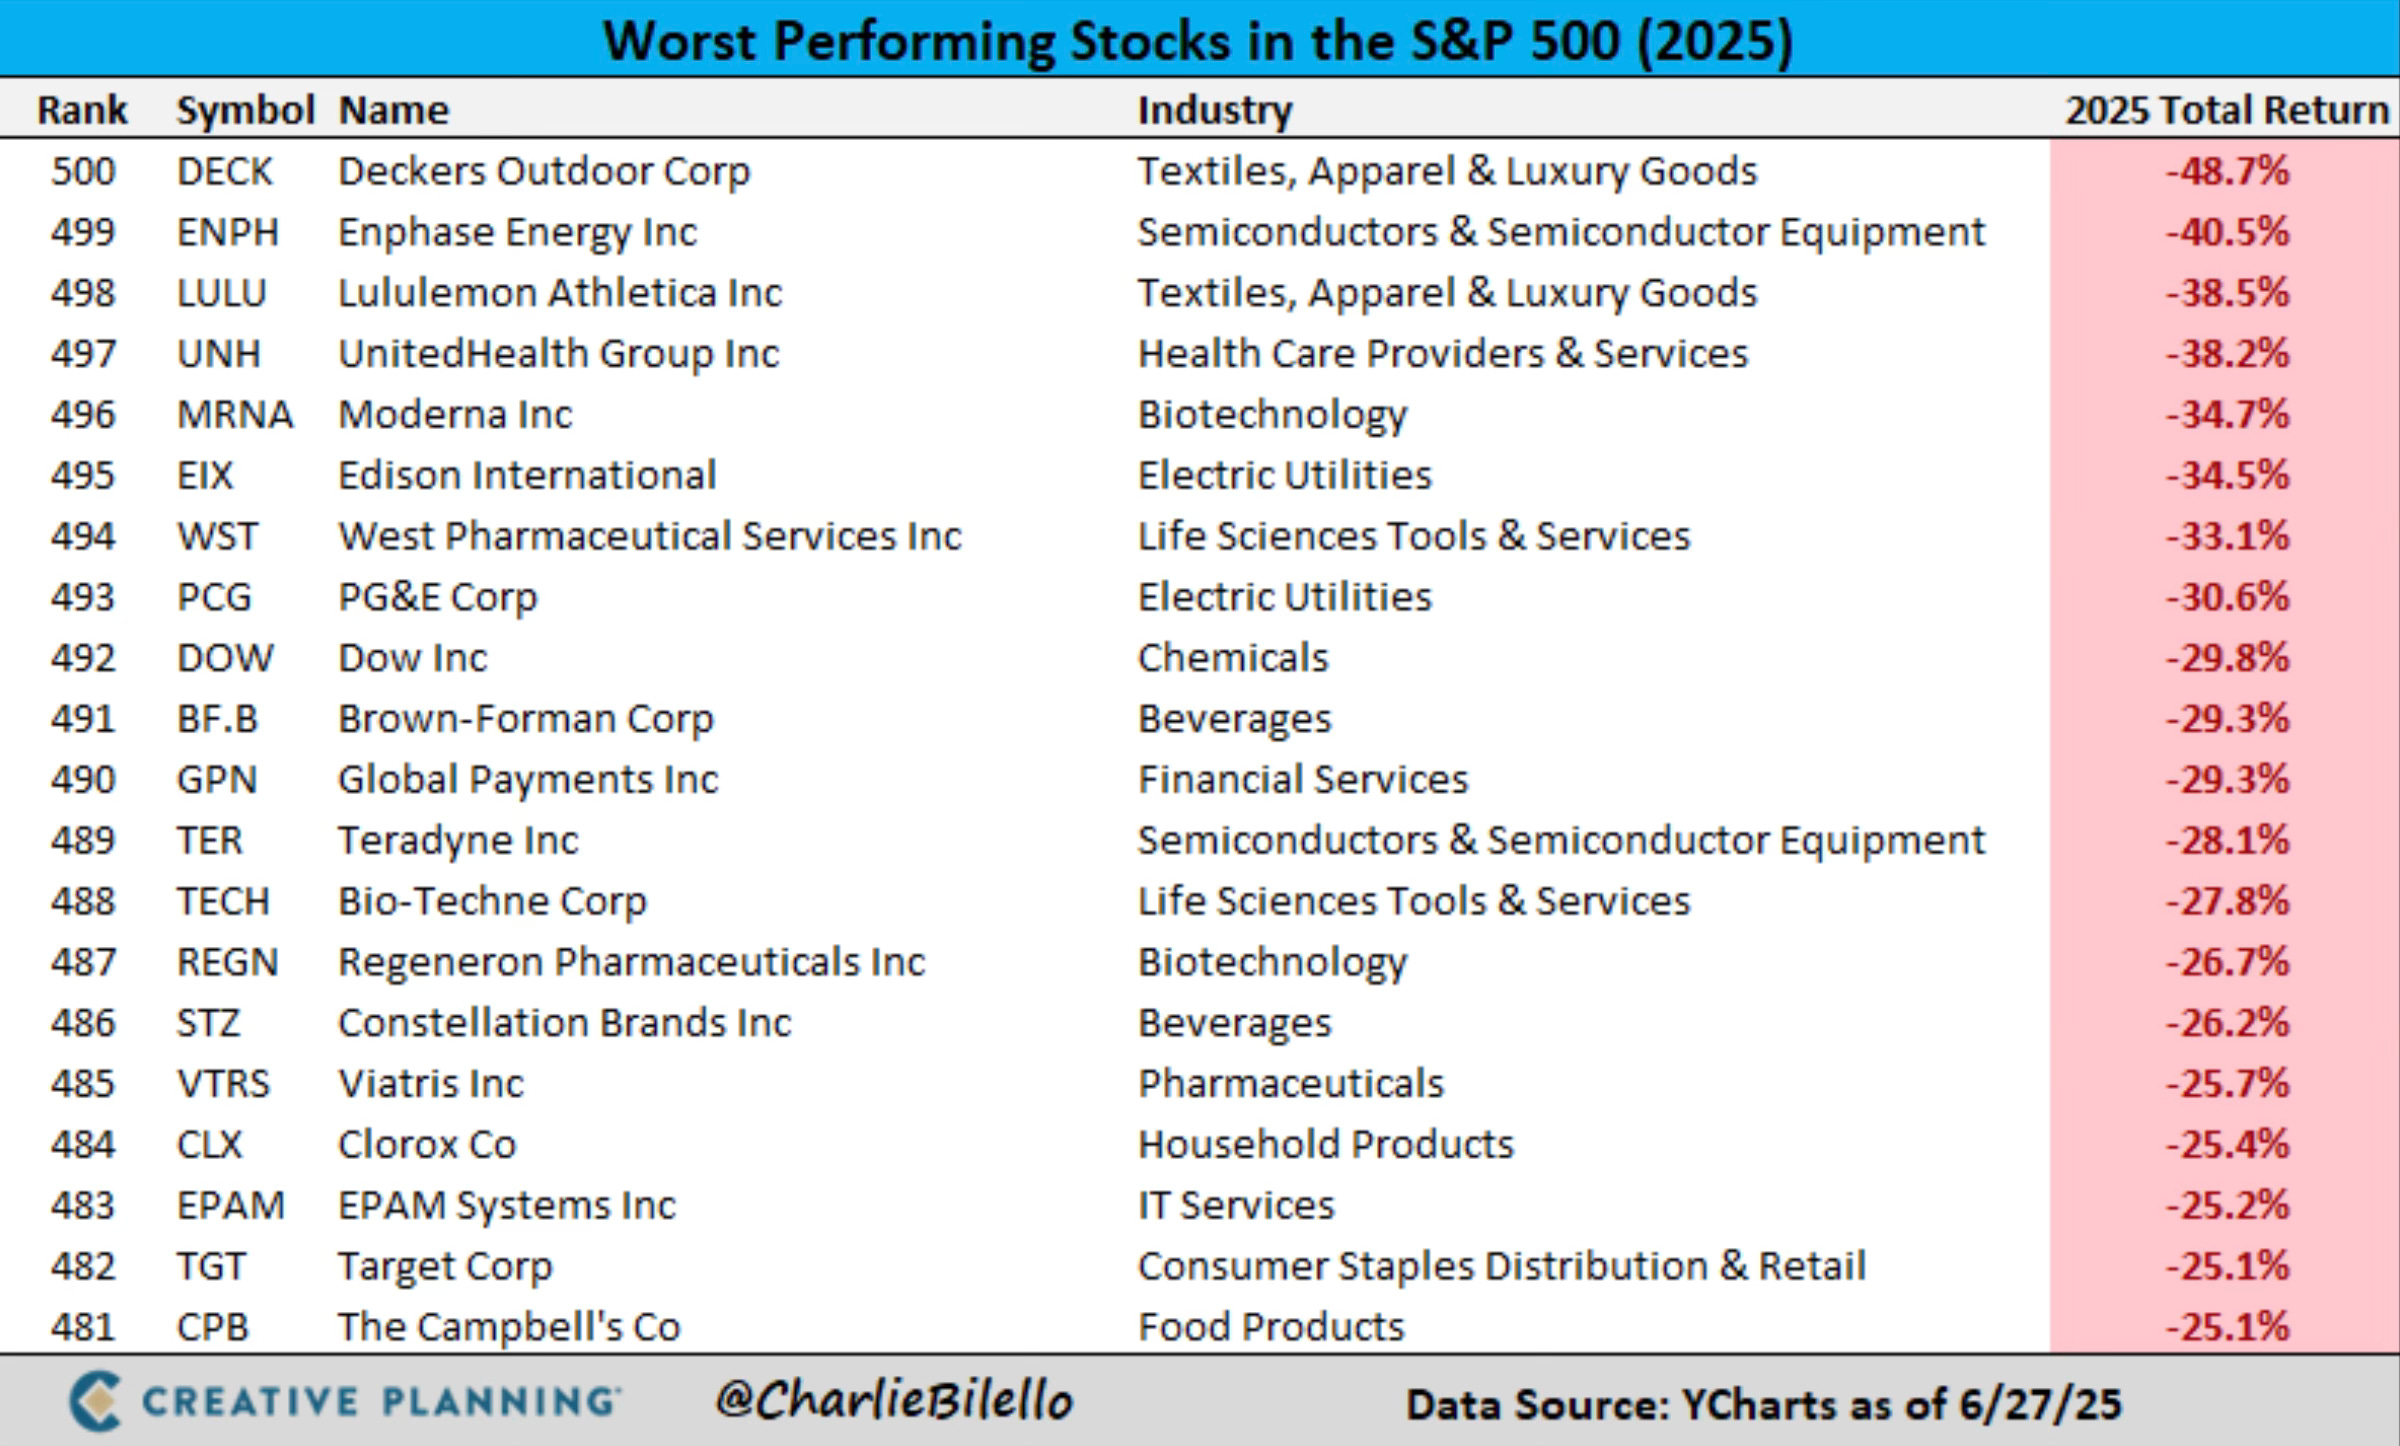
Here are the worst S&P 500 stocks. Deckers is the worst performer. Lululemon which isn’t far behind has been in a brutal downward spiral. Not long ago it was consistently among the best S&P 500 performers.
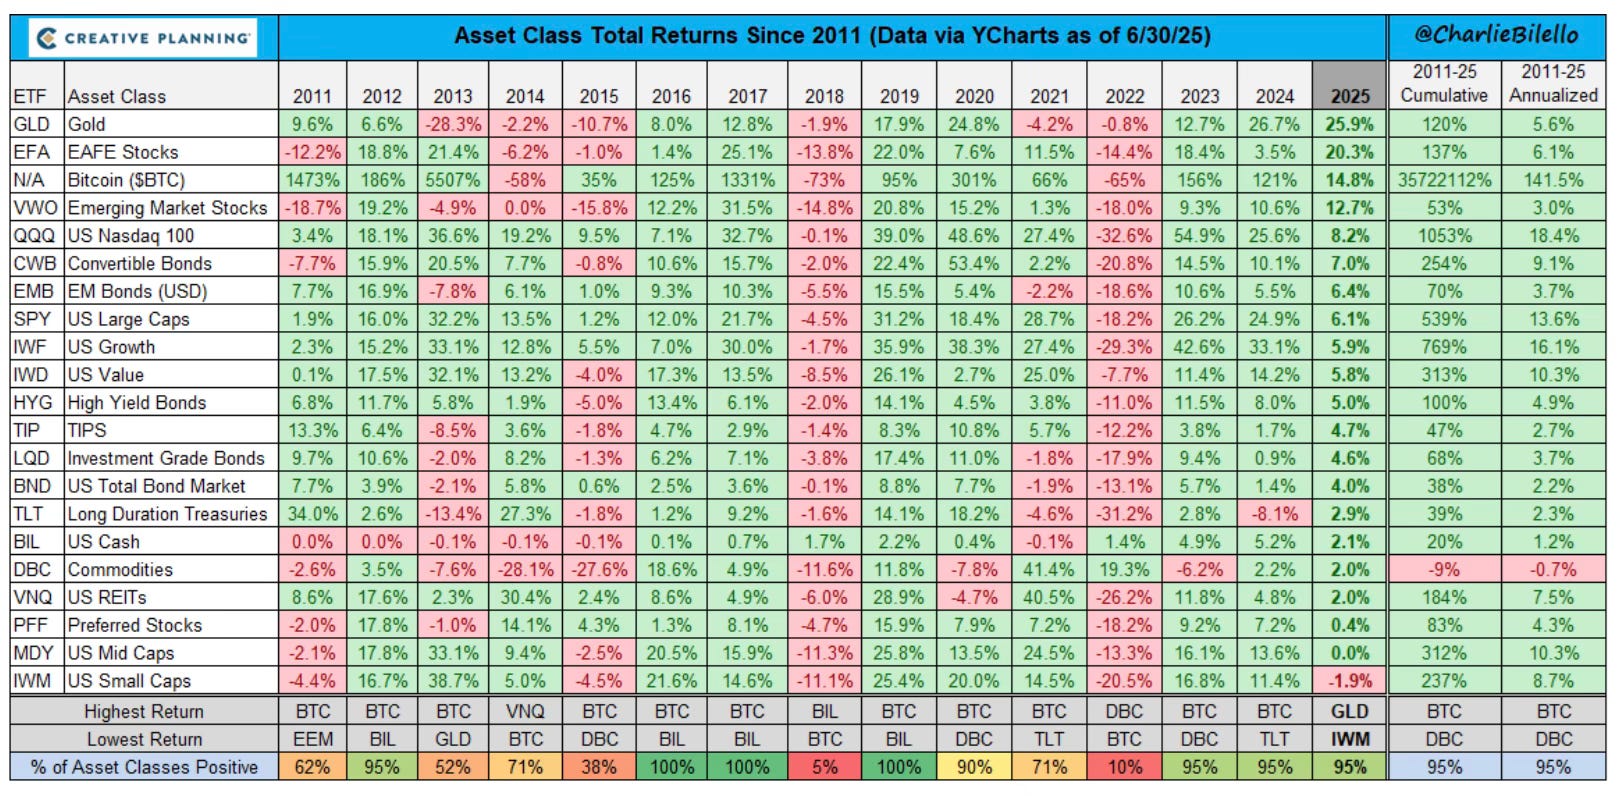
Last is my favorite chart from Charlie Bilello. The asset class returns for YTD in 2025 and all the way back to 2011. I love to look at this chart. Everything is green in 2025 except small-caps. Soon I believe we will finally see them go green and join the party like I said last week.
My 1st Half Performance
As the 2nd quarter concludes, I wanted to look at where my portfolio is at, as well as my three stock picks for 2025 versus the major indices.
Dow: 5.4%
S&P 500: 6.8%
Nasdaq: 6.7%
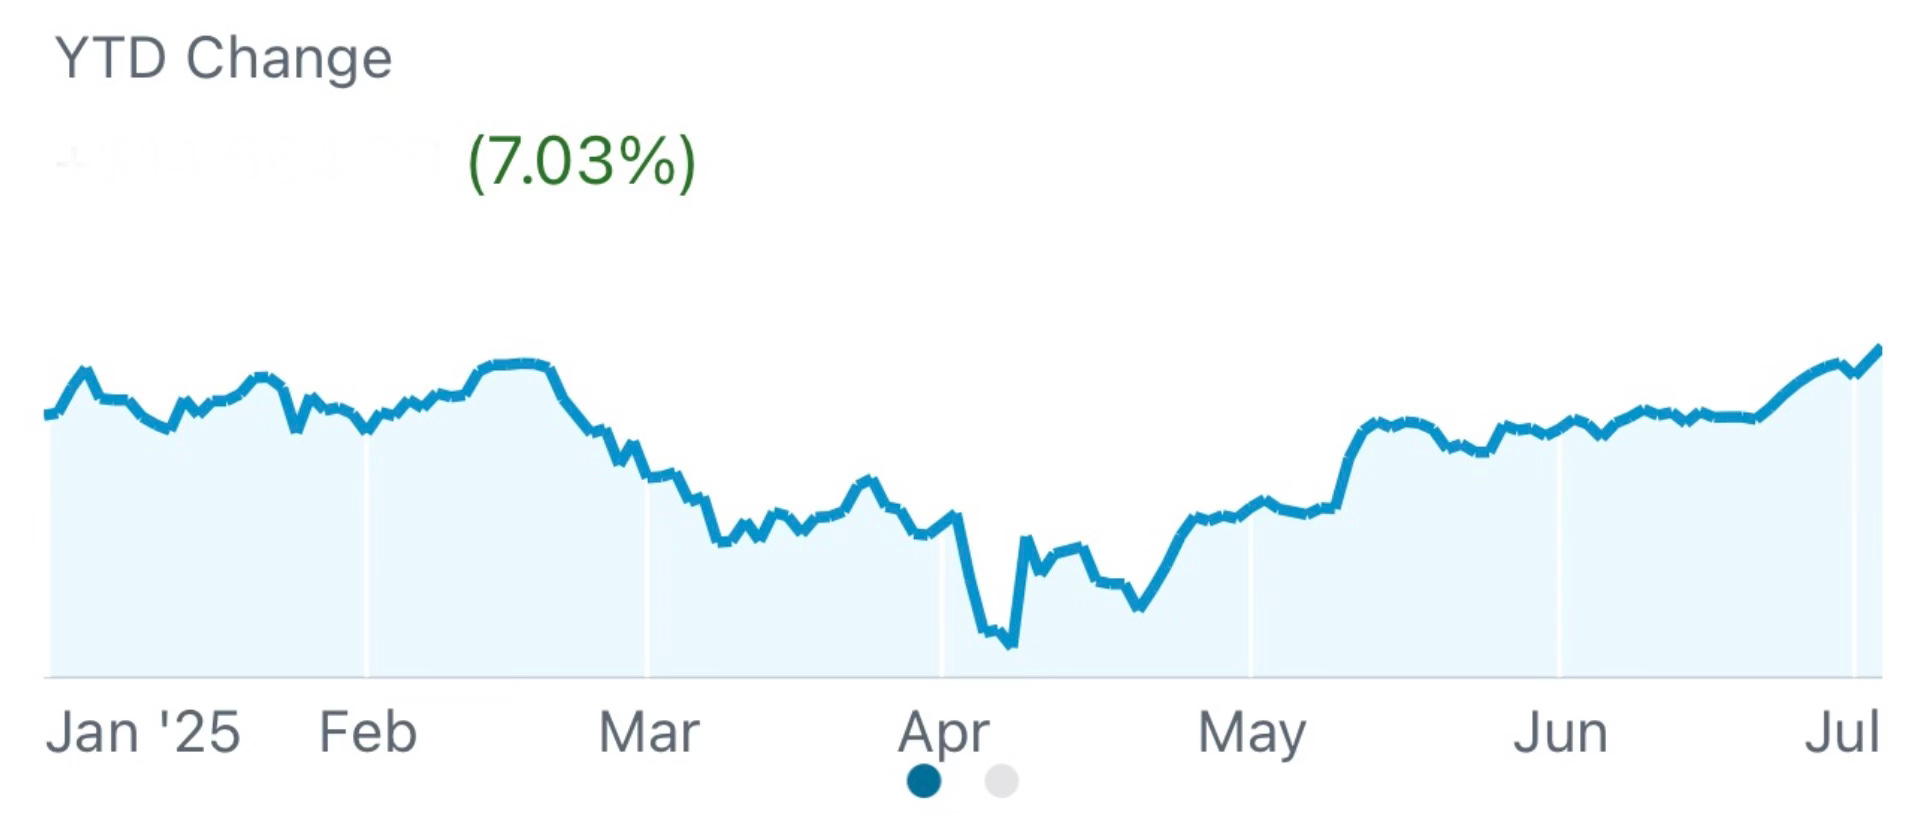
My Portfolio (Actively Managed): 7.03%
I’m trying to make this the 7th out of 9 years that I have outperformed the S&P 500.
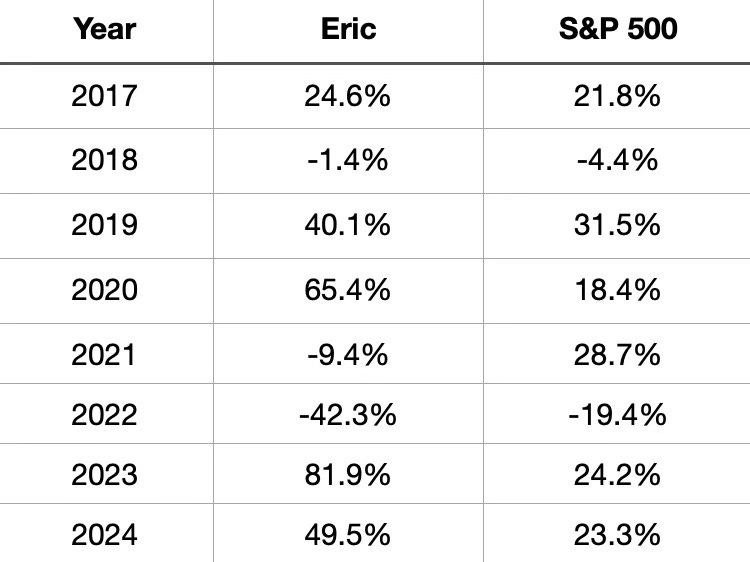
Now let’s take a look at where My 3 Stocks For 2025 are faring, as well as how my year-end forecast that I gave in January is doing Investing Update: 2024 Recap & 2025 Outlook.