
It’s hard to spend five minutes around the market right now without hearing the same thing.
“It’s just like 1999.”
“AI is the new internet.”
“This will end like the dot-com crash.”
“At some point, this bubble will burst.”
Maybe.
But what if it doesn’t?
Or maybe a better question is this. What if the market doesn’t have to crash from here?
That doesn’t mean stocks can’t go down. They can. It doesn’t mean there aren’t speculative areas of the market. There are. And it definitely doesn’t mean every company connected to AI is worth buying at any price.
But somewhere along the way, “this looks like 1999” became “we know exactly what happens next.”
I’m not so sure. There are certainly similarities between today and the late 1990s. But there are also significant differences. And those differences matter more than people think.
The comparison everyone is making
The AI boom is naturally being compared to the internet boom. Honestly, that comparison makes sense. The internet was a transformational technology. It changed how we communicate, shop, work, and live. AI could do the same thing.
But here’s where the comparison usually takes a turn. People start by saying AI is like the internet. Then somehow that becomes, the internet ended in the dot-com crash.
Except that’s not really what happened.
The bubble ended. The internet didn’t.
Amazon survived. Google was born shortly before the peak and went public after the crash. E-commerce kept growing. Cloud computing came later. Social media came later. Smartphones came later. The technology behind the boom ultimately became even bigger than investors imagined.
The problem wasn’t believing the internet would change the world. The problem was what investors were willing to pay for some of the companies supposedly leading the change.
That’s an important distinction. Because today we’re looking at a similar question. Is AI transformational? I think most people would say yes. The bigger question is whether investors have gotten so far ahead of reality that the market has to come crashing back down.
Let’s look a little closer.
Start with the simplest measure
The P/E ratio. Price divided by earnings. Now vs then.
During the dot-com peak, investors were willing to pay dramatically higher multiples for stocks than they are today.
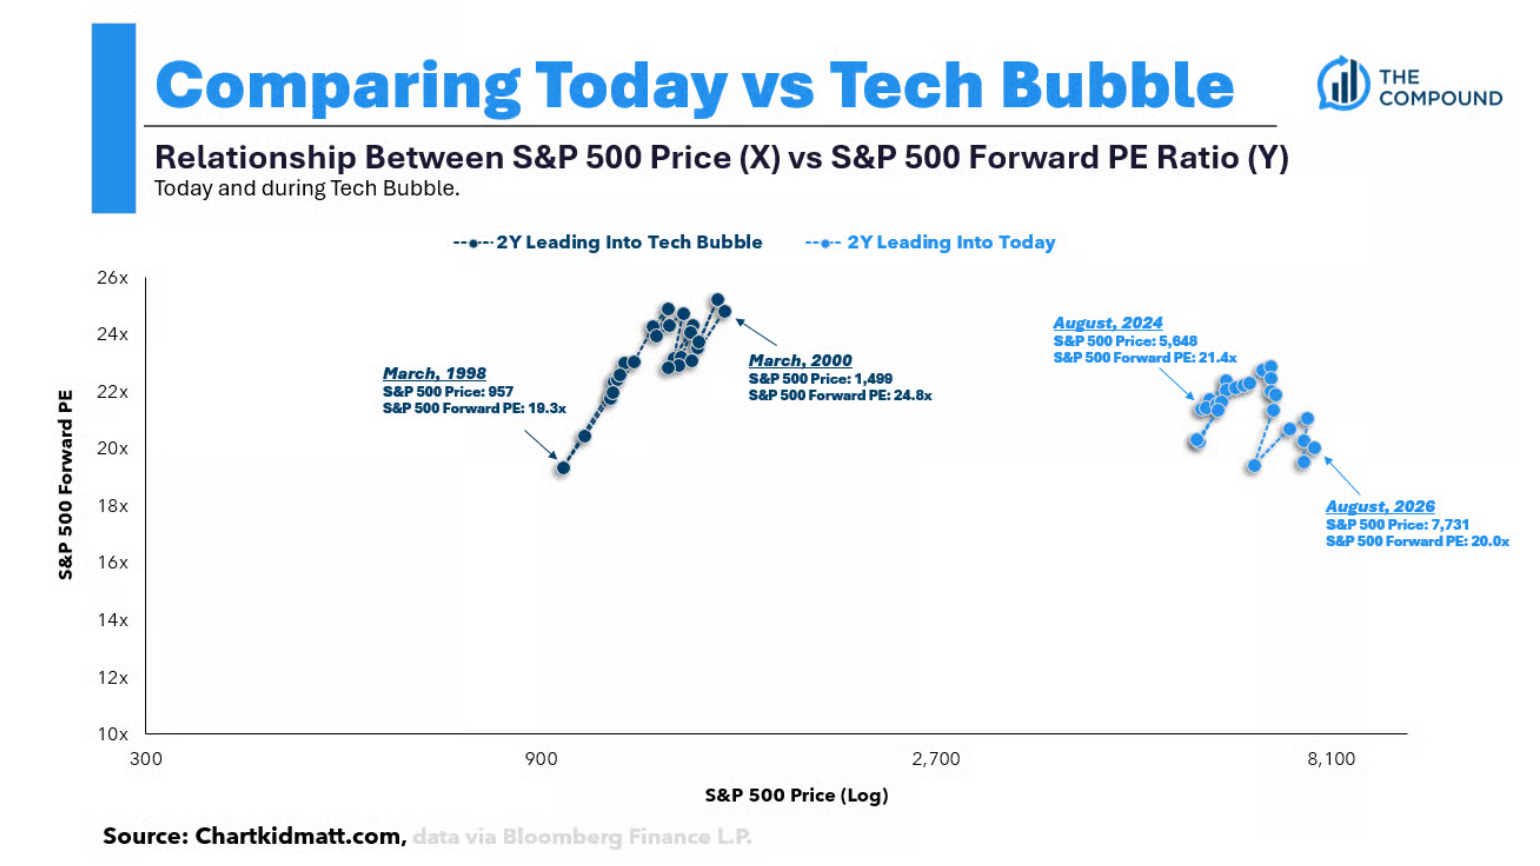
Look at what’s happening in each of these two windows. Into the March 2000 top, the S&P’s price and its forward P/E were rising together. Investors were paying more and more for the same dollar of expected earnings. That’s what a multiple expanding into a blow-off looks like.
Into today, the S&P’s price is up sharply too. But the forward P/E has actually come down over the same stretch. Investors are paying less for next year’s earnings, not more. Same direction on price. Opposite direction on what people are willing to pay for it.
As Matt Cerminaro put it:
“Investors were paying more for the earnings that were expected in 2000. Today they’re paying less.”
Same setup. Opposite behavior.
That distinction has been buried under a mountain of “it’s just like 1999” takes, and I think it deserves more attention than it’s getting.
I wrote about this exact question back in June, in Why This Isn’t Like The Dotcom Bubble. The numbers have moved since then. The conclusion hasn’t.
Zoom out to a full 30-year view and the same story holds. Tech’s forward P/E is essentially in line with the S&P 500’s today. In 2000, tech traded at roughly double the market’s multiple.
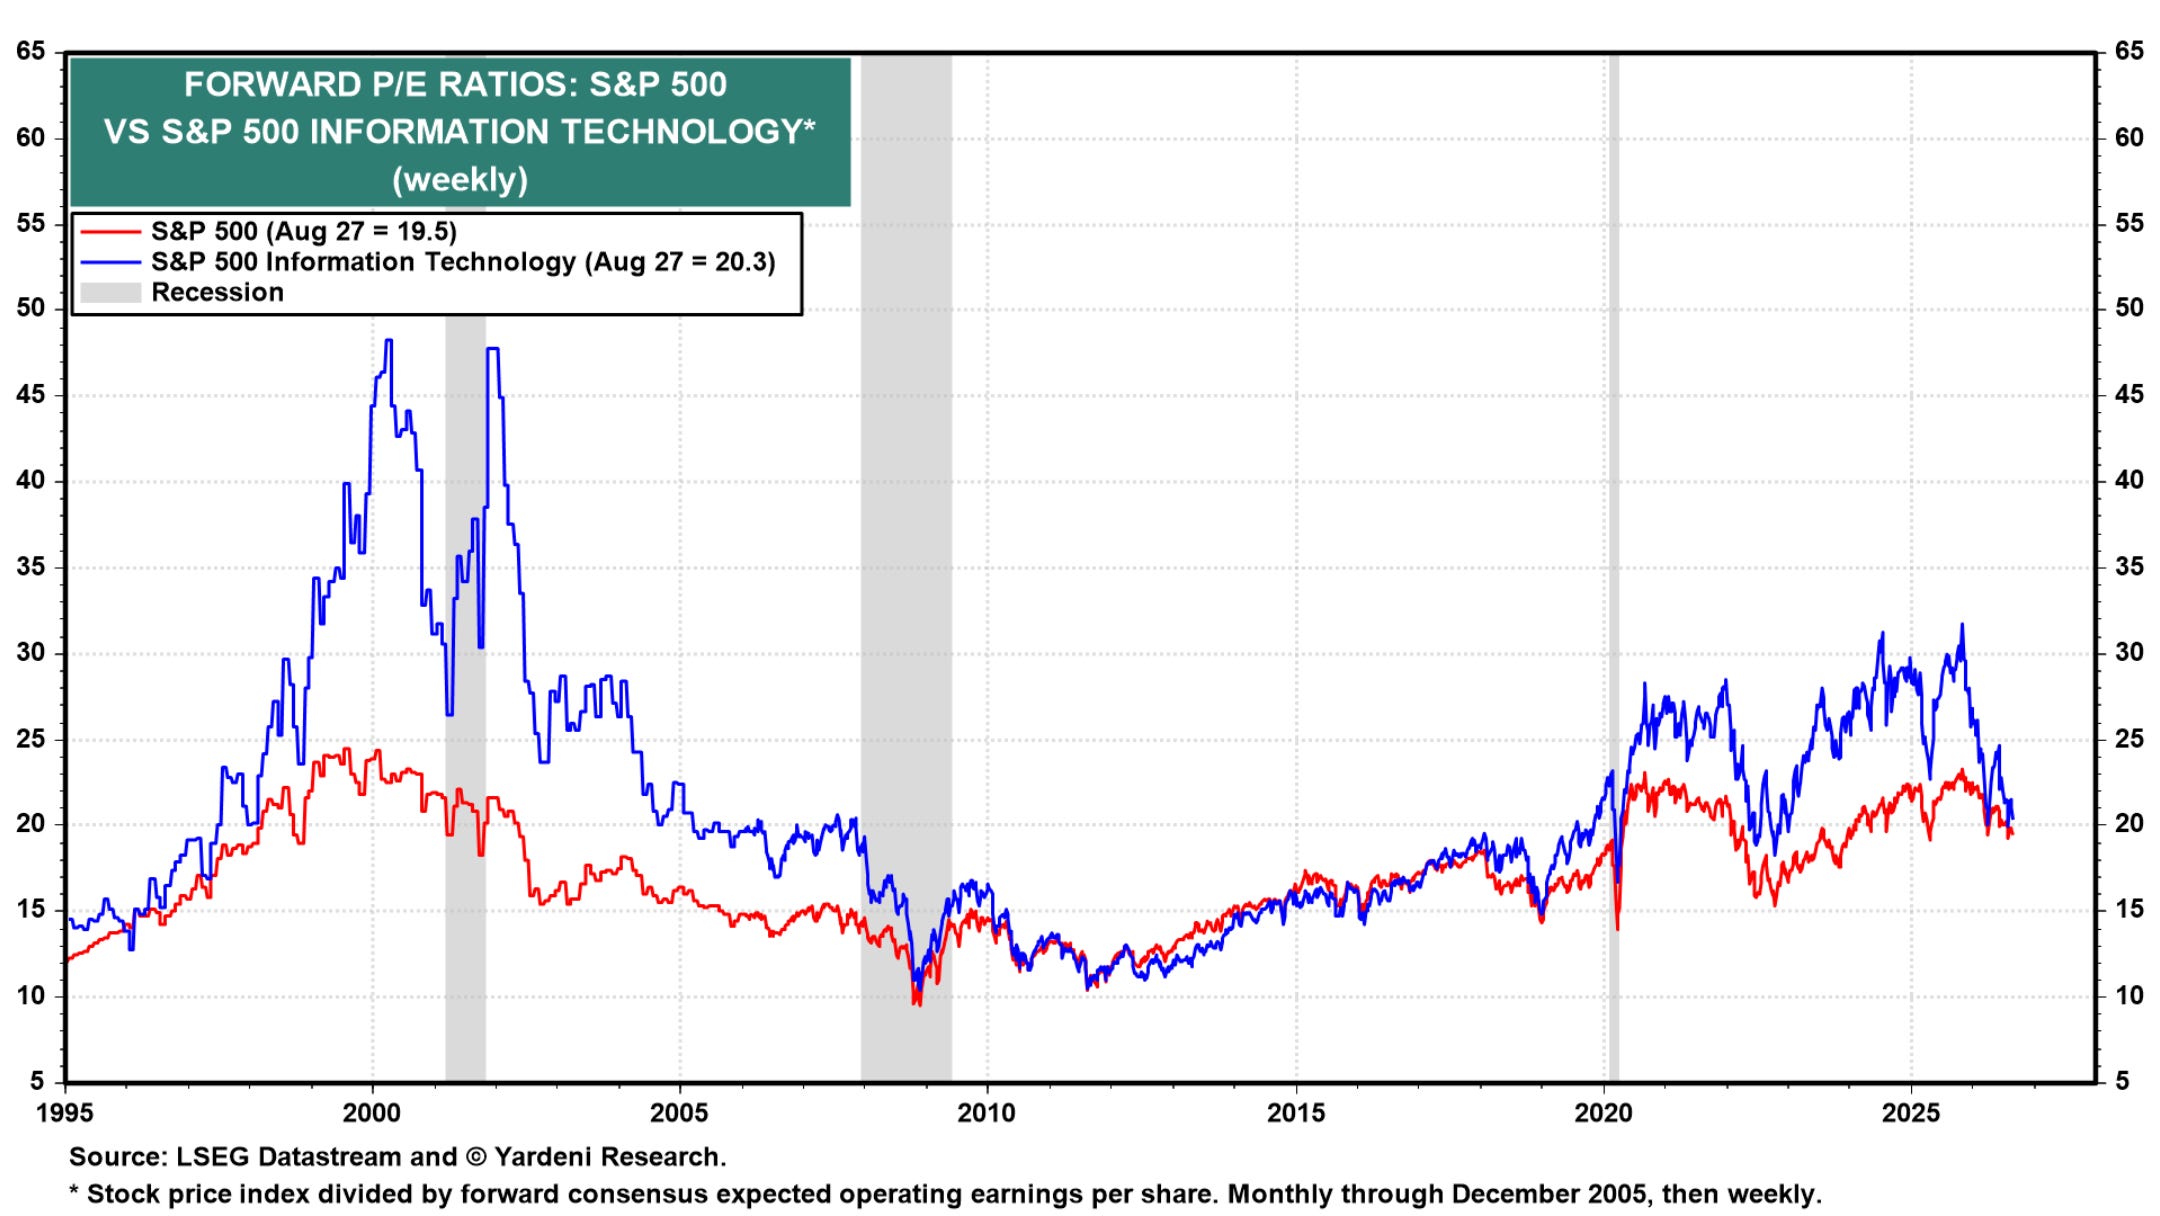
That gap at the 2000 peak, tech near 48x against the broader market near 24x, is a big part of what defined the bubble. There’s no gap like that today.
Look at what’s leading the market
This might be the biggest difference of all.
Think about the companies leading the market today. Nvidia. Microsoft. Alphabet. Amazon. Meta. Broadcom.
These aren’t companies promising that someday they might figure out how to make money. They’re already making enormous amounts of it. Hundreds of billions of dollars in revenue. Enormous profits. Massive free cash flow.
That’s very different from much of what investors were chasing at the peak of the dot-com boom. Even among the legitimate technology leaders of that era, valuations were in another universe.
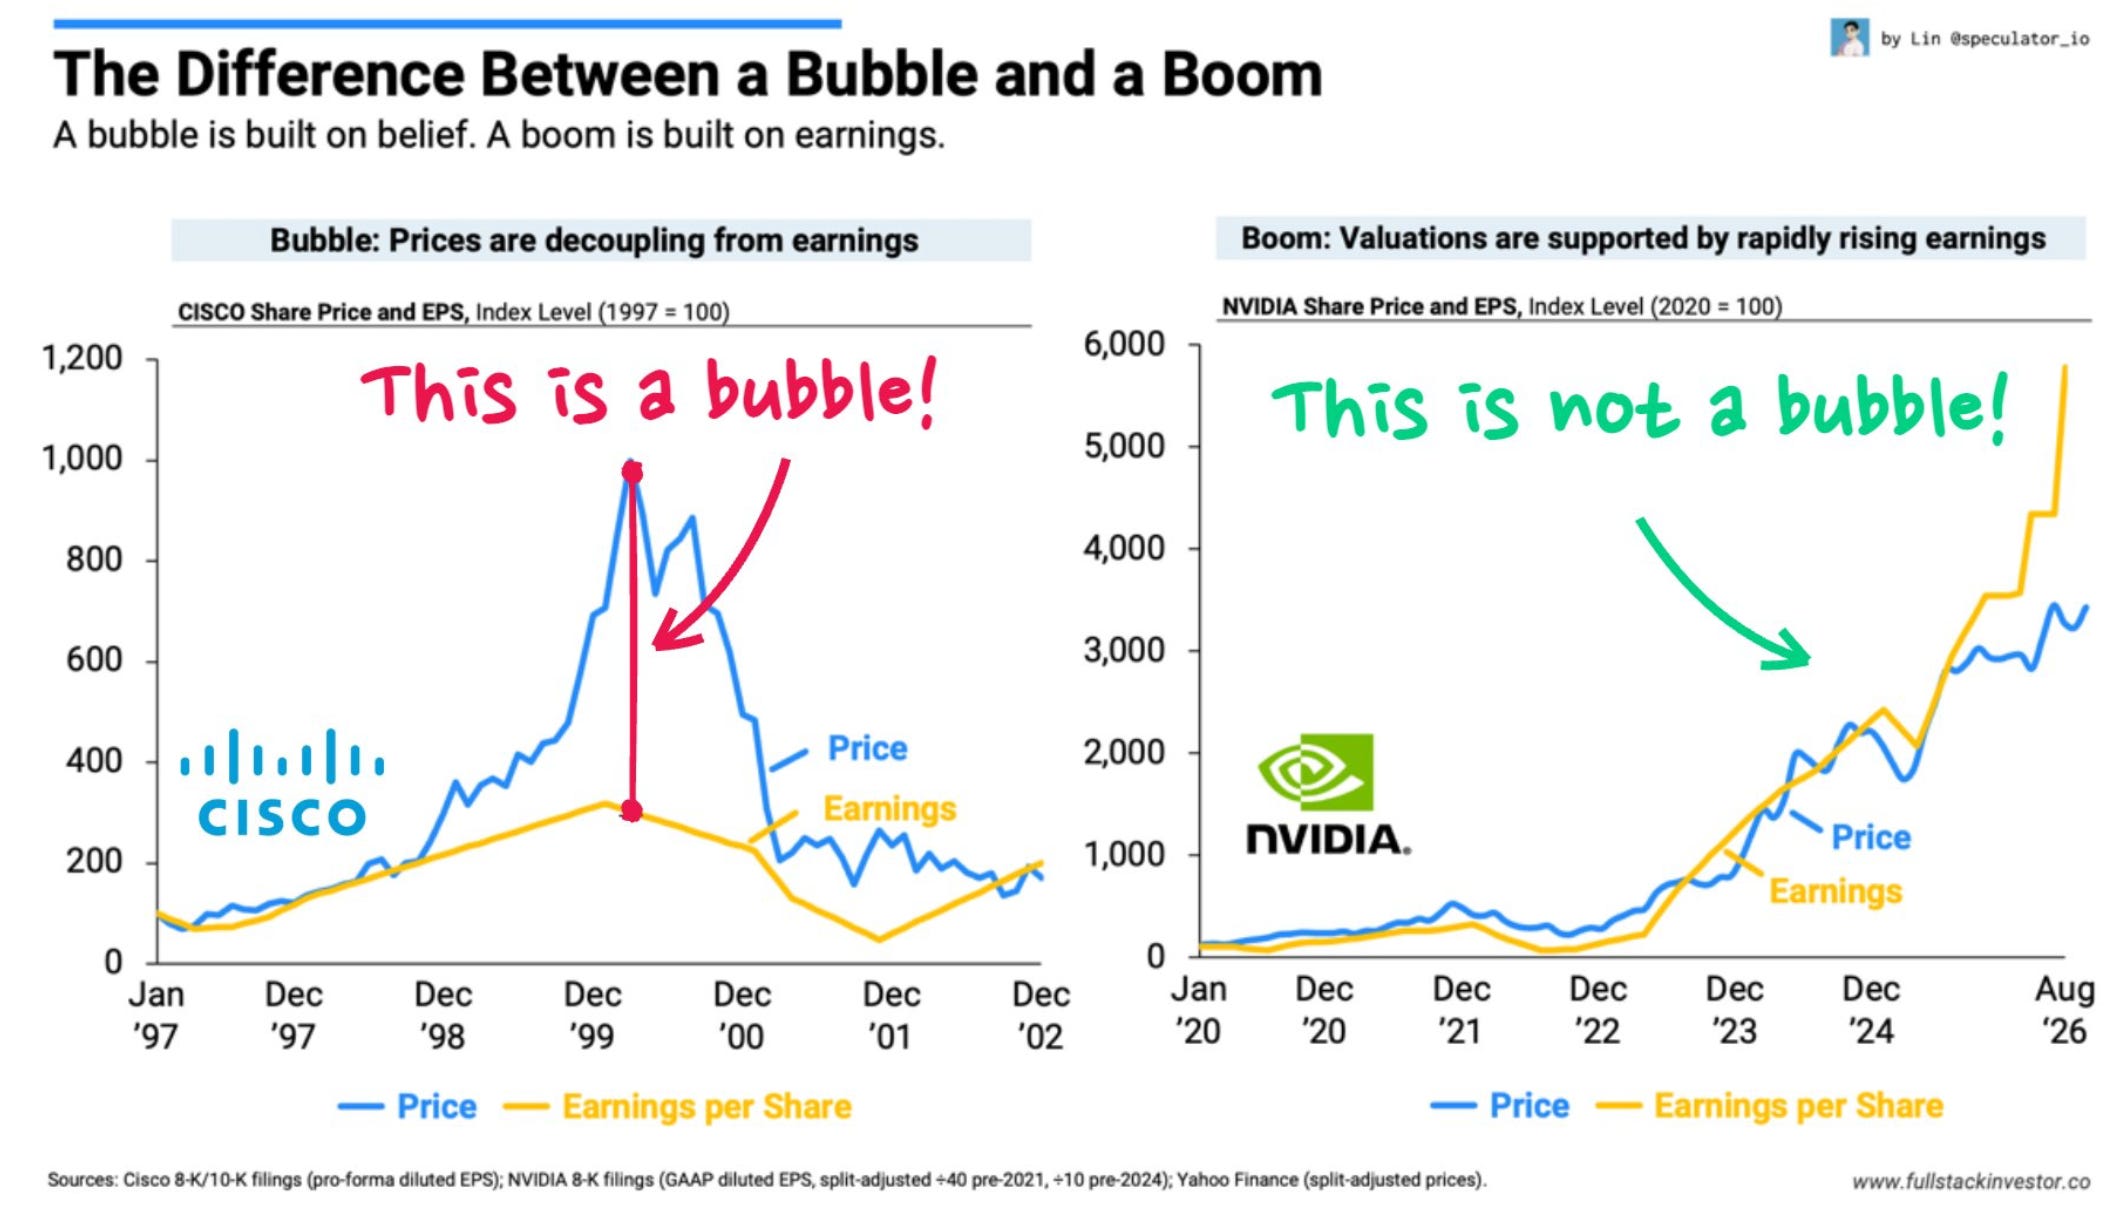
Look at the gap between Cisco’s price and its earnings at the 1999 peak. That’s a bubble. Price completely detached from what the business was actually producing.
Now look at Nvidia. Price and earnings have moved together almost the entire way. Earnings are now running slightly ahead of price. That’s a company whose stock has been playing catch-up to its own numbers.
A company can trade at a premium valuation because investors expect strong growth. That doesn’t automatically mean investors are irrational. The question is whether the growth actually shows up. So far, for many of the companies leading the AI buildout, it has.
Nvidia is the cleanest example of this, because it’s the company everyone wants to call the new Cisco.
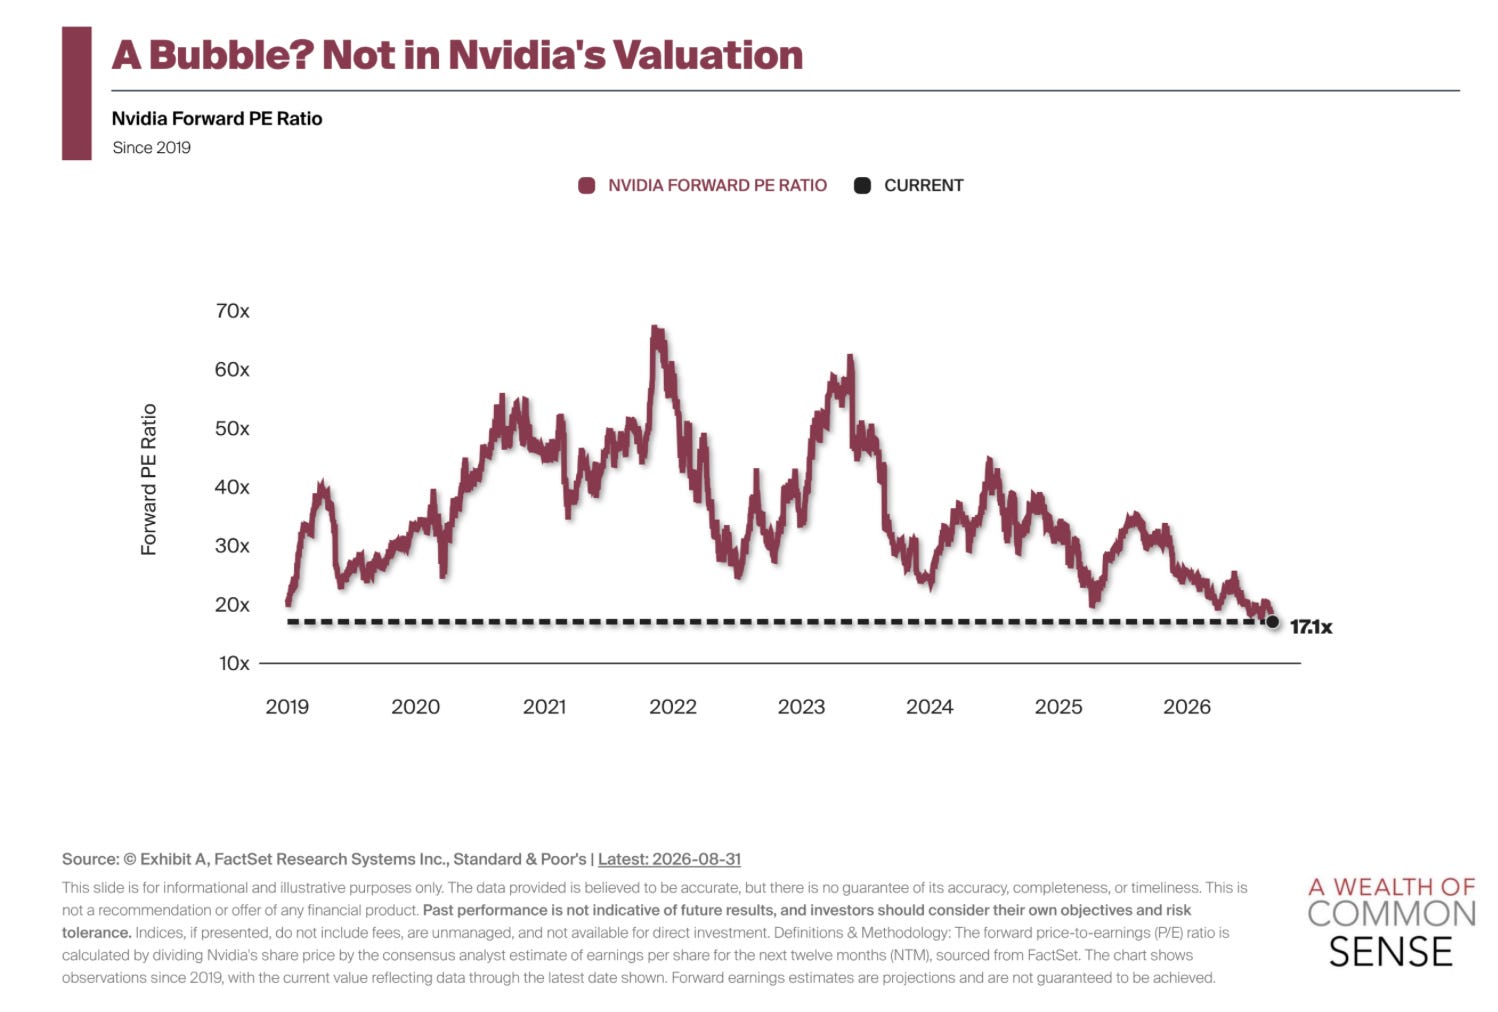
Nvidia’s forward P/E sits at 17.1x. That’s below its own five-year average. The largest company in the world is growing so fast that its valuation is actually getting cheaper, not more expensive. That’s not what happened with Cisco.
Yes, the market is concentrated
Now let’s be fair. There are real similarities to the dot-com era, and market concentration is one of them. A small number of enormous companies account for a huge percentage of the S&P 500. That’s true.
But concentration alone doesn’t tell you whether something is a bubble. The better question is how much of the profits those companies are generating. There’s a big difference between a company representing 10% of the market while generating 2% of the profits, and a company representing 10% of the market while generating 10% of the profits. Those are two completely different situations.
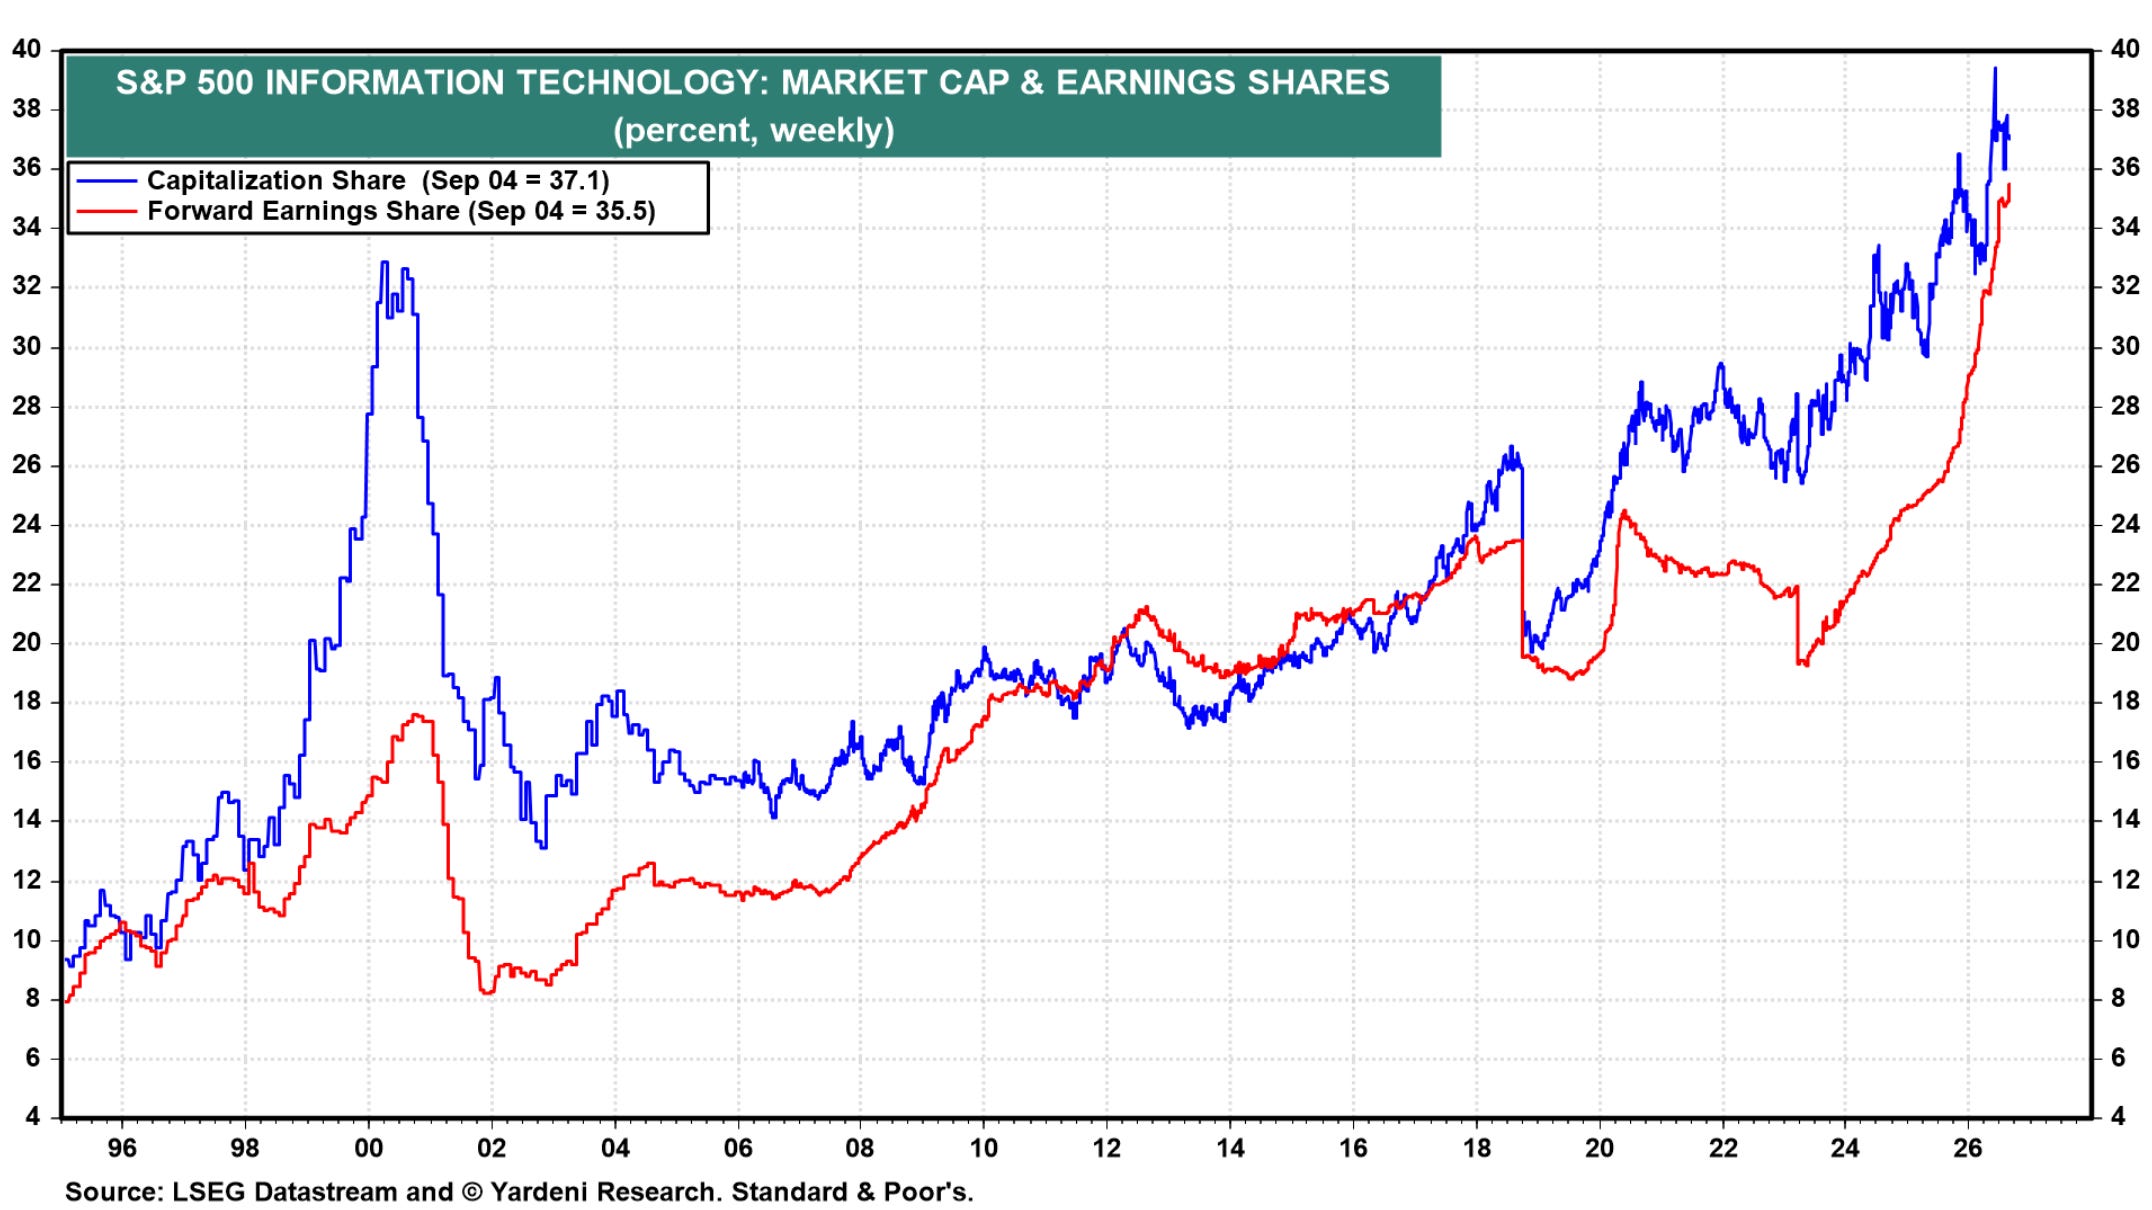
Look at the gap between the two lines at the 2000 peak. Tech’s share of the market’s value ran far ahead of tech’s share of the market’s earnings. All that white space between the lines was investors paying for a promise.
Today those two lines are nearly on top of each other. Tech’s share of market cap, 37.1%, is almost identical to tech’s share of forward earnings, 35.5%. Today’s largest companies are incredibly valuable. They’re also incredibly profitable. The market’s weighting is following the earnings rather than running ahead of them.
What if we’re still early?
What inning are we in? Second? Third? Nobody knows, and anyone who tells you they do is guessing.
AWS, Azure, and Google Cloud all grew faster in their most recent quarter than the one before it, 37%, 43%, and 82% respectively. That’s hardly what you’d expect to see from a technology trend already running out of steam.
But look at what’s happening right now. We’re still building the infrastructure. Data centers. Chips. Networking. Power. Cloud capacity. Billions and billions of dollars are being spent building the foundation for AI.
The internet didn’t stop at infrastructure. The first chapter was building the foundation. The next chapters were the applications built on top of it, search, e-commerce, social media, mobile, cloud computing, entire industries created years after the original dot-com bubble burst.
So what happens if AI follows a similar path? Software. Robotics. Healthcare. Autonomous systems. Scientific discovery.
And businesses that probably haven’t even been created yet.
Maybe we’re in the third inning. Maybe the seventh. I have no idea. But the fact that everyone can see the potential for a bubble doesn’t mean one has to burst tomorrow.
What if the scary charts are right?
Here’s the thing. Some of the charts are scary. You can overlay parts of today’s market with the late 1990s and make them look remarkably similar.
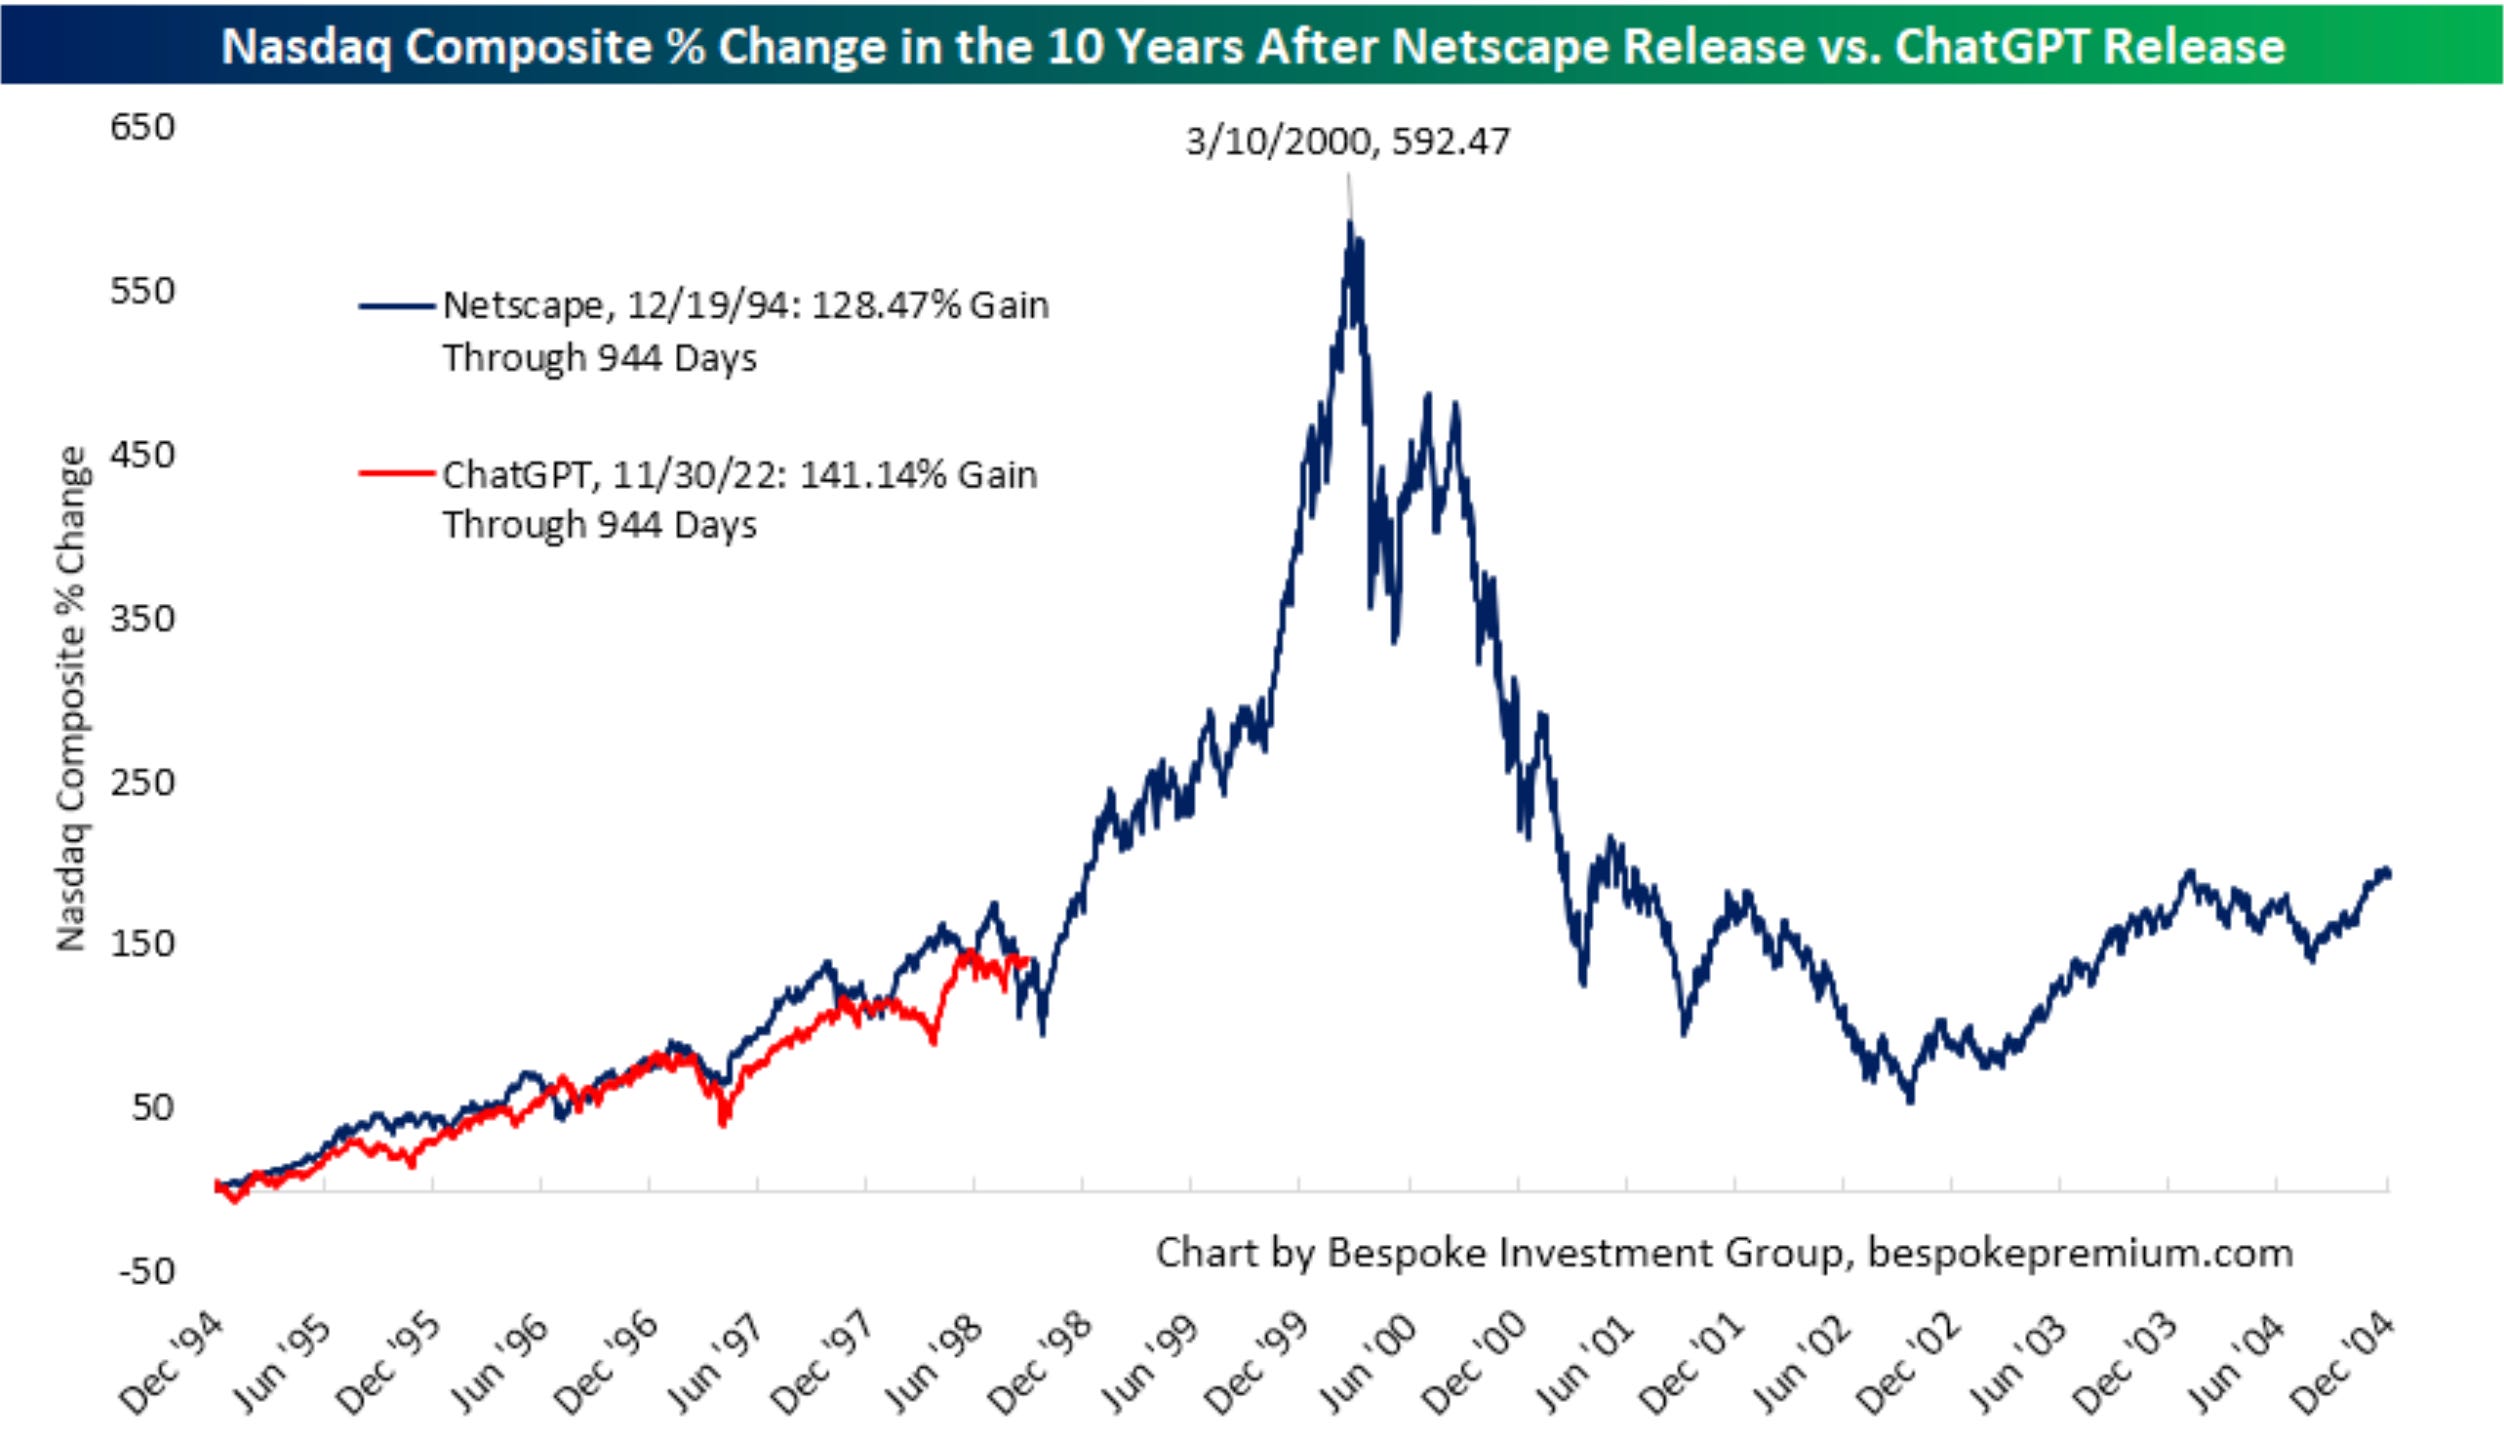
At the same number of days after launch, the Nasdaq’s ChatGPT-era gain of 141% is actually running slightly ahead of its Netscape-era gain of 128%. If you wanted a chart that supports the bears, this is it.
But look at what the Netscape line does after this point. It still had roughly two more years of parabolic rise left before it finally topped in March 2000. So even if you believe this chart, you still have to explain why this rally would need to top now, rather than one year or two years from here. “It looks similar so far” is not the same argument as “it has to end here.”
Maybe this ends badly. It certainly could. But there’s another possibility. What if the chart is right about the technology but wrong about the timing? The dot-com bubble is often used as evidence that transformational technology eventually ends in disaster. But that’s not really what happened. The bubble burst. The technology kept going. And eventually the companies built on top of that technology became some of the largest and most valuable businesses in history.
Maybe that’s the better lesson. It was never about whether to believe in the technology. It was about what you paid for it.
So, what if this isn’t a bubble?
I’m not writing this to tell you the market can’t fall. It can. I’m not writing this to tell you valuations don’t matter. They do. And I’m definitely not telling you to ignore the risks around AI spending, concentration, or expectations. Those risks are real.
Maybe this is a bubble. Maybe it isn’t. Maybe the market corrects tomorrow. Maybe some of the enormous bets being made on AI turn out to be spectacular mistakes. That’s possible.
But so is the alternative. What if earnings keep growing? What if the companies building this infrastructure today turn out to be laying the foundation for the next decade of economic growth? What if we’re still much earlier in this story than most people think?
The market doesn’t have to crash simply because everyone expects it to. And a chart that looks like 1999 doesn’t mean the calendar has to say March 2000 next.
Maybe this is a bubble. Or maybe we’re still watching the beginning of something much bigger. And maybe the better question isn’t whether this looks like 1999.
Maybe the better question is, what if it doesn’t?
Thank you for reading! If you enjoyed Spilled Coffee, please subscribe.
Spilled Coffee grows through word of mouth. Please consider sharing this post with someone who might appreciate it.