The Full View of Credit Card Debt
You miss the whole picture by only reading the headlines
We’ve all seen the headlines about record credit card debt. They constantly remind us that it’s at an all-time high.

If you only read the headlines, you don’t get the full view of something.
After seeing a lot of data regarding the credit card debt story, I found myself curious. Is the record high number something to really worry about? Is it getting worse? Will it have an effect on the economy and consumer spending?
Here is what I discovered.
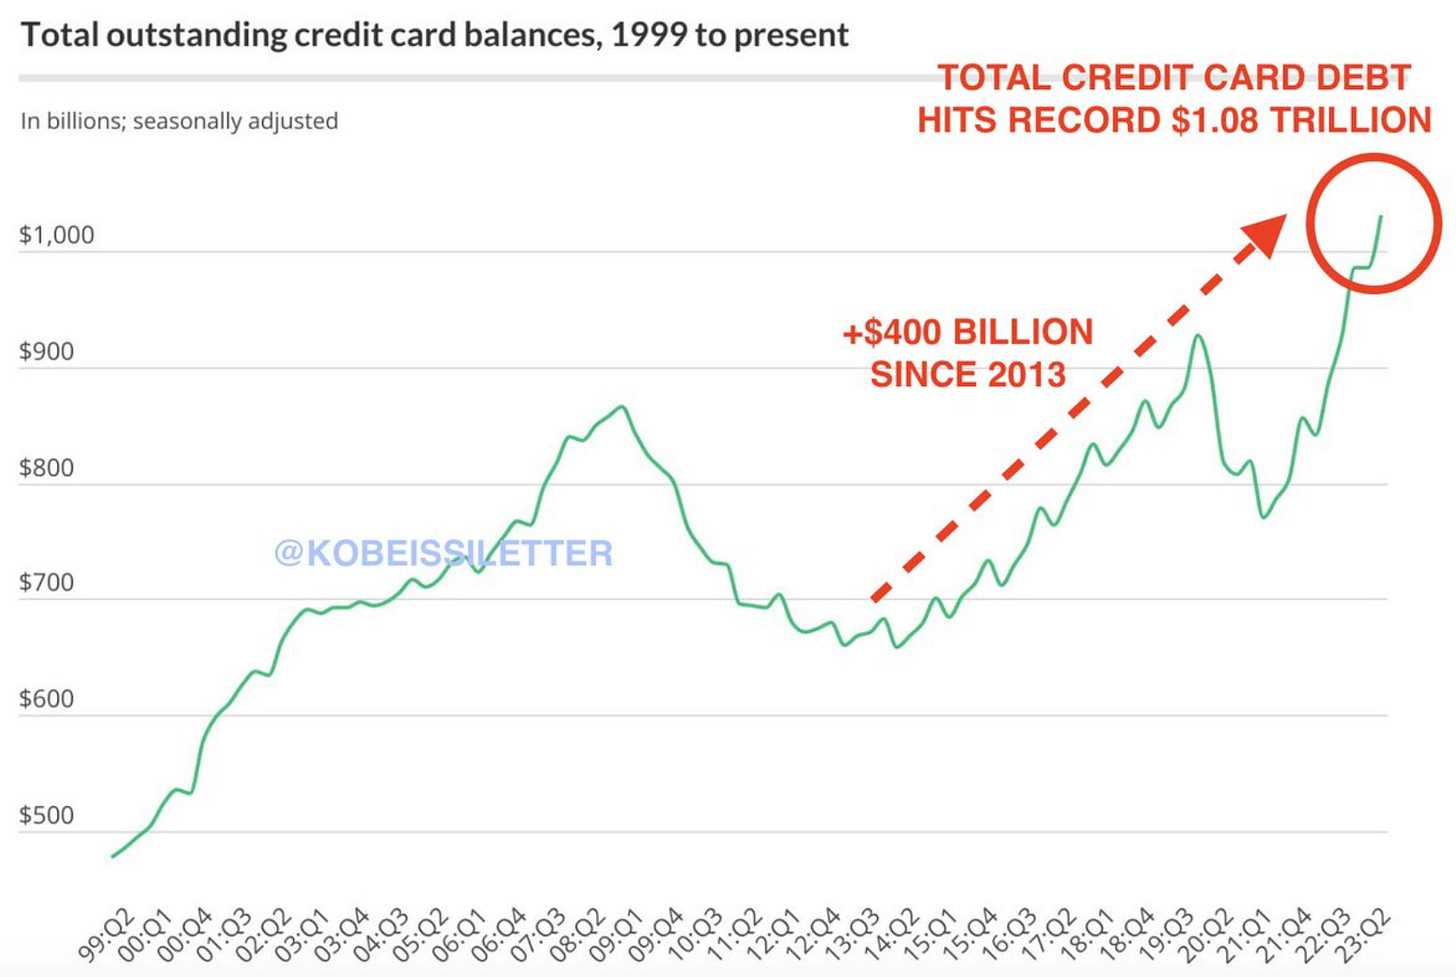
This total outstanding credit card balances chart does a great job showing the recent uptick in card balances. In fact, it has been steadily rising over the past 10 years.

FactSet has a good chart that breaks out and compares three areas of the credit card debt.
Household credit card debt
Bank interest rate
Delinquency rates
As you’ll notice, bank interest and delinquency rates turned upwards when the Fed started to raise interest rates.

In the chart below, which I also recently shared in (Investing Update: The Everything Rally), credit card delinquency rates are in fact rising. This is a cause for concern. It’s the one sign we can take from the credit card data that will raise the red flag on a struggling consumer. When this gets abnormally high, it has coincided with a recession as the chart illustrates.
Does the uptick in delinquencies align with the timing of the Fed raising of interest rates? This chart shows that it likely does.
Now with the expectation that the Fed starts to lower rates, does this delinquency concern that so many point to as a looming concern, go away? It very well could.

If you look into the delinquency status further, you can see it’s slightly up overall, but nothing alarming. No currently category sticks out as you look back through the past 20 years for comparison.

One step further is if we look at the share of consumers with debt in collections. This isn’t just for credit cards, but it gives you a look that we’re actually at historic lows for debt in collections.

If we circle back around to the large number ($1.08 trillion) in credit card debt, that alone sounds like a problem. It’s such a giant number! That has to be bad.
Well, this chart says otherwise. In looking at the credit card debt to a percentage of total deposits or money in the bank, the 6.1% is near a 20 year low.

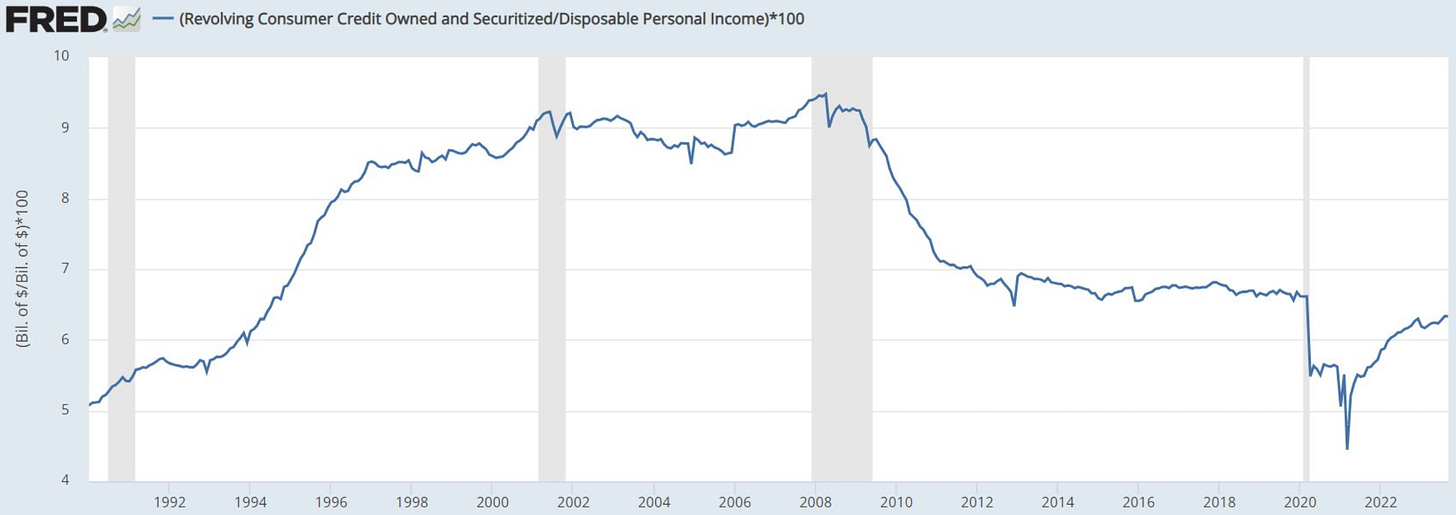
What about credit card debt as a percentage of disposable income? It’s still below the pre-COVID level and significantly below the levels seen in the 2000s. The rise of incomes have helped consumers handle this.

Here is another good ratio chart that shows the breakdown of how flush consumers are with liquid assets.

We’ve also seen an across the board fall in debt as a percentage of total assets. Assets are up much more than debt across all percentiles of income. Some income percentiles are at their lowest levels in 20 to 30 years.

Ben Carlson actually broke out the increases by the numbers from Q4 2019 to Q2 2023 in credit card debt, followed by the increase in the US economy, household net worth and home equity.

All of this actually seems to paint the picture of a financially stable consumer. In fact, consumers have done such a good job in handling their financial matters that the average credit (FICO) score just hit an all-time high.

Here is an interesting chart that Ryan Detrick shared that shows the average credit (FICO) score going back to 2005. It stands at a high of 718 in 2023.

Like a lot of data points, credit card debt is something to monitor. It can signal rough waters ahead. Right now, the path ahead doesn’t forecast any storms to me. That could change.
This metric like many others can be shared and portrayed as a much bigger issue than it is. Like with most things, context matters. That’s why it’s best to get a full view for yourself rather than just forming an opinion or viewpoint by only reading the headlines.
The Coffee Table ☕
Josh Brown is writing on a regular basis again and he’s back to his usual must read ways. I found his post, Five ways you managed to lose money this year extremely interesting. As you read this, you understand that this is the common way to lose money every year, not just in 2023.
I knew Chick-Fil-A was popular, but had no idea it was to this extent. It’s the top rated fast food chain in 34 states! This is among all the categories of burgers, chicken, doughnuts and pizza.
Thank you for reading! If you enjoyed Spilled Coffee, please subscribe.
Spilled Coffee grows through word of mouth. Please consider sharing this post with someone who might appreciate it.
Order my book, Two-Way Street below.


