
On Recession Watch
Is a Recession Likely — and Why Does It Matter for the Stock Market?
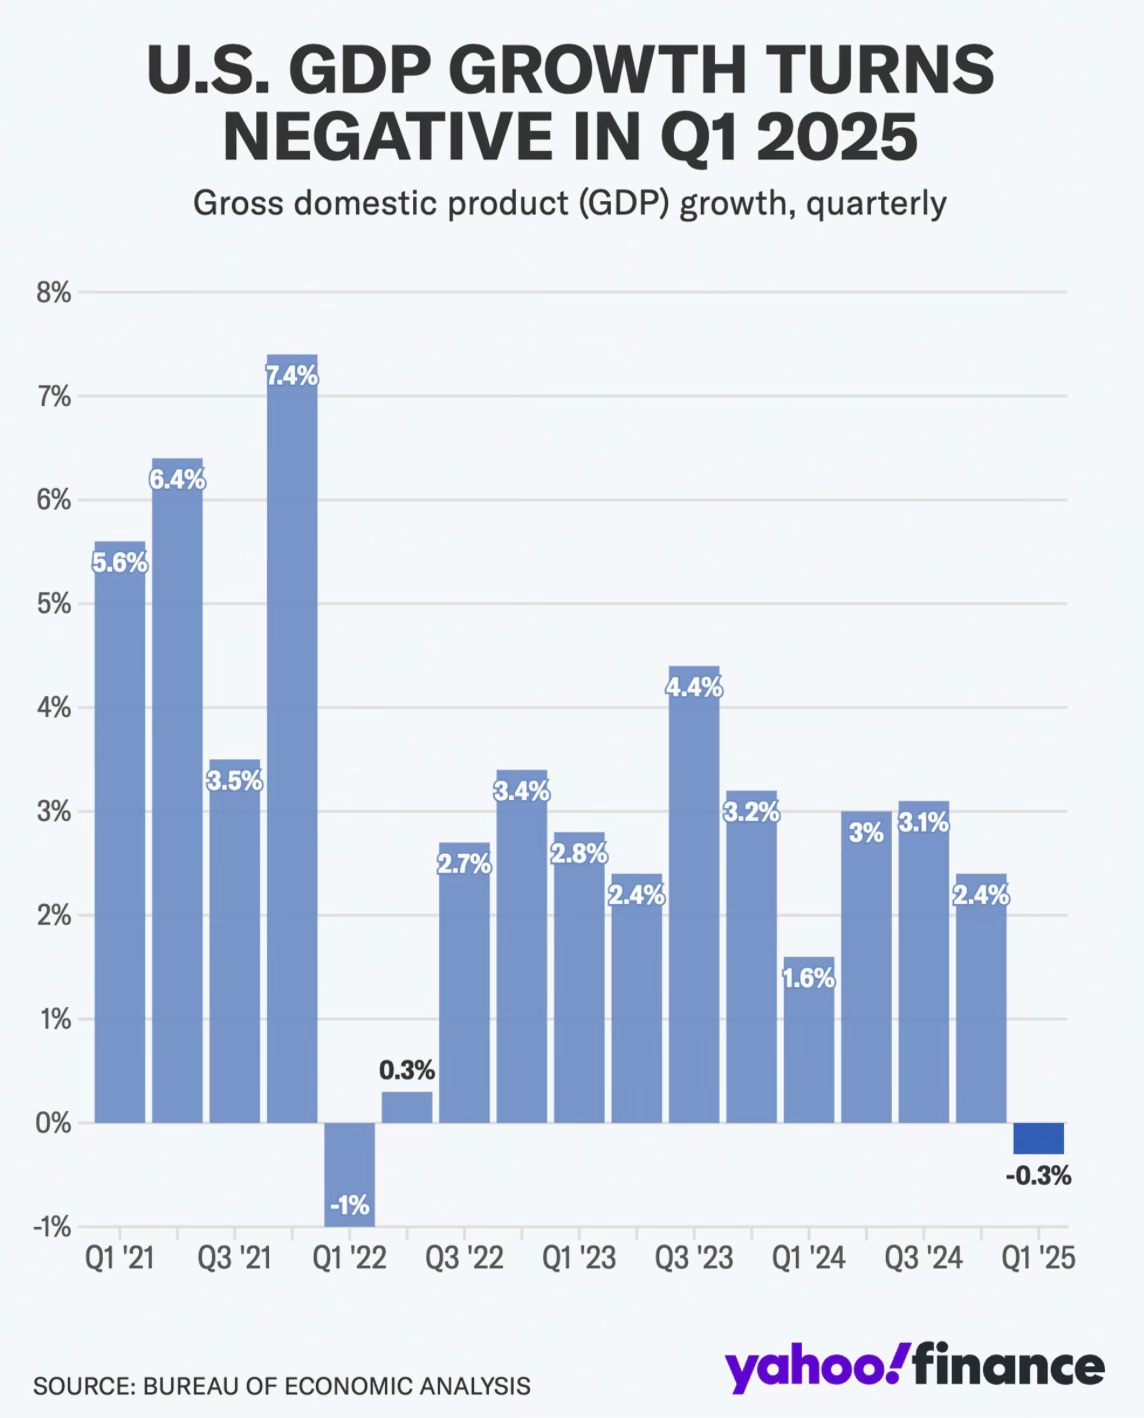
For the first time since Q1 2022, GDP growth was negative in Q1. This marks the lowest GDP reading since Q2 2022.
The U.S. economy declined by -0.3% in Q1 of 2025, down from +2.4% at the end of last year.
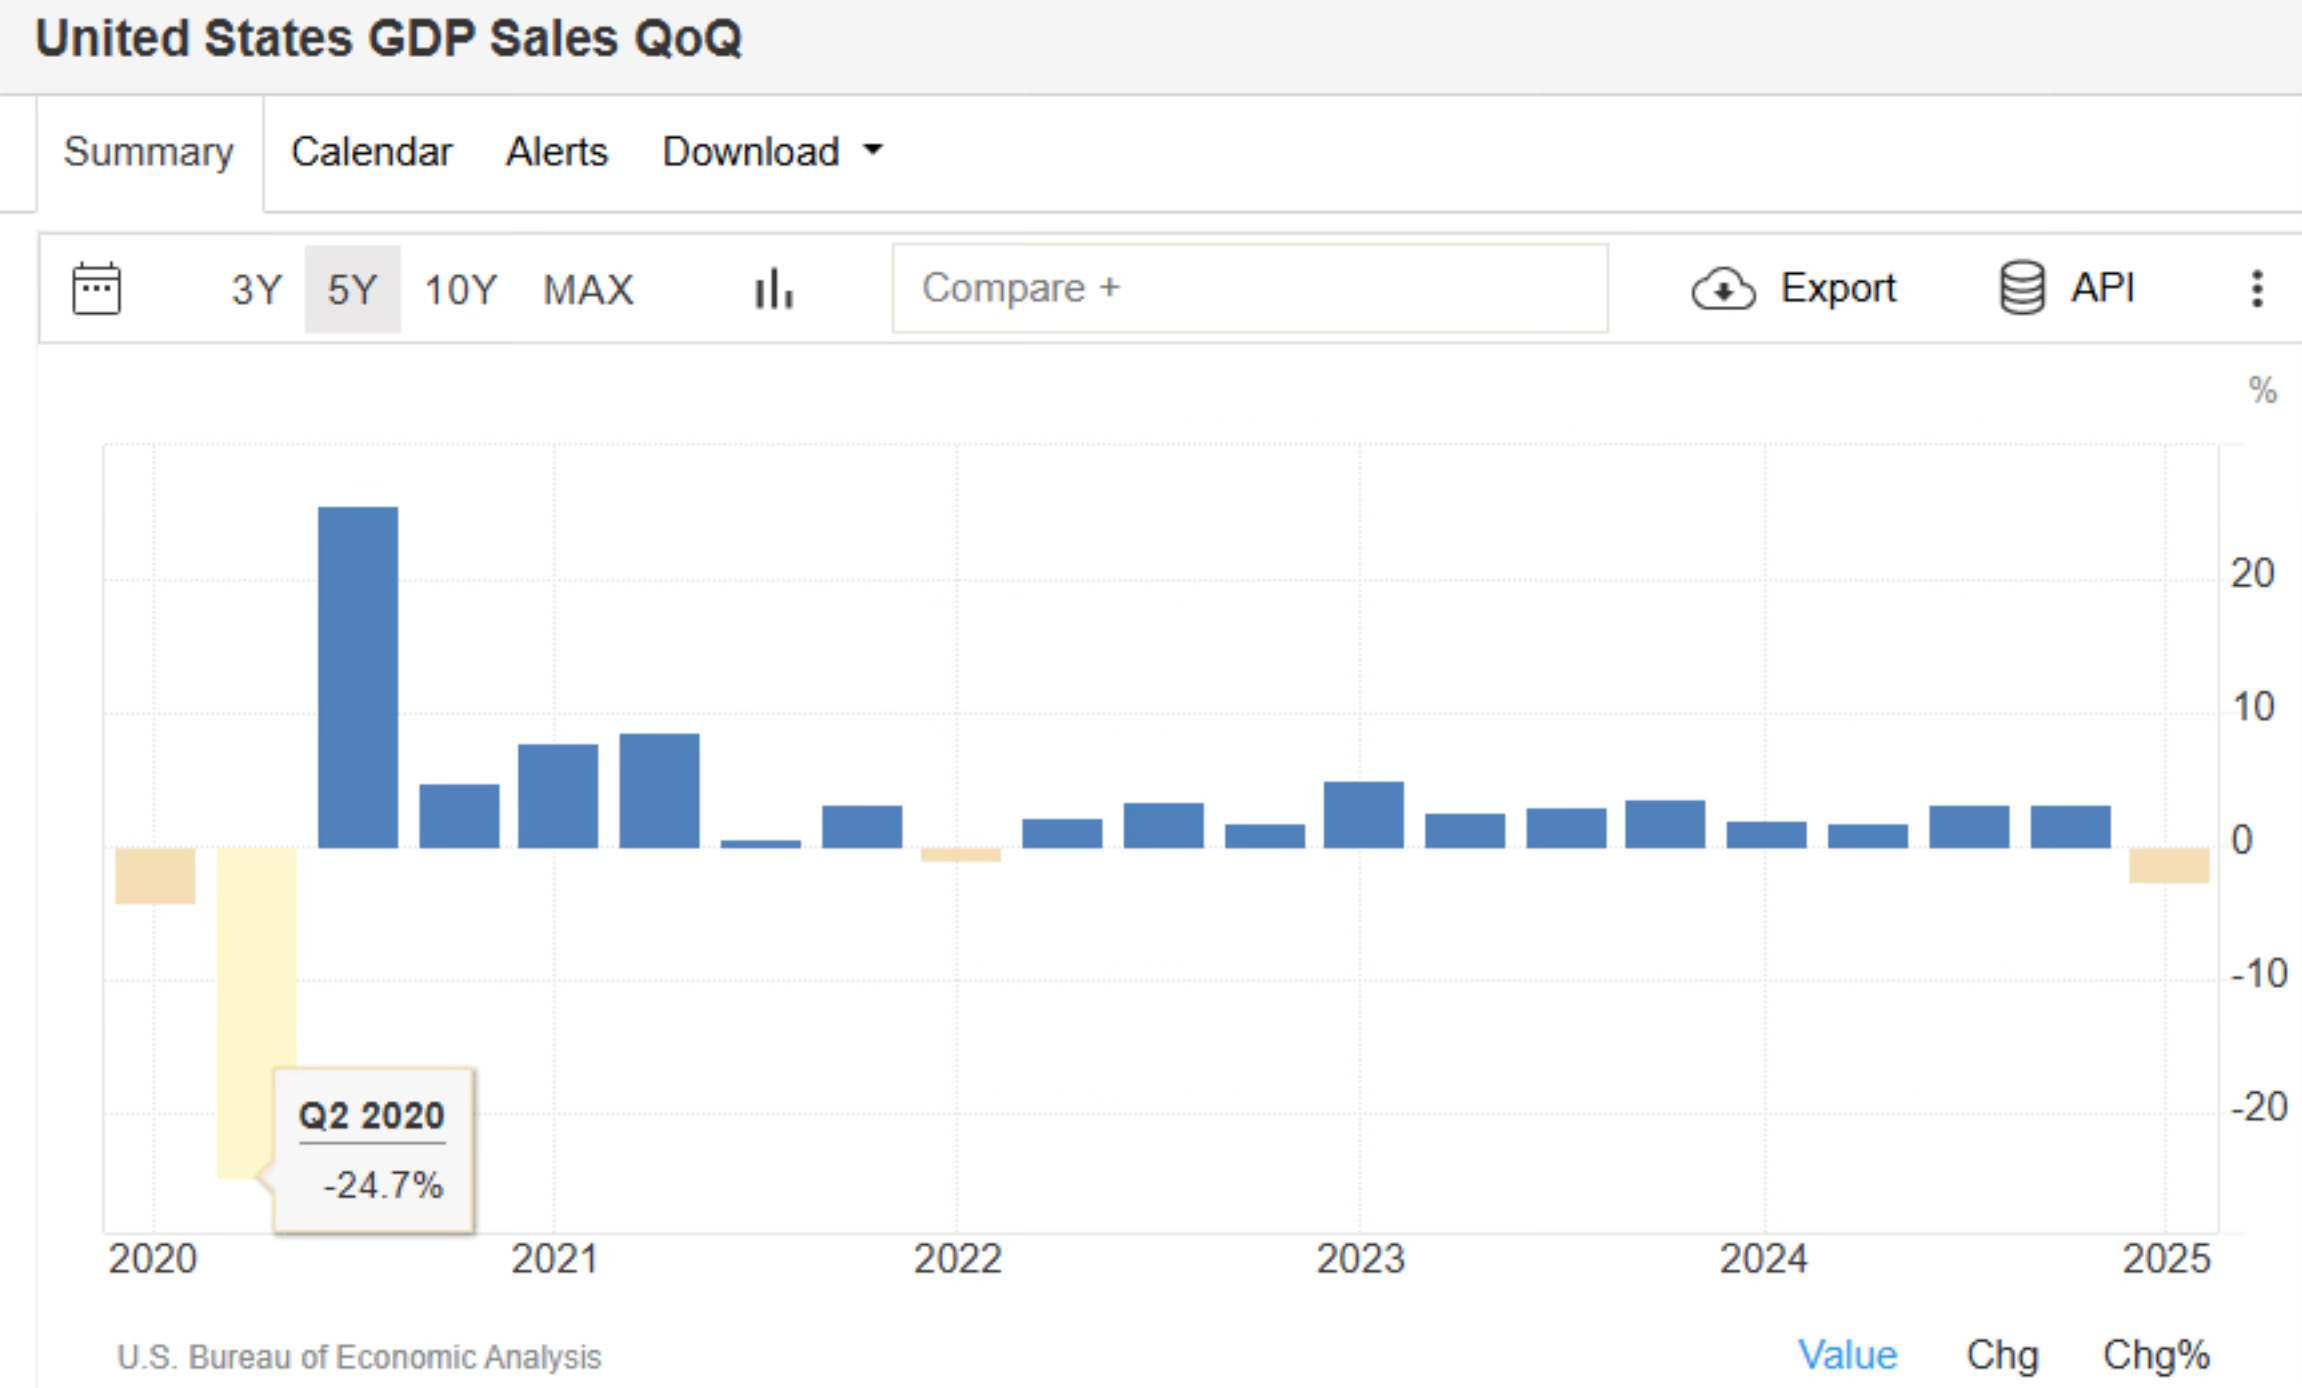
Q1 2025 U.S. GDP sales of -2.5% was the worst QoQ since Q2 2020.
With one quarter of negative GDP growth, that greatly increases the likelihood that we see a recession this year.
Again, a technical recession is two consecutive quarters of negative GDP growth.
We’re already 50% of the way there. This brings the odds a looming recession the most likely since 2022.
But last week did provide some positive data on the jobs front.
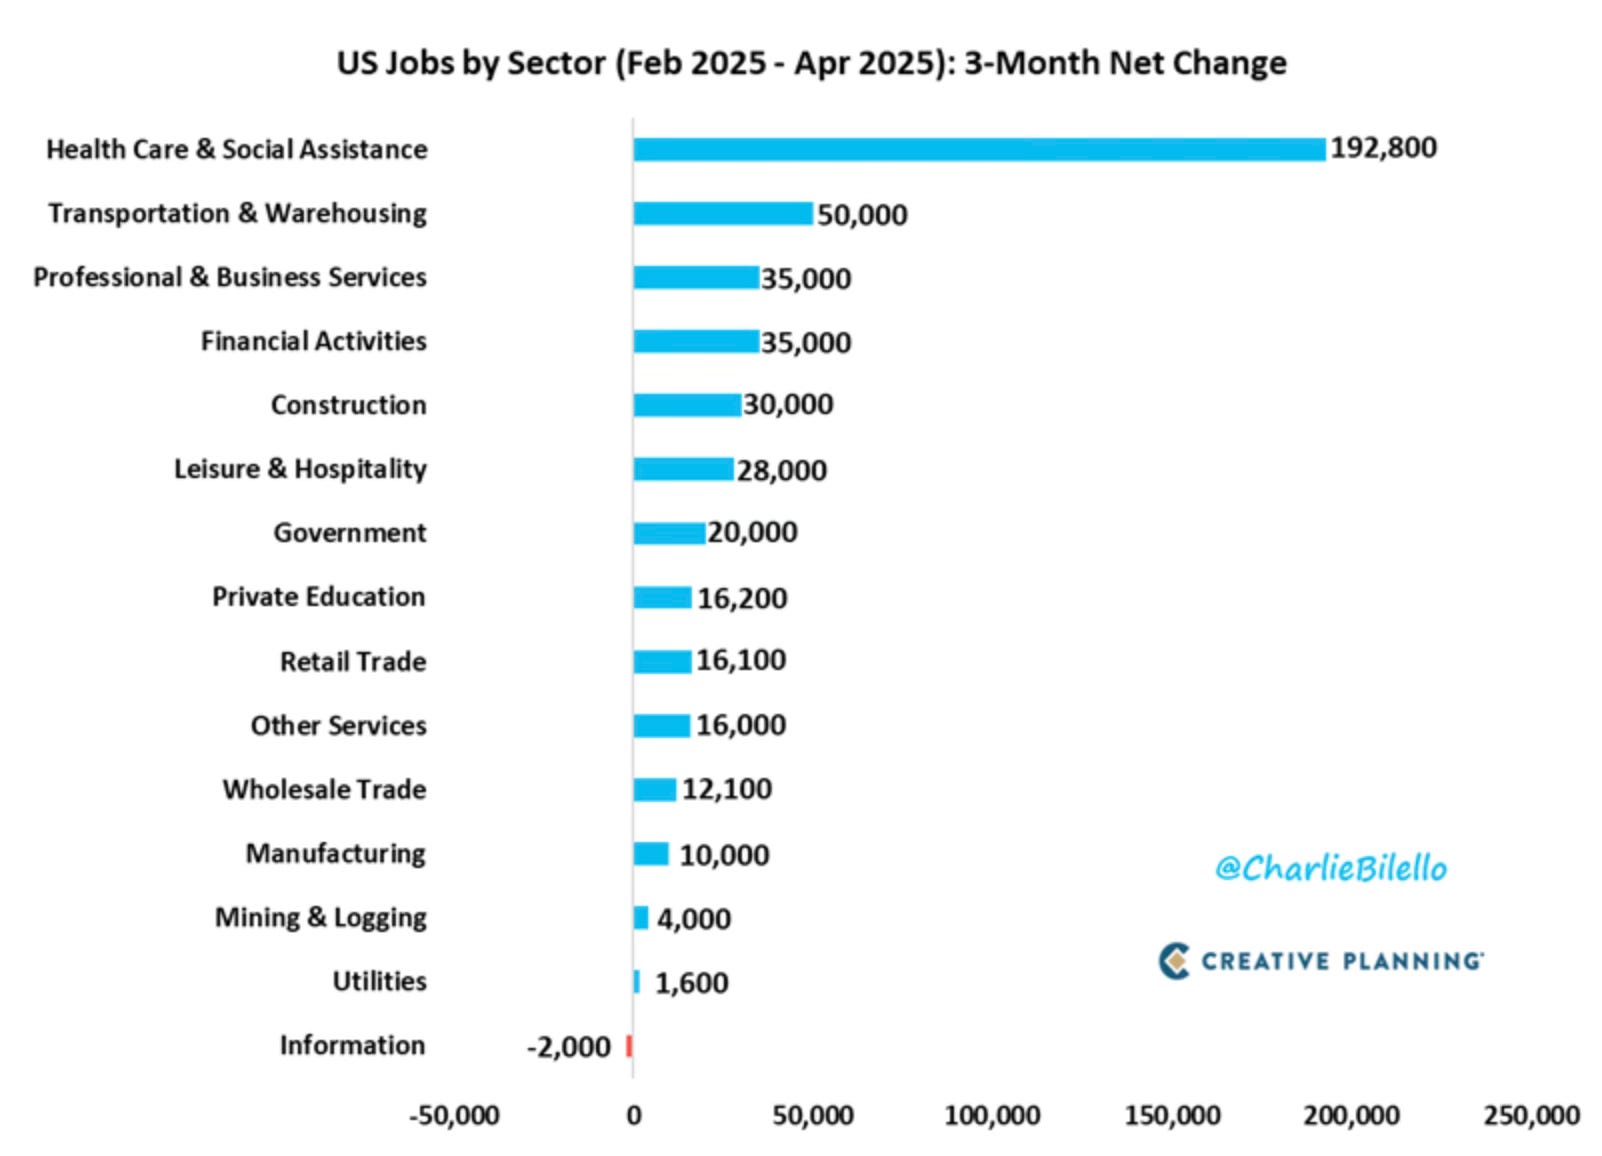
The US economy added 177,000 jobs in April. That was above expectations of 138,000. It makes 52 straight months of job gains. Almost every sector has seen job gains over the last 3 months.
The unemployment rate was still low at 4.2%, which was in-line with expectations of 4.2%. Prime-age employment population ratio moved up to 80.7 in April. This level is still not a level in line with any recession.

Here is the inflation adjusted change in the GDP components. The consumer is still spending.

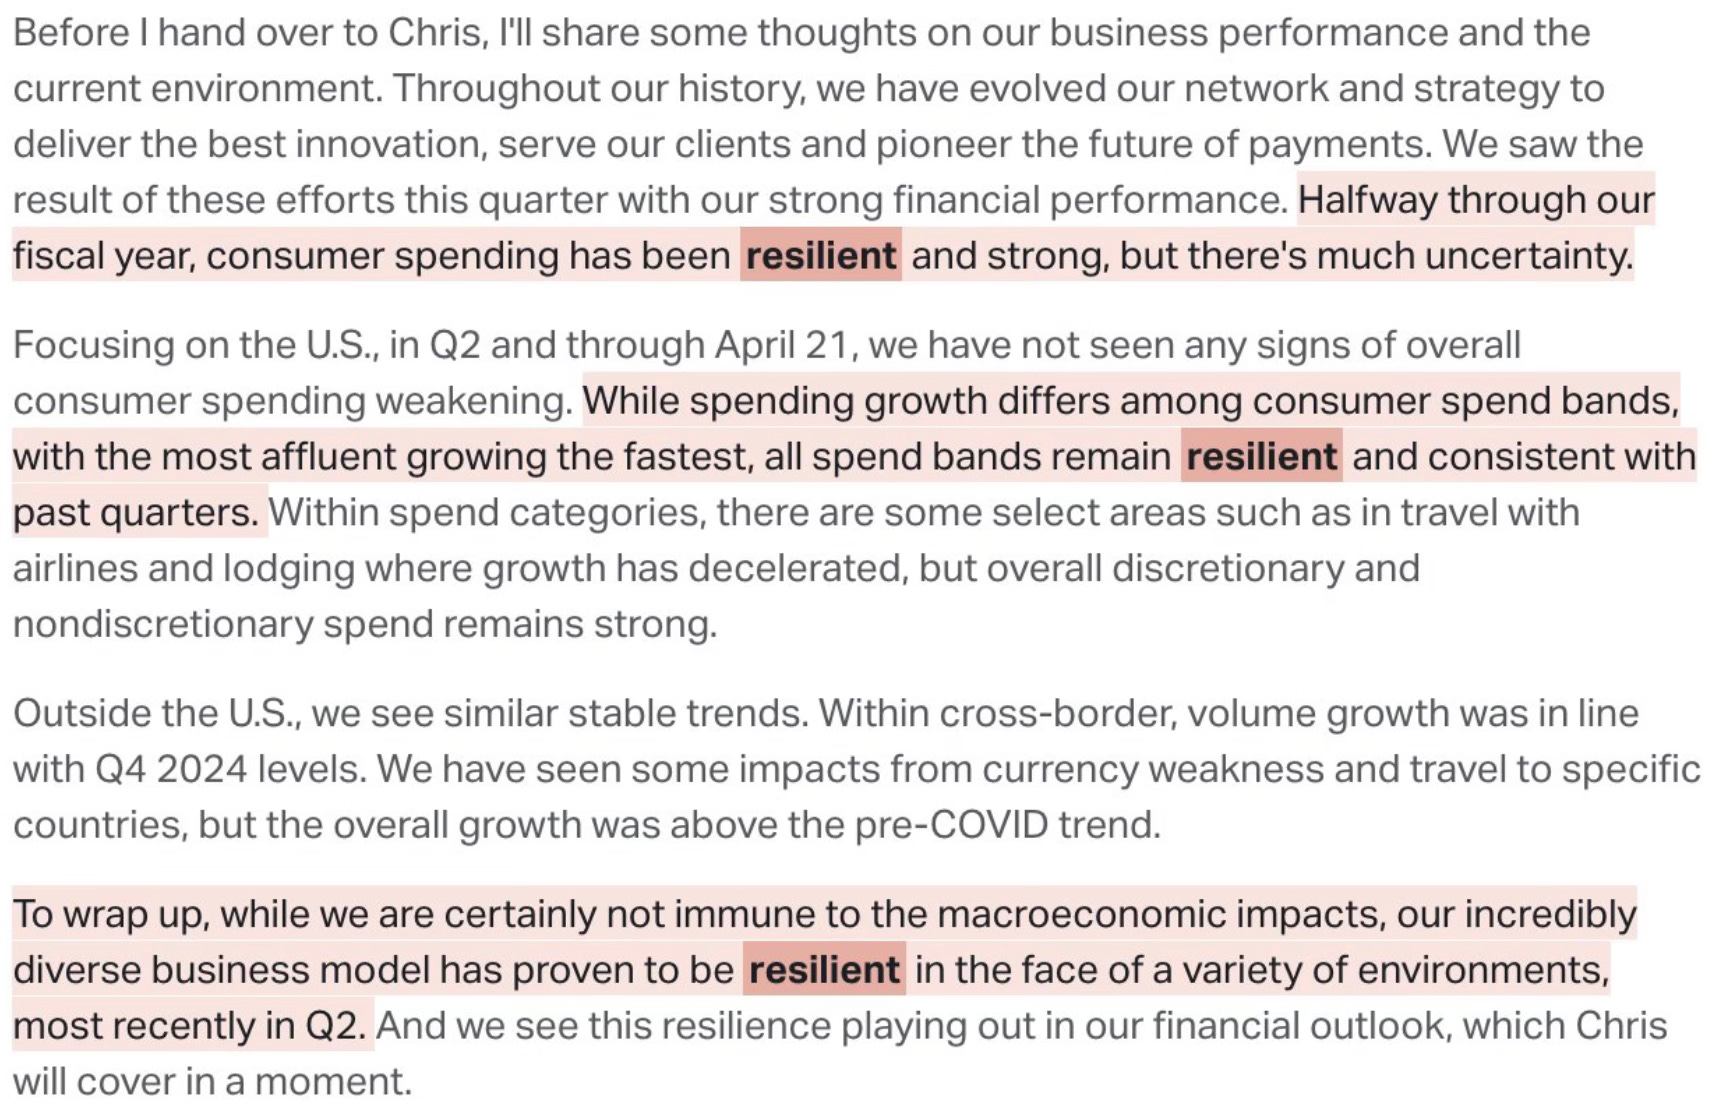
If you want to get a direct look into how the consumer is spending, I like to go right to what Visa is saying. I believe they have the best read of any company on the U.S. consumer.
Visa's CEO, Ryan McInerney said the following during their earnings call on April 29th. He makes light of how consumer spendings has been resilient and that they haven’t seen any signs of the overall consumer spennding weakening.
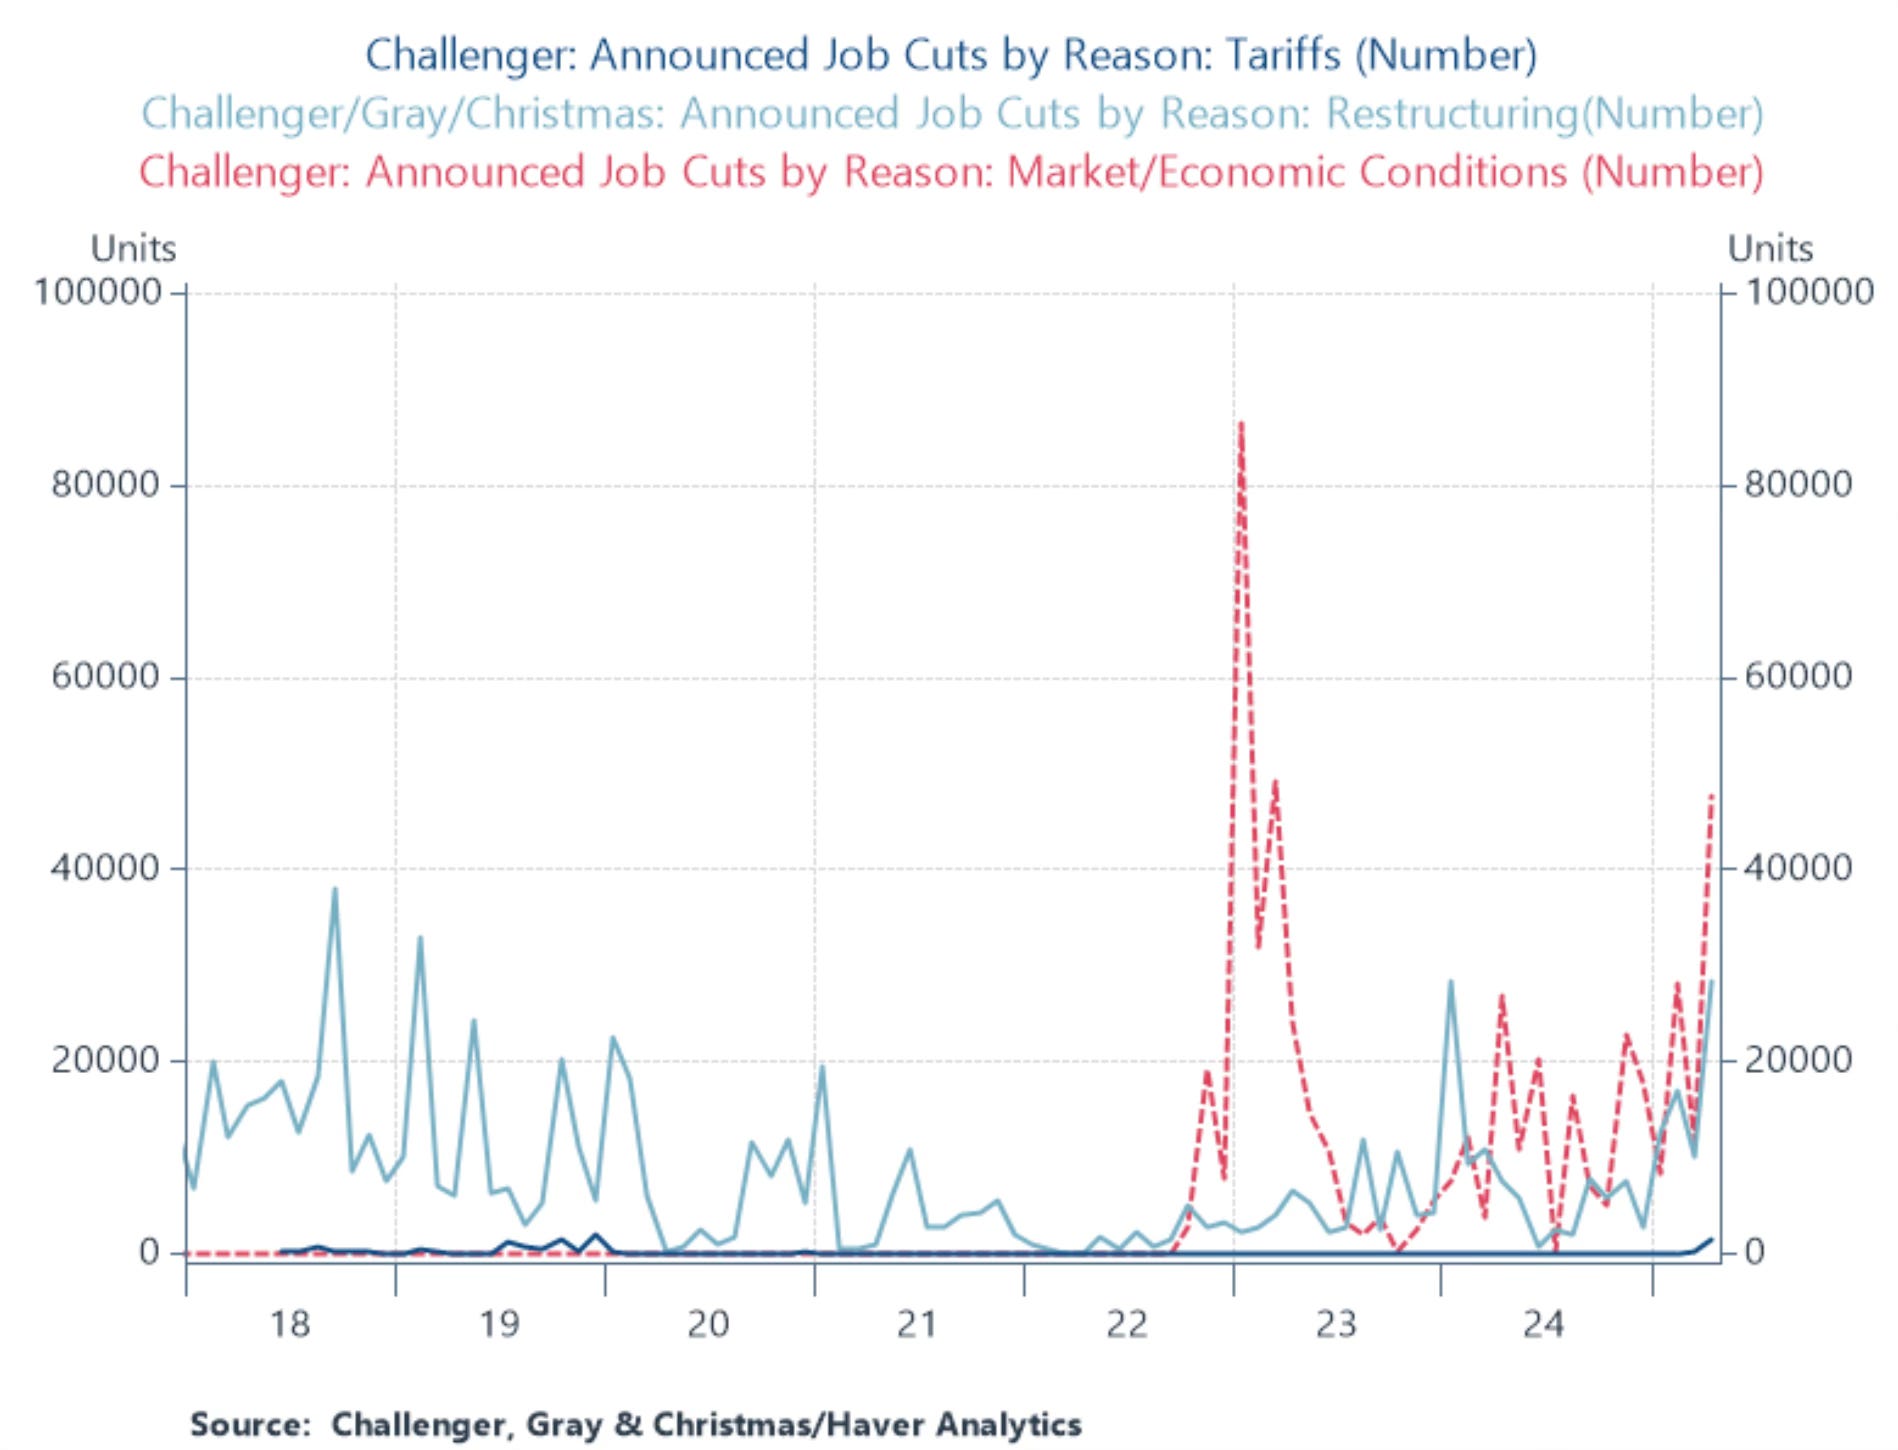
Now on the flip side, U.S. employers have announced 602,493 job cuts so far this year. That’s the highest YTD total since 2020 (Covid) and 2009 (GFC).
What really sticks out the most on this chart though is that companies are reflecting the reason for these job cuts as the economic conditions. Citing economic conditions as being the reason is the highest since March 2023.
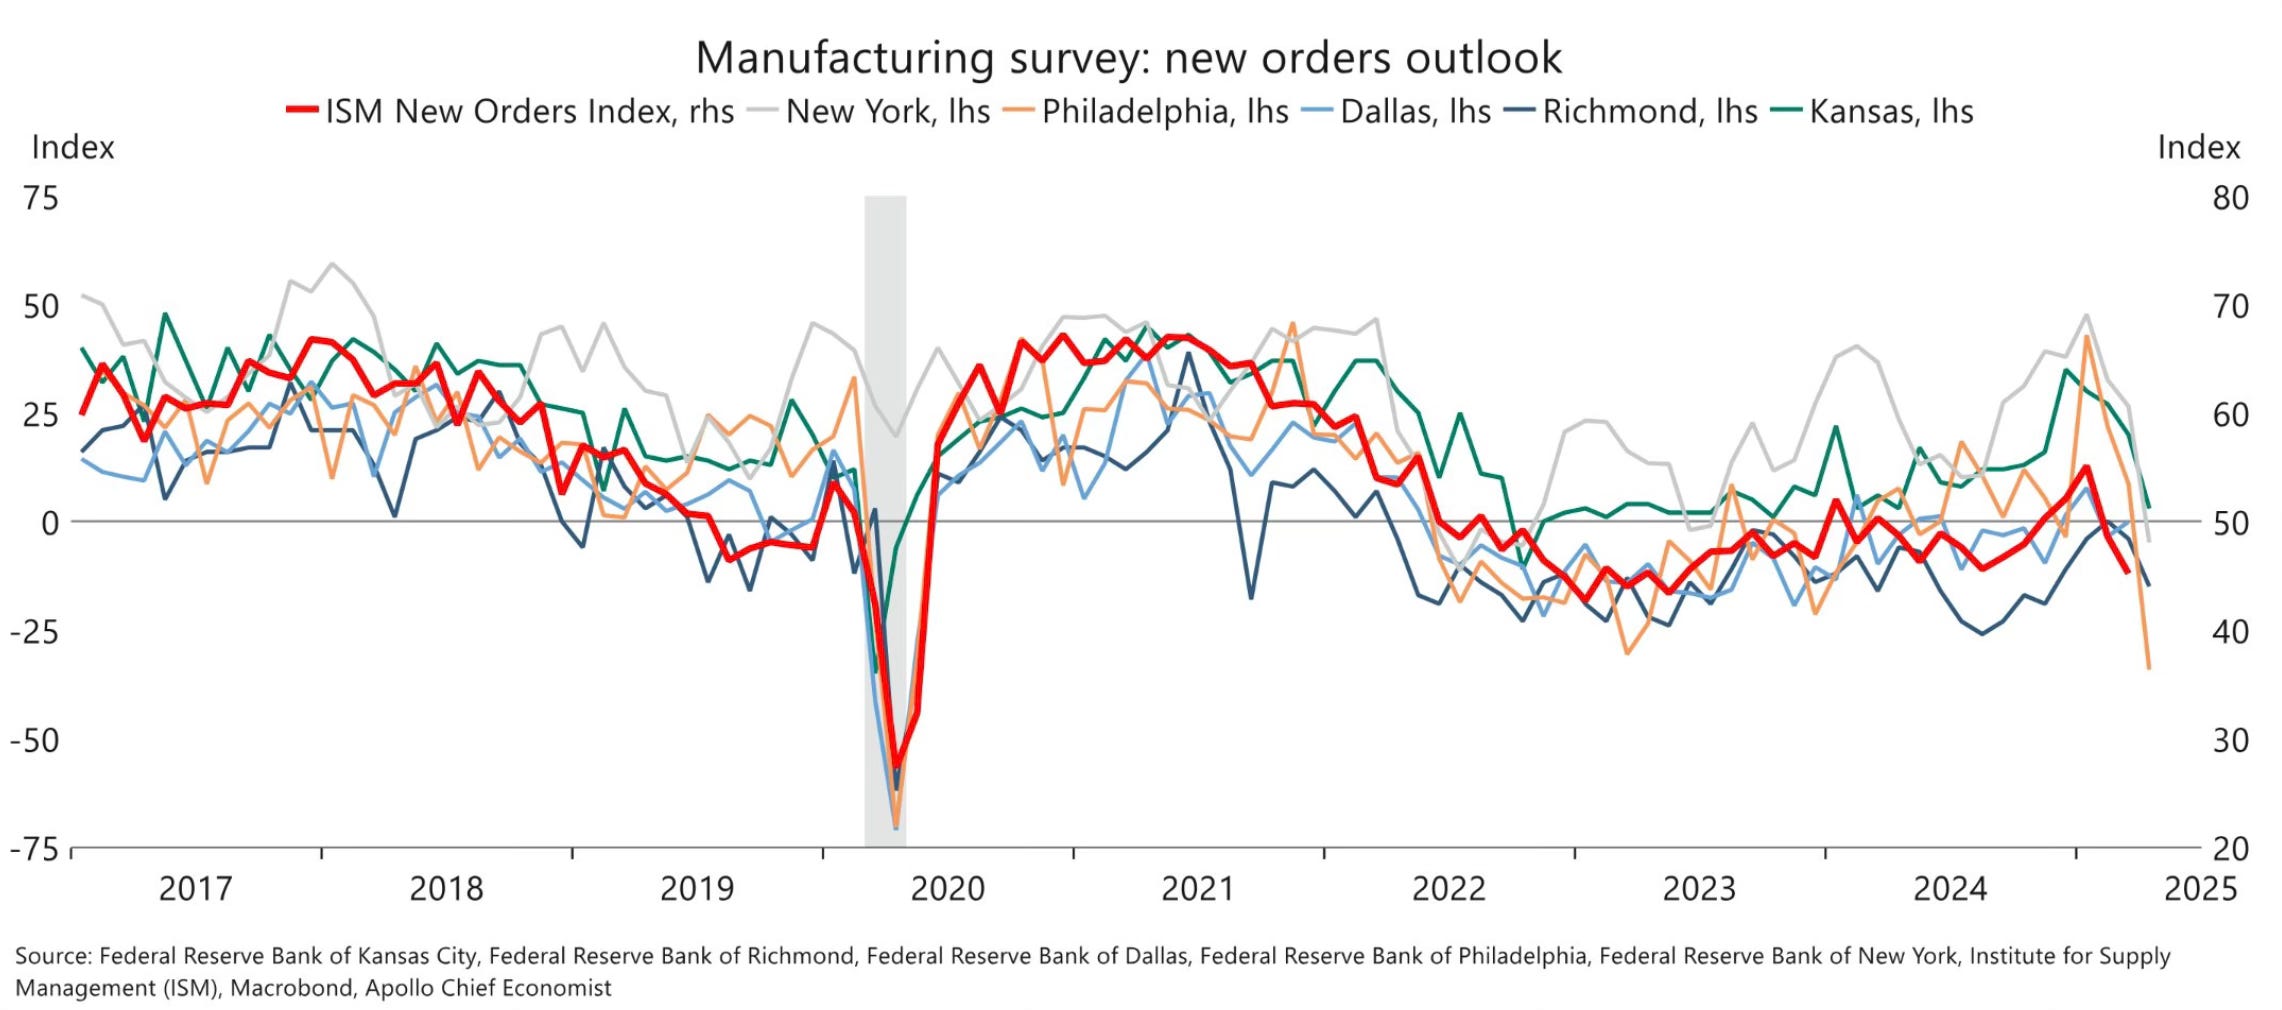
We’re also seeing U.S. manufacturing new orders collapse all across the country.
So here we all sit on recession watch again. Will Q2 show another negative GDP number?
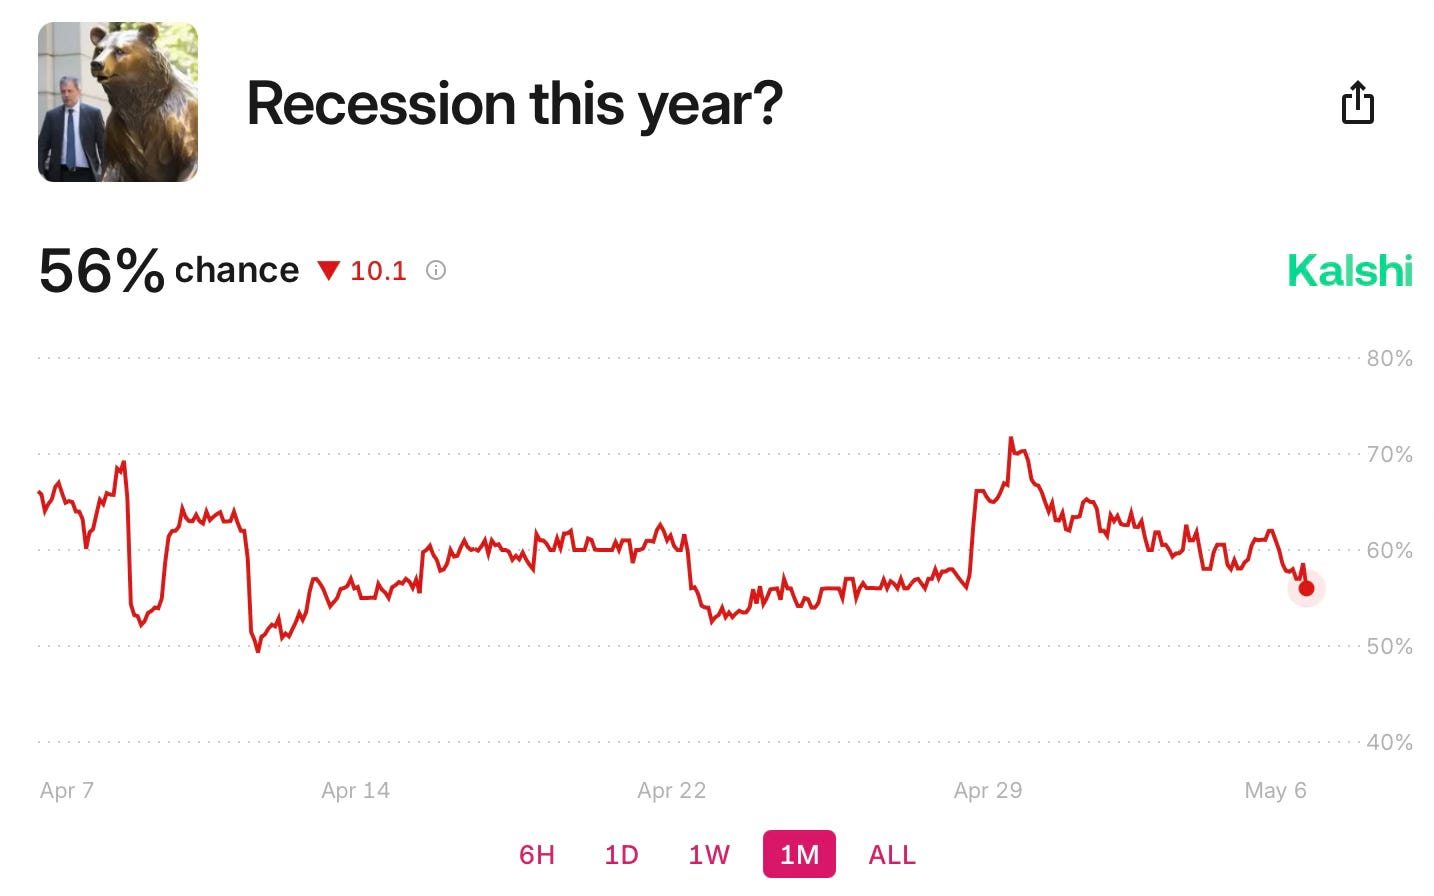
The betting market on Kashi had the odds of a recession this year at the high of 72.1% on April 29th. Today that percentage is down to 56%.
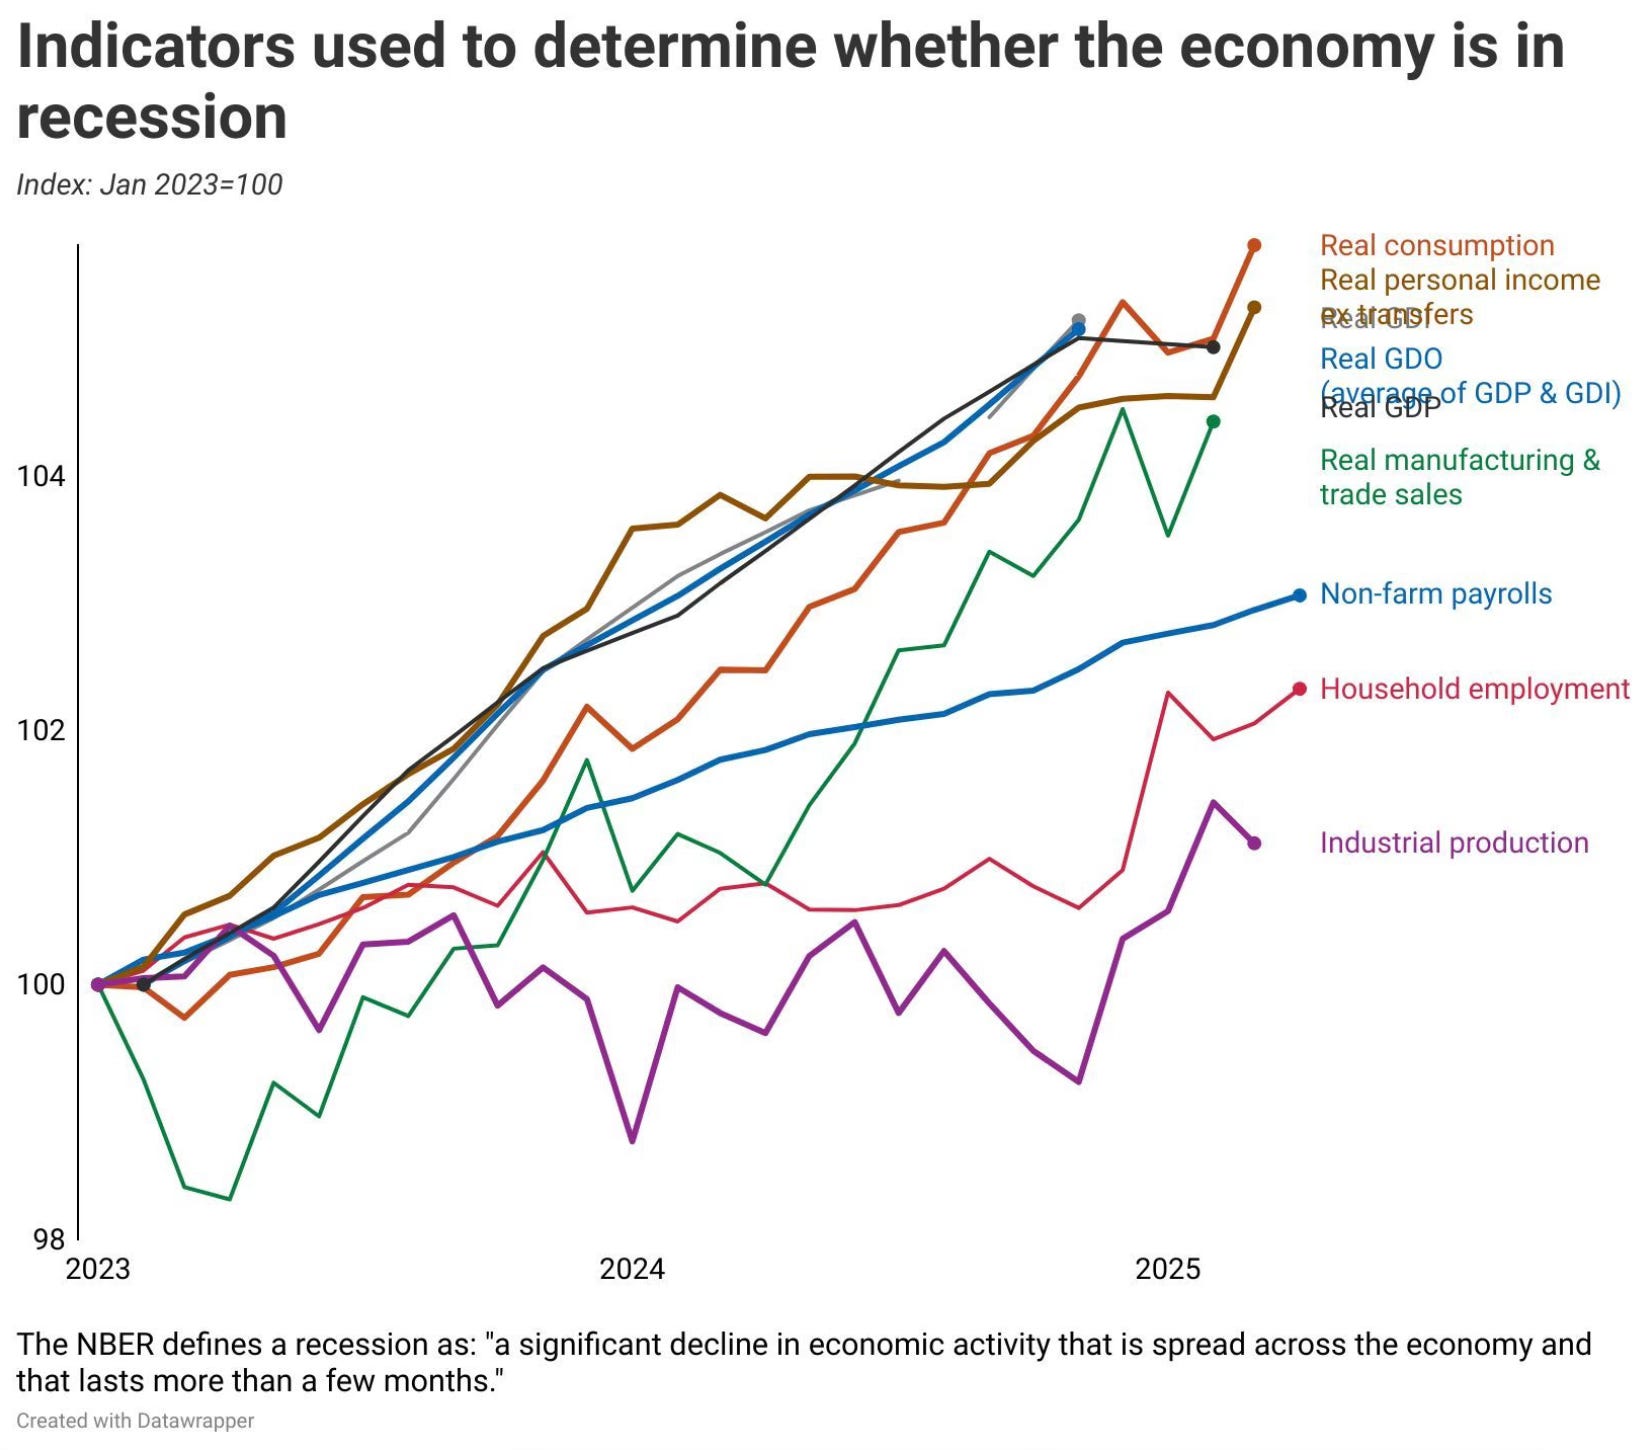
Now if we look at my favorite recession watch chart from Justin Wolfers. It doesn’t show any worrisome signs yet. Things still look good.
There is loads of uncertainty, but I don’t see Q2 GDP coming in negative. I still stick by that we start to see some trade deals coming in the next week or two. And the U.S. economy continues to be extremely resilient. Do you want to bet against America and the American consumer?
Even with the unknowns, I sure as heck am not.
The bottom line is the job market is holding up. The stock market isn’t acting like there will be a recession. A month ago I think that was a different story. It has since flipped and all those losses from the onset of the tariffs have vanished.
So why is the talk of recession so important to the stocks market. Investors are always so fearful of a recession. Why is that?
It’s because when recessions do happen, the stock market falls much further in those periods.
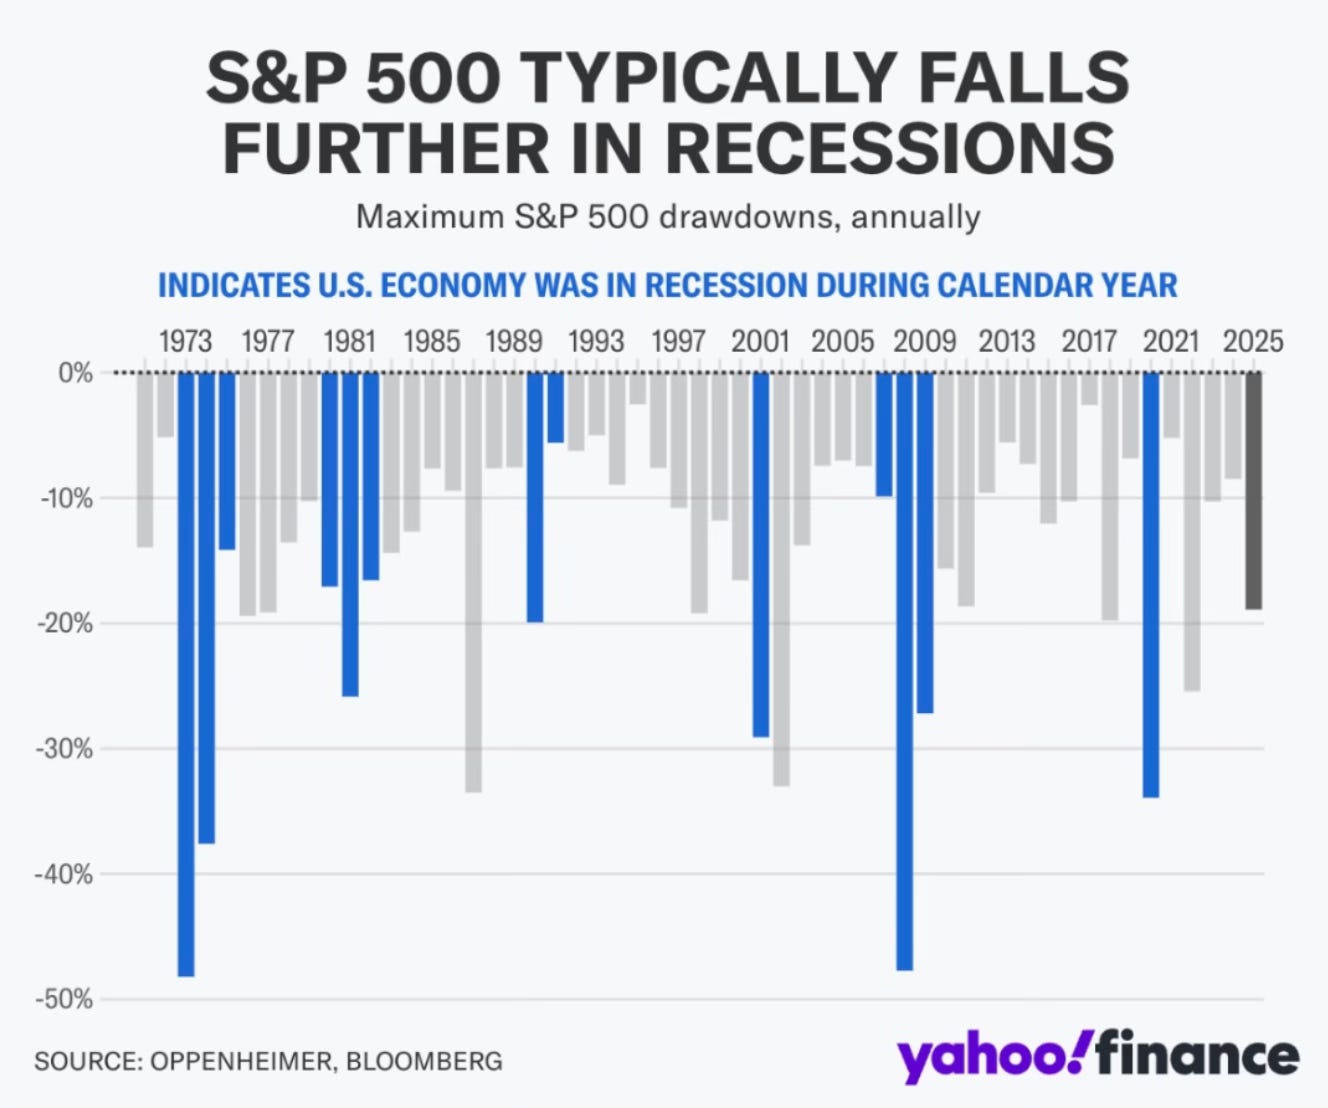
Now if we do fall into a recession, I do expect us to retest the lows of 4,835 for this cycle. It’s highly likely that set a lower low.
Right now the market isn’t pricing in a recession. It’s as if the market is pricing in that a trade war agreement happens. The price action over the last two weeks sure doesn’t indicate any fears of a recession.
If we don’t fall into a recession, the lows are in. With no recession, I actually expect the market to go back to all-time highs yet this year. I think it’s that simple.
The Coffee Table ☕
This was a very timely piece from Noah Smith Why do econ journalists keep making this basic mistake? He talks about how imports don’t subtract from GDP and that people need to stop saying that they do. This was a well written piece with good examples that I learned from.
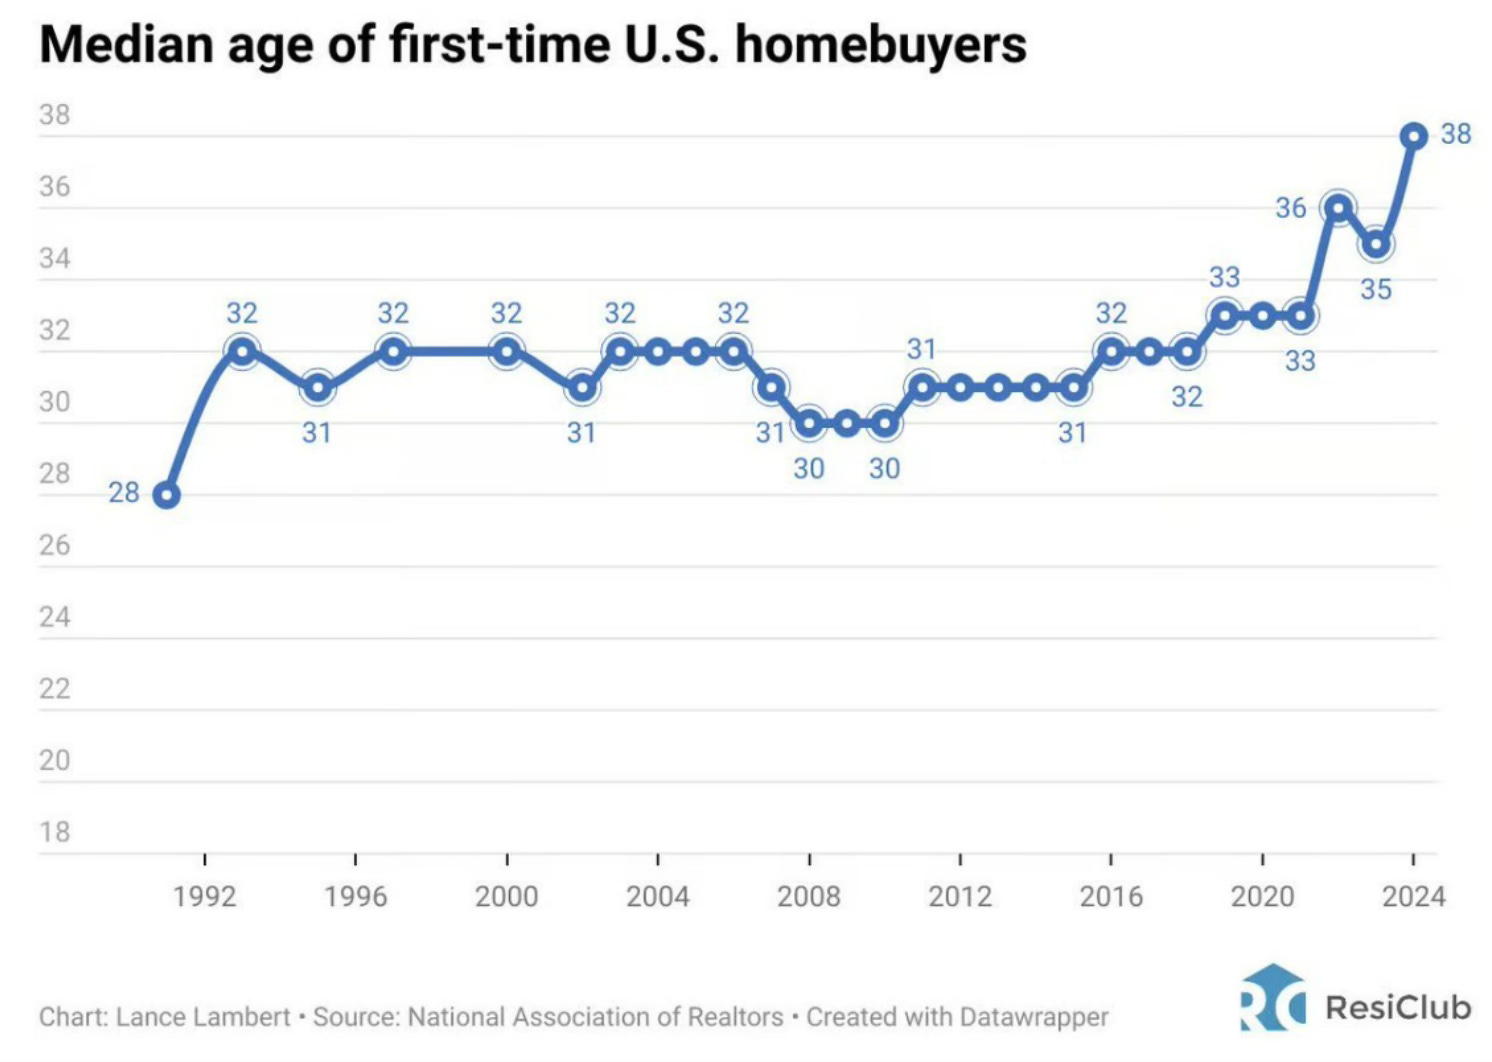
Ben Carlson had an interesting piece on When Does Housing Become THE Issue? What has happened with housing is interesting and I’ve pointed to this in past as well. At some point this will need to be addressed. I love this chart that shows how the median age of the first-time U.S. homebuyers has risen.

Thank you for reading! If you enjoyed Spilled Coffee, please subscribe.
Spilled Coffee grows through word of mouth. Please consider sharing this post with someone who might appreciate it.