
Housing is frozen. Mortgage rates are back above 7%. Contracts to buy homes fell 7.3% in September, and homebuilder confidence just hit its lowest level since 2012. A handful of familiar consumer names have been sliding.
And the S&P 500 is sitting near record highs.
Here’s the gap in one picture. Strip out Amazon and the typical consumer discretionary stock is down about 10% this year. The S&P 500 is up about 13%. That’s a 20-point spread.
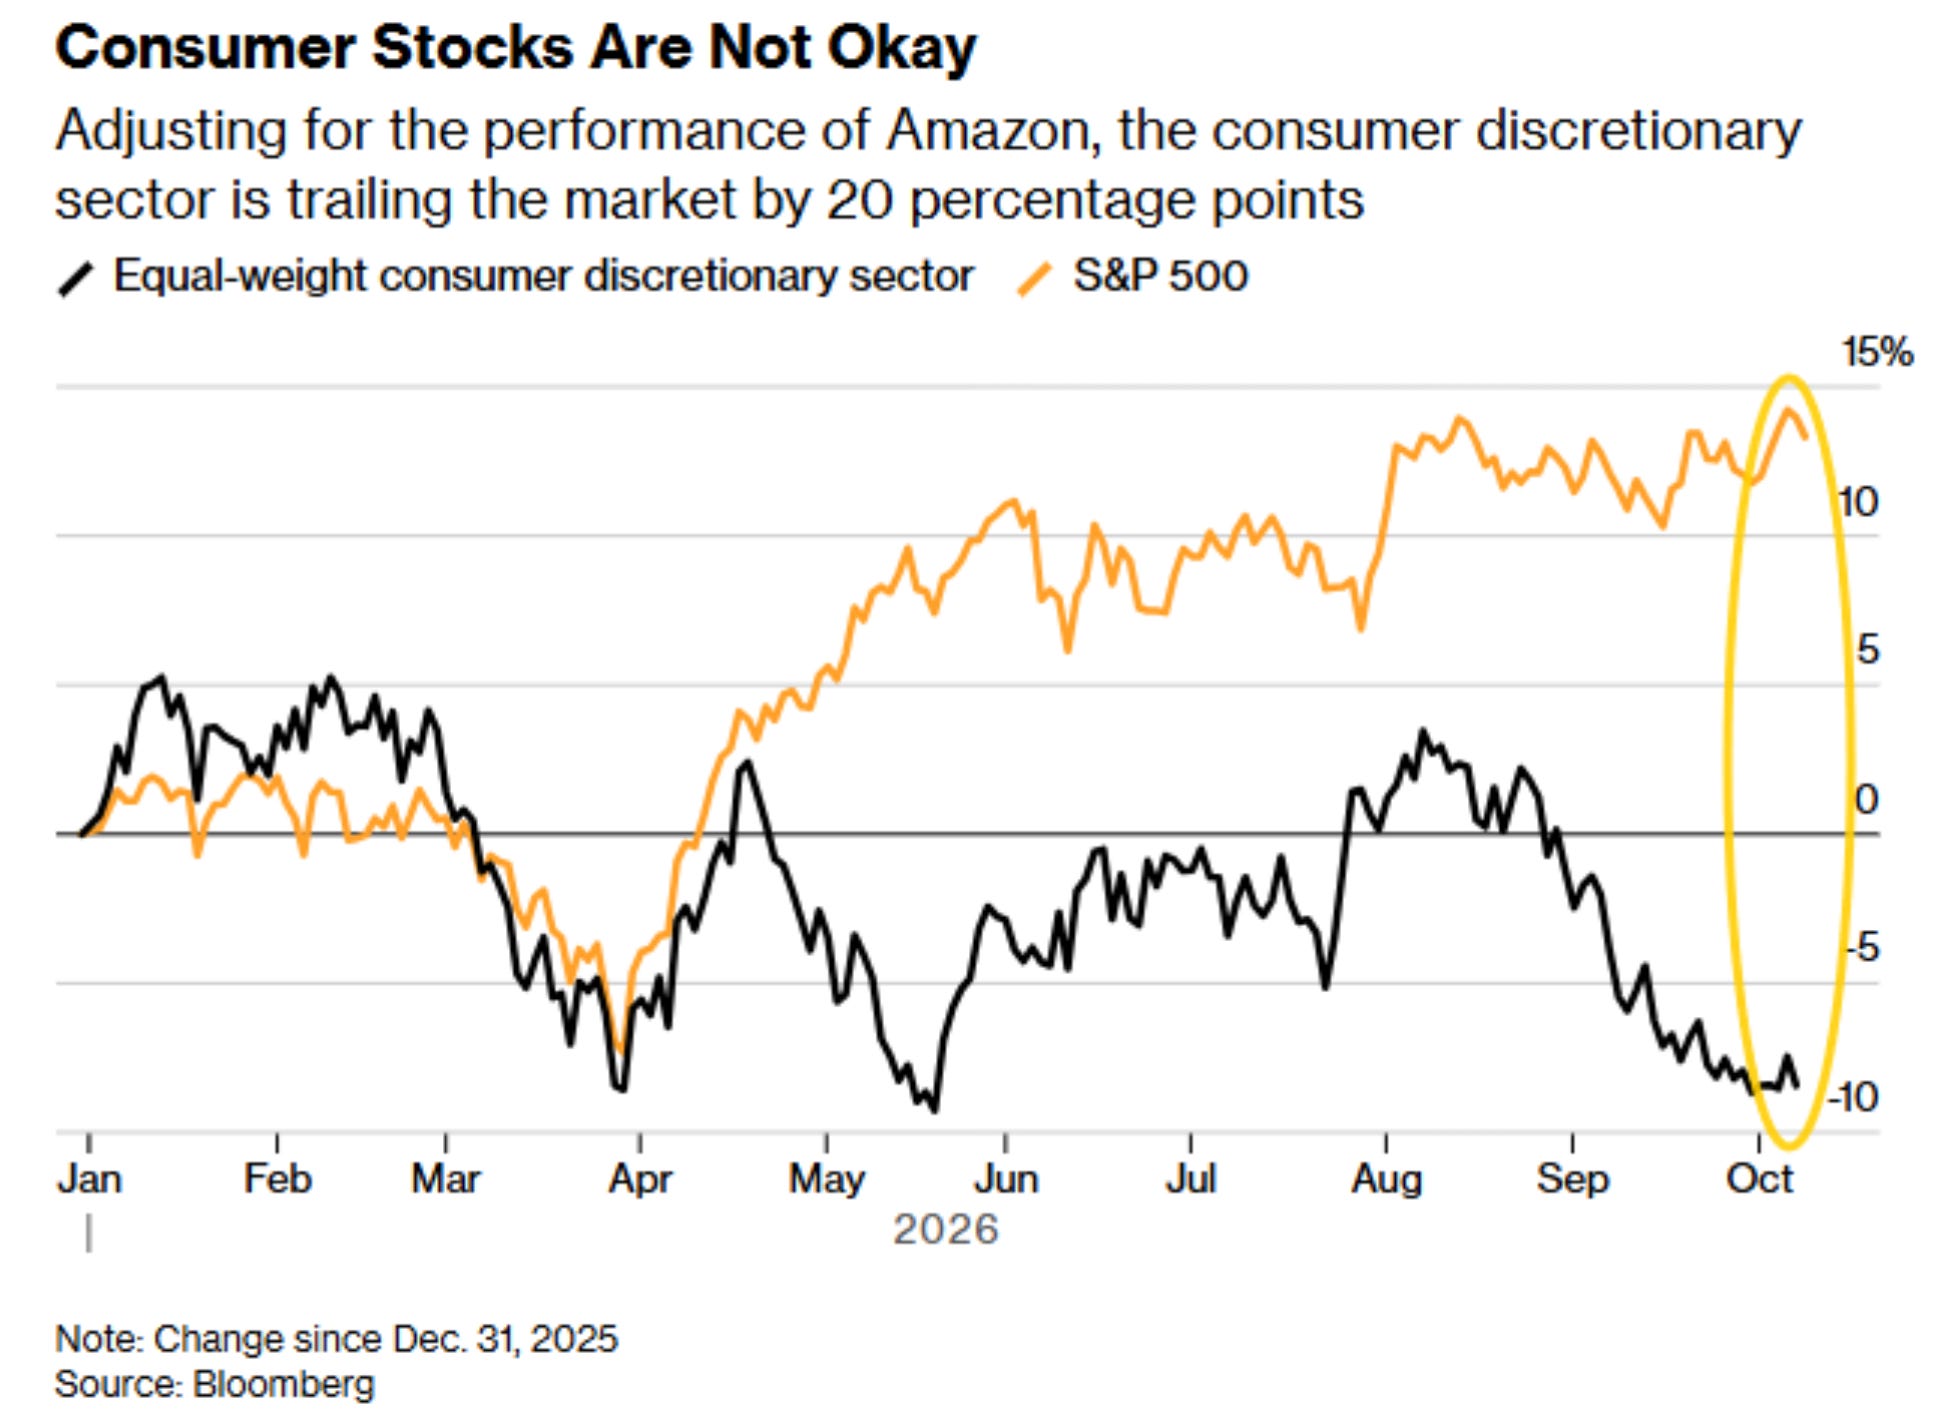
On the surface, it doesn’t make sense. I’ve had more than a few readers ask me some version of the same question lately. How does the market keep climbing when so much of the economy looks stuck?
It’s a fair question. But it’s the wrong comparison.
The Market Isn’t Looking at Today
Most economic data tells you what already happened, and a lot of it gets revised later. The jobs report is last month. GDP is last quarter. Existing home sales are closings on contracts signed weeks earlier.
The stock market prices what comes next. As a rule of thumb, roughly 6 to 12 months out. Every share price is a bet on future earnings, discounted back to today.
That’s why stock prices are one of the Conference Board’s official leading economic indicators. The unemployment rate is a lagging one.
So when the market and the economy disagree, you’re not comparing two opinions about the same thing. You’re comparing a forecast to a rearview mirror.
Of course they look different.
The better question isn’t whether the market makes sense today. It’s whether it tends to make sense later. And on that, history has a lot to say.
It Looked Crazy at the Time
Every one of these looked wrong in the moment.
1982. The S&P 500 bottomed in August. Unemployment was still climbing and peaked at 10.8% that November, the highest since 1941. Anyone waiting for the jobs picture to improve missed the launch of one of the great bull runs of the century.
2009. The market bottomed on March 9. The economy was still in free fall. The February jobs report showed 651,000 jobs lost. Unemployment kept rising for seven more months, peaking at 10% in October. By then, the S&P was already 52% off its low. The bottom was in before most people believed the recession was even half over.
2020. The S&P bottomed on March 23. By August 18 it was at a new all-time high, up 51% in five months. Unemployment was still 10.2%. Plenty of smart people called it a disconnect. Twelve months later, with vaccines rolling out and earnings at records, the market had simply seen it first.
2023. Heading into the year, 40 of 44 economists in a Bloomberg survey expected a recession. Wall Street strategists, on average, forecast the S&P would finish 2023 around 4,078. It closed at 4,770, up 24%. The recession never showed up.
The pattern is clear. The market often turns before the economic data confirms a recovery. By the time it does, much of the rally is already gone.
And this isn’t cherry-picking. Writing in March 2009, Fisher Investments ran the same test with data back to the 1920s and found the market turned up before unemployment peaked every time. Their sample is longer than mine, so their average lead runs a bit longer, about nine months. They also found the market gained close to 40% on average between the bottom and the unemployment peak.
If you waited for the jobs report to tell you it was safe, you missed most of it.
Here’s what that looks like across every recession of the last 55 years.
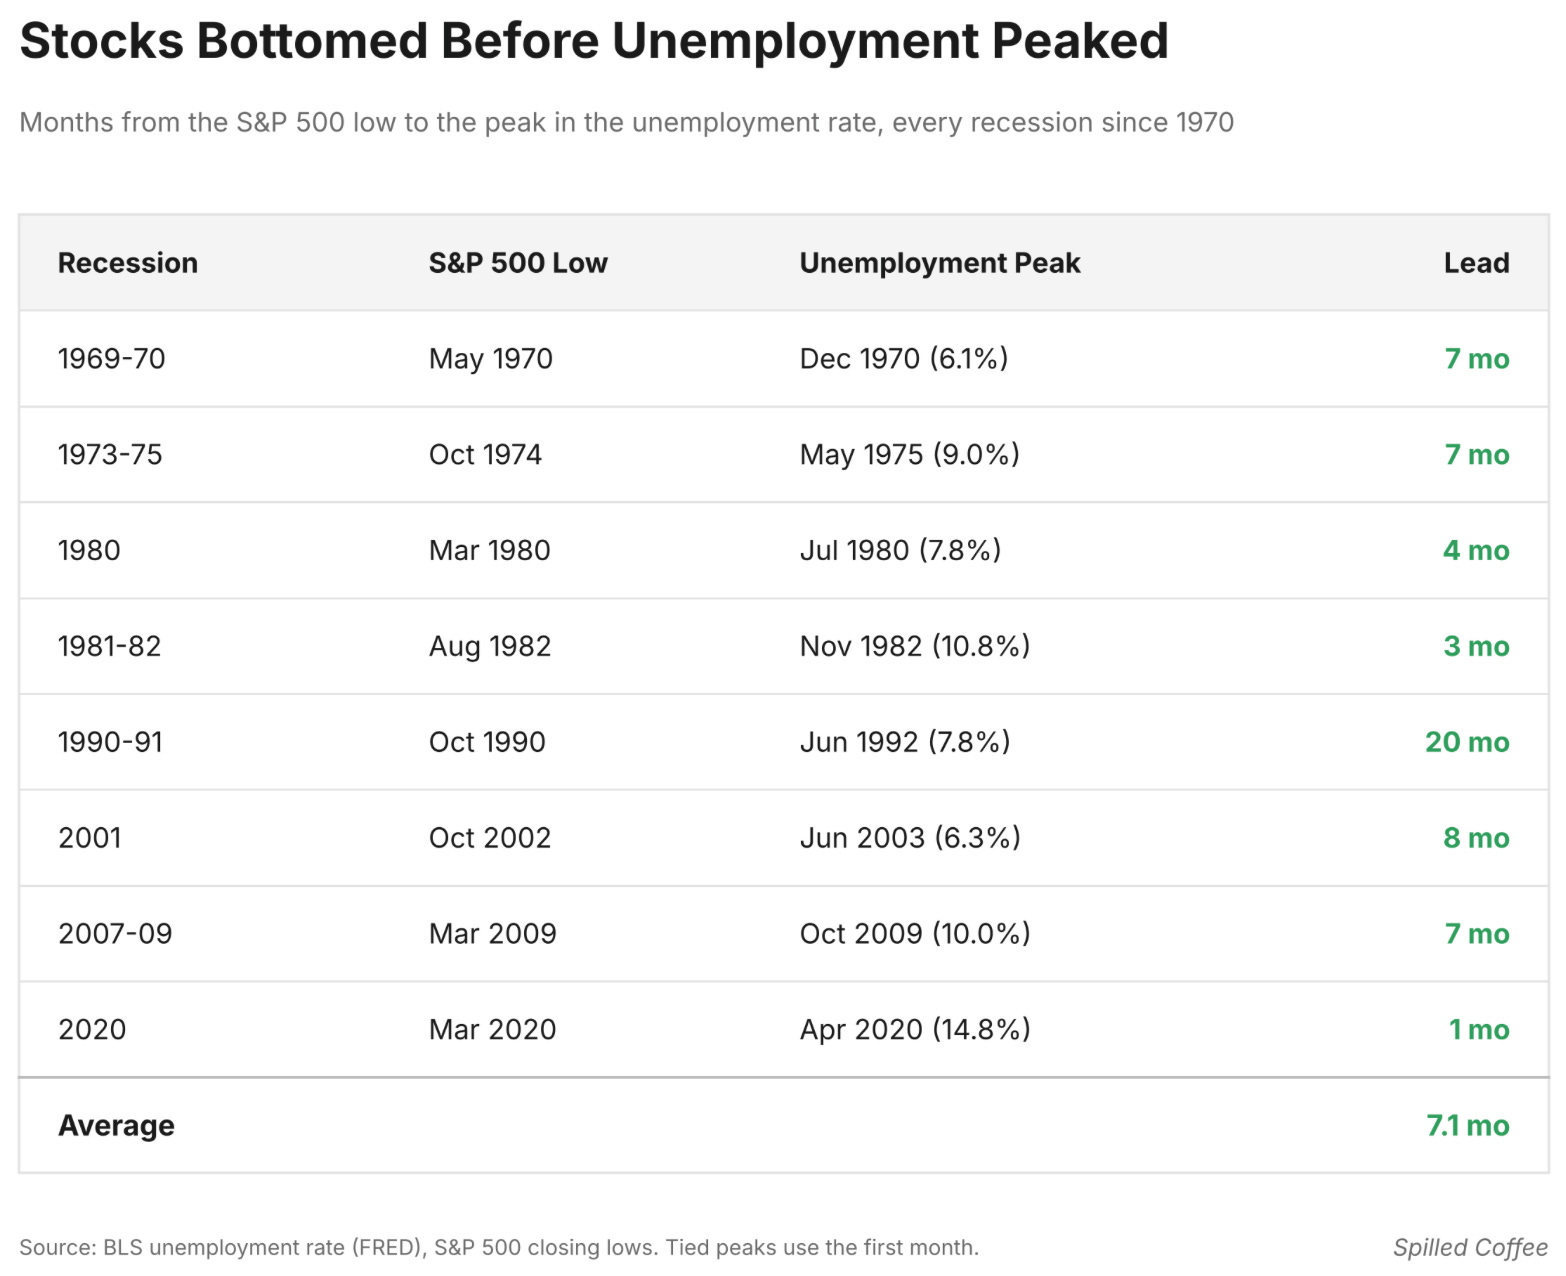
Eight recessions. Eight times the market turned first. The 1990s recovery stands out, with stocks bottoming 20 months before unemployment finally peaked. The 2020 lead was just one month because the whole cycle happened at warp speed.
One thing this chart doesn’t tell you. Every example here is a market recovering from a big selloff. Today’s market is near record highs. The lesson still applies, but this isn’t March 2009. The point isn’t that every disconnect ends in a rally. It’s that today’s data is a poor way to judge a forward-looking price.
When the Market Got It Wrong
But let’s not oversell it. The market is a forecaster, and forecasters miss.
Economist Paul Samuelson famously joked in 1966 that the stock market had predicted nine of the last five recessions. He wasn’t wrong.
1987. The S&P fell more than 20% in a single day on Black Monday. But no recession followed. Stocks collapsed. The economy didn’t follow them down.
2022. The S&P dropped about 25% from January to October on surging rates and widespread recession fears. The recession never came. The market spent 2023 un-pricing it.
2000. This is the one that matters most right now. The market was right about the internet. Completely right. It changed everything. But the Nasdaq still fell 78% from peak to trough, and Amazon dropped more than 90% before it became Amazon.
And here’s the part most people miss. Stocks didn’t wait for the spending to roll over. The Nasdaq 100 peaked about nine months before tech investment did. Companies were still pouring money into the buildout while the market was already heading for the exits.
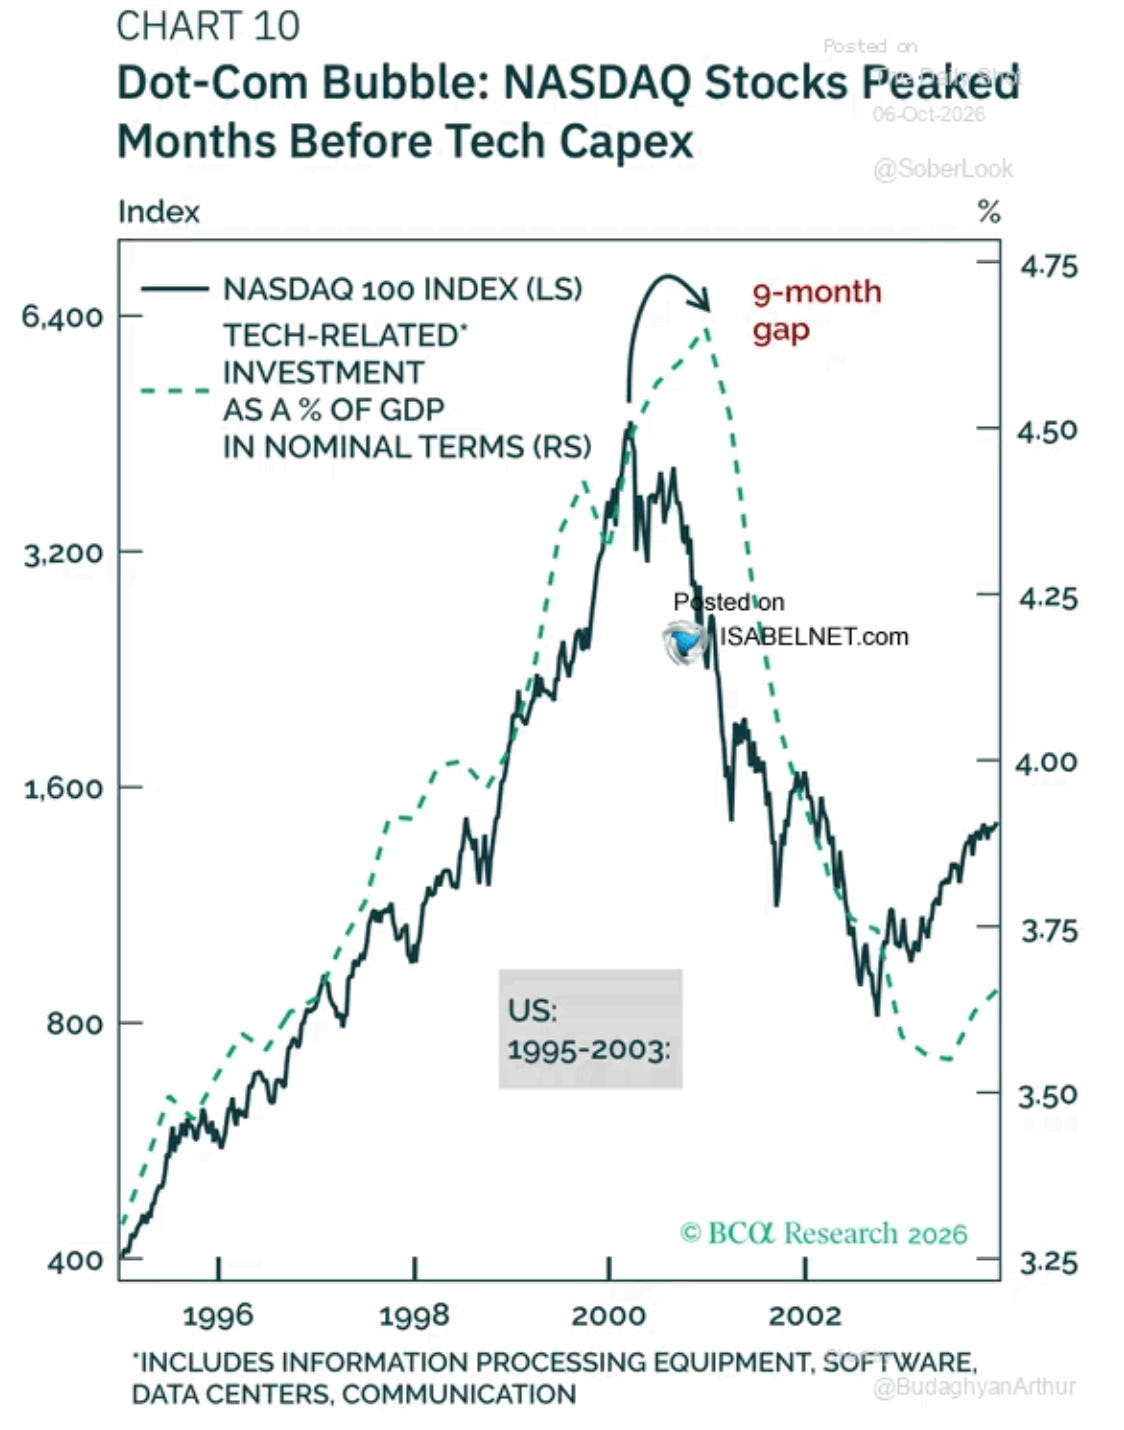
The market didn’t need the capex data to tell it the party was ending. It saw it first. Same lesson, pointed the other way.
Notice the pattern in the misses. The market can identify the right future and still get the price wrong. It sees a transformation coming and assumes the payoff will be faster or bigger than it turns out to be.
Being right about the story isn’t the same as being right about the price.