
Investing Update: Why So Bearish?
What I'm buying, selling & watching
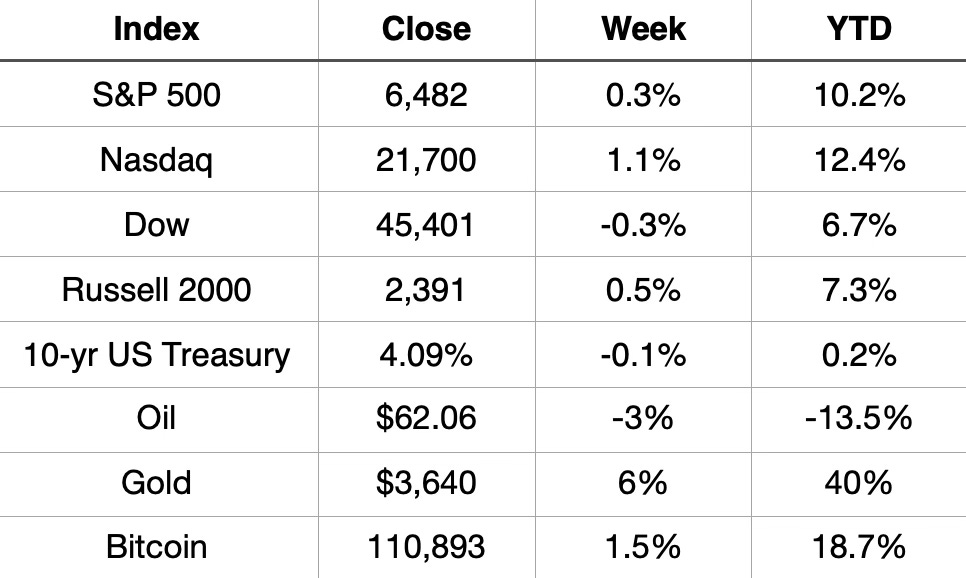
The holiday-shortened week saw both the S&P 500 and Nasdaq finish higher. The Dow ended the week lower.
YTD the S&P 500 is up 10.2%, the Nasdaq is up 12.4% and the Dow is up 6.7%.
Market Recap
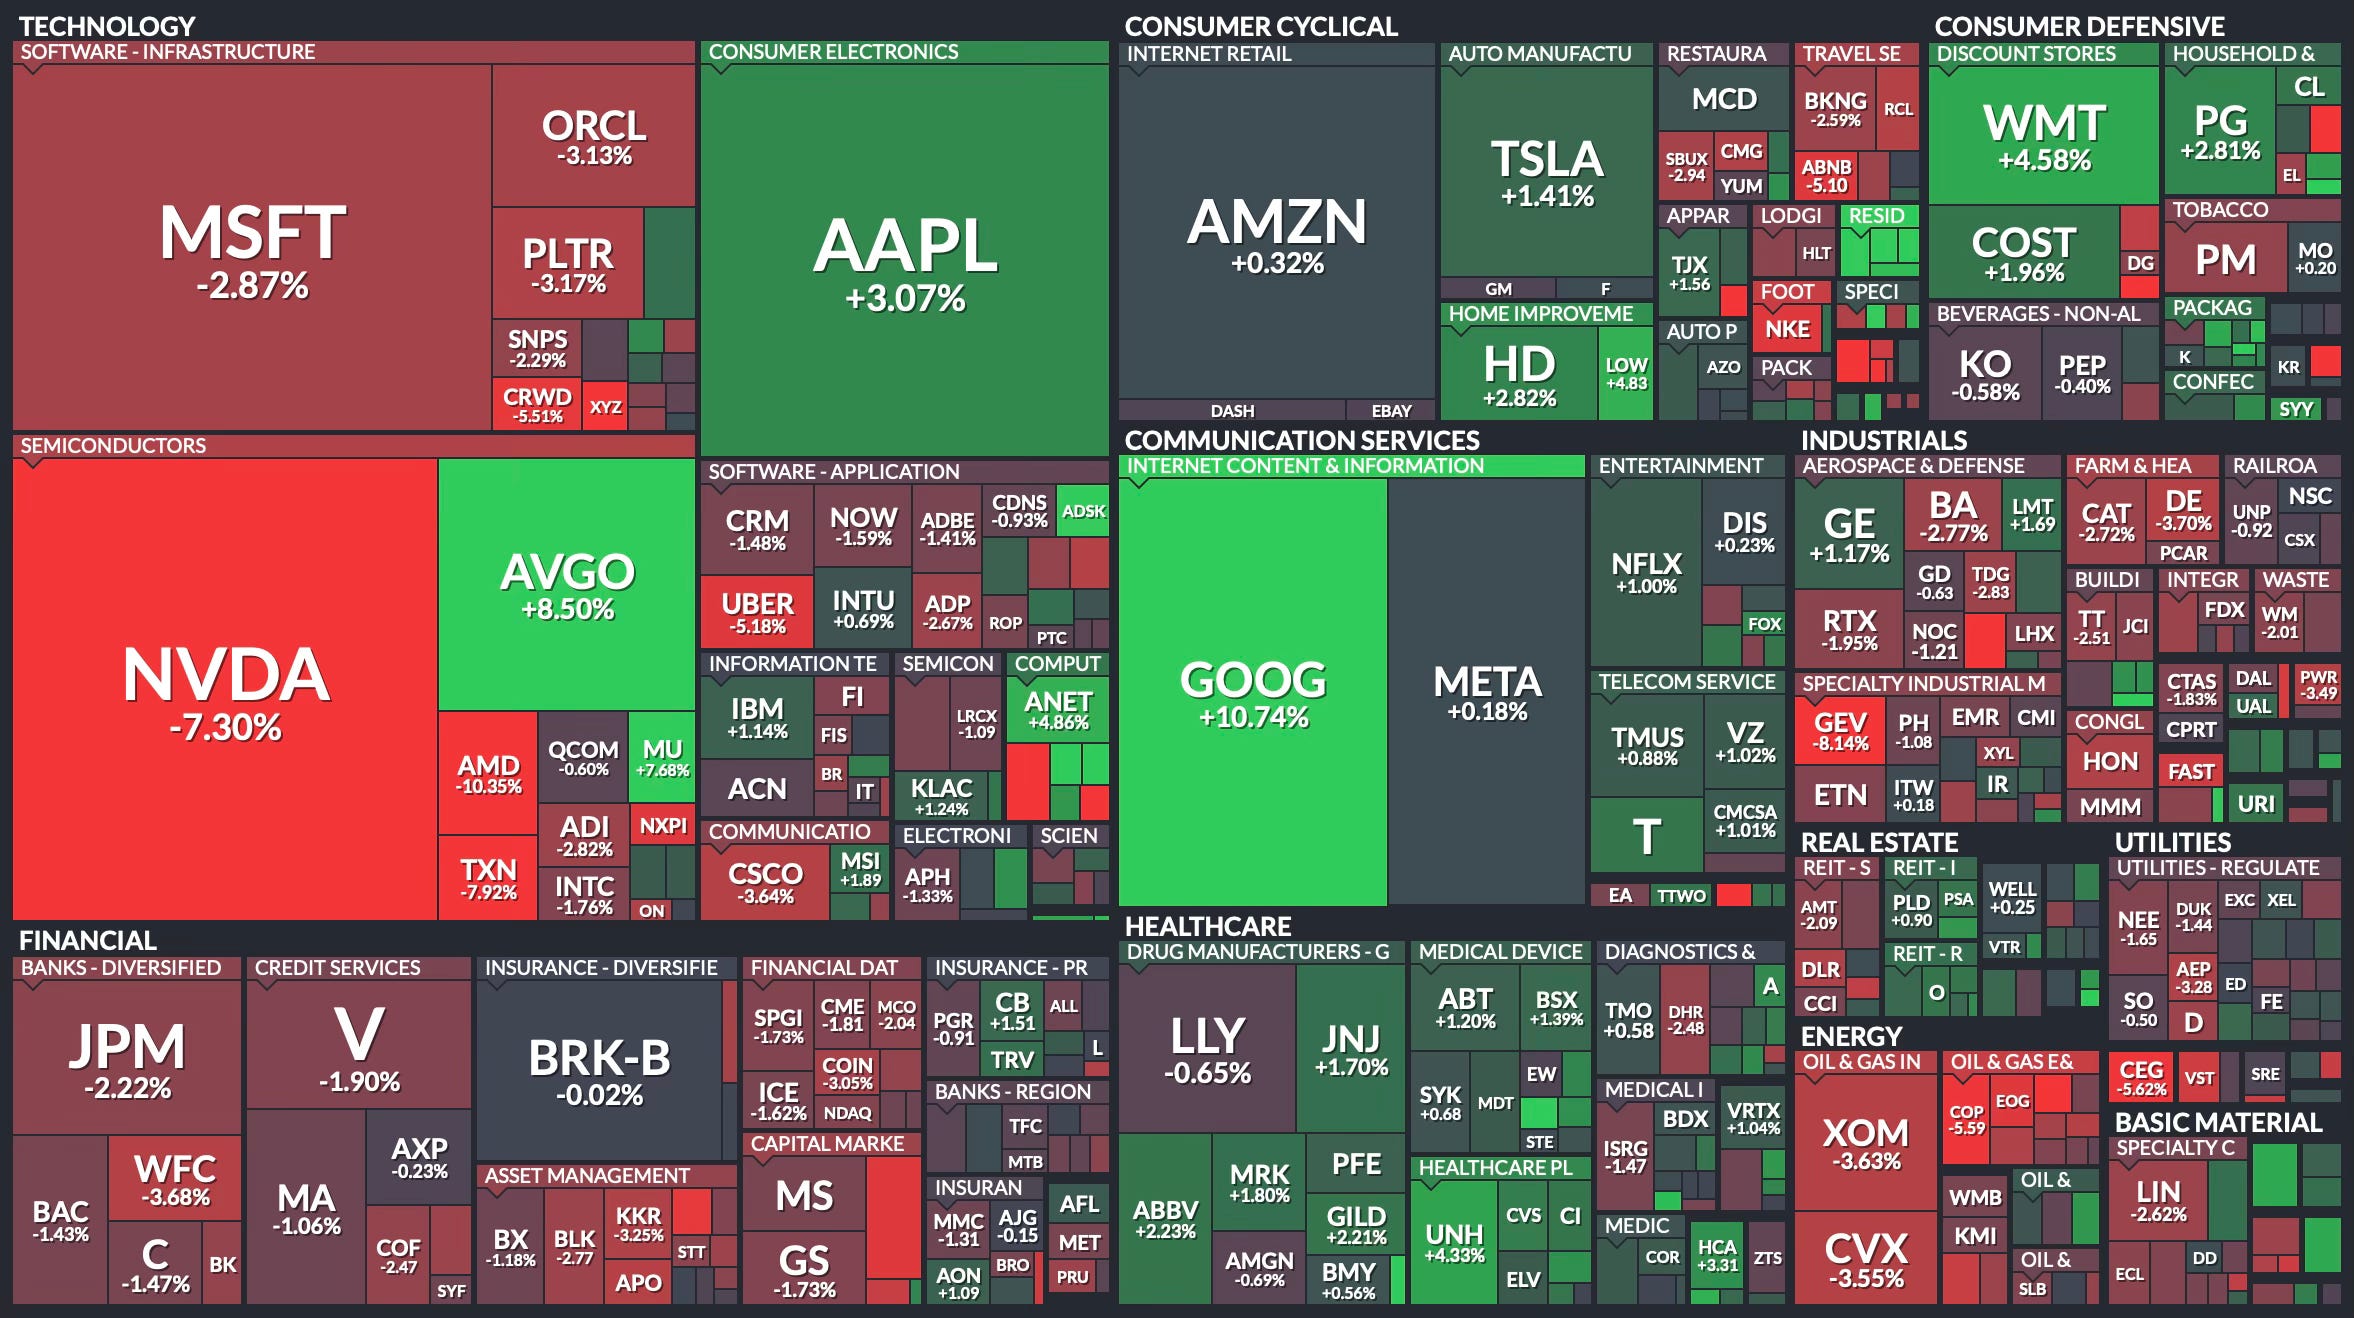
Weekly Heat Map Of Stocks
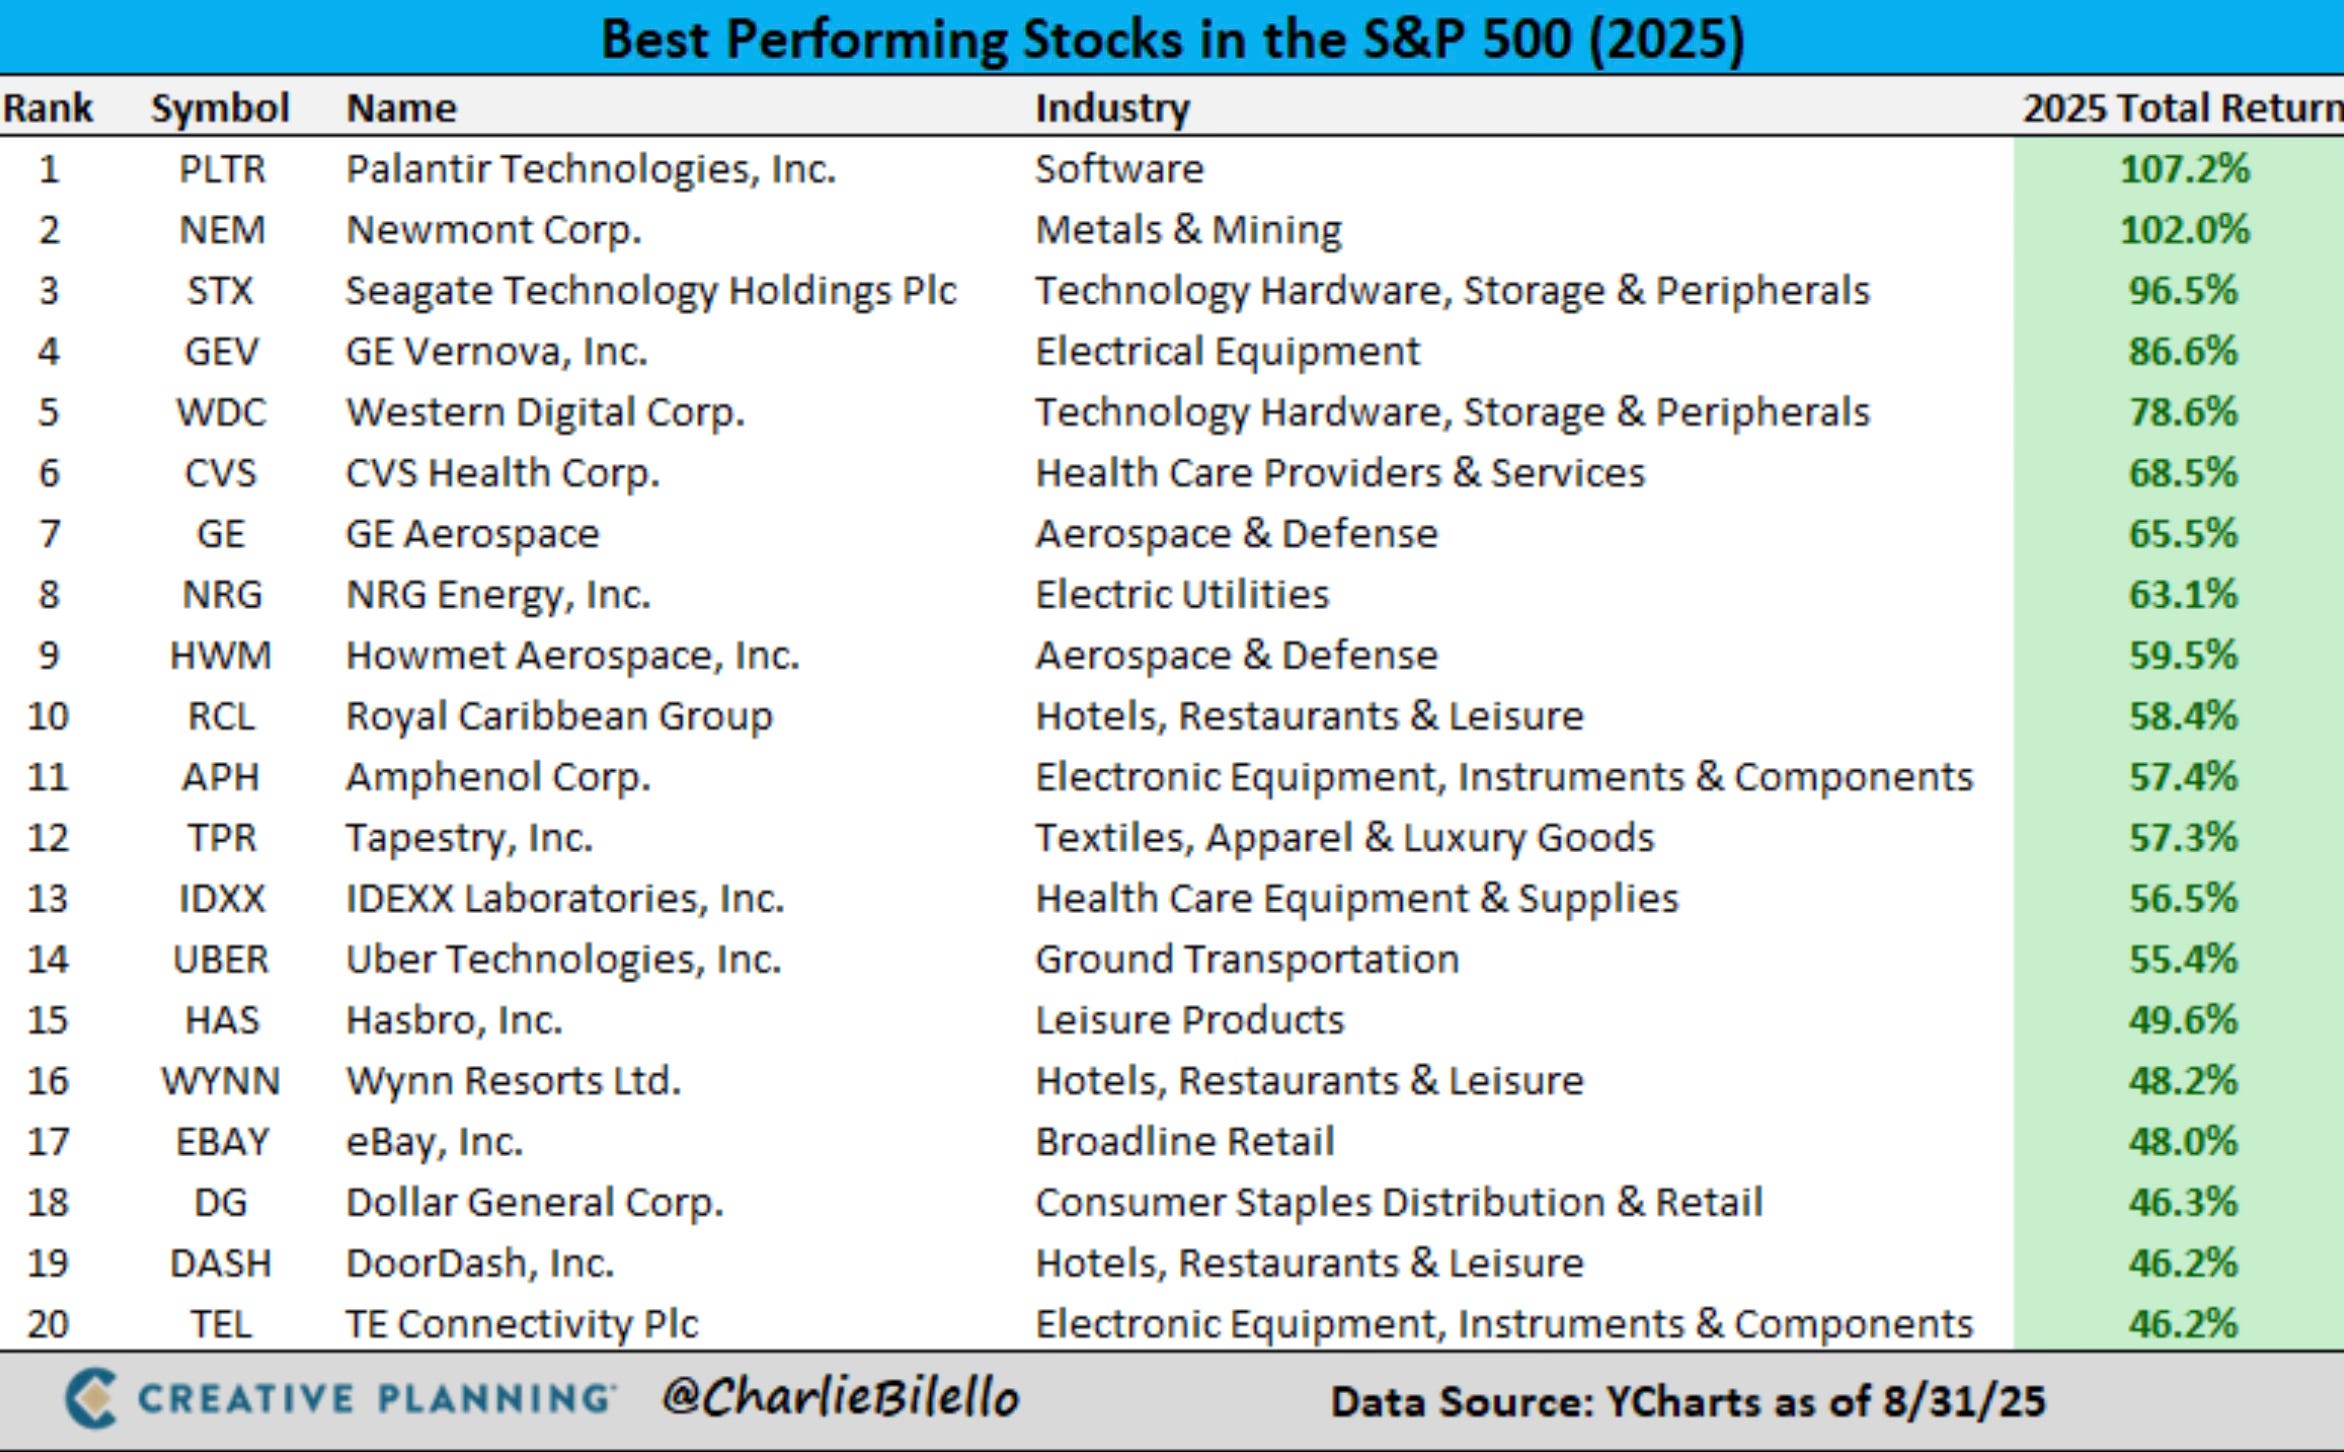
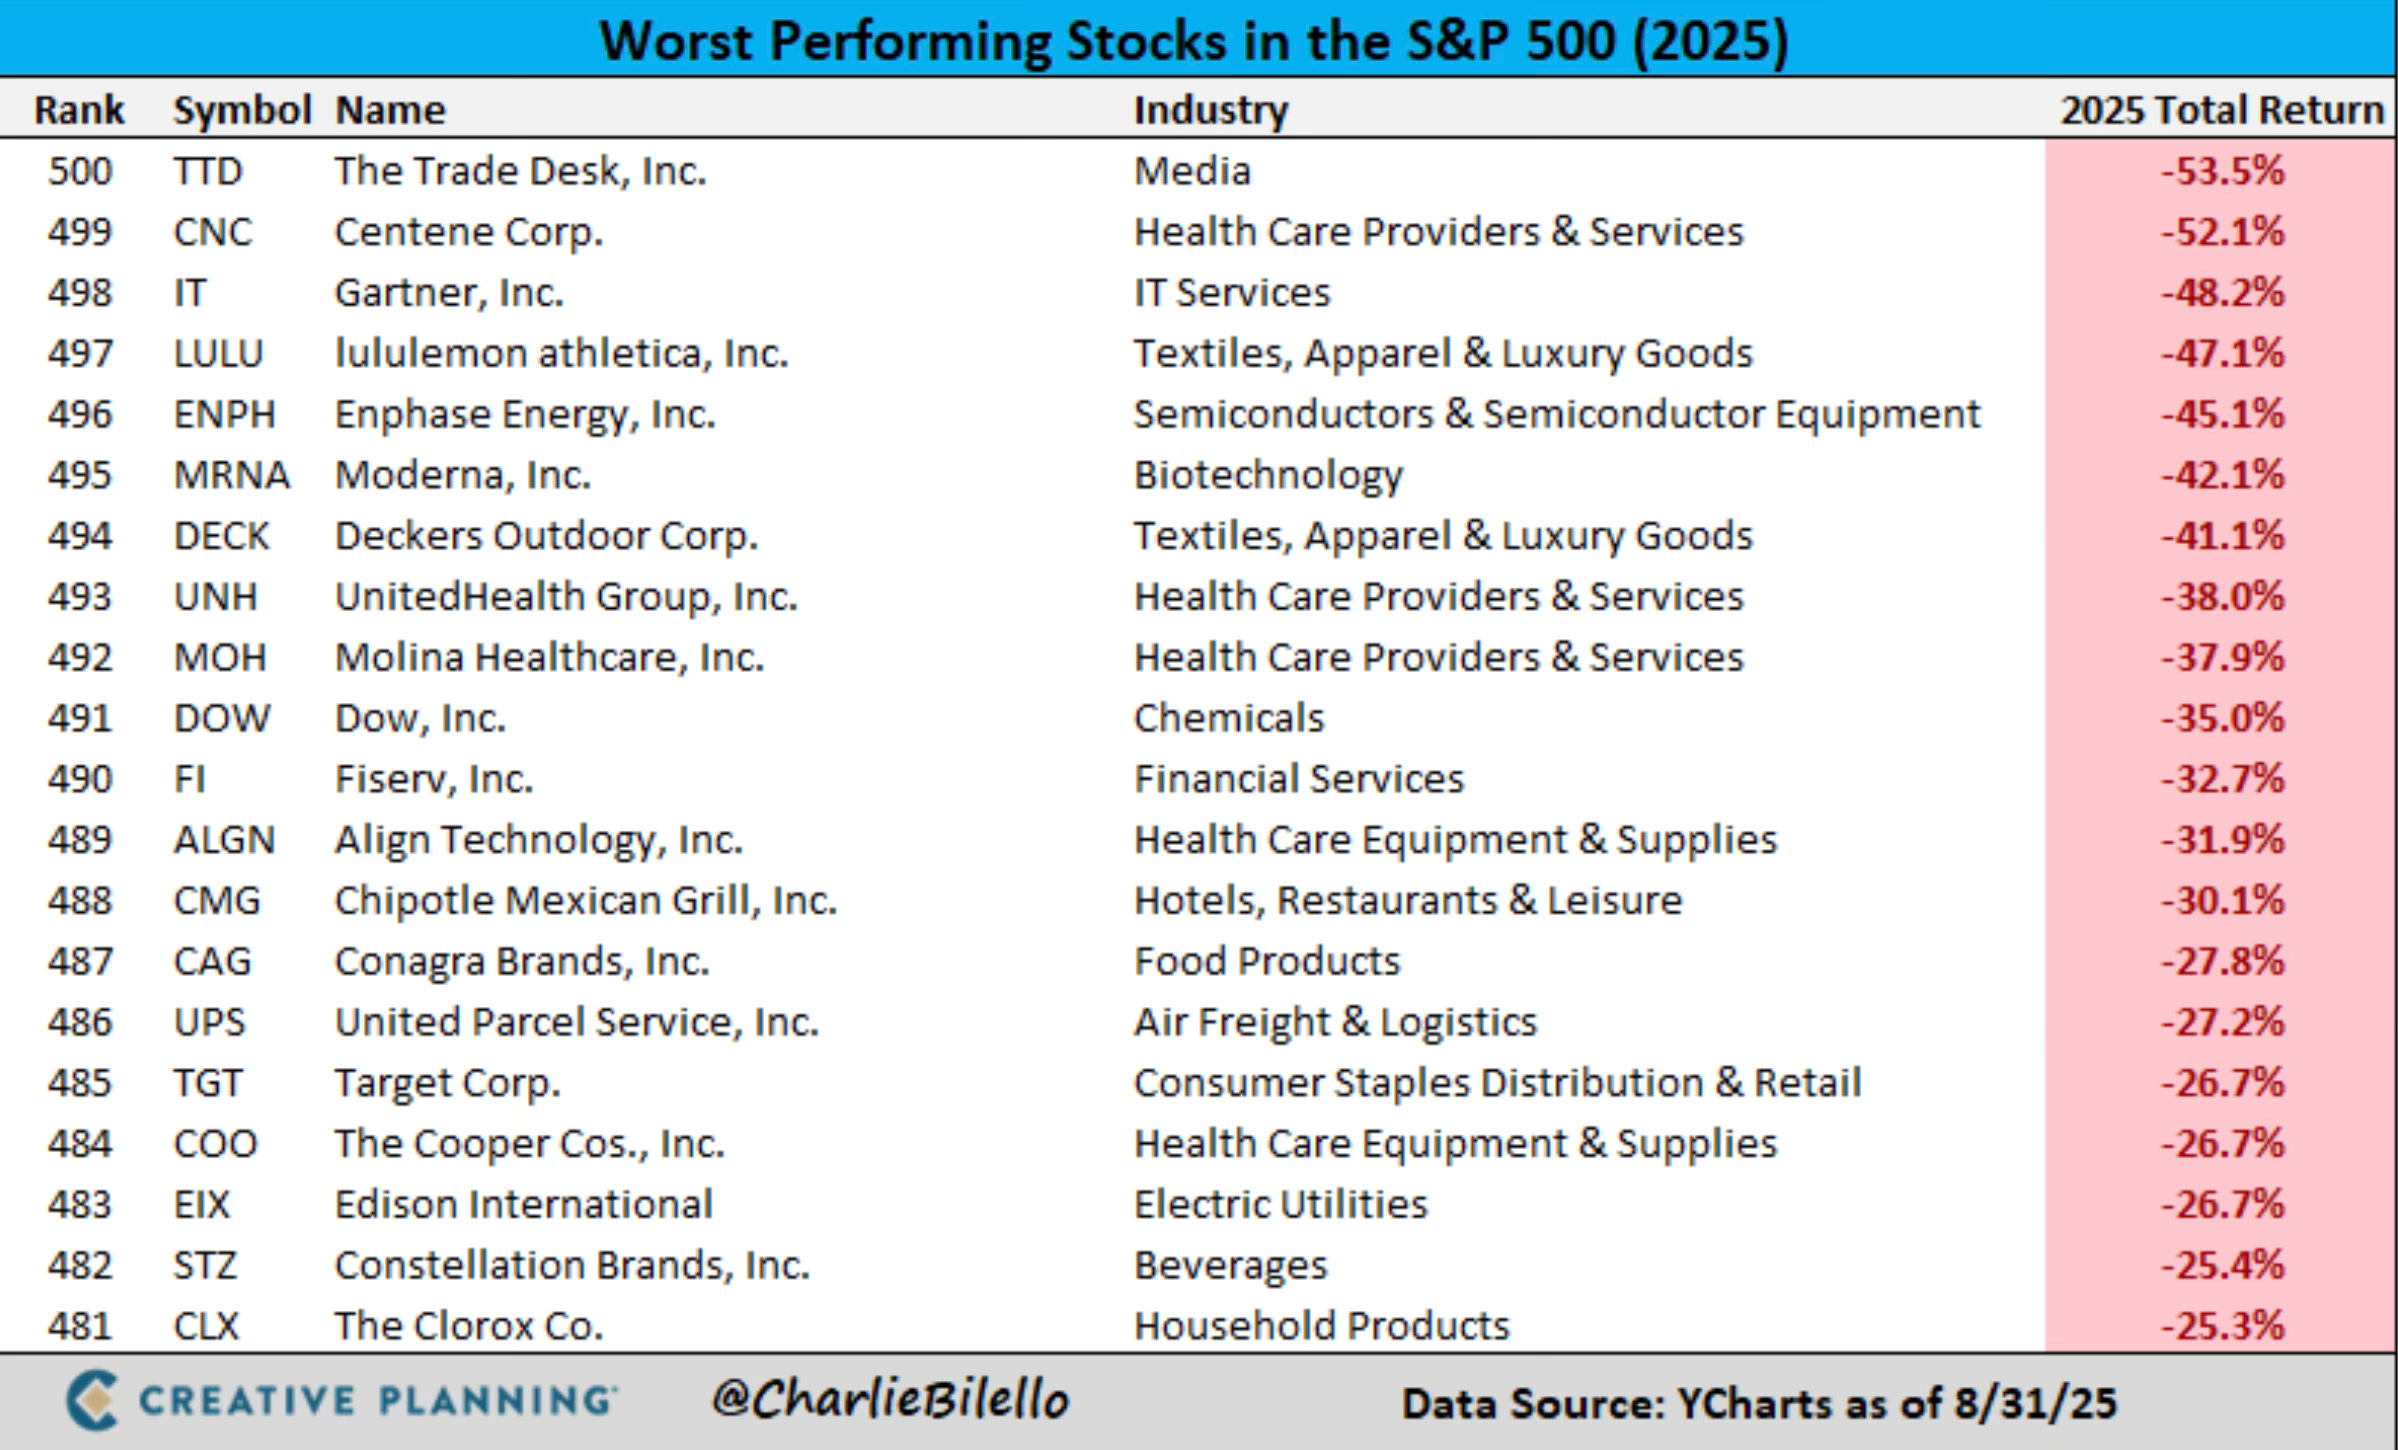
Best & Worst S&P 500 Performers YTD
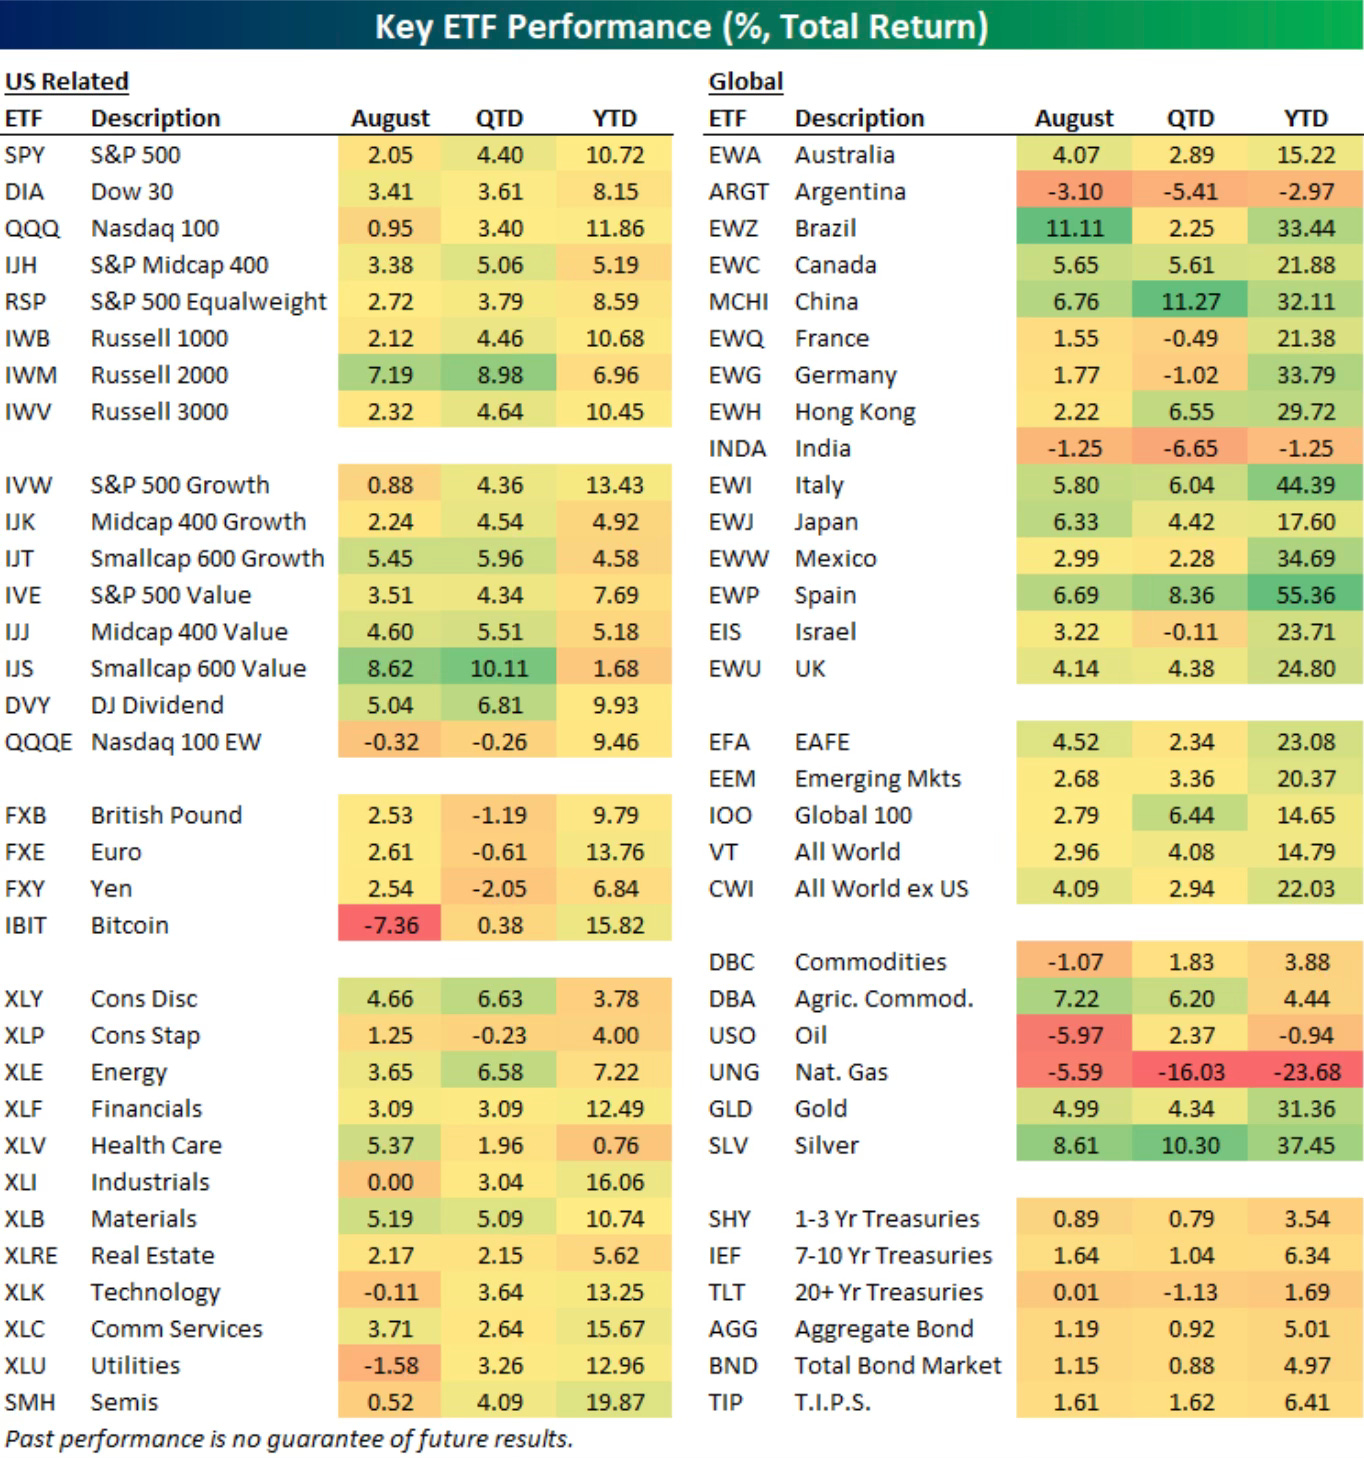
ETF Performance YTD
This week showed that there are very clear signs that the U.S. labor market is softening.
Friday’s jobs report showed just 22,000 jobs added in August, well below expectations of 75,000.
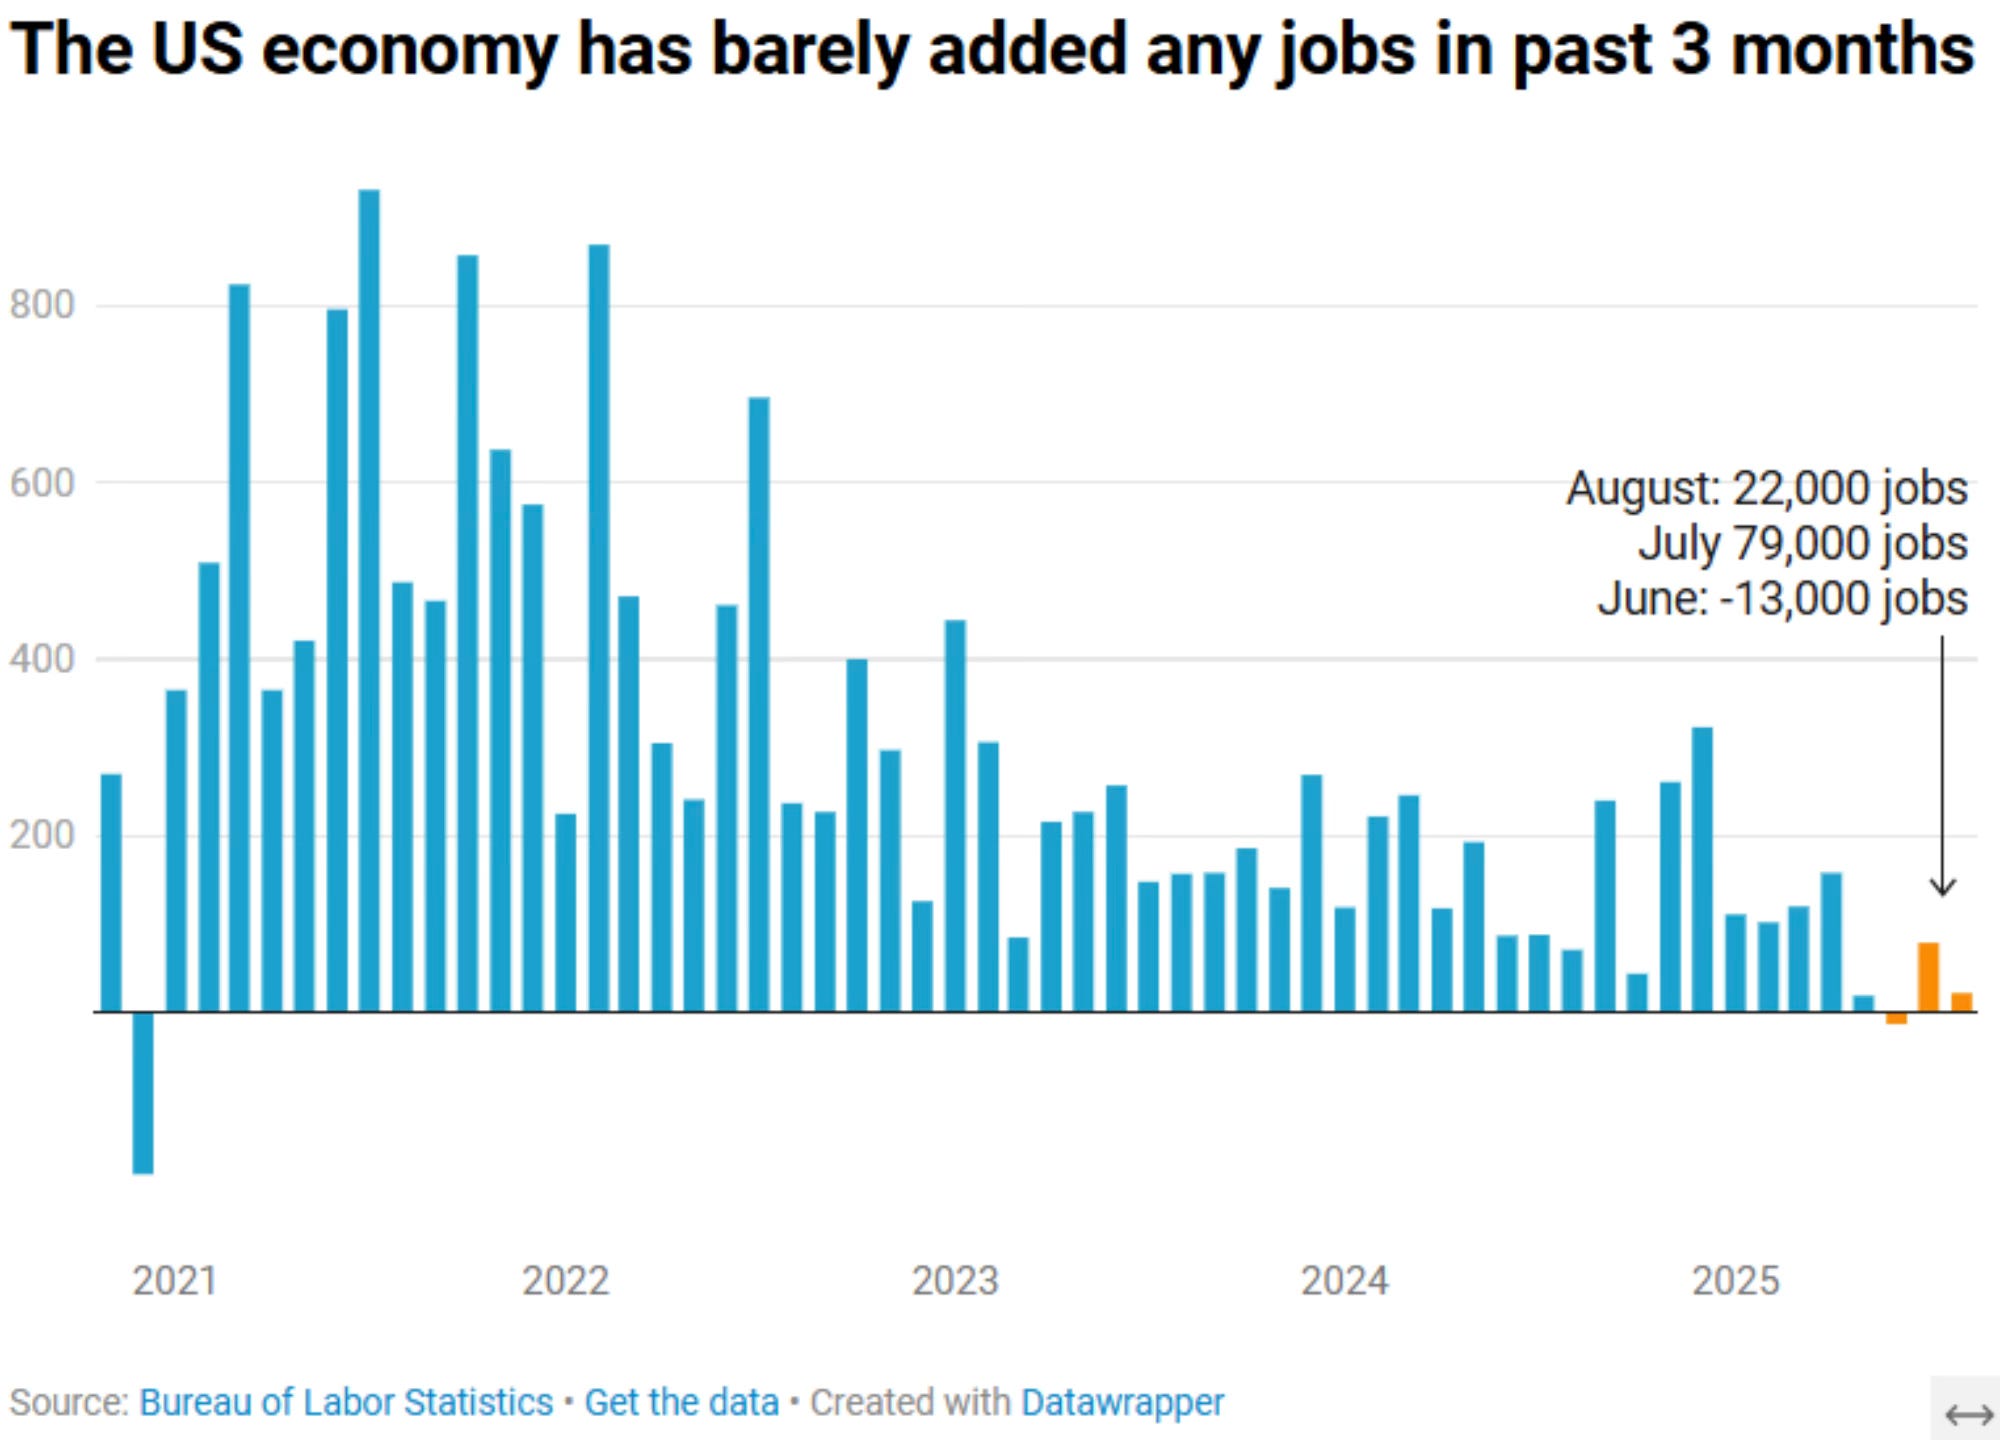
Over the past 3 months, the U.S. economy has hardly added any jobs. This has caused concern and there is a slew of data that came out this week that called into question the strength of the U.S. economy.
There is so much noise around jobs and the economy that I will be putting together a separate piece on this which will come out on Wednesday. Yes, there is that much and some cracks are showing in certain areas and I think it’s worth discussing in detail.
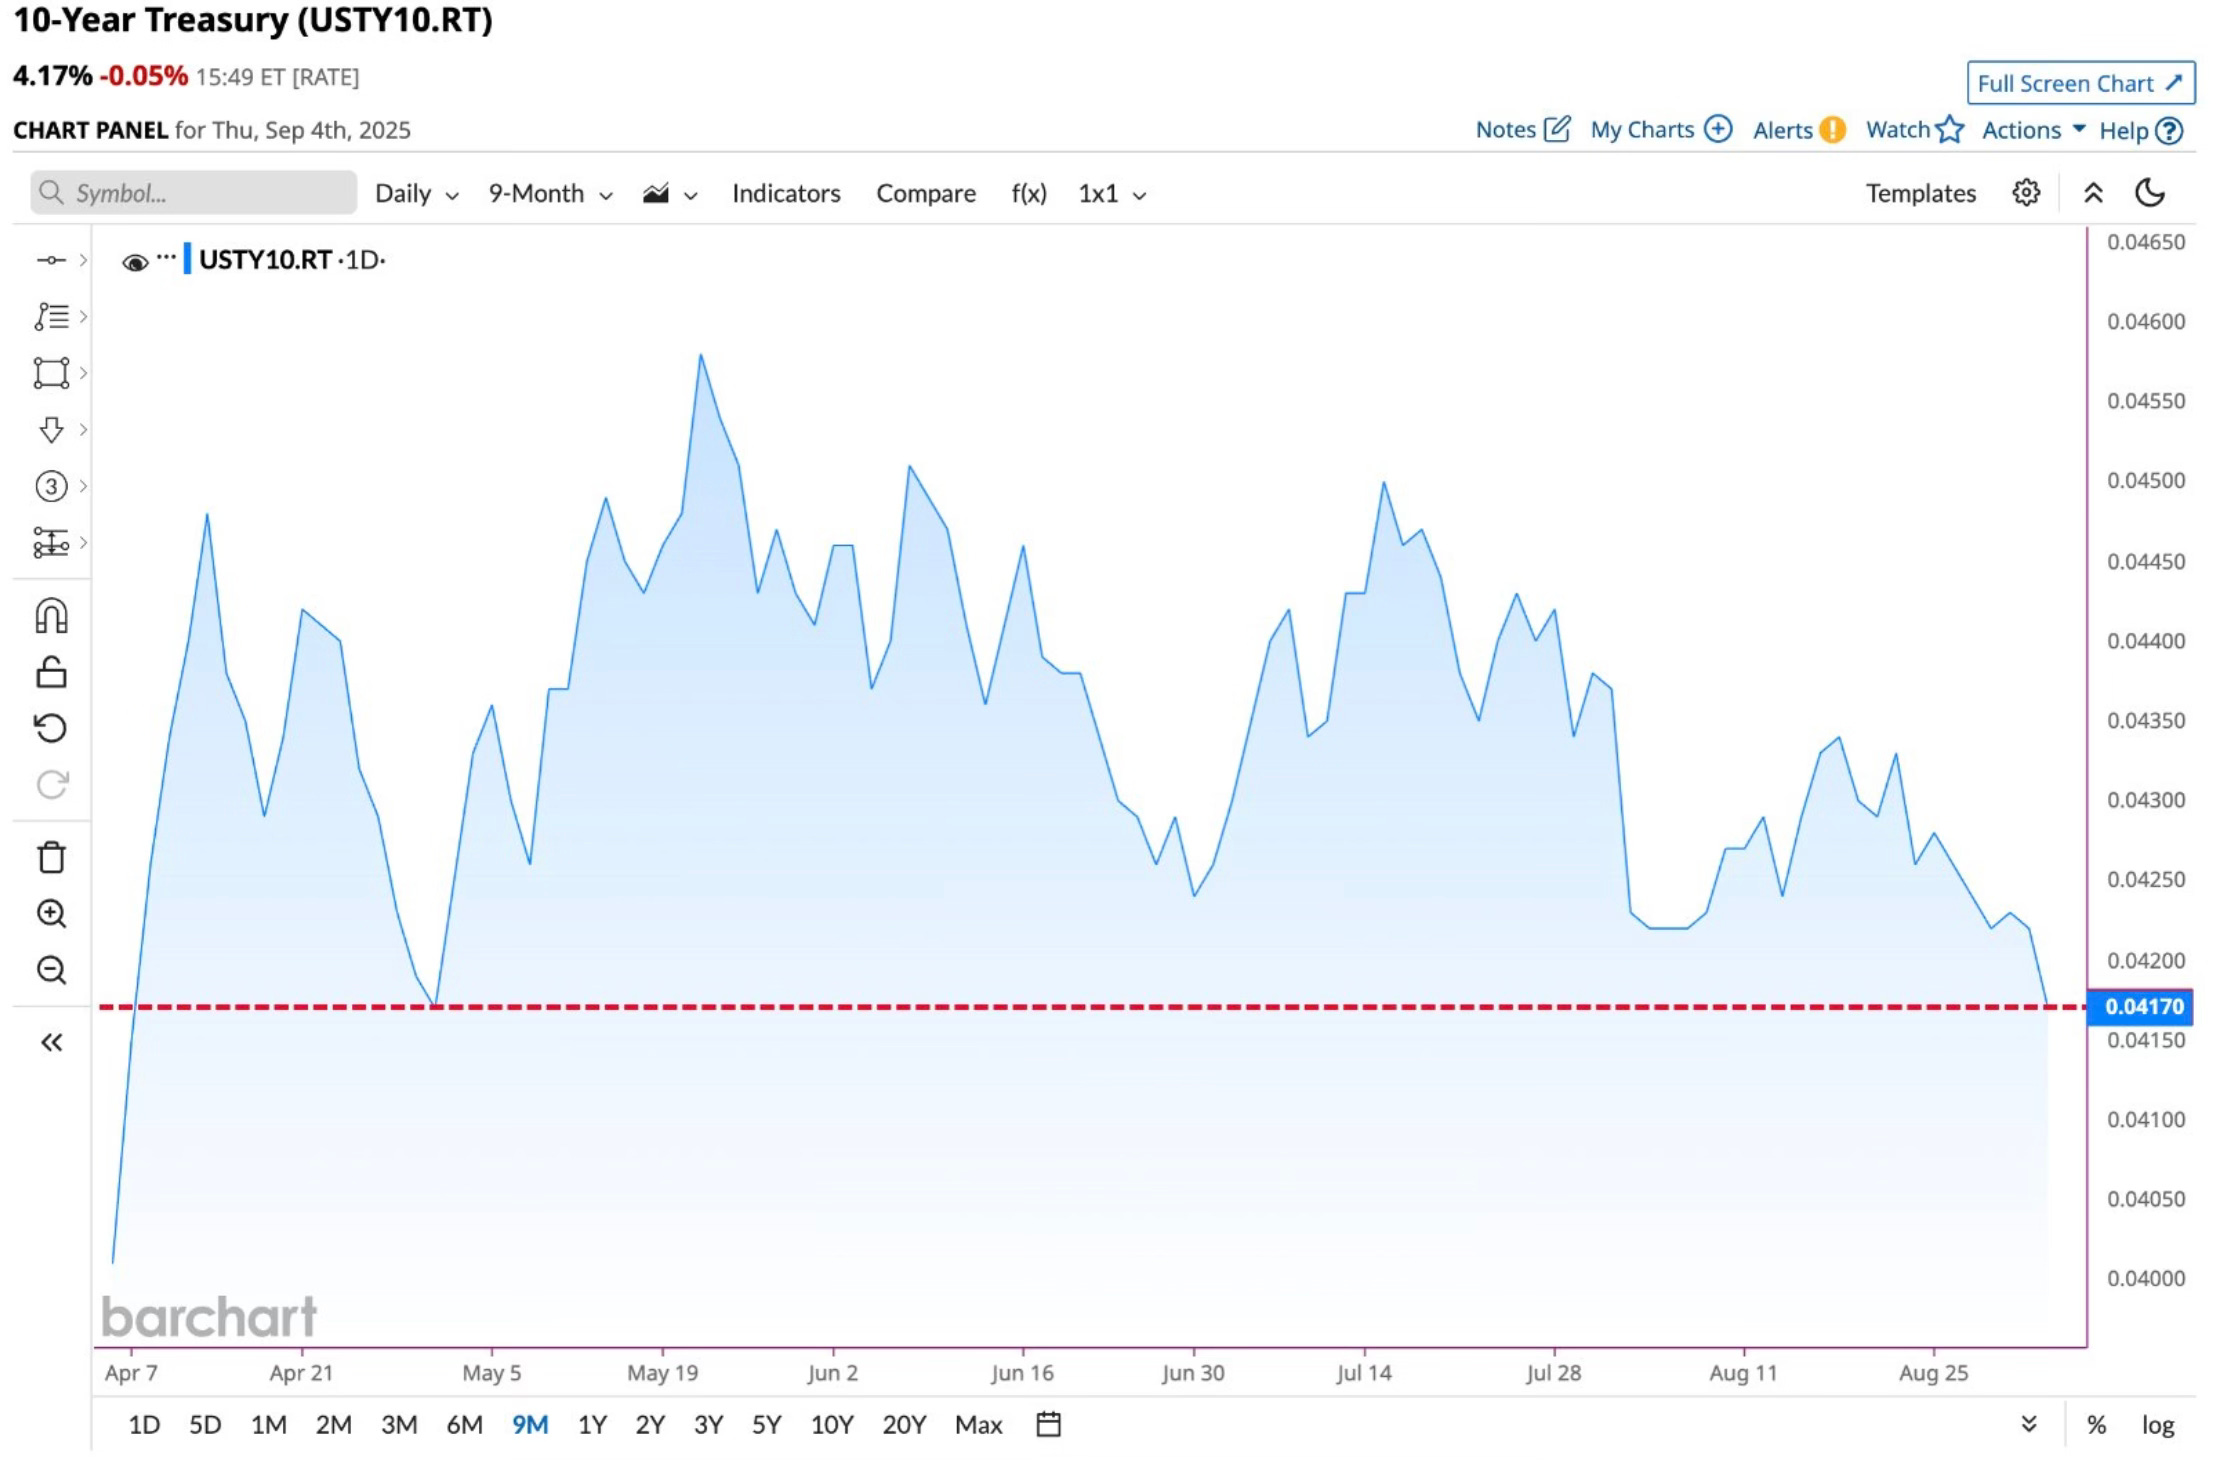
Friday saw the 10-year hit 4.1%, that’s the lowest level since April 7th.
Even with the calendar now showing September, which is historically the worst month of the year for stocks. The month is beginning with a lot of bearish momentum.
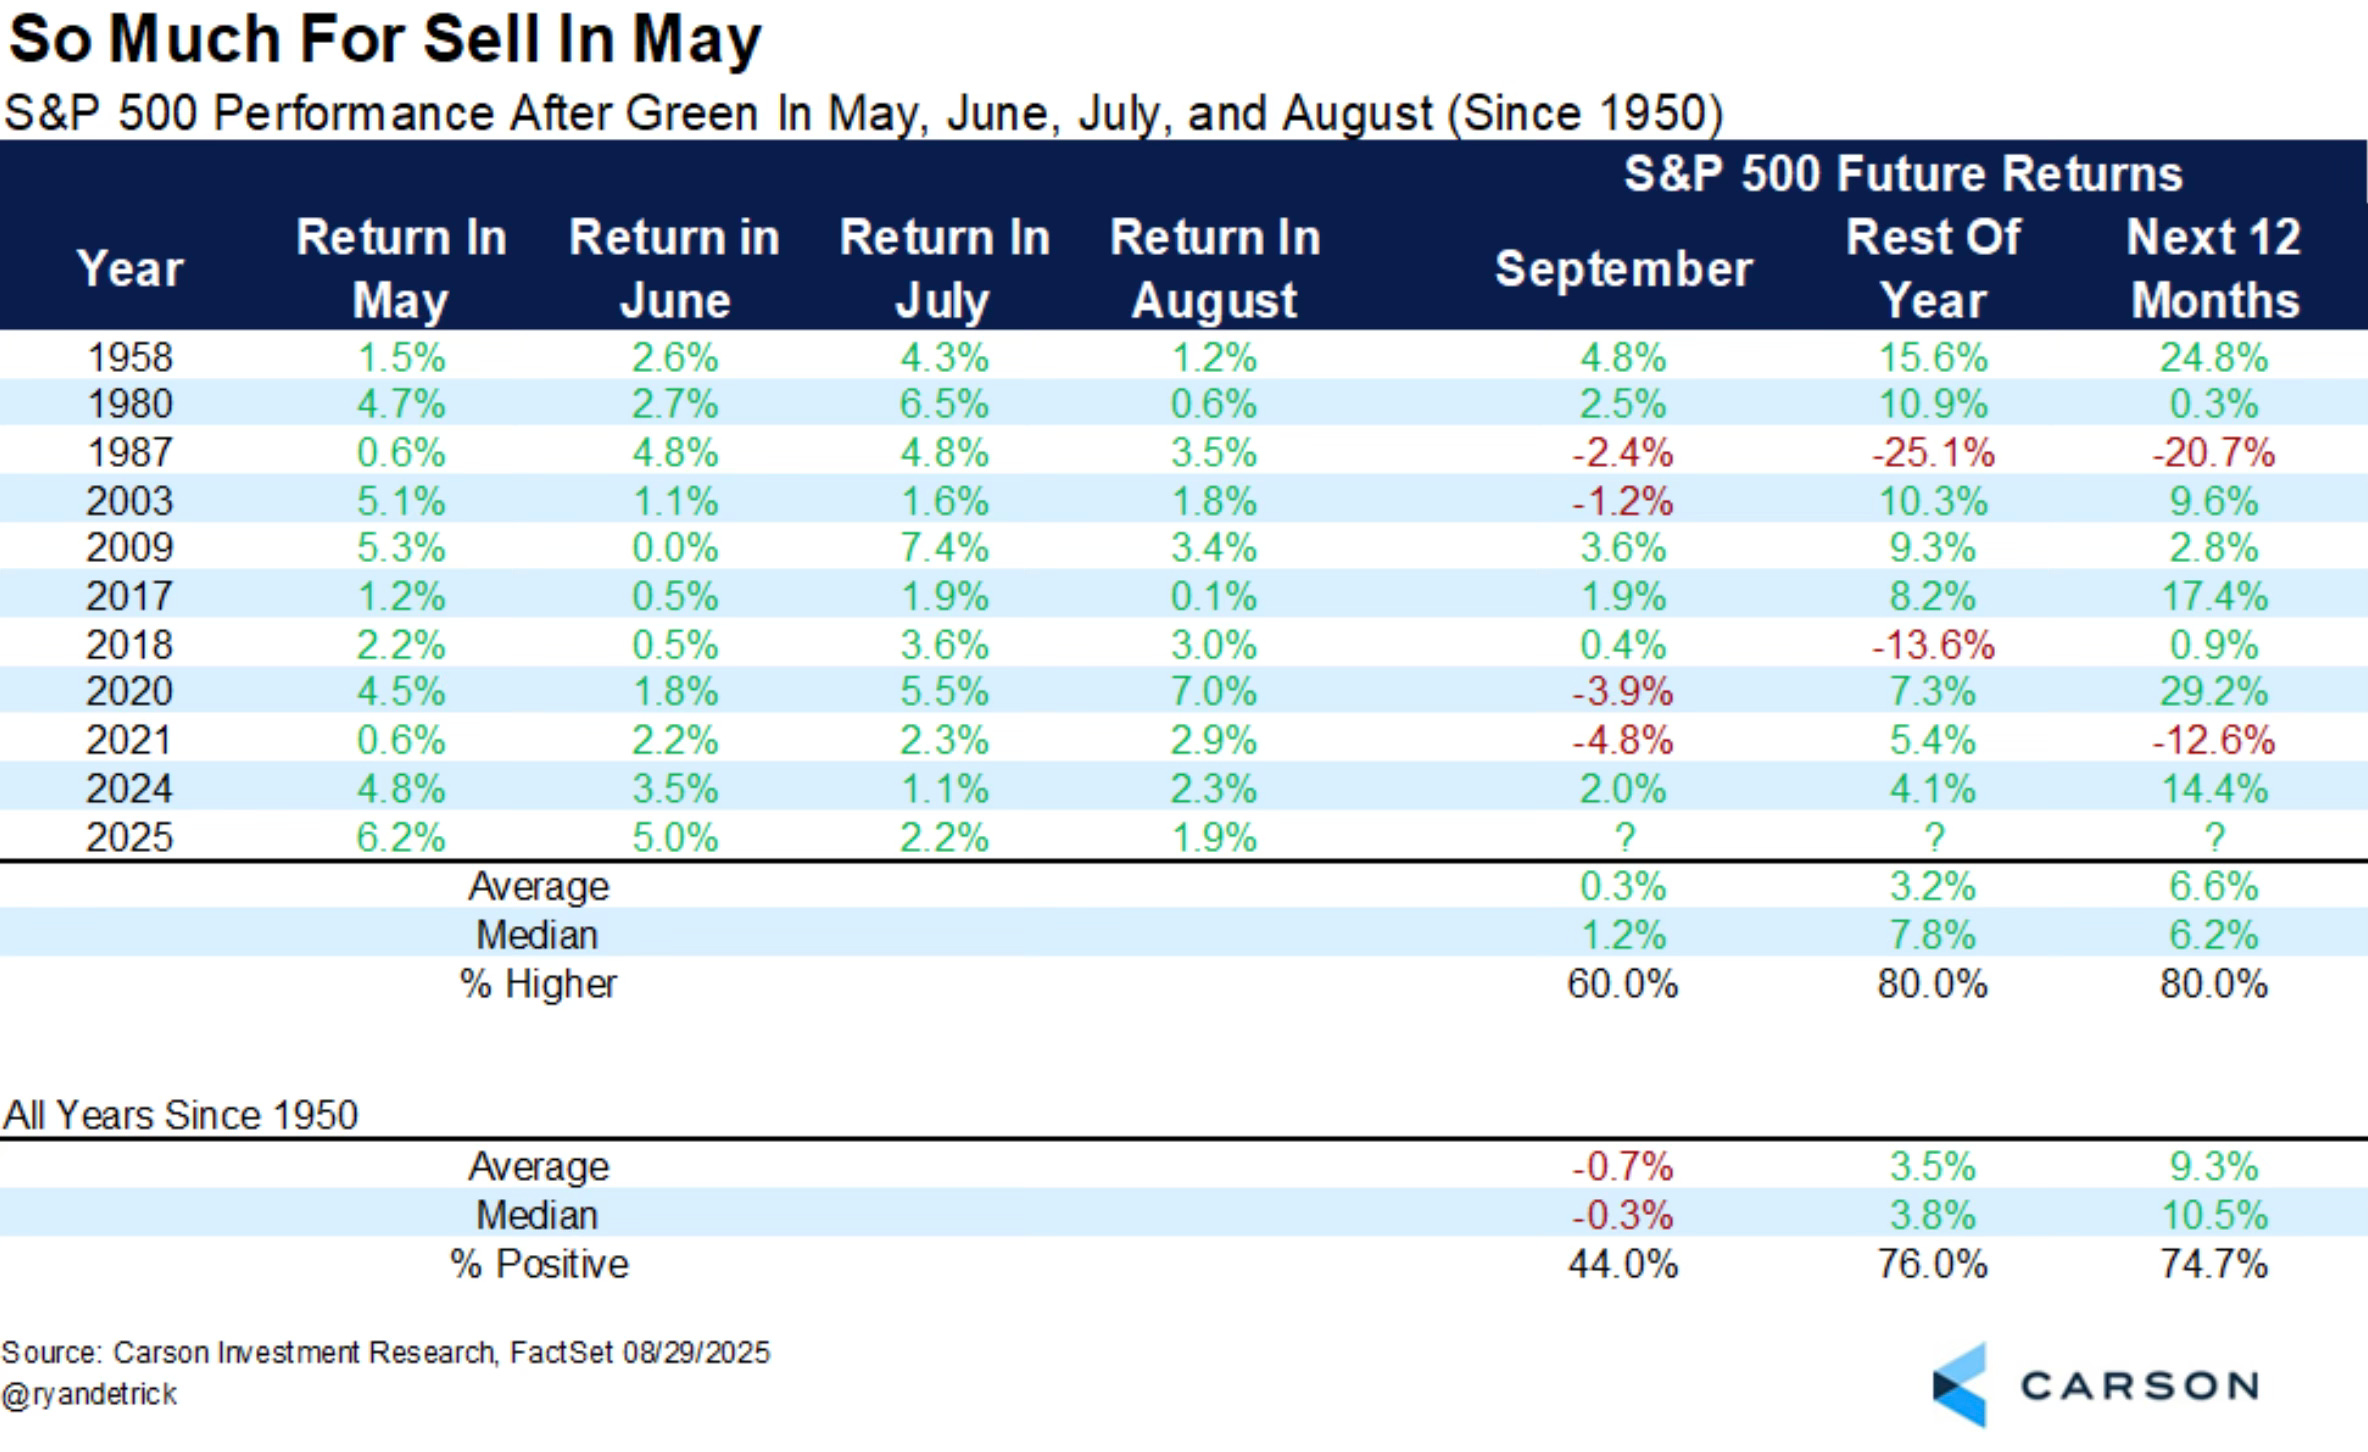
There have only been 10 other times since 1950 that the S&P 500 has been higher in May, June, July and August.
60% of the time September was also positive. The rest of the year and the next 12 months were both green 80% of the time.
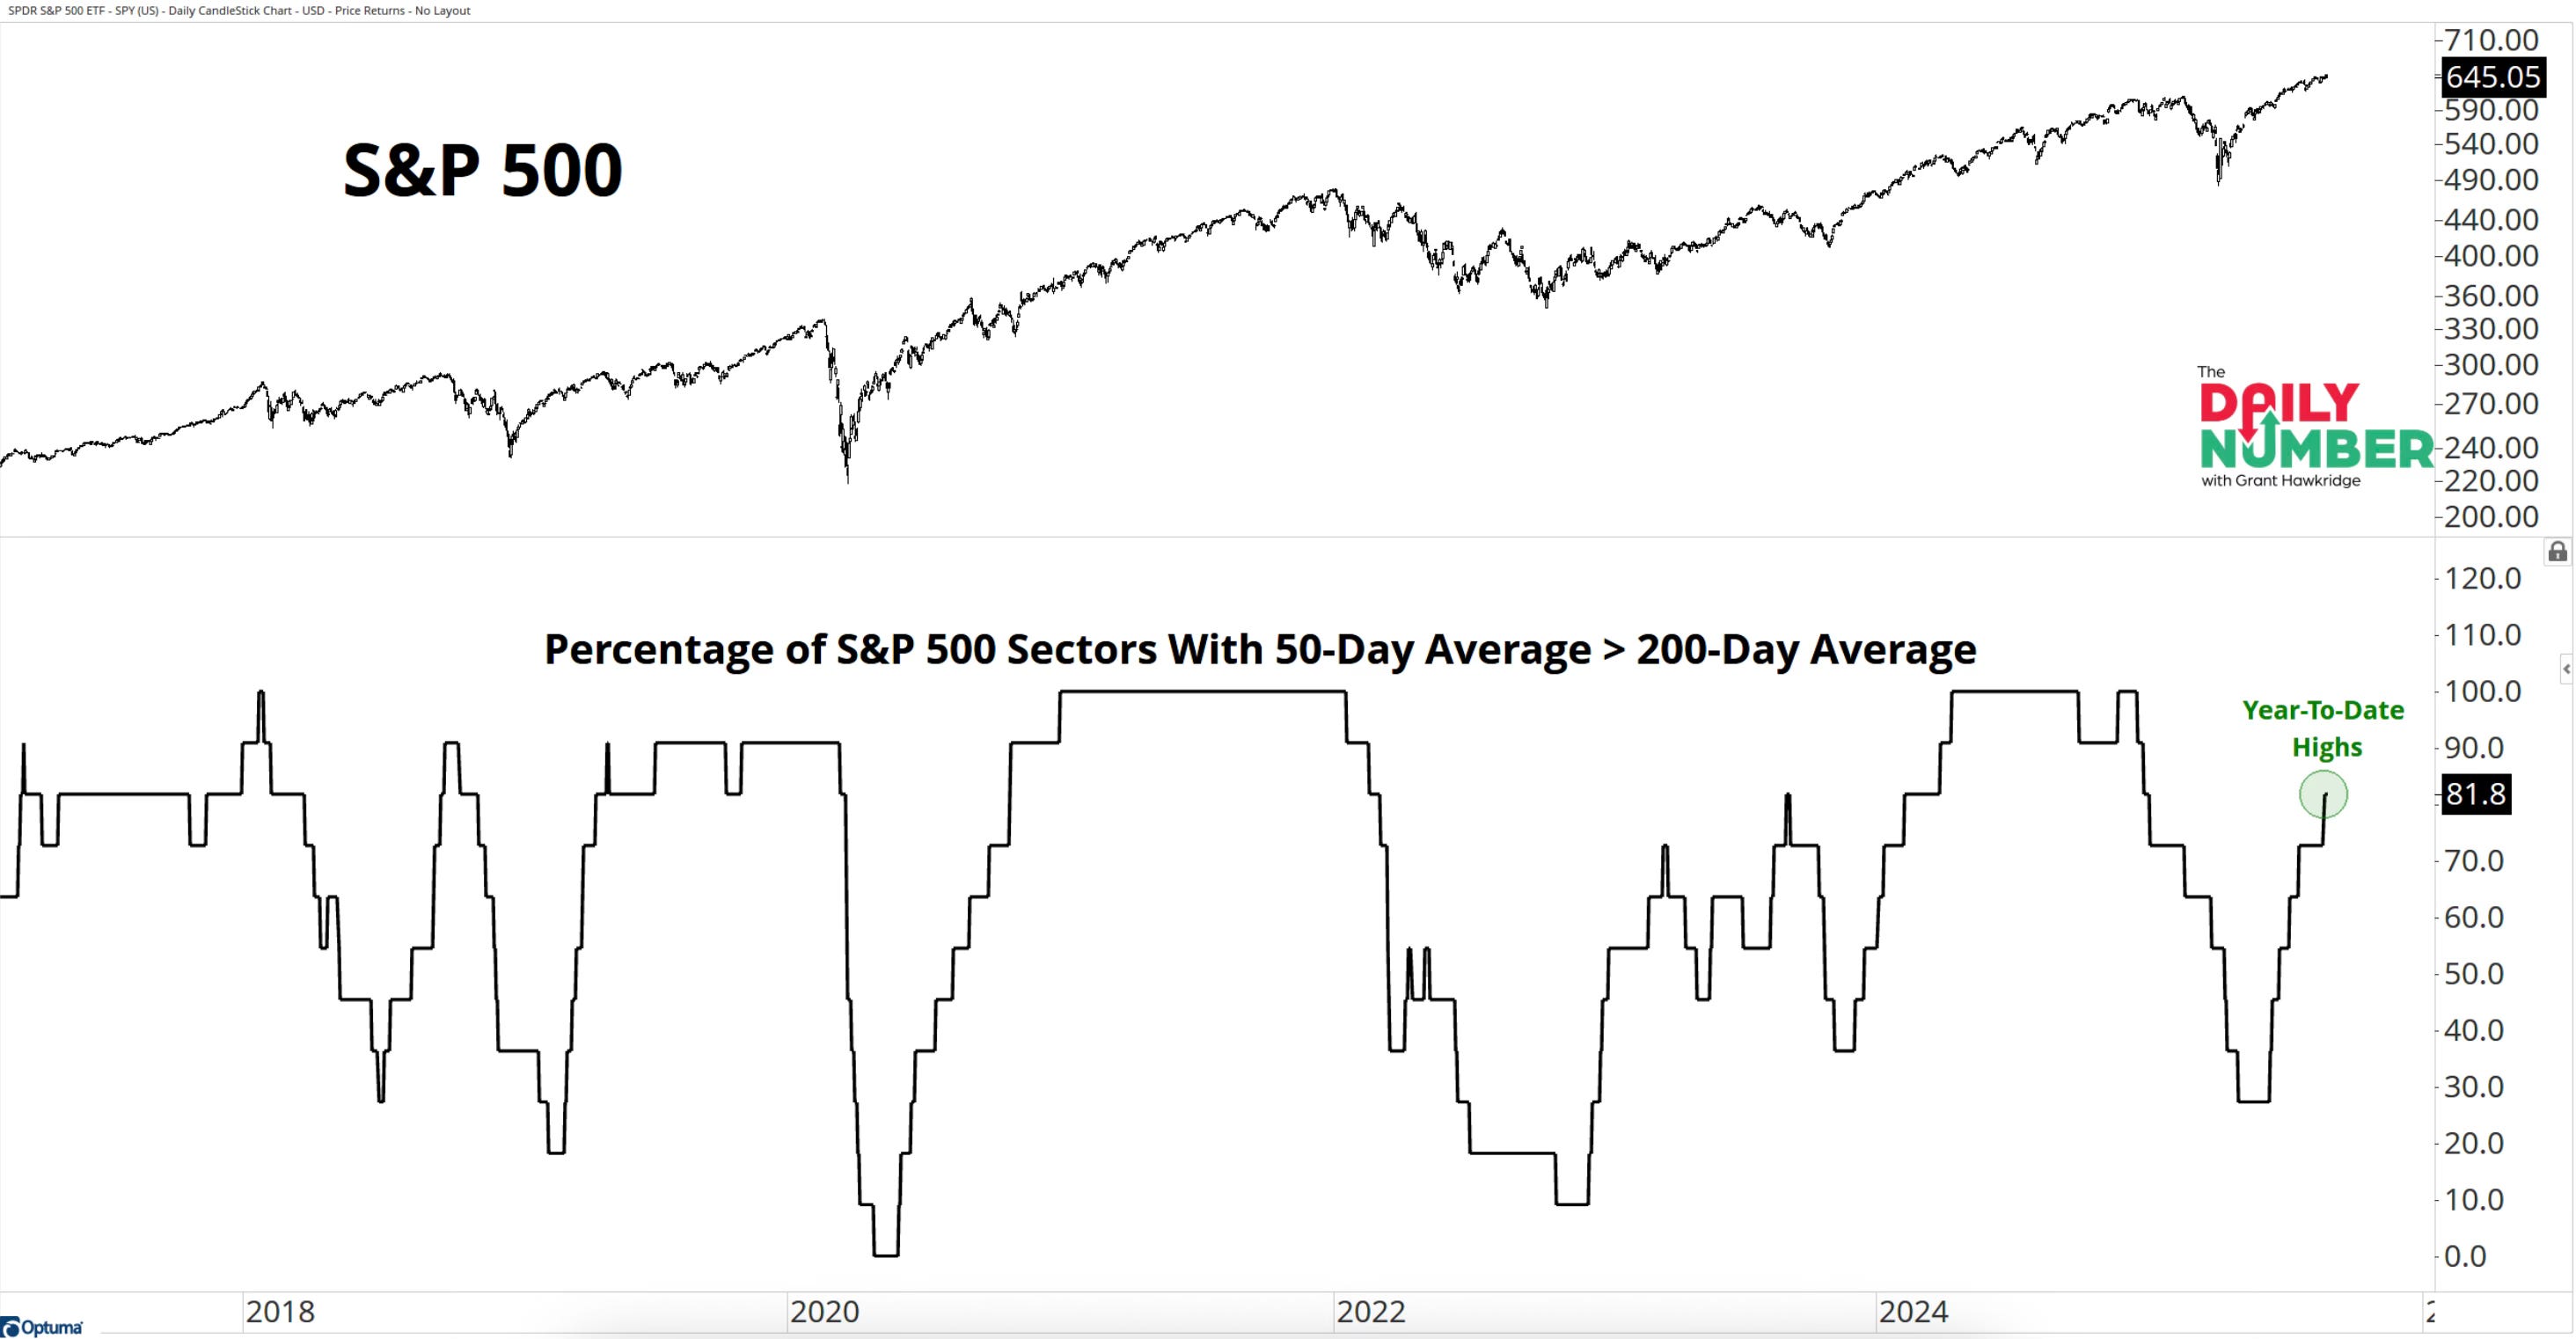
This also comes as sector breadth is at a YTD high. 9 of 11 S&P 500 sectors are trending higher.
You would think that this along with the combination of all the major indices at all-time highs that investors would be extremely bullish.
As you will see, that isn’t quite the case. In fact, investors are the opposite. To me, that raises the question, why so bearish?