
Investing Update: Why All Eyes Are On Oil
What I'm buying, selling & watching
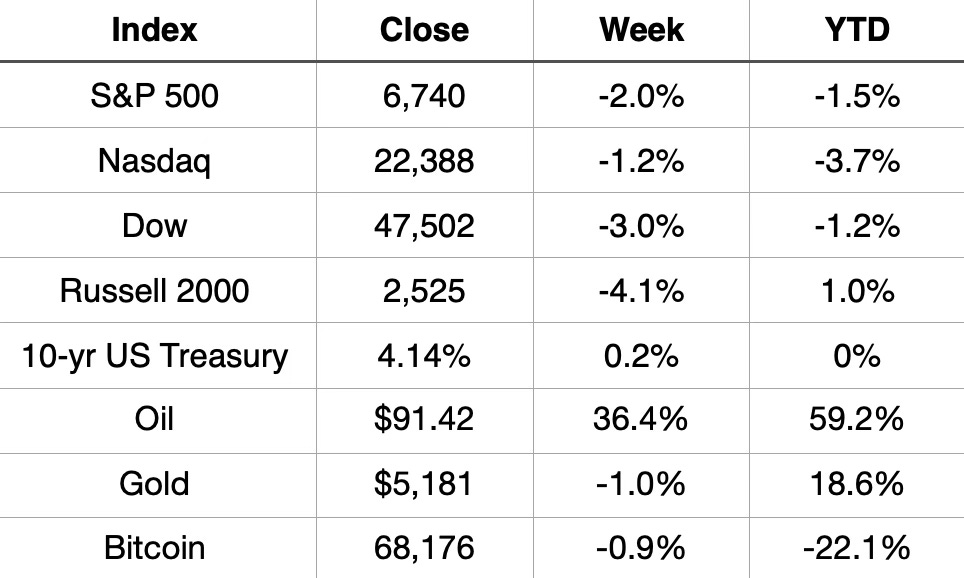
It was a rough week on Wall Street. The S&P 500 fell 2.0%, marking its worst weekly performance since November, and now sits in negative territory for the year at -1.5%. This marks the 4th down week out of the last 5 for the index. The broader market wasn’t spared either. Major averages posted back-to-back weekly losses, with the Dow dropping 3.0% and the small-cap Russell 2000 leading declines at -4.1%.
The Nasdaq slid 1.2%, extending its YTD loss to -3.7%, while Bitcoin quietly shed another 0.9% , now down more than 22% to start the year.
Not everything is red. Gold continued its impressive run, sitting up 18.6% YTD despite a minor weekly dip. And oil was the week’s big story, surging 36.4% on the week, more on that in a moment. We’ll also touch on the latest jobs data coming up.
Market Recap
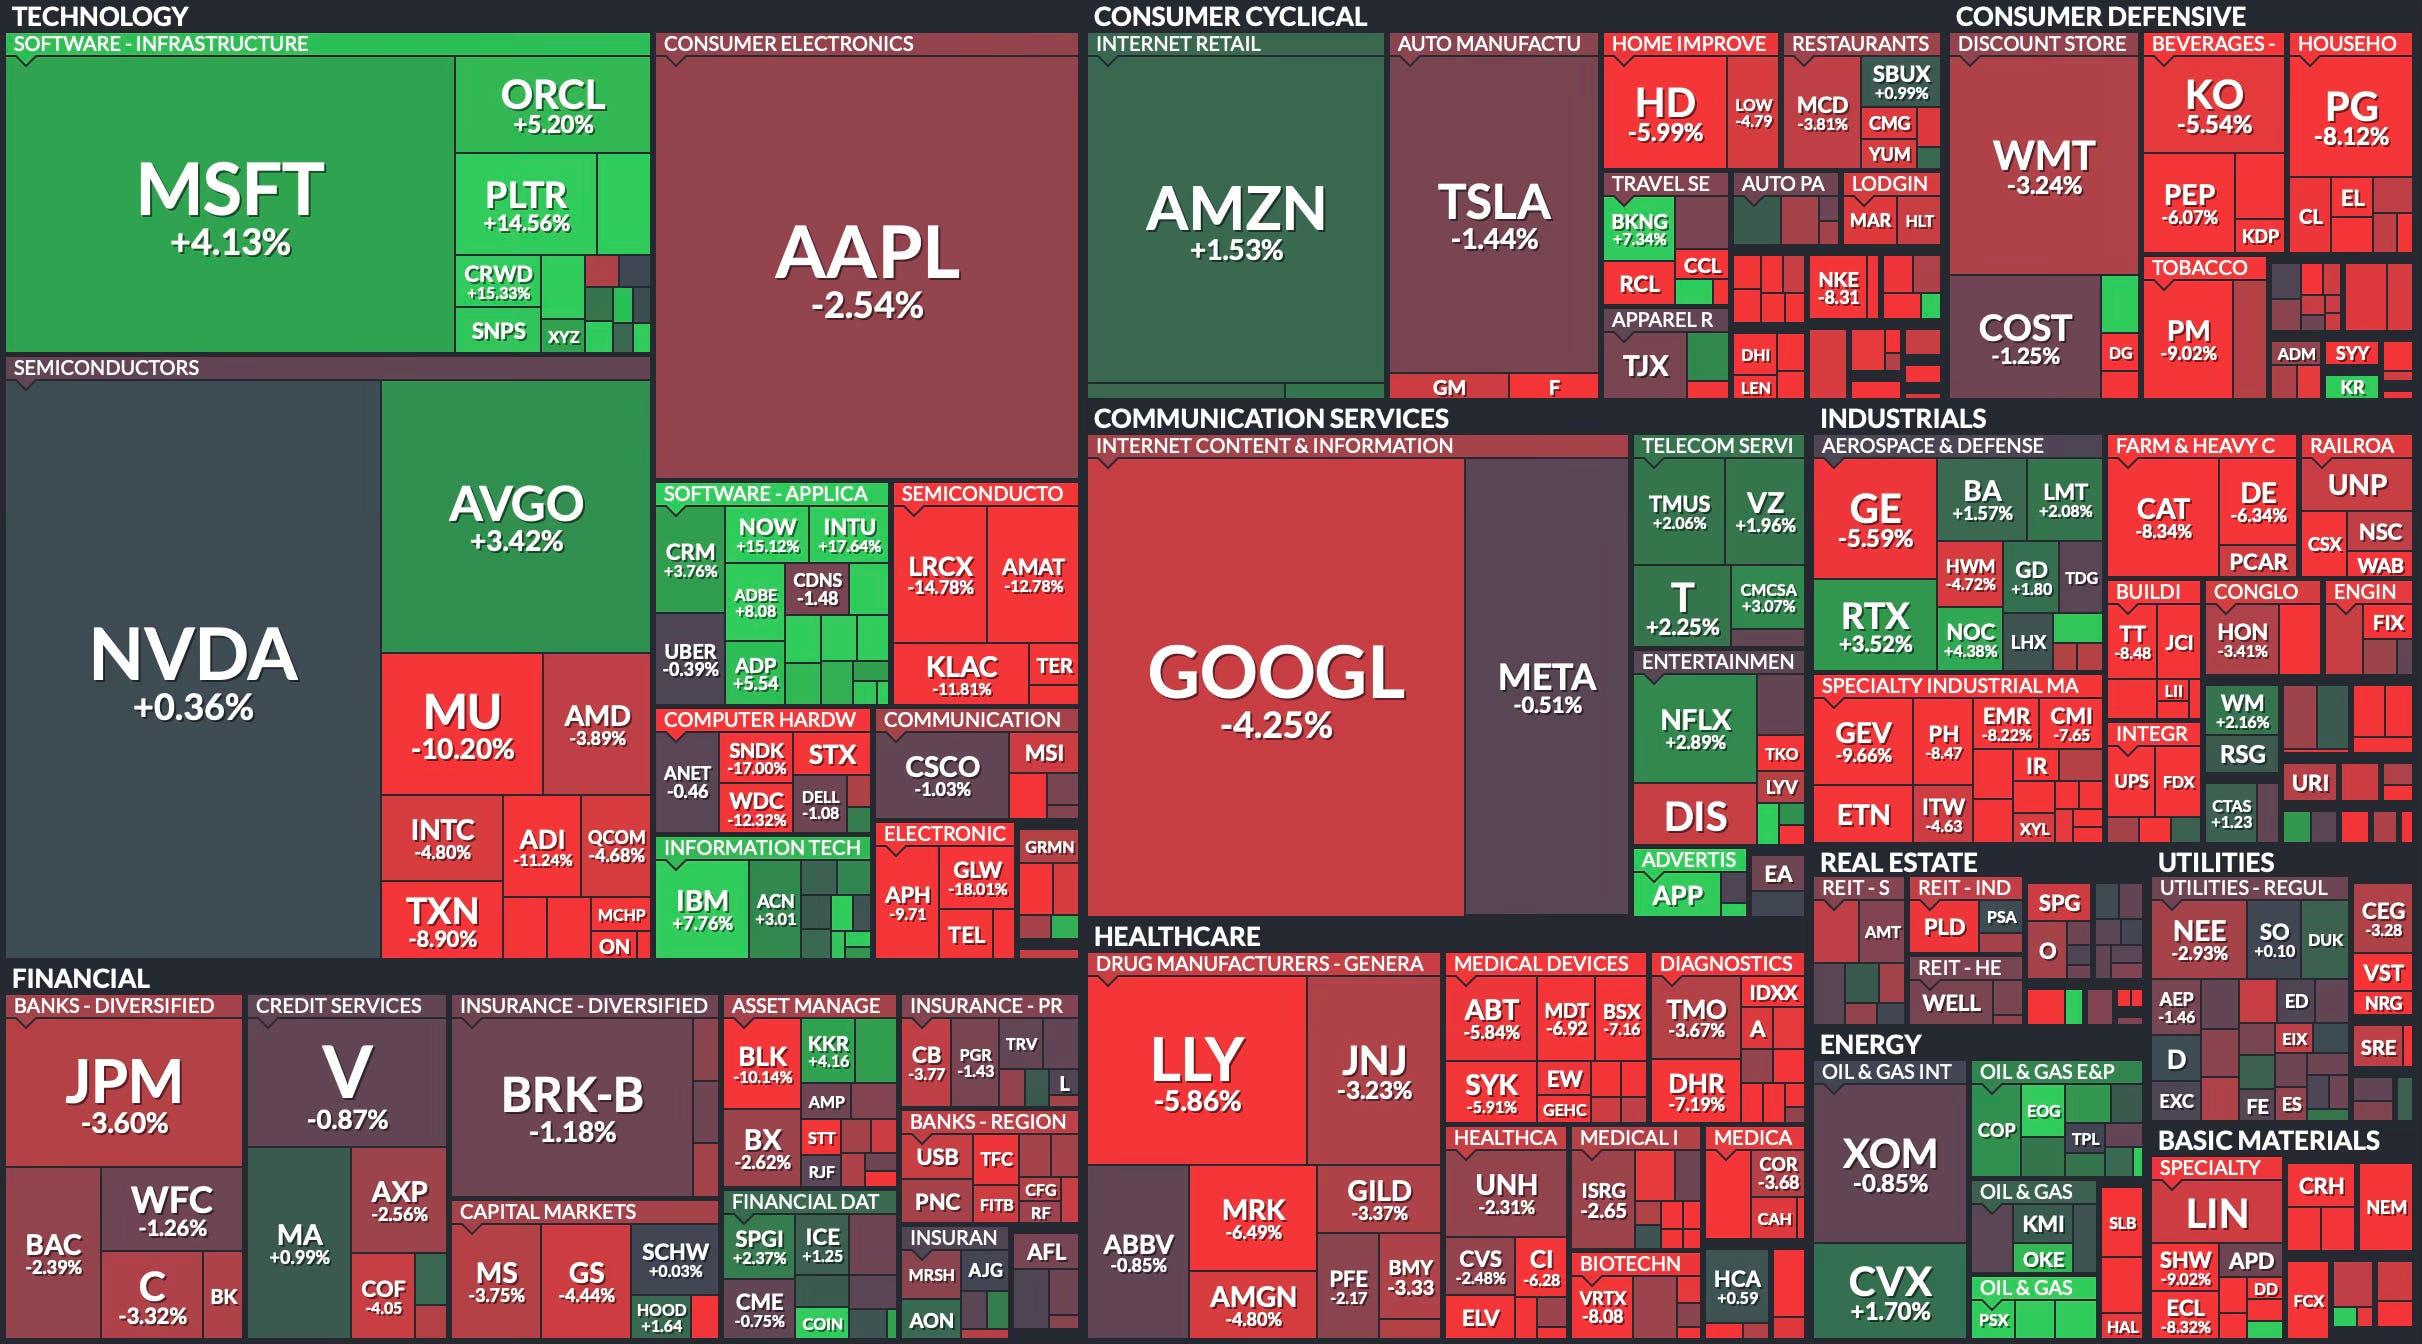
Weekly Heat Map Of Stocks
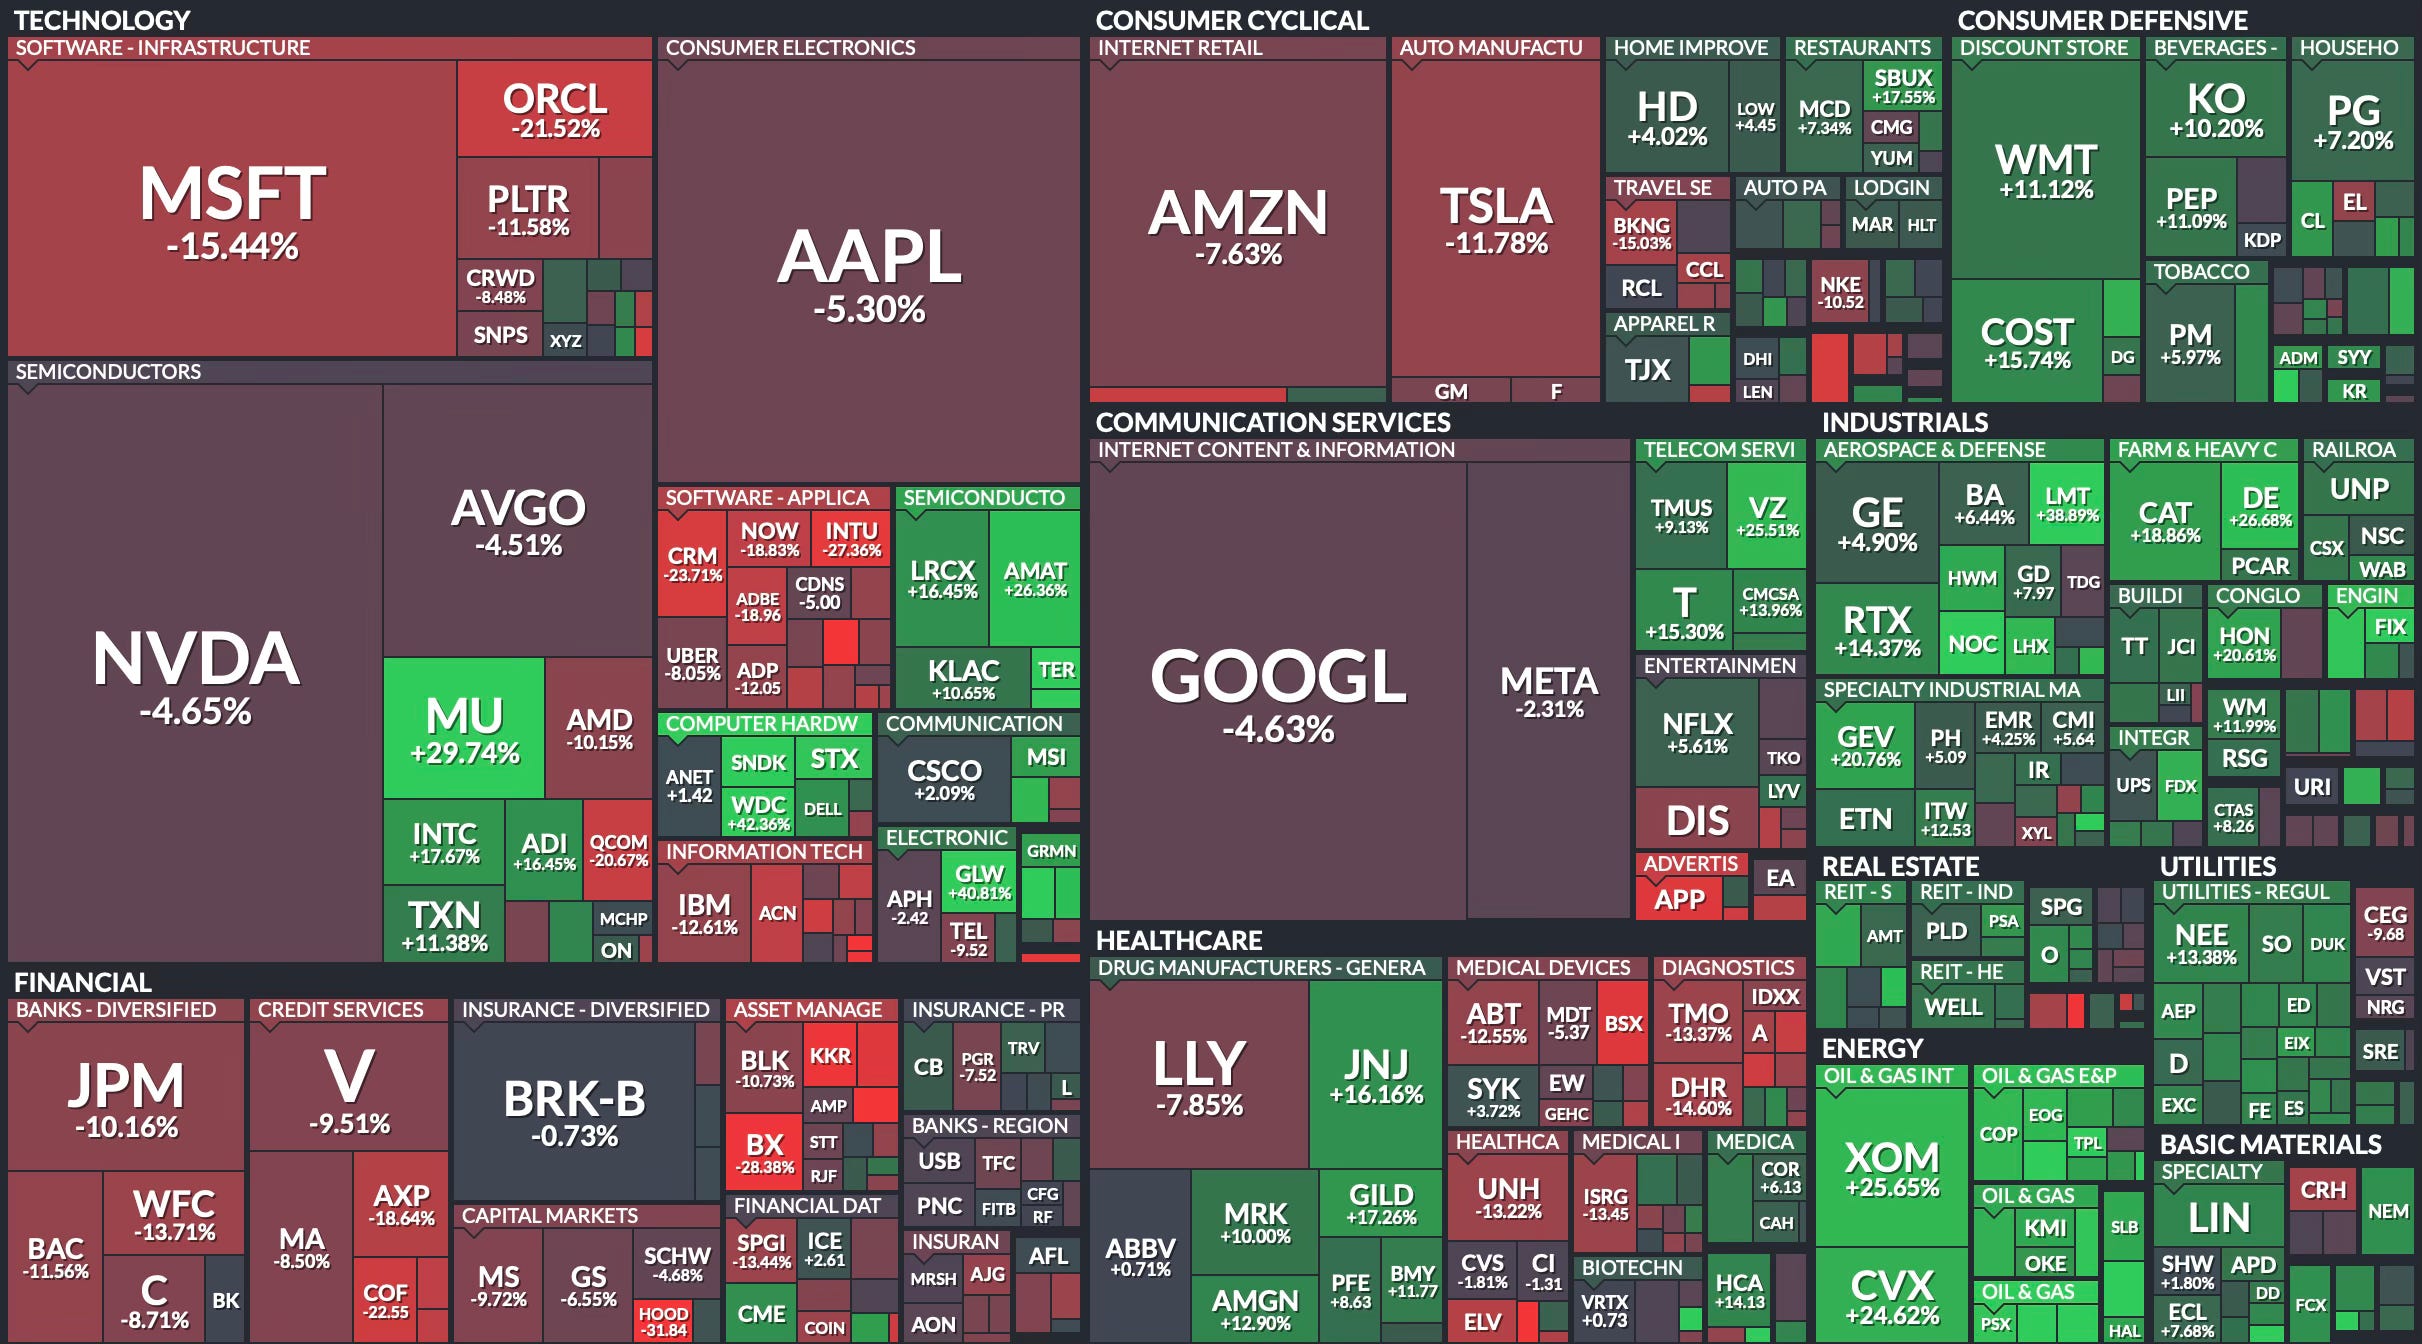
YTD Heat Map Of Stocks
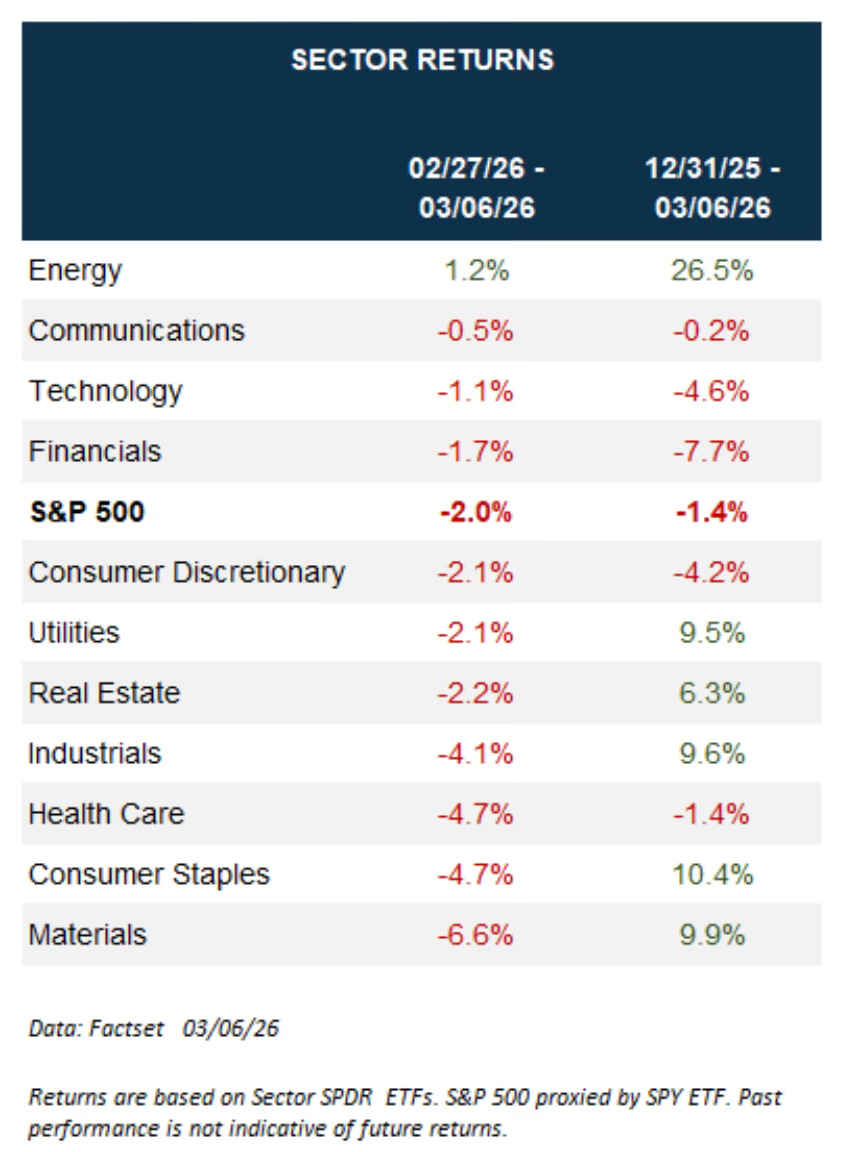
S&P 500 Sector Returns
Since last week ended, energy is the only sector in the green. It’s the clear winner so far in 2026.
The Calm On The Surface
For all the noise this year with tariff threats, geopolitical tension, a jobs scare, and a volatility spike. The S&P 500 has actually been trading in a historically tight range. Through the first 41 trading days of 2026, the index has moved less than 4% from high to low. According to Bloomberg data, that is the narrowest starting range in market history, dating all the way back to the 1930s.
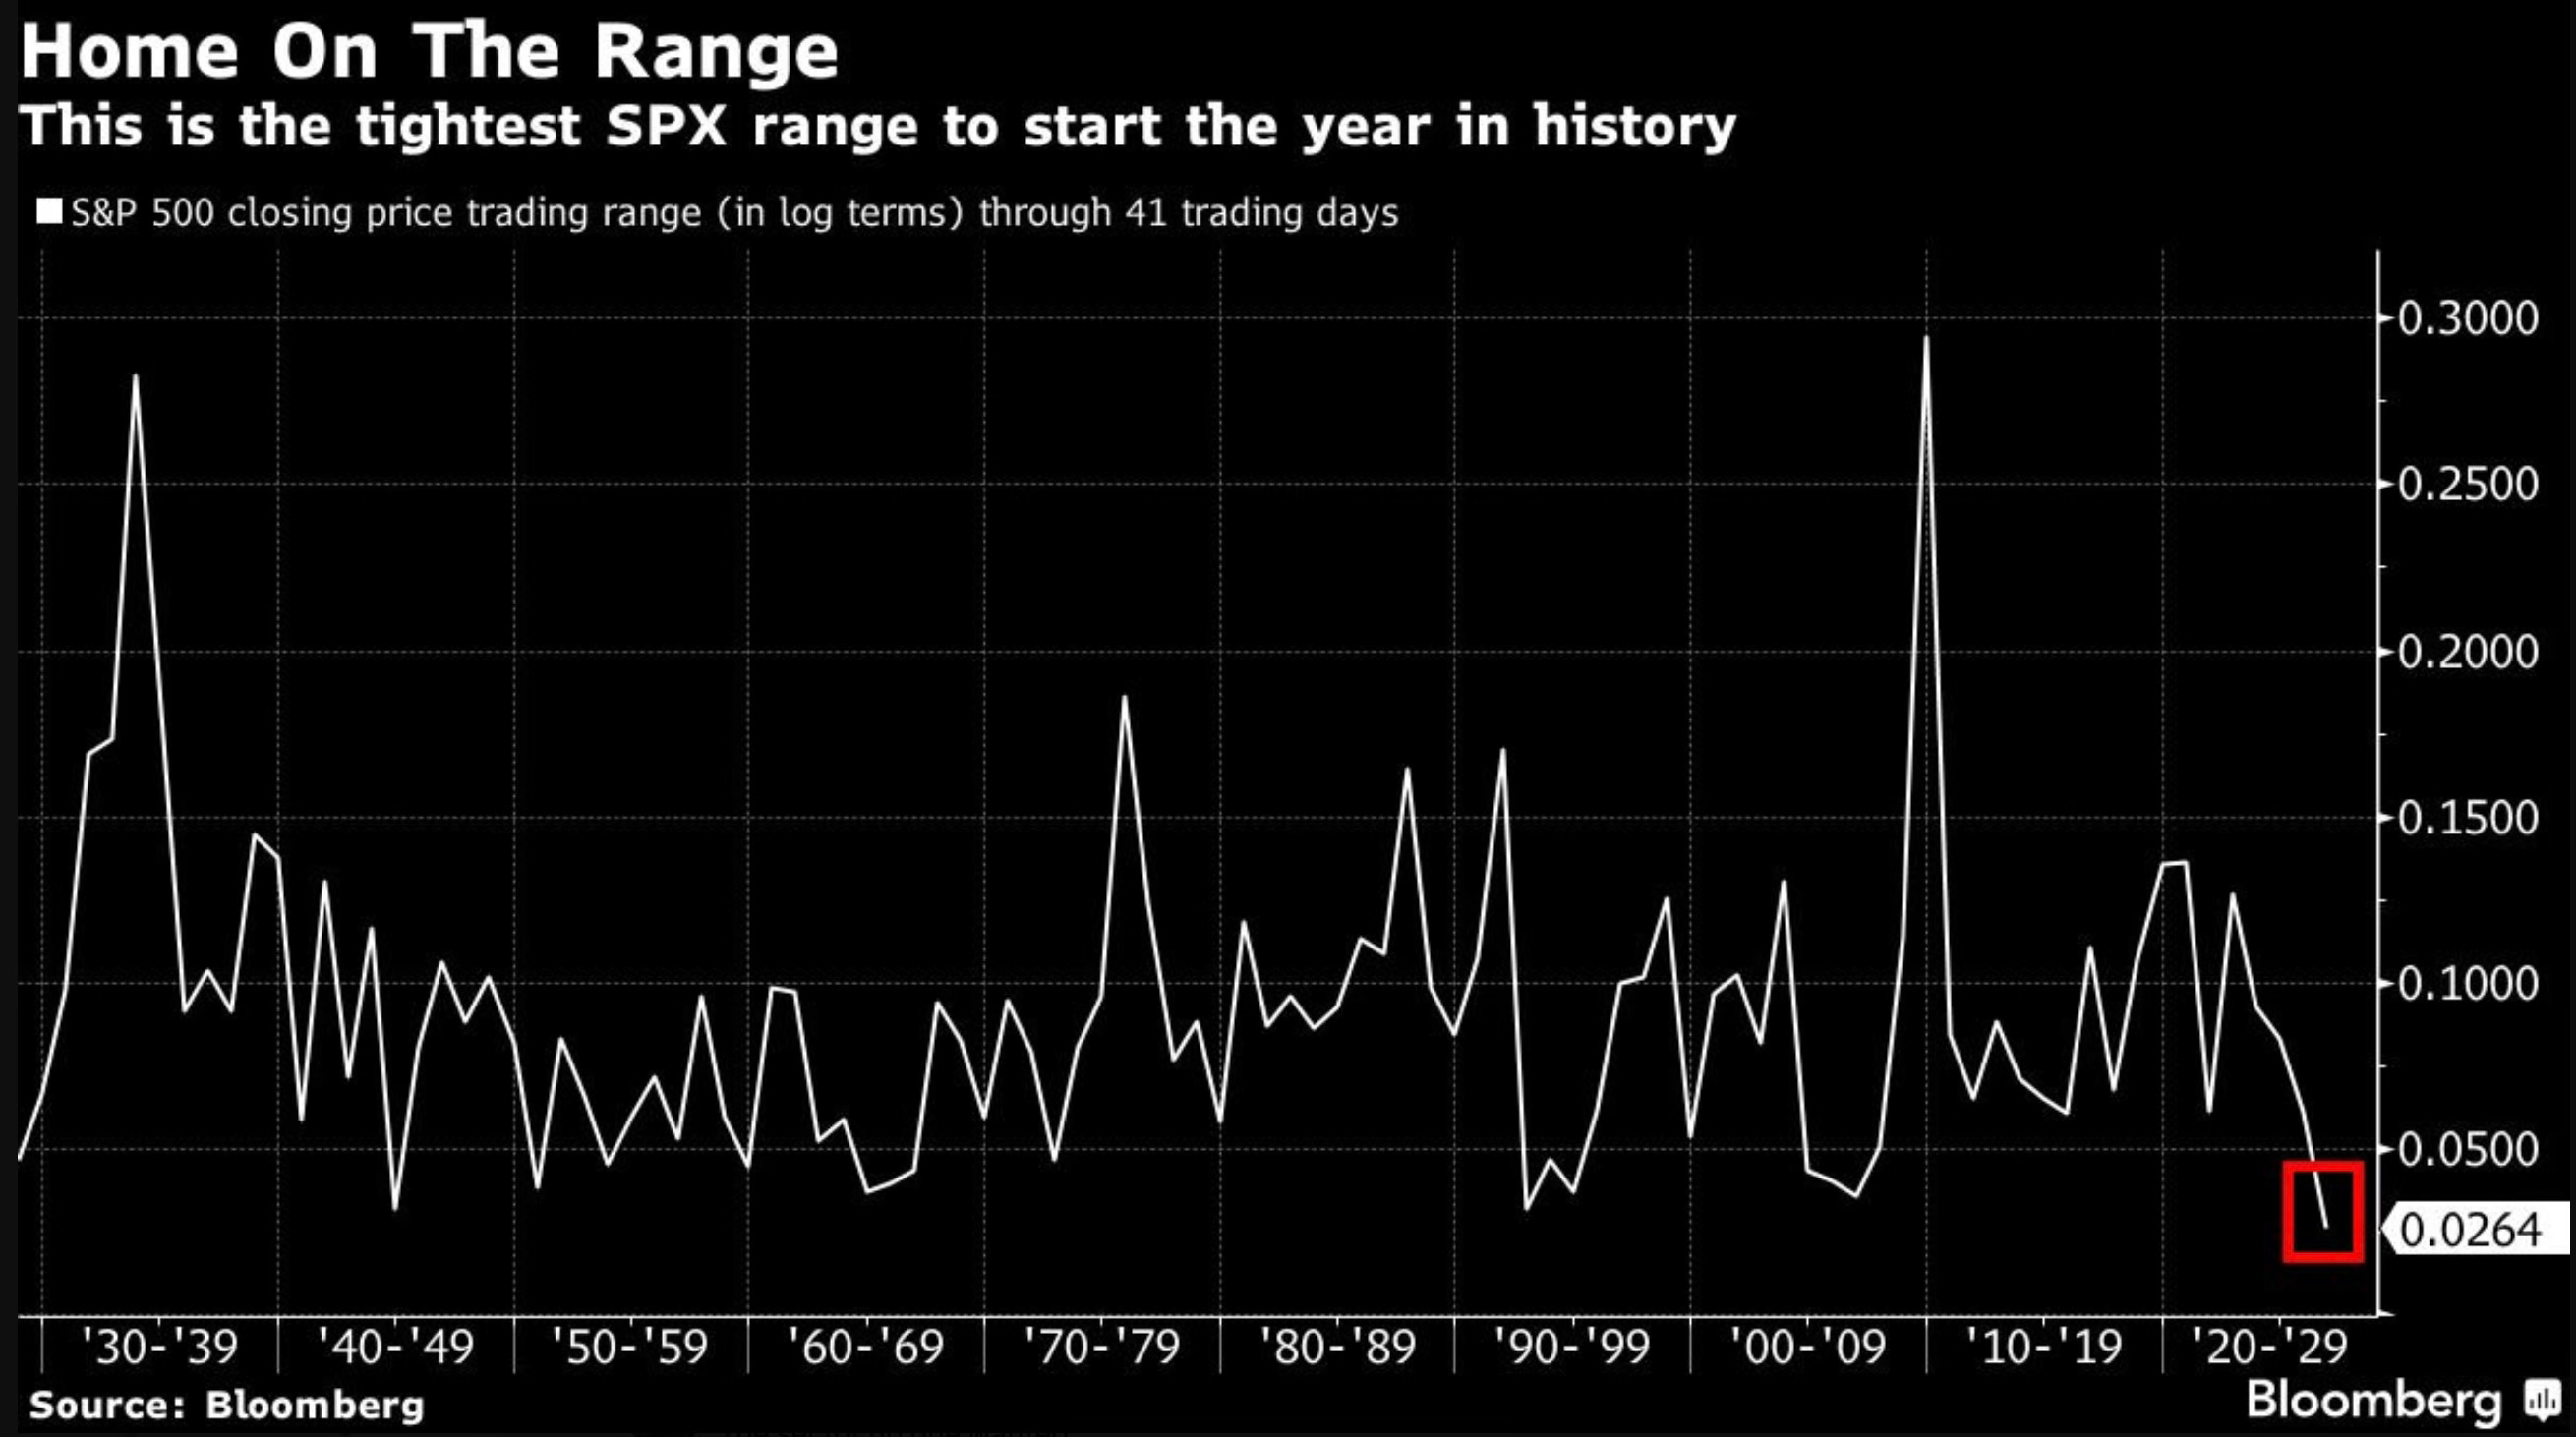
Don’t let that fool you though. Beneath the surface there has been plenty of rotation, sector-level swings, and individual stock volatility. The headline index just hasn’t reflected it, yet.
The question worth asking. Does this calm eventually break one way or the other? History suggests these periods of unusual compression tend to resolve with a move. The direction is the debate.
What March History Says
With the market under pressure, it's worth zooming out and looking at what March typically does because the current weakness may actually be right on script.
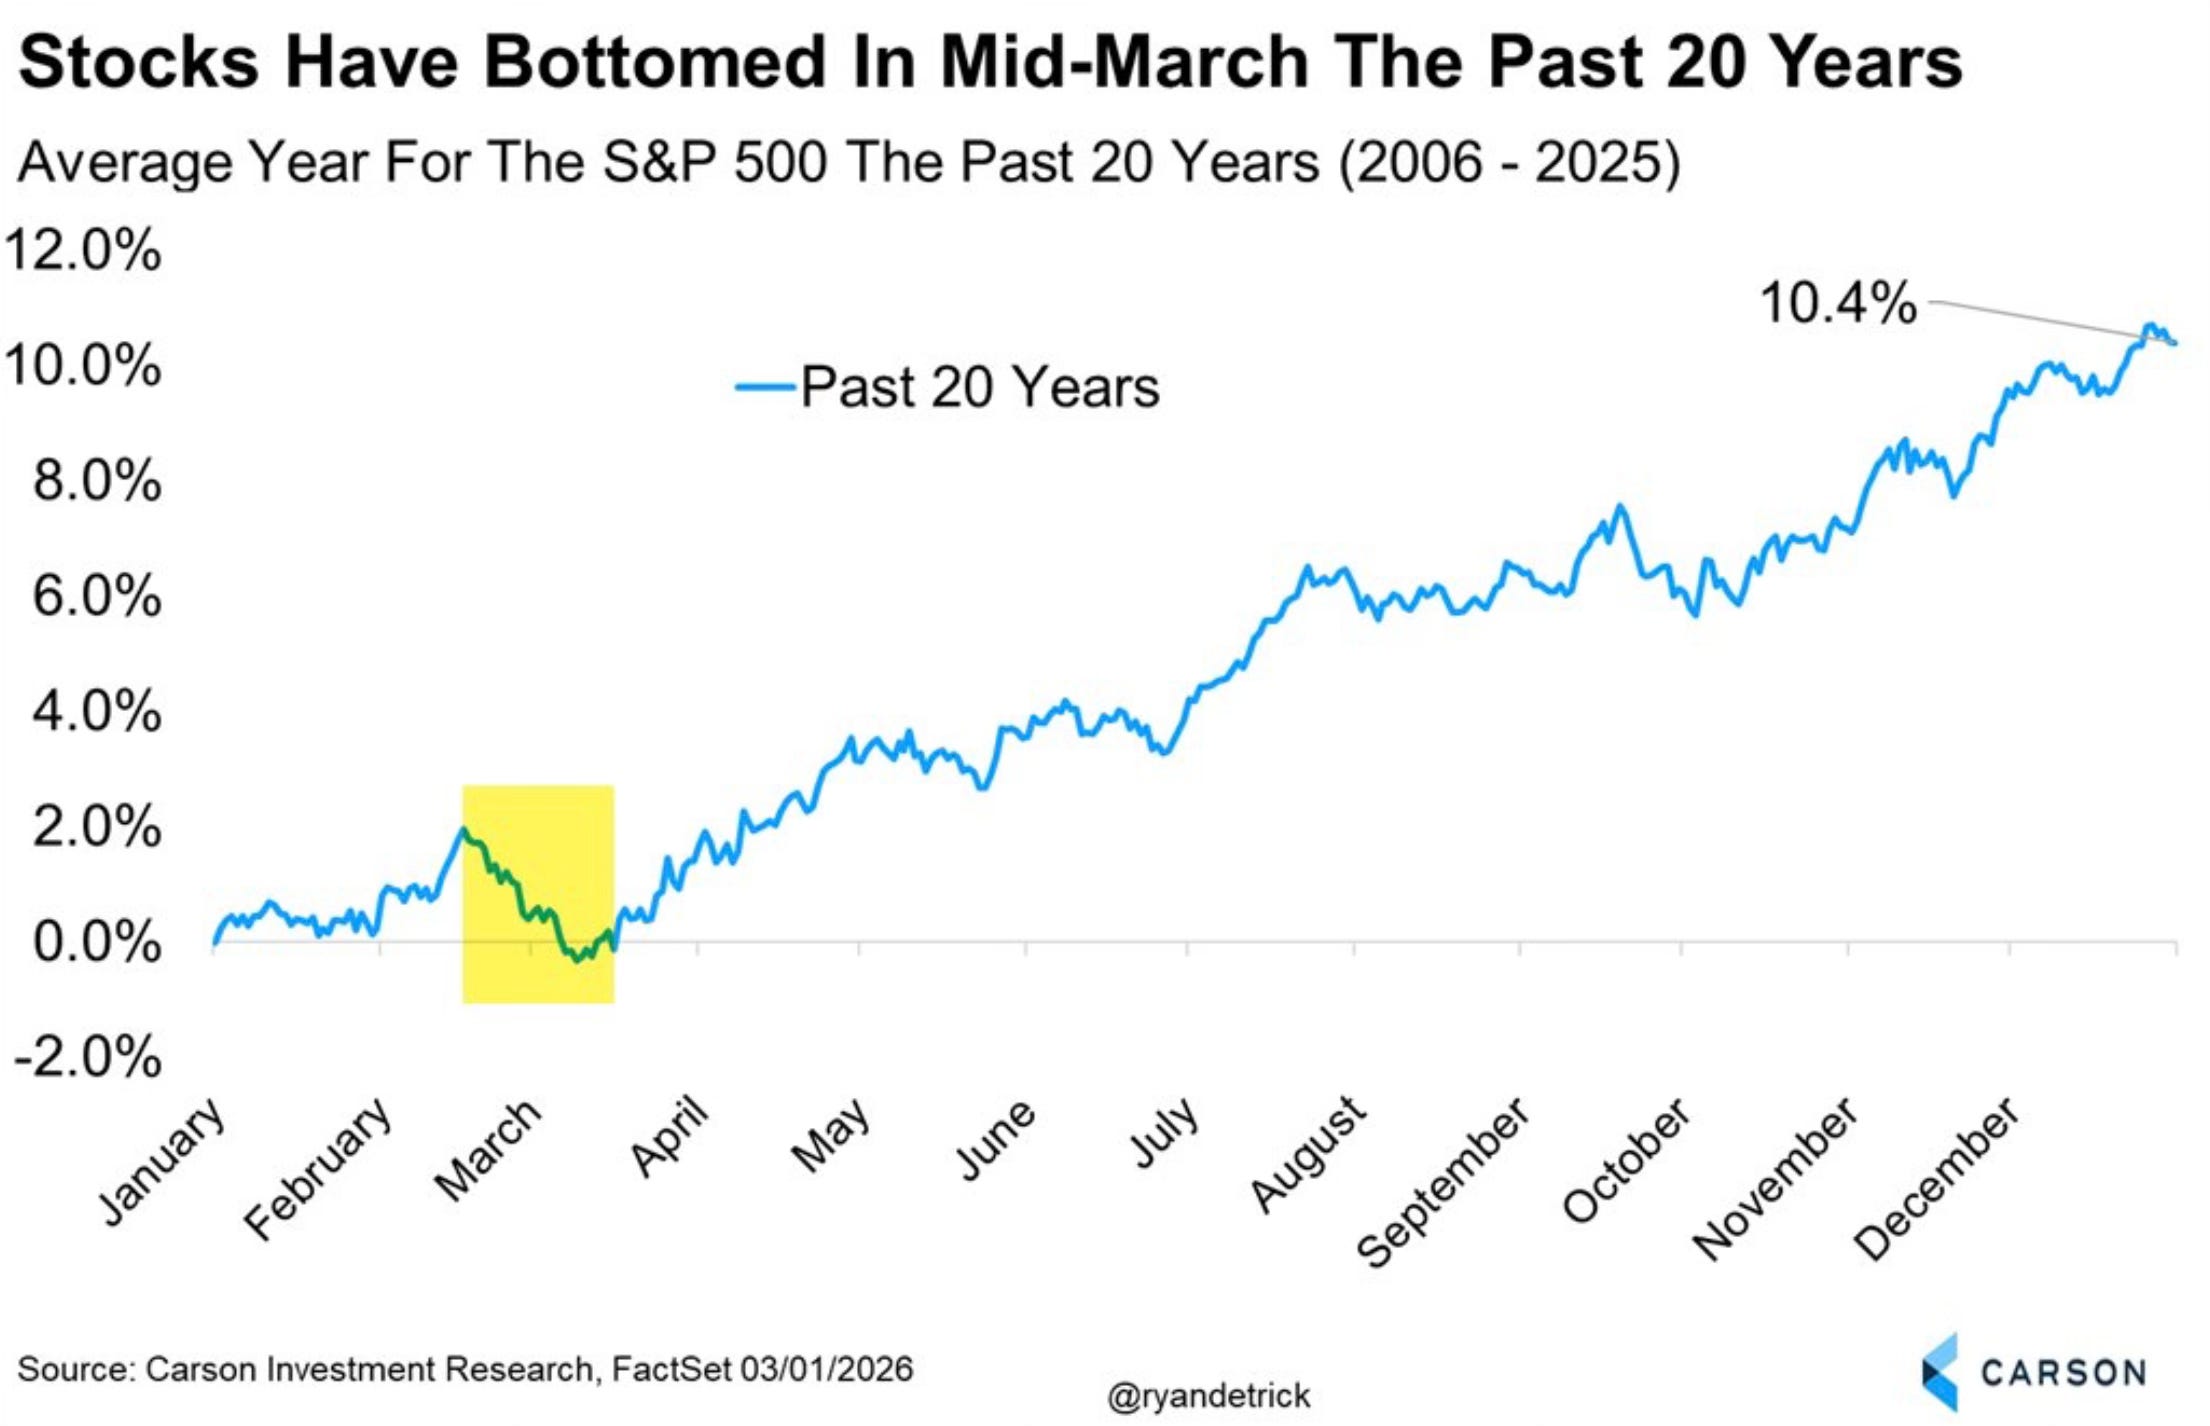
Looking at the past 20 years, it is perfectly normal to see S&P 500 softness in late February and into mid-March, before a meaningful low forms.
Ryan Detrick notes that mid-March has historically been the bottom of the average year going back to 2006. Yes, 2009 and 2020 are part of that story but the pattern is consistent enough to be worth noting.
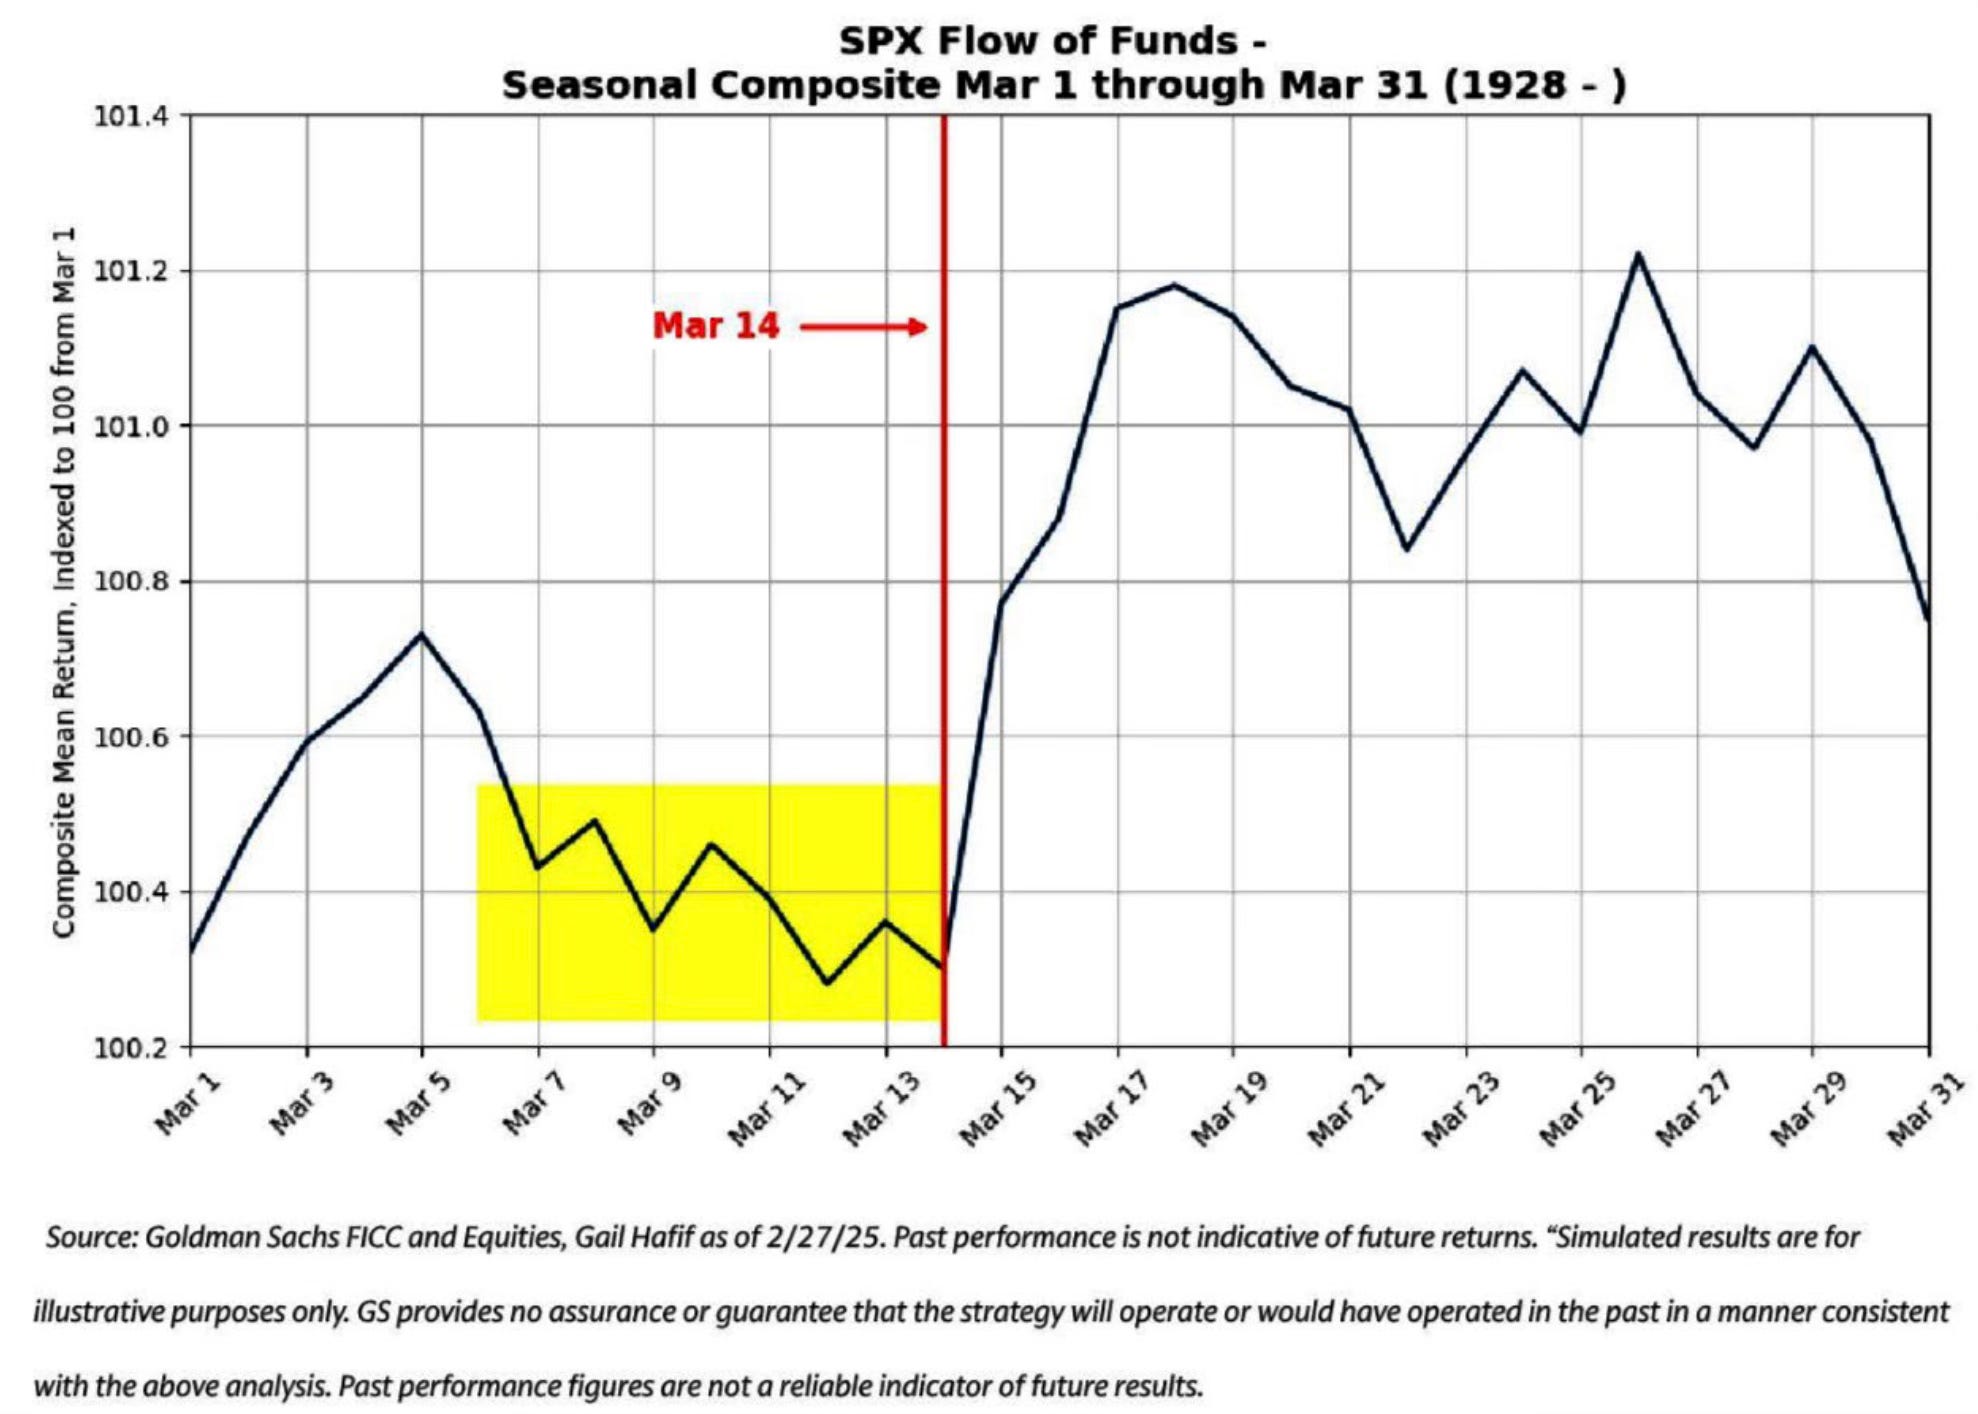
The Goldman Sachs Flow of Funds seasonal composite points to the same thing: the window from roughly March 6 through March 14 has historically been the soft spot, with strength typically returning after the 14th.
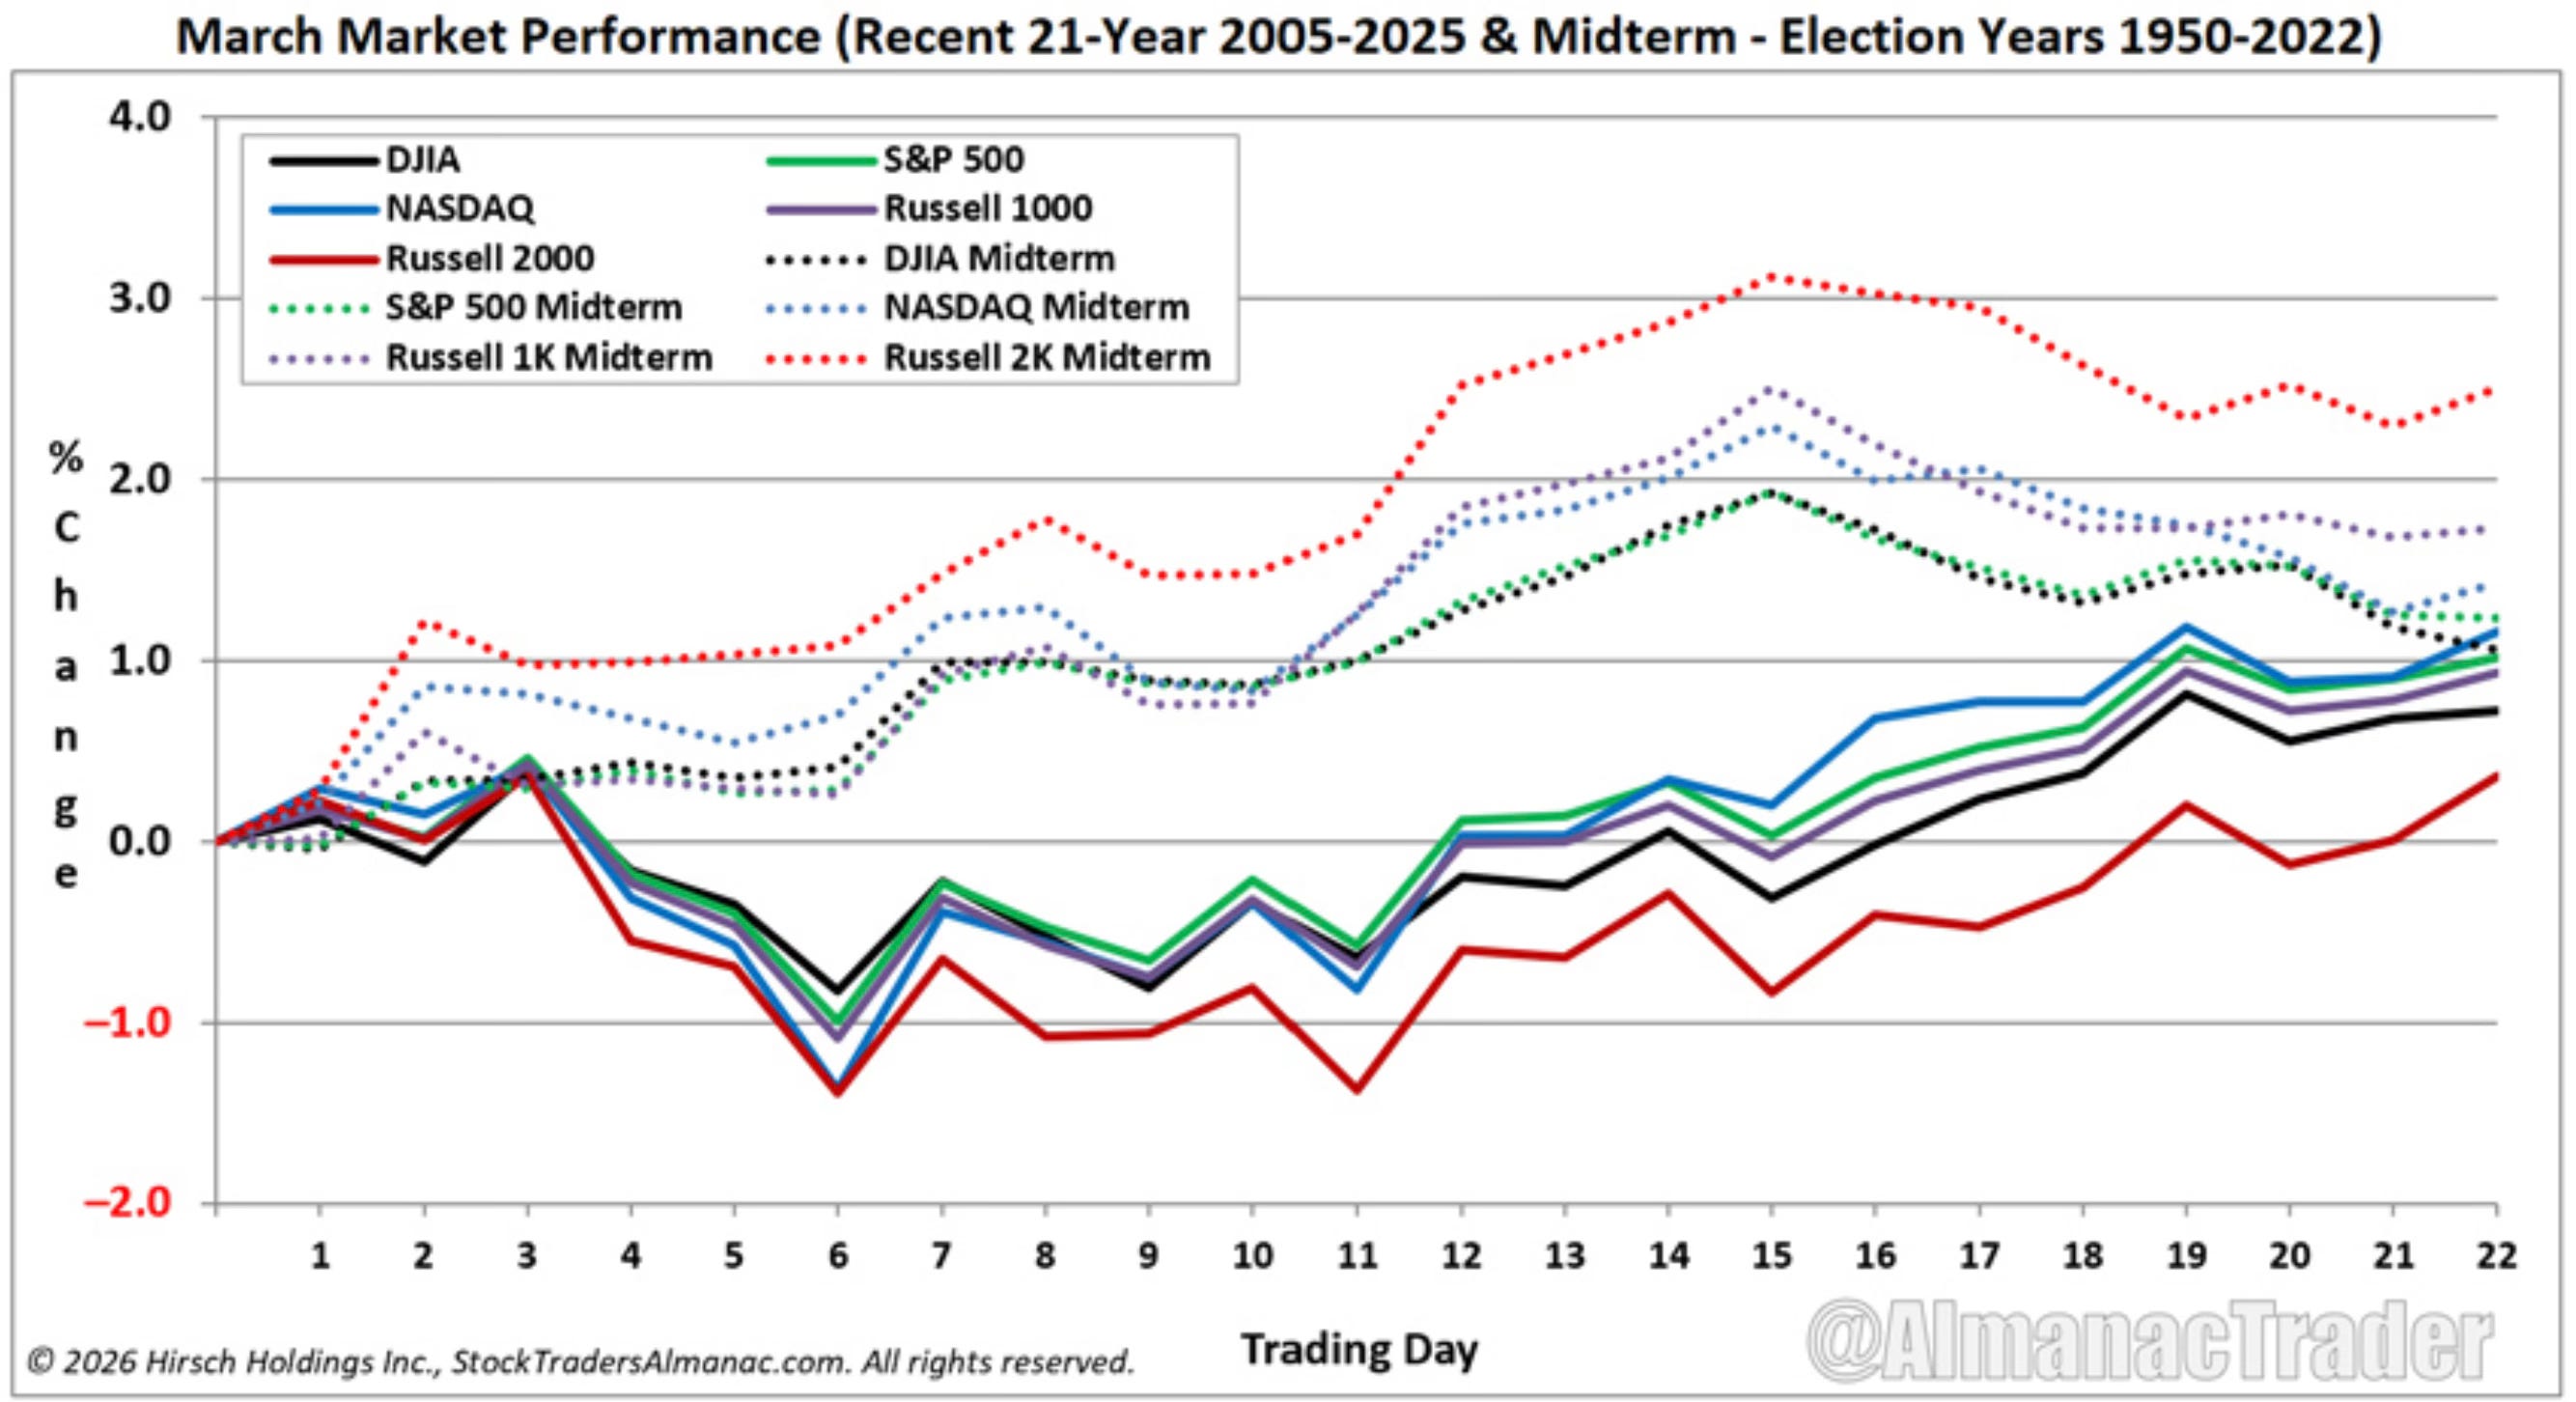
And for those watching the calendar closely. 2026 is a midterm election year. According to Jeff Hirsch at the Stock Trader's Almanac, March in midterm years has historically shown early strength that lasts longer, with the second half of March tending to outperform the first.
If the market feels rough right now, history says that's normal for this time of year. The other side of this window has typically been better.
Jobs Are Now A Concern
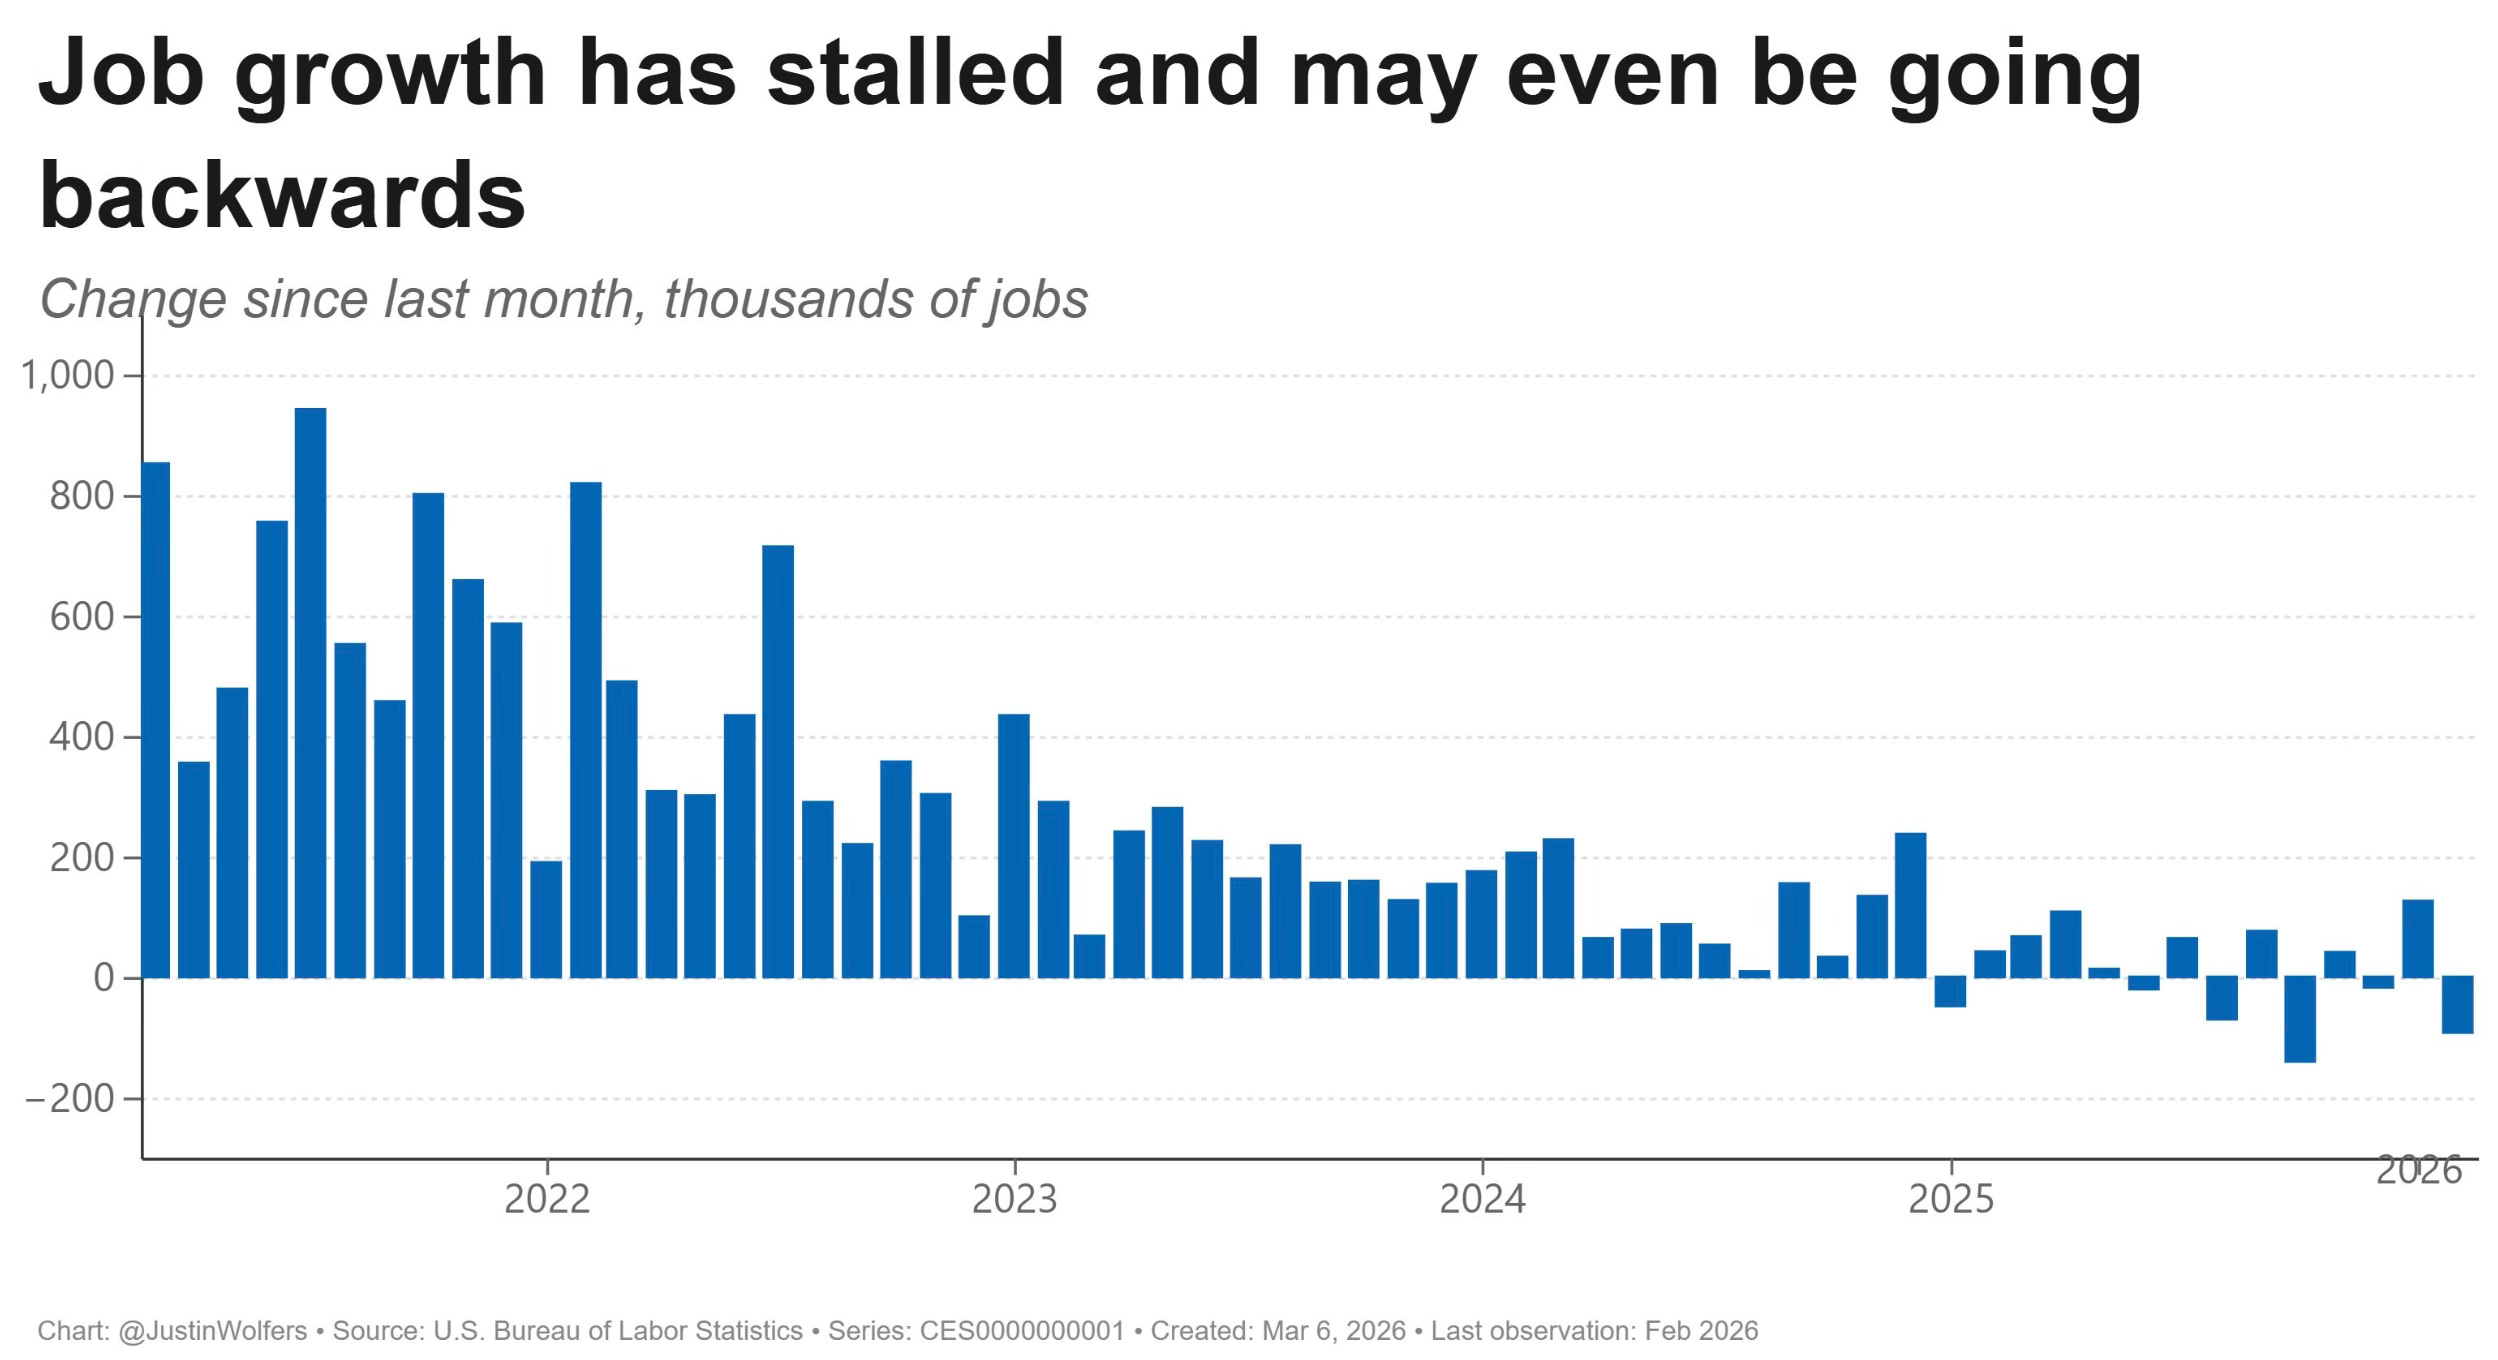
Before we even get to the oil story and the geopolitical headlines, the economic narrative shifted dramatically on Friday morning.