Investing Update: What To Expect In September
What I'm buying, selling & watching
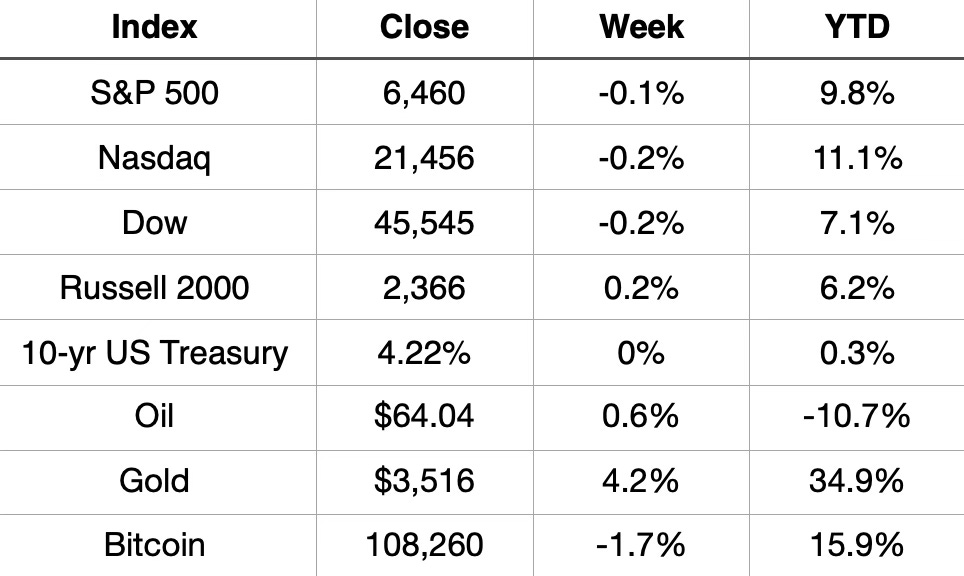
The market ended the week down to close out August. That didn’t happen before the S&P 500 hit its 20th new all-time high of 2025 on Thursday.
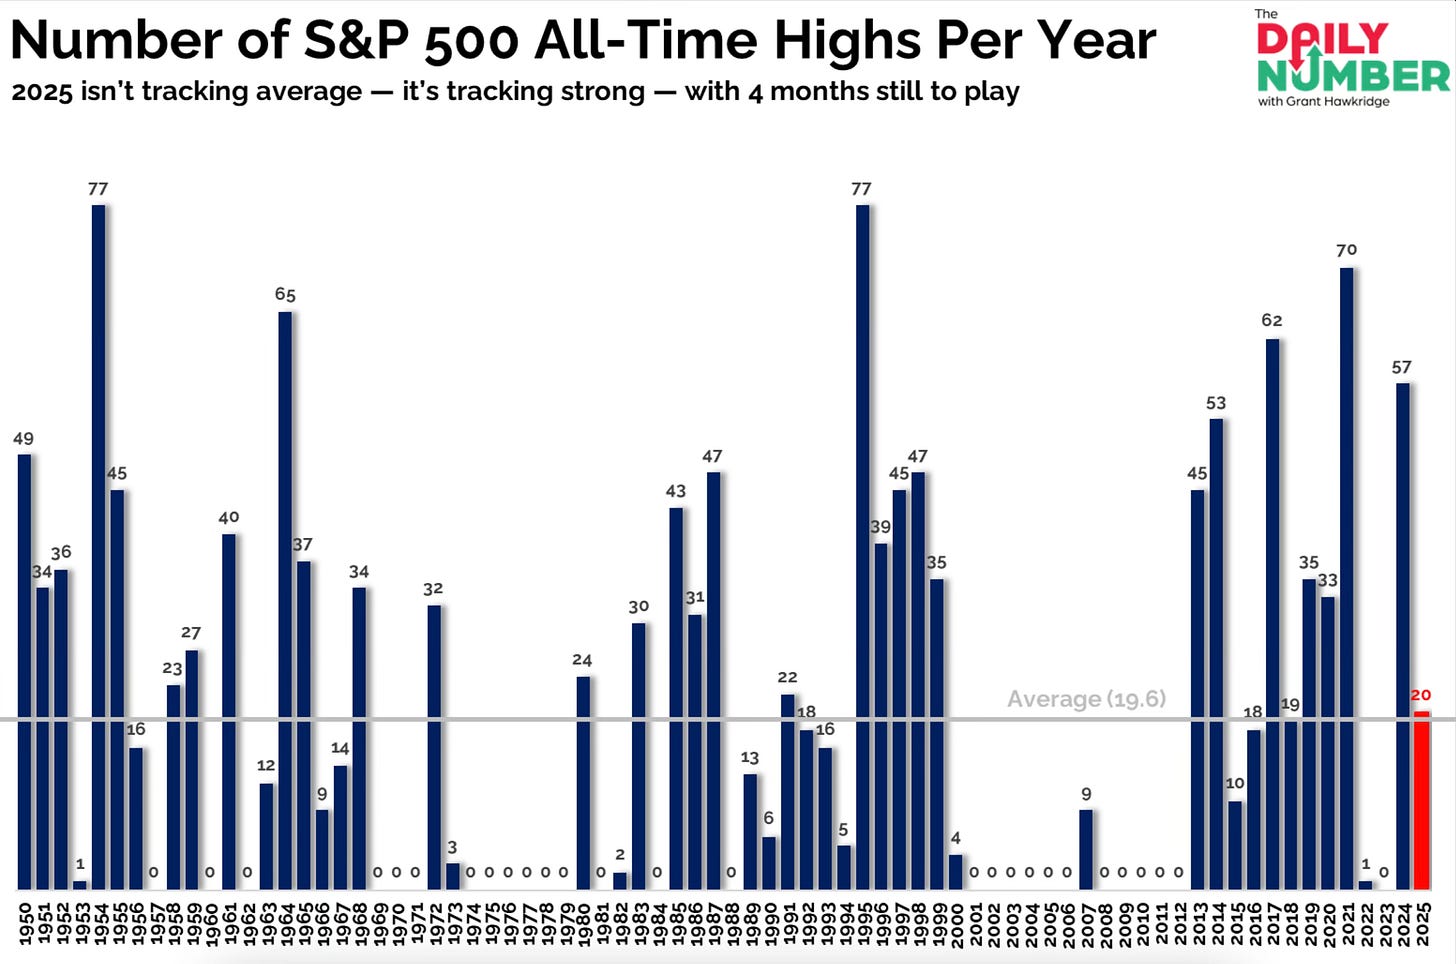
A positive August, now makes it 4 straight months of gains.
YTD the S&P 500 is up 9.8%, the Nasdaq is up 11.1% and the Dow up 7.1%
Market Recap
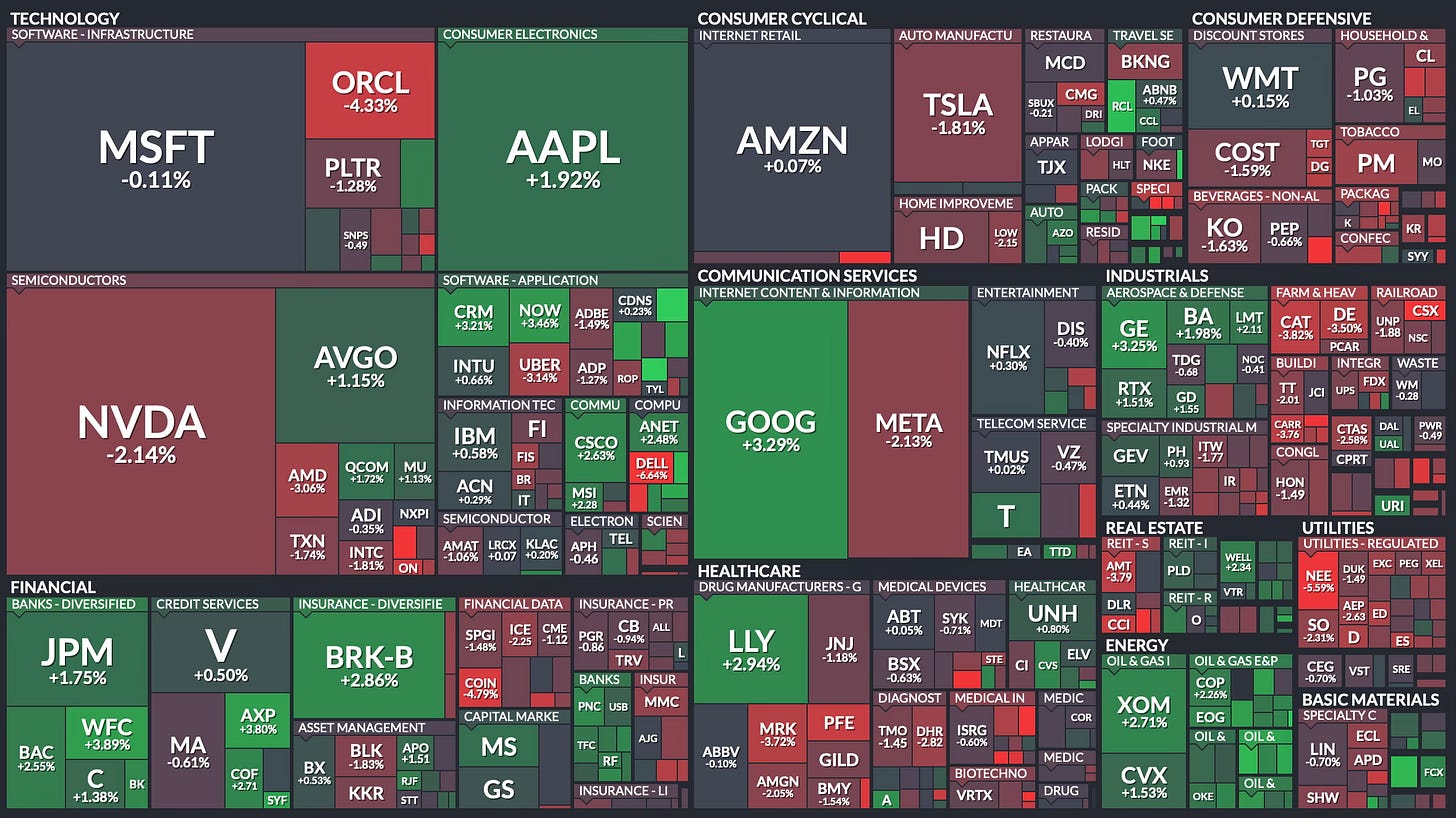
Weekly Heat Map Of Stocks
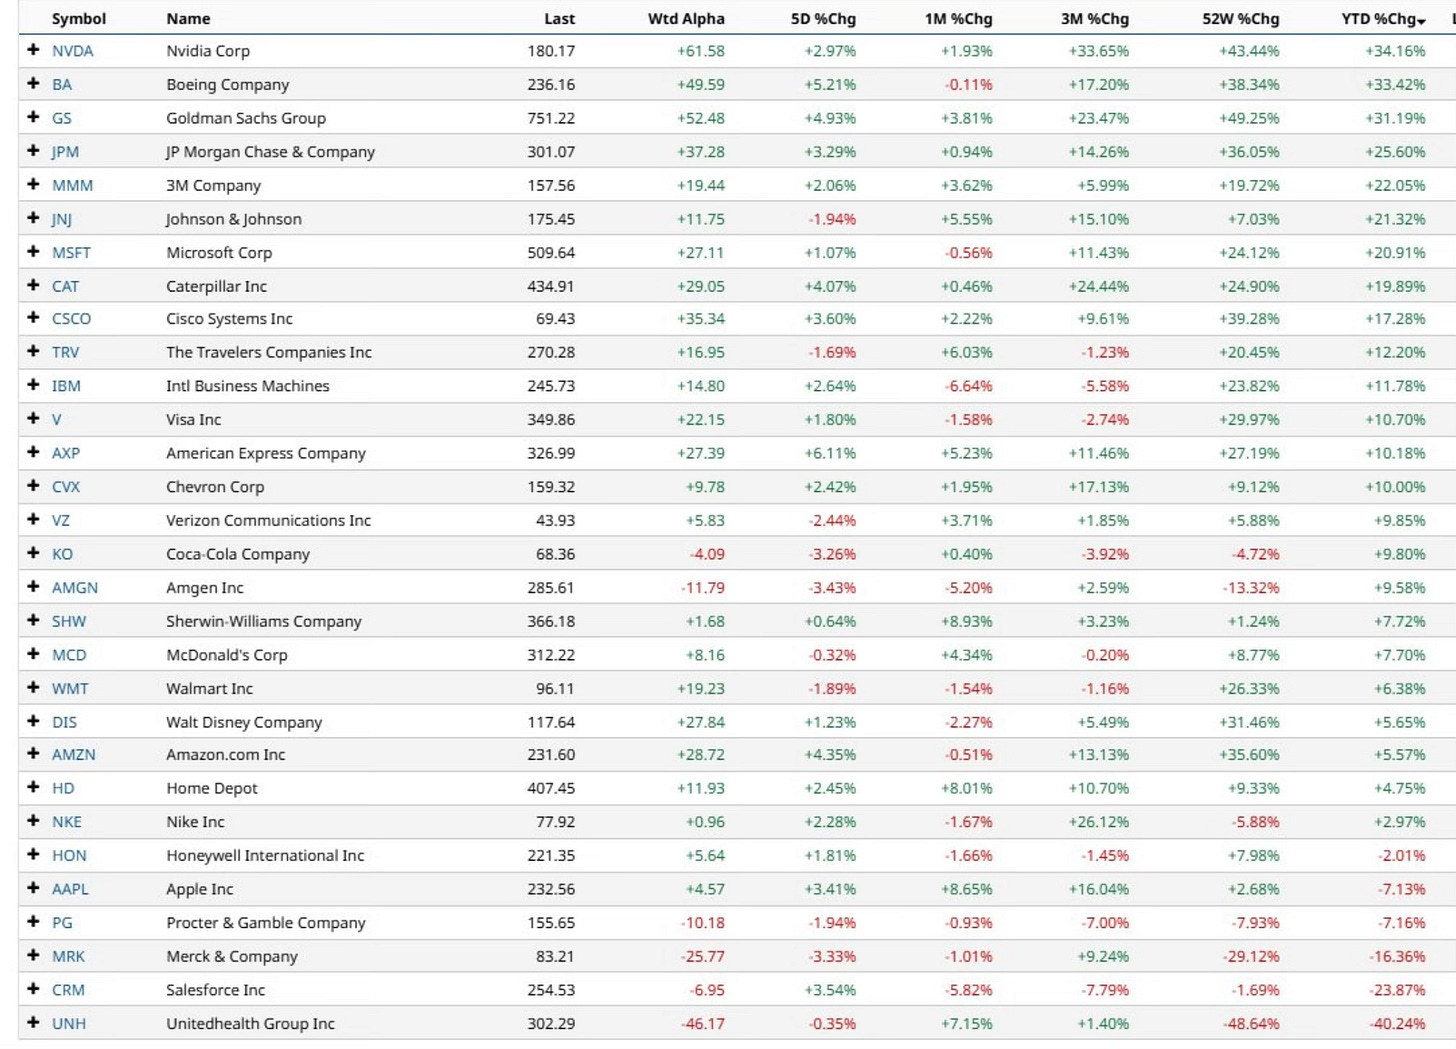
Dow Performers YTD
You can see that for the month of August none of the market indexes were negative.
Small caps are showing signs of life and maybe it’s time they finally break out to new highs.
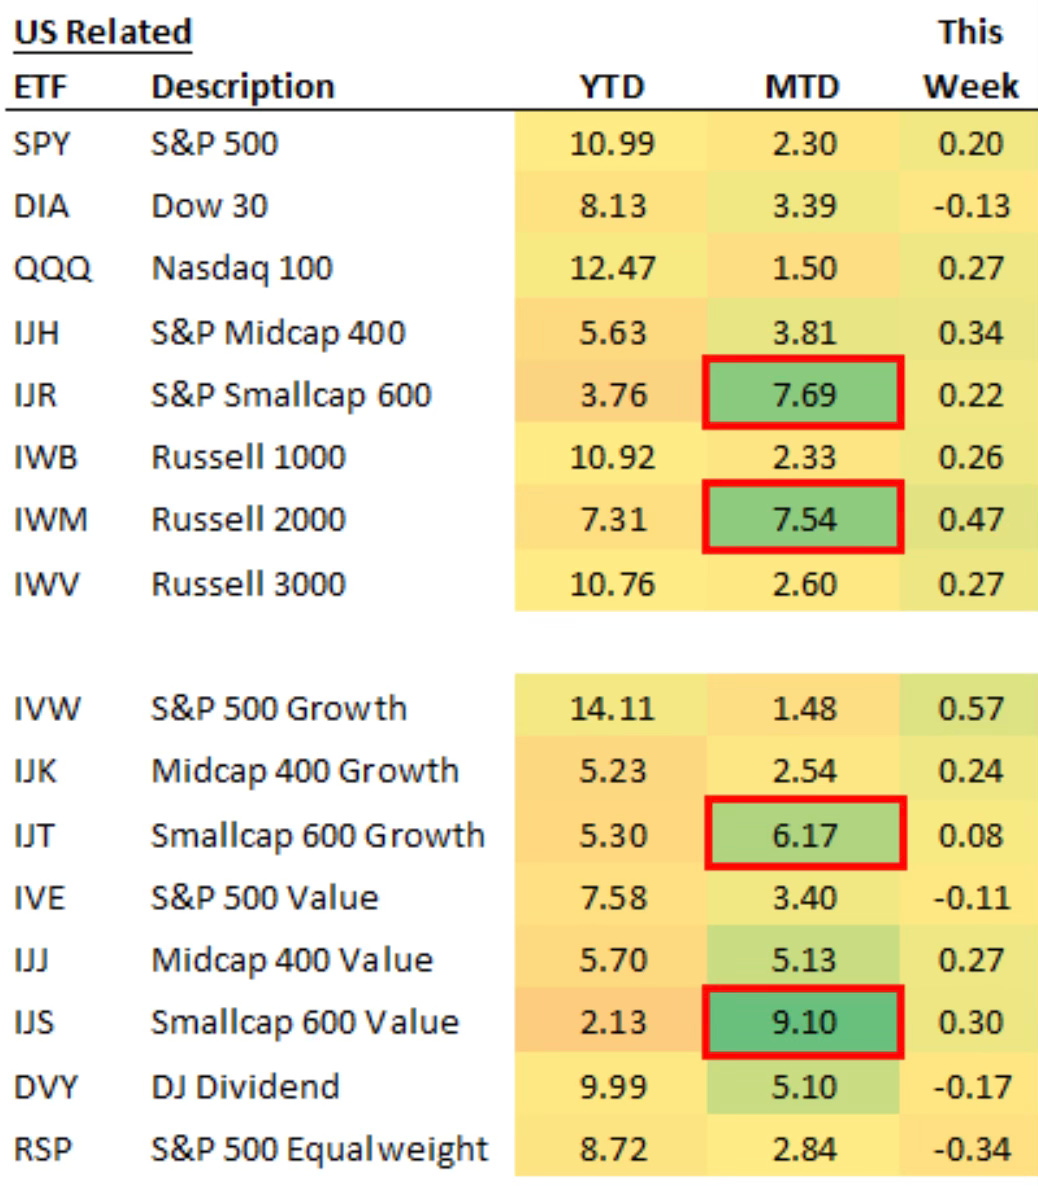
Contrary to what you hear. The market participation has broadened. I’ve been saying this for a while now.
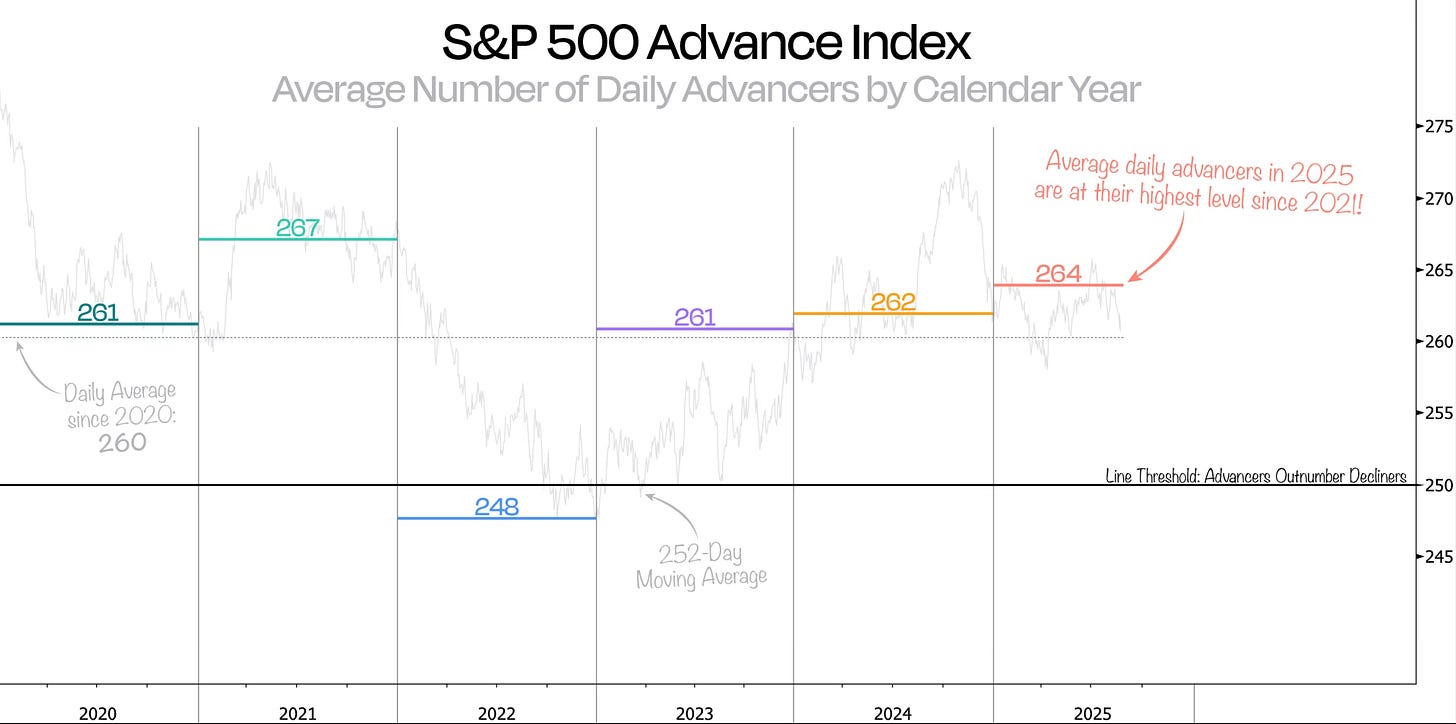
Here is a great chart that illustrates just that. This looks looks at the average number of S&P 500 stocks advancing each day. So far in 2025, that number is the highest since 2021.
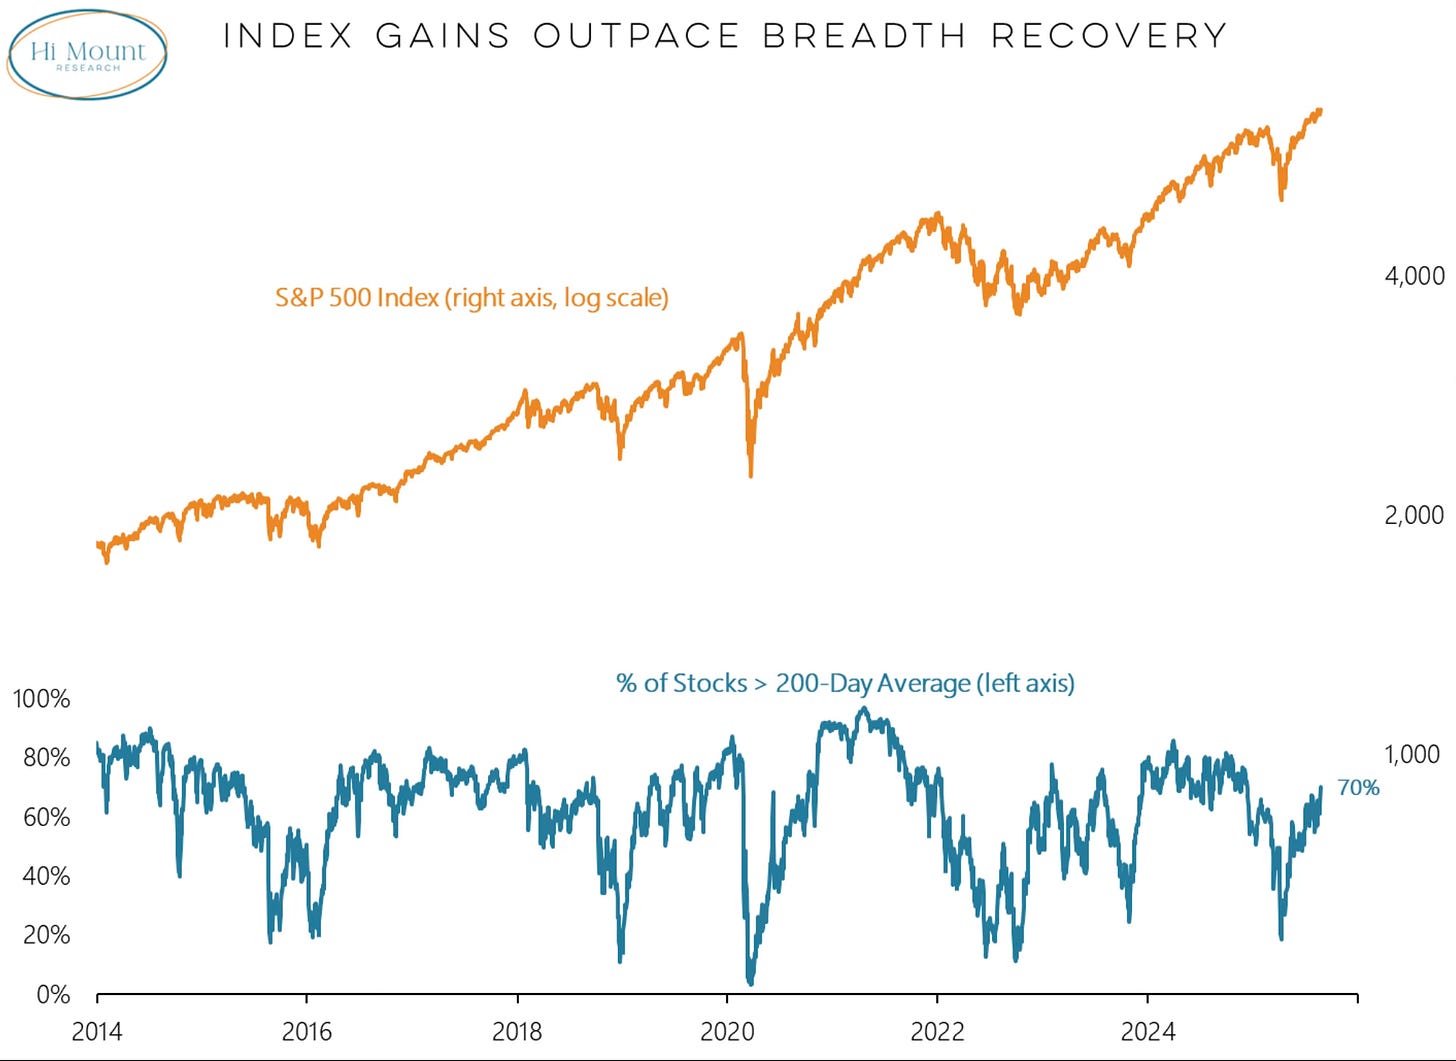
That shouldn’t be a surprise when for the first time this year, more than 70% of the S&P 500 stock are above the 200-day.
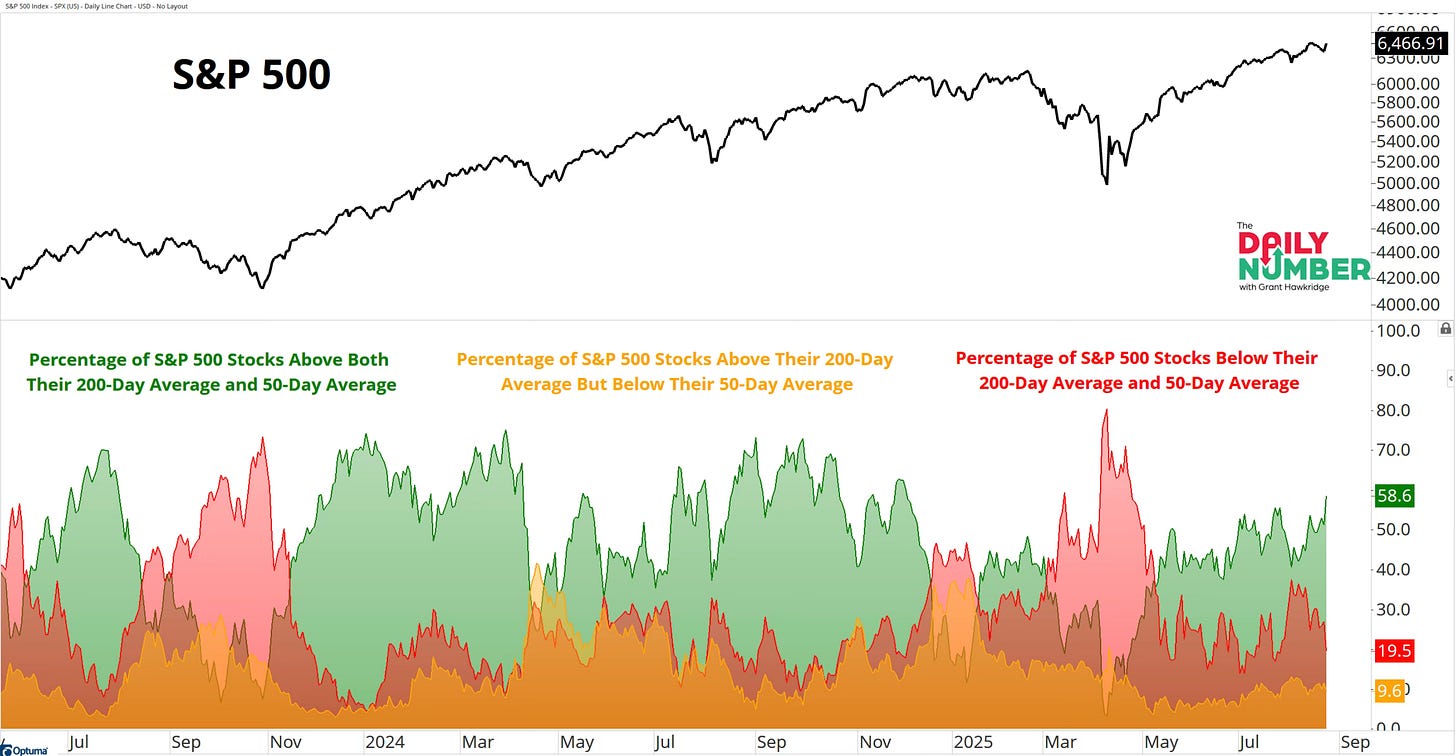
Almost 60% of S&P 500 stocks are above both their 50-day and 200-day.
This is showing strong broadened leadership and emphasizing the bull market strength.
Need more proof of the bull market strengthening and the broad leadership?
The Equal-Weight S&P 500 has now also broke out to its highest level ever.
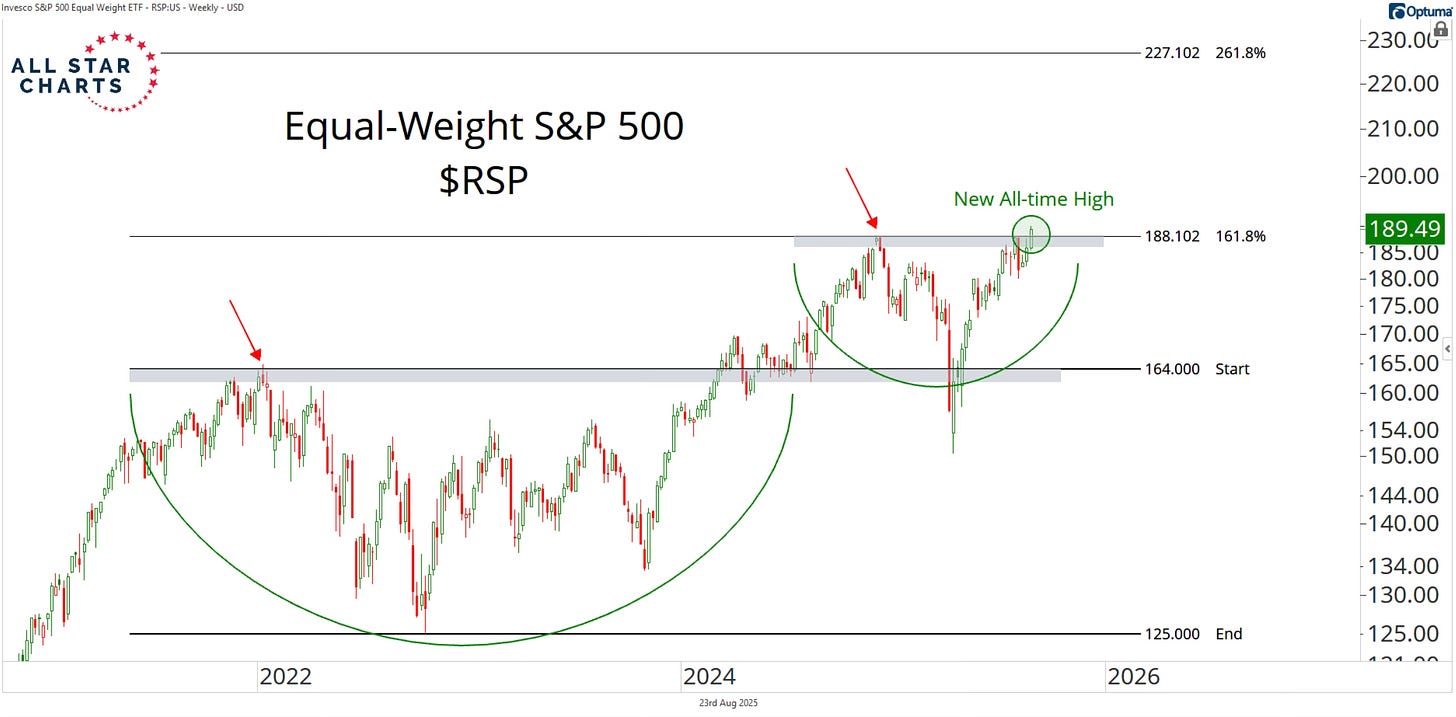
Don’t tell me this market is running on narrow leadership, or that the bull run is fading. The facts say the opposite: leadership is broadening, and this bull market is gaining strength as we head into September.
What To Expect In September
After 4 straight positive months for stocks, does that streak end in September?

