
Hi friends! 👋
Grab a coffee. It was a wild week. Here’s what’s on my radar.
Bad, But Not Historic
Fear Is Back
What the Heck Happened?
What I’m Watching
The Secret Winner
Moves I’ve Made
Let’s get into it.
Eric
Market Recap
What a week.
Democrats swept the midterms and Wednesday the Dow jumped 1,569 points, its best day since April 2025.
Then Thursday happened. The AI trade cracked. The Nasdaq fell 5.5% into correction, the S&P 500 dropped 4.4%, and the Dow gave back 1,833 points. All three had their worst day since Liberation Day. The S&P’s streak of 394 trading days without a 3% drop is over.
Friday brought a small bounce. Honestly, I thought we’d see more of one after Thursday’s beating. We didn’t.
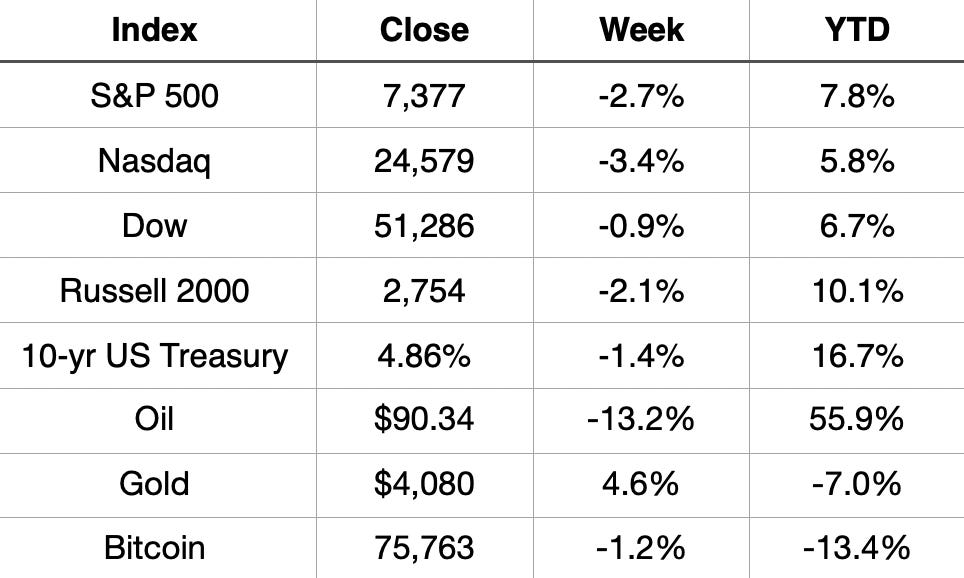
The Nasdaq lost 3.4% on the week and the S&P 500 lost 2.7%. Oil was the biggest mover, down 13.2%. Gold was the winner, up 4.6%.
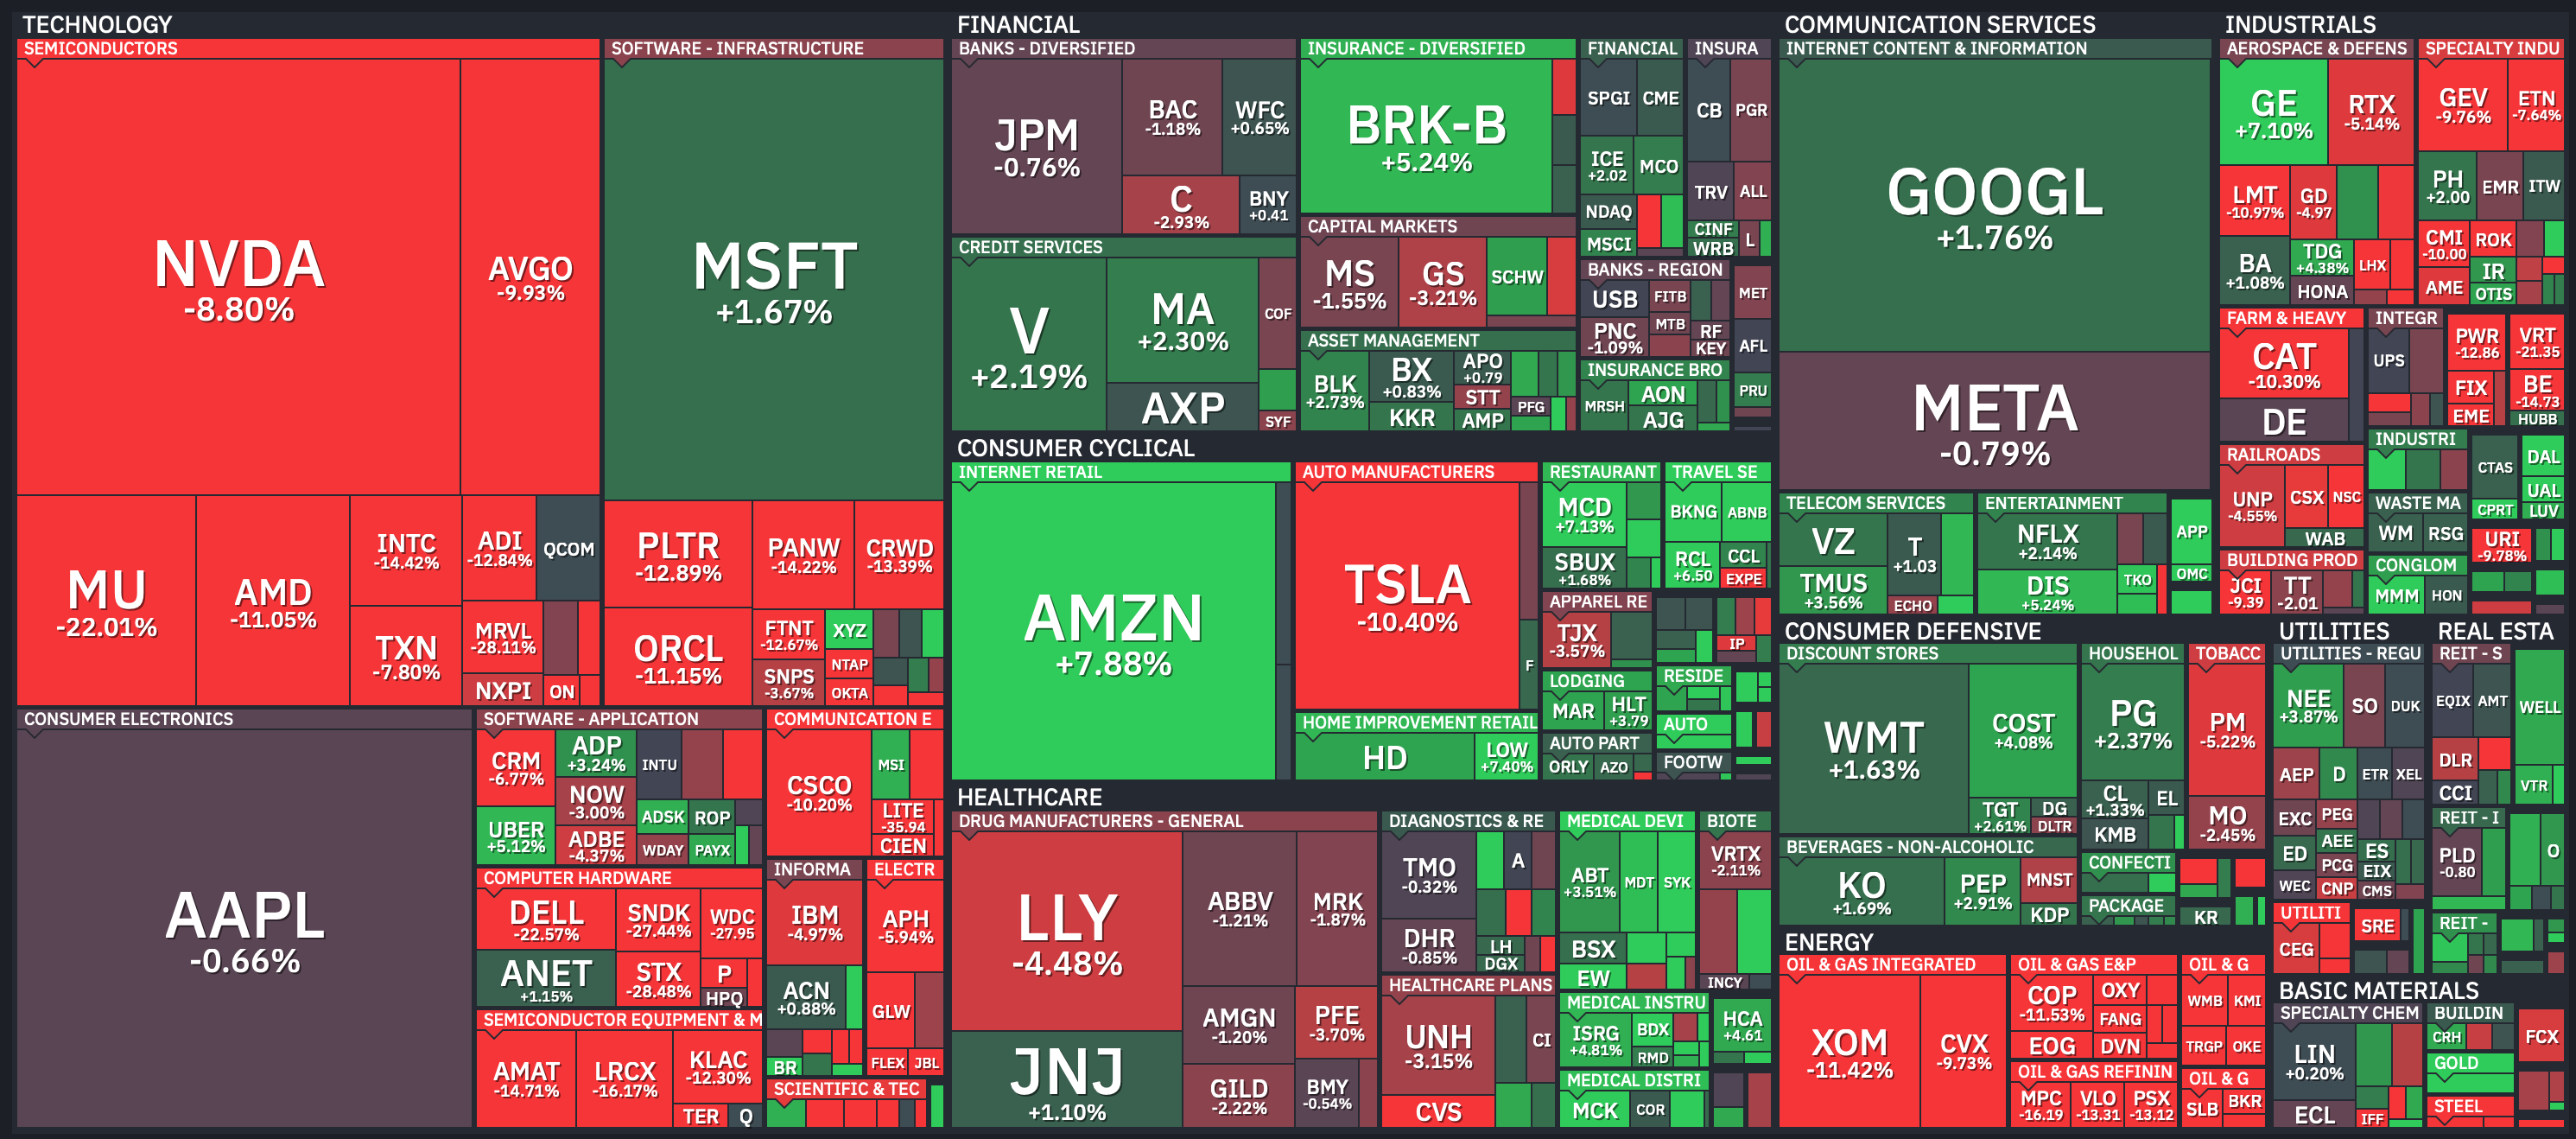
Weekly Heat Map of Stocks
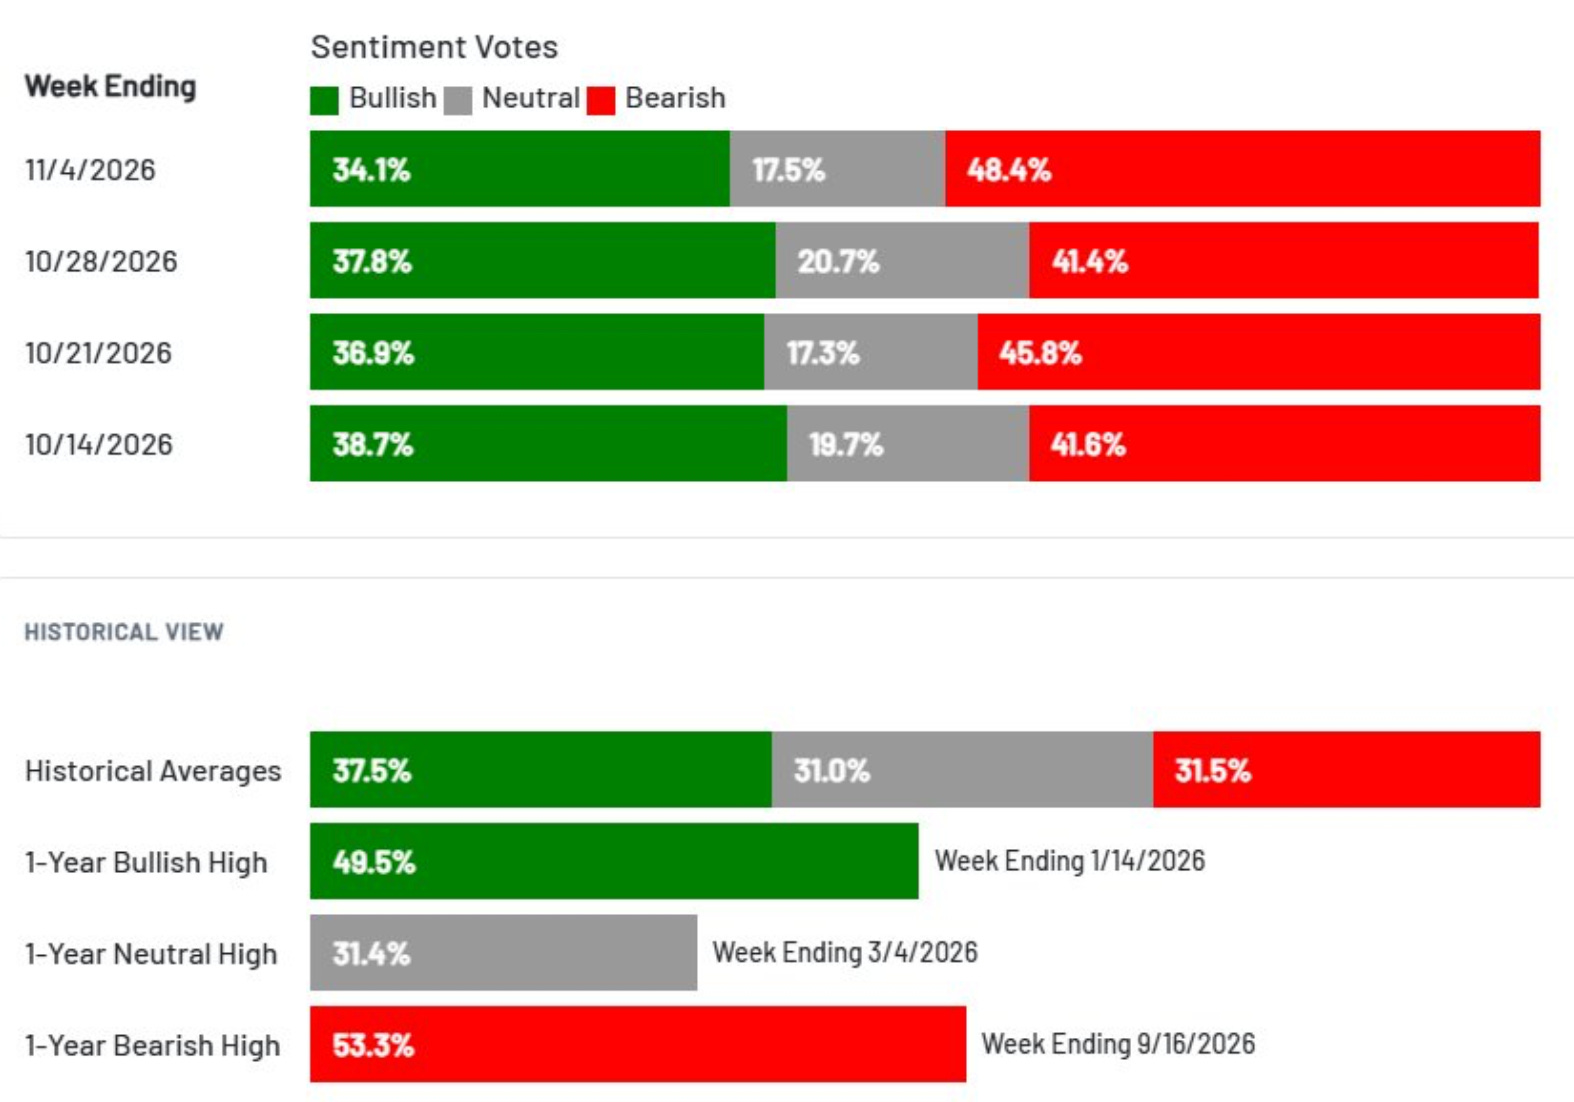
Sentiment Check
AAII bears jumped to 48.4%. That’s well above the 31.5% historical average and the 2nd most bearish week since April. Fear is back. Historically that’s been a better time to buy than sell.
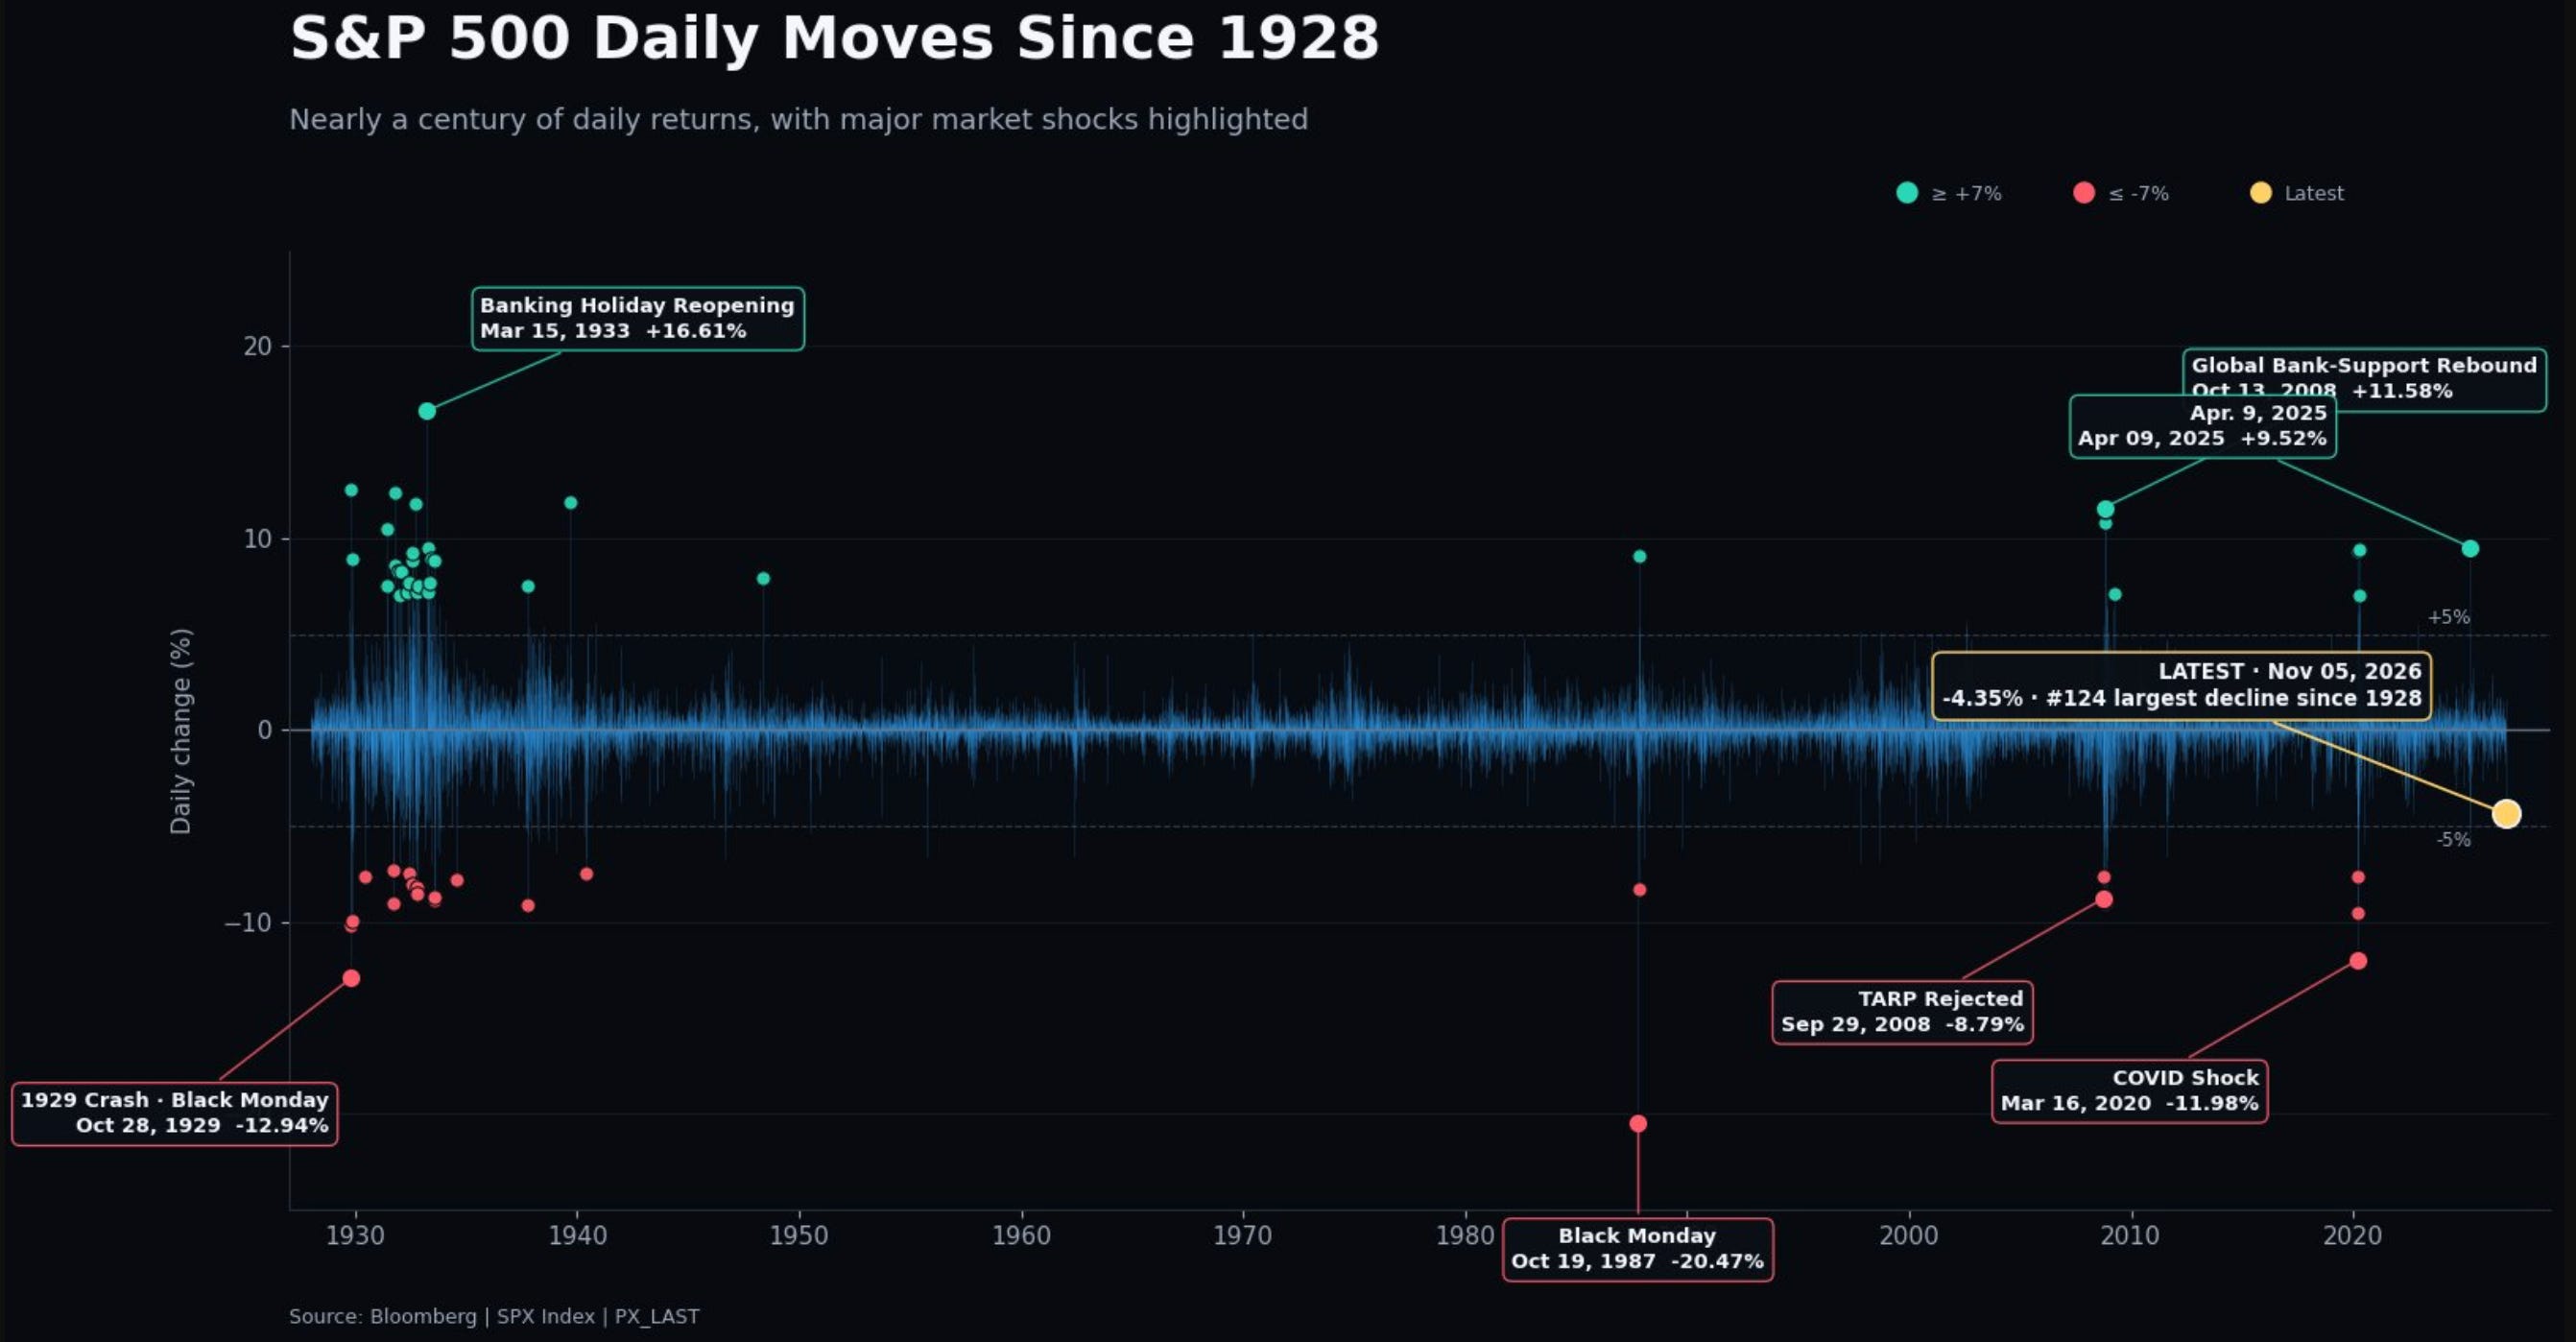
Bad, But Not Historic
Just how bad was Thursday? This is my favorite chart of the week. It shows every daily move for the S&P 500 back to 1928. Thursday’s 4.35% drop ranks as the 124th worst day in nearly a century.
It’s not new either. This is now the third pullback of 5% or more this year. The S&P 500 fell 9.8% from January to March and 5% in June. Both times it went on to new highs.
This one sits at 6.3%. The median pullback since the 2009 low is 7.6%.
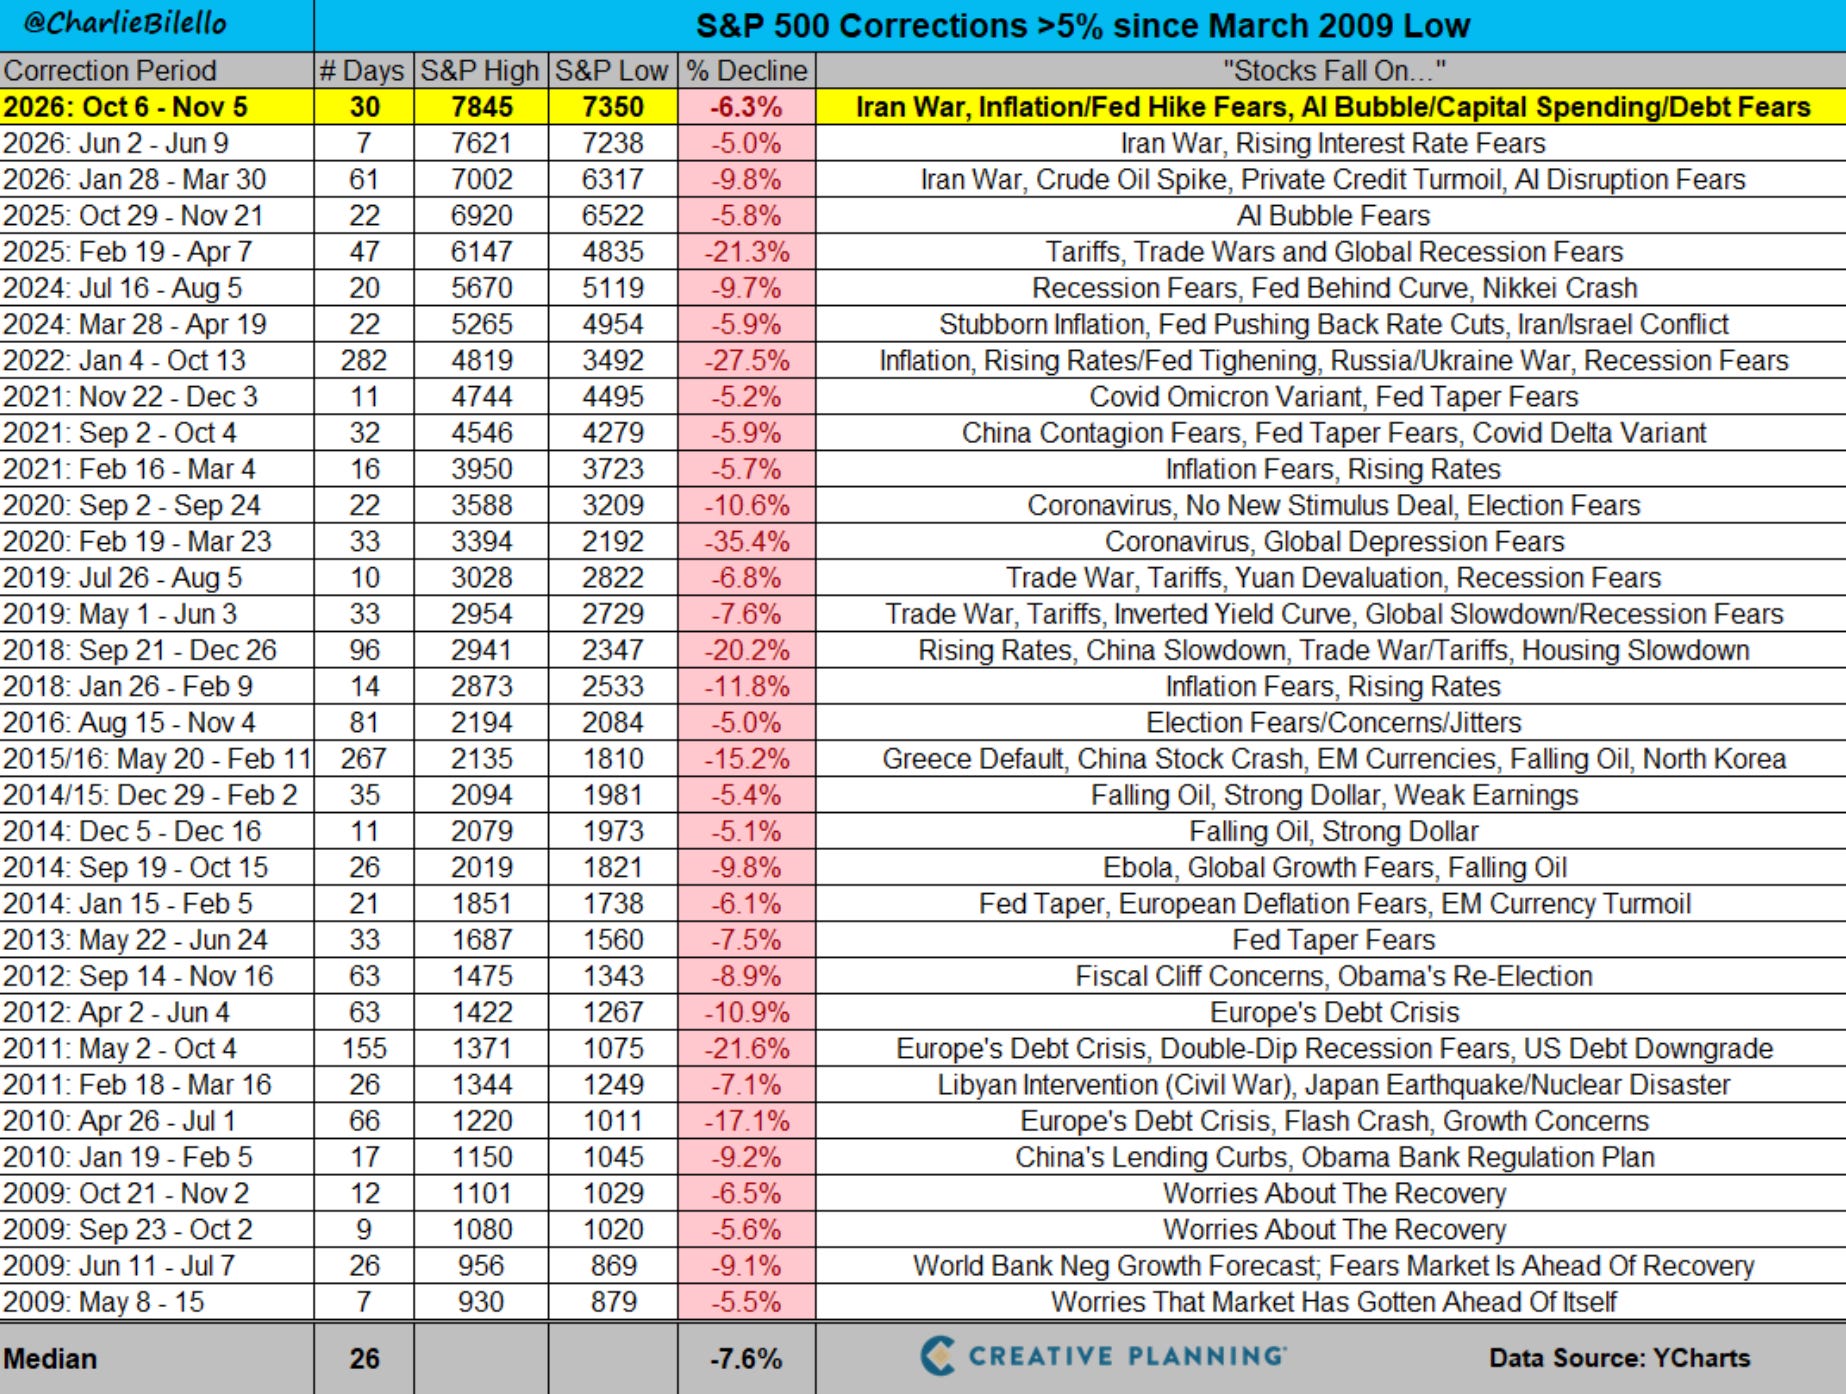
And pullbacks happen a lot more than people think. Since 1928, the S&P 500 has averaged more than three 5% pullbacks a year. A 10% correction comes about once a year. We’ve had three 5% pullbacks in 2026. That’s right on schedule.
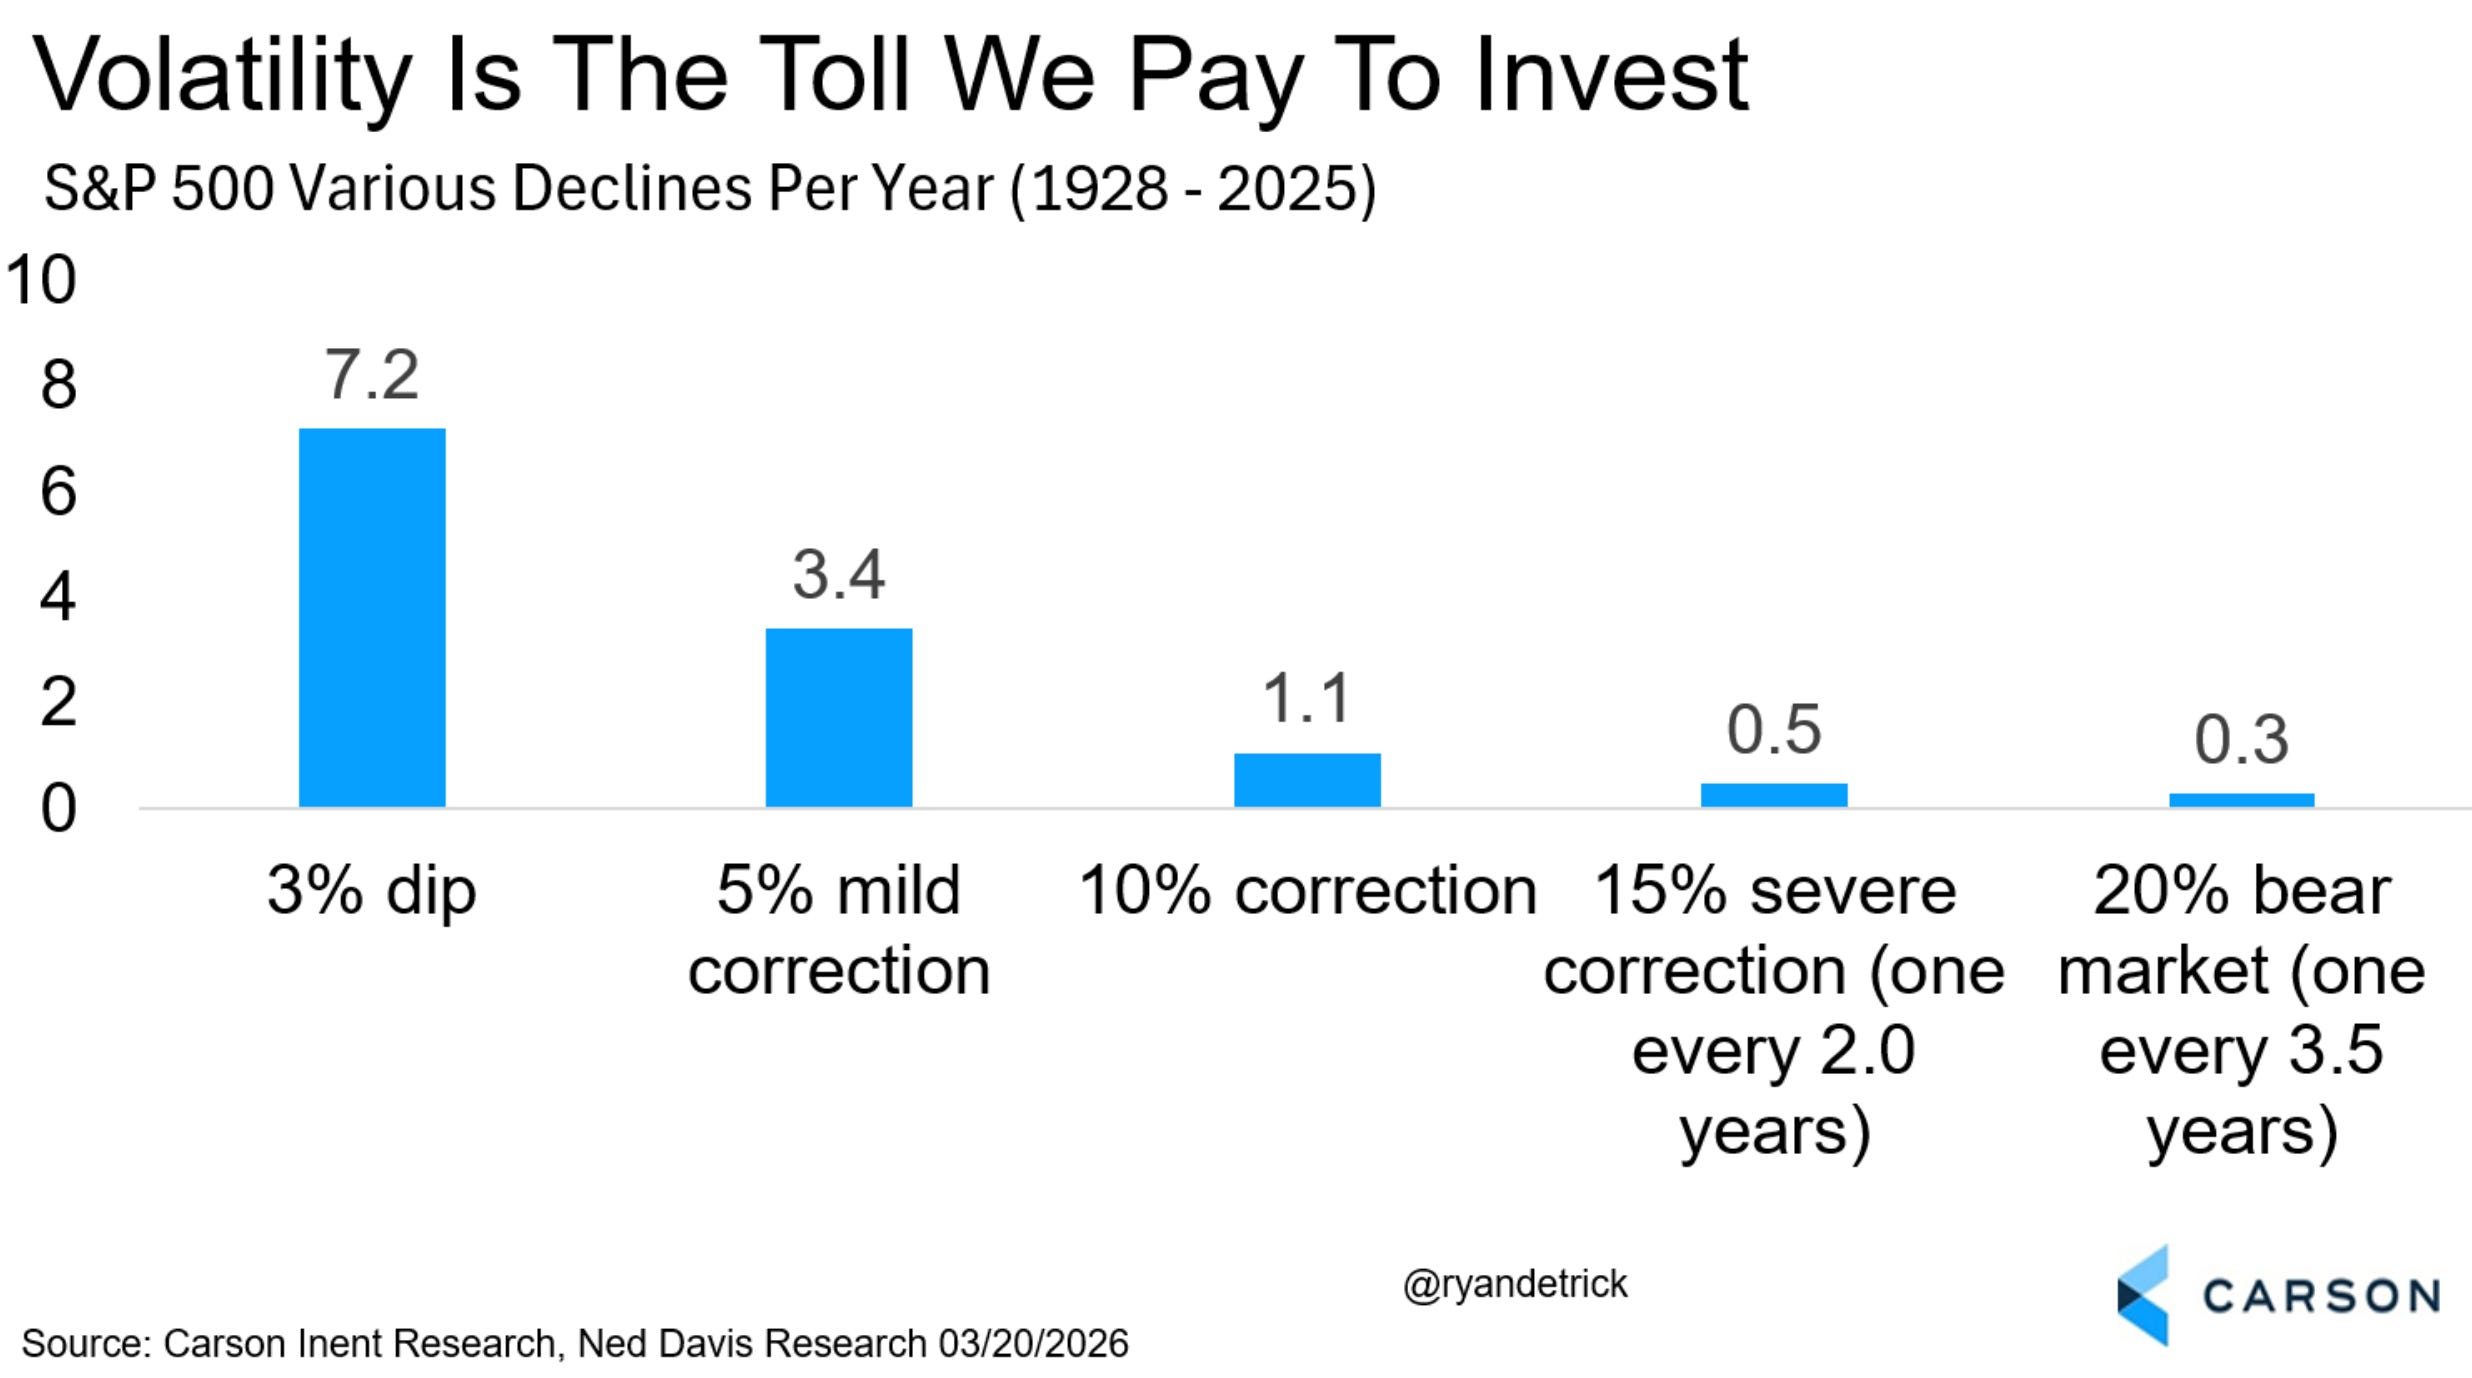
Volatility is the price of admission.
Pullbacks bring fear. And this week the fear gauge lit up.
Fear Is Back
The VIX is Wall Street’s fear gauge. On Thursday it jumped to 28. That’s its highest close since March 30th and its biggest point gain since Liberation Day.
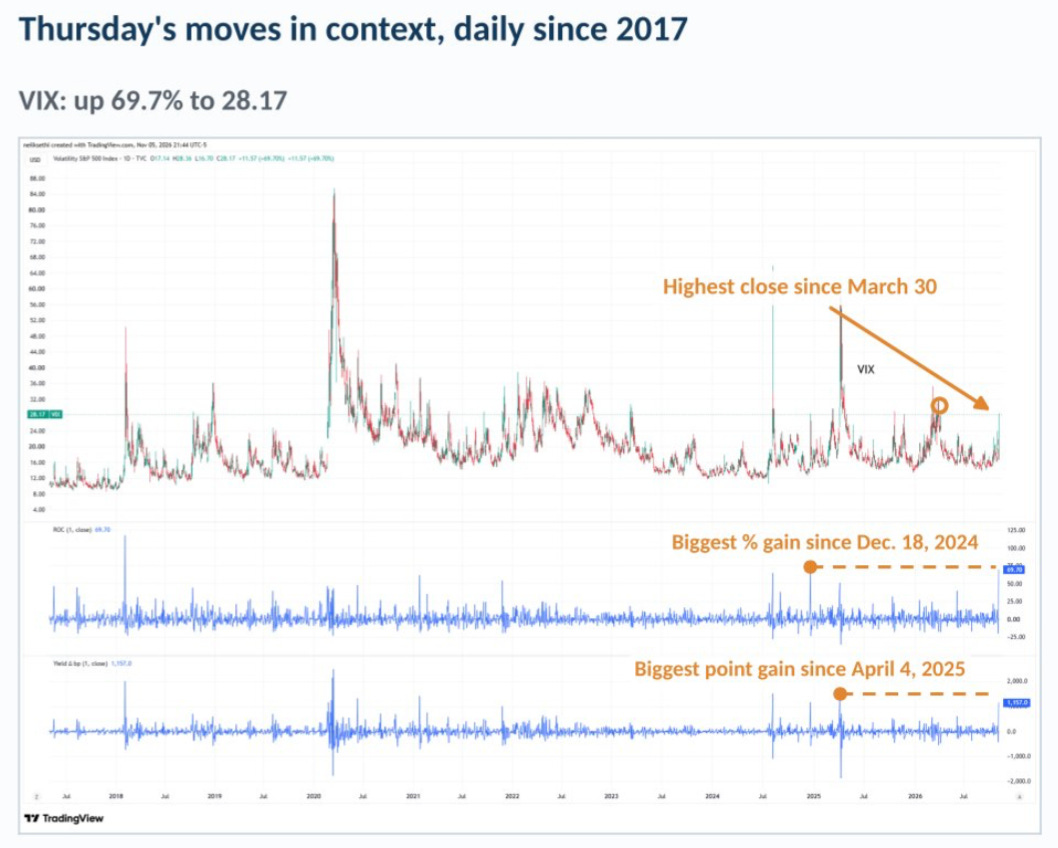
I don’t love quoting the VIX in percentage terms. But this shows just how big the spike was. Up 70% in a single day. The 3rd largest one-day jump since 1990.
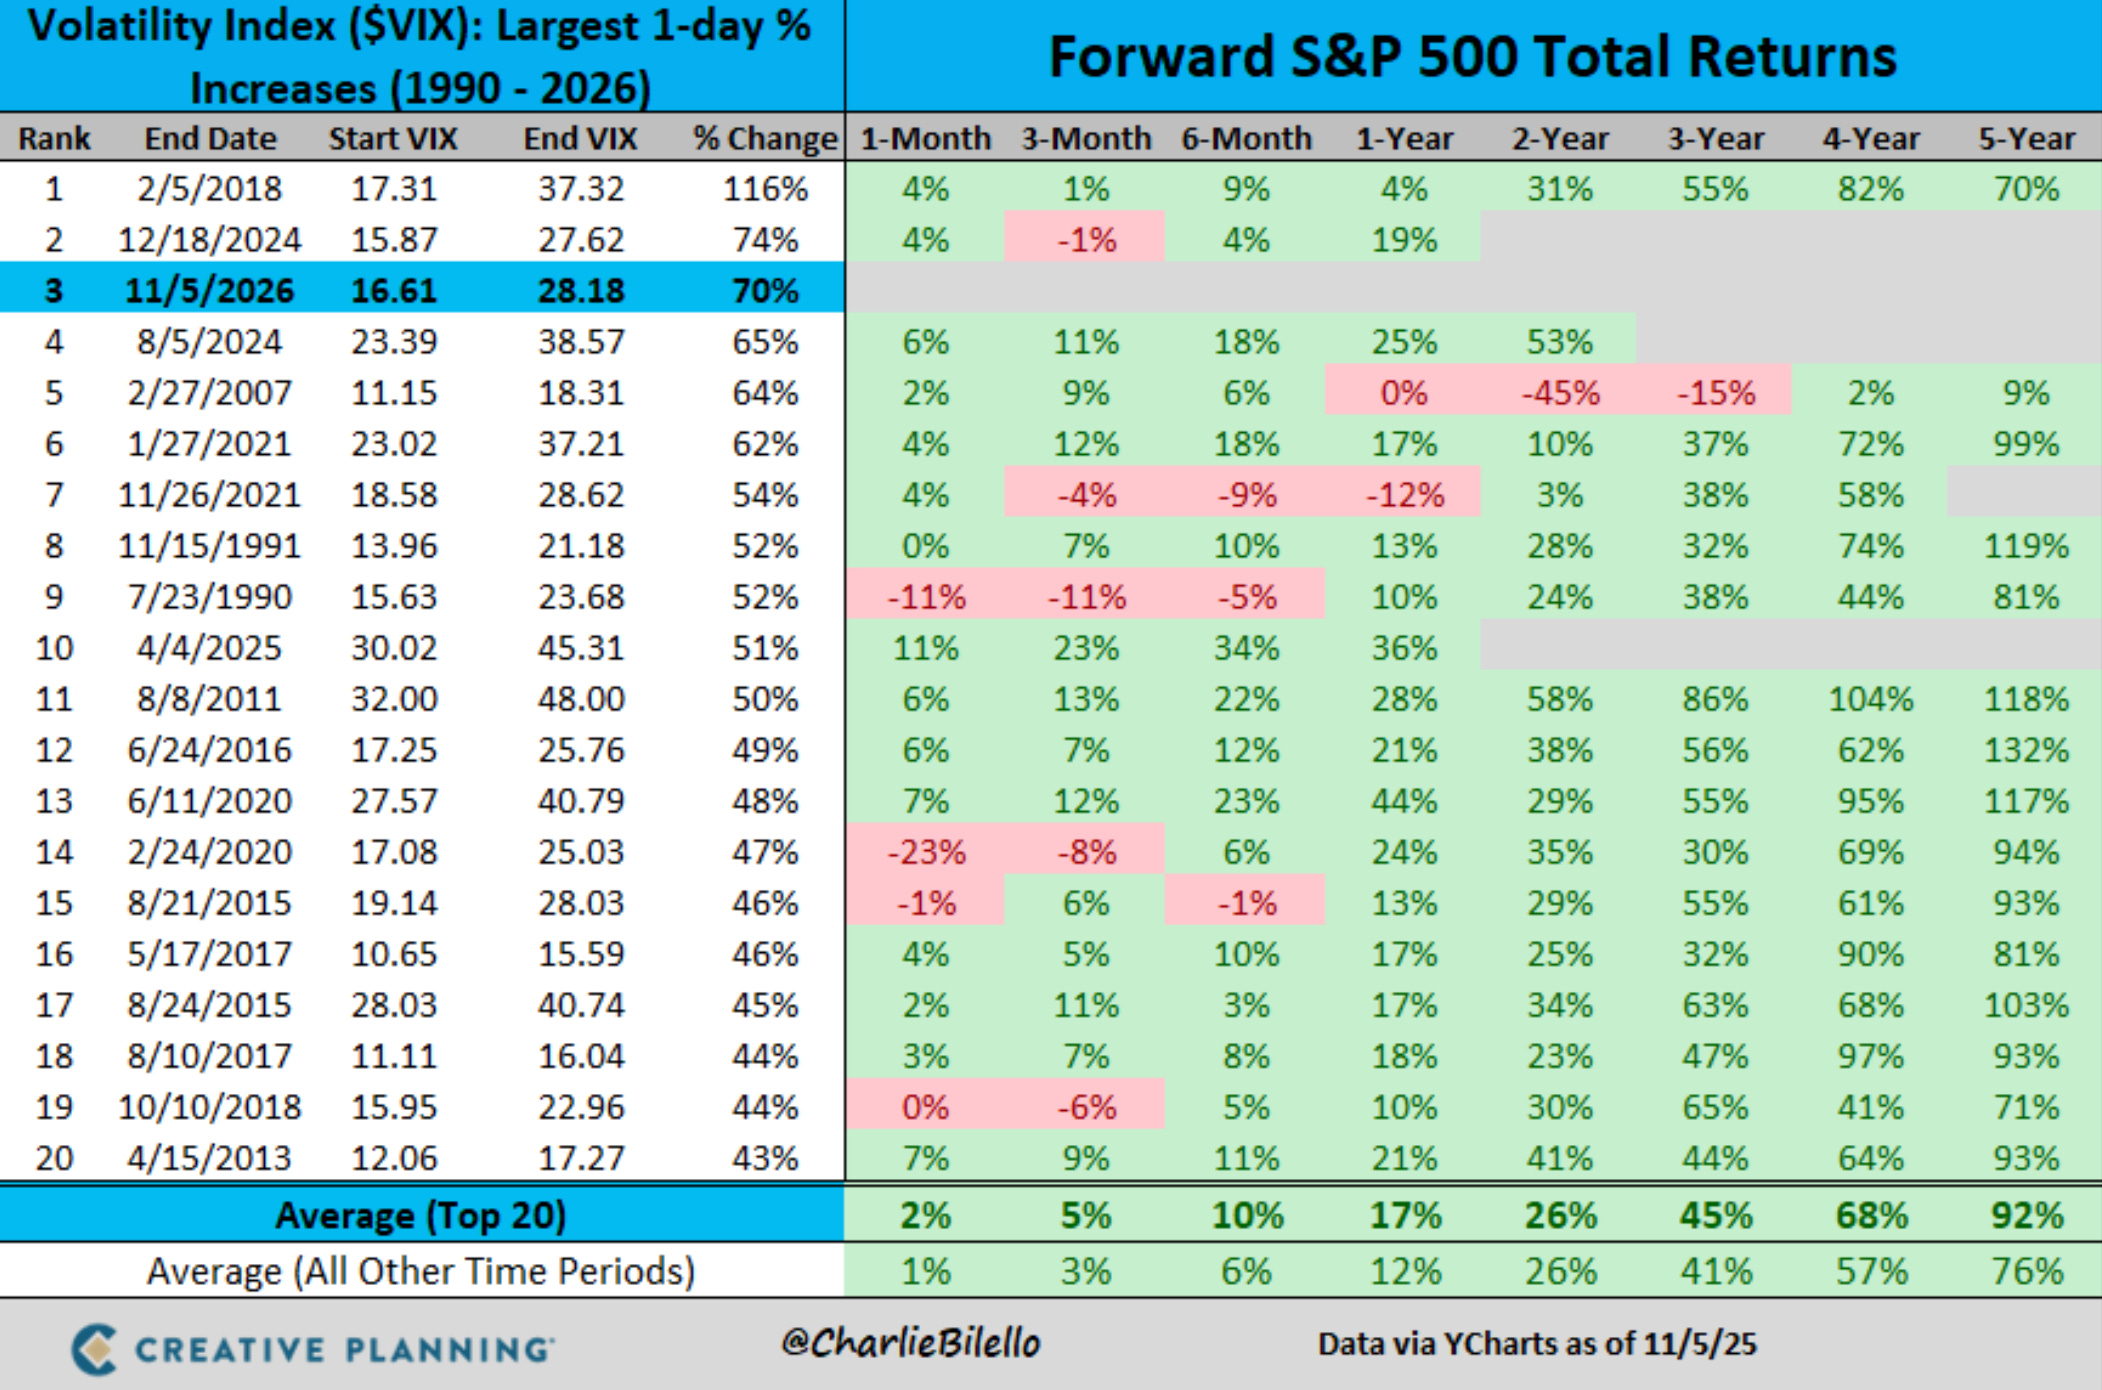
Could stocks fall further? Sure. You don’t know and neither do I. But we can look at history and what happened after big VIX spikes like this one.
After the prior 8, the S&P 500 was higher 6 months later every single time. Up 10.4% on average. One year later it was up 14.7%.
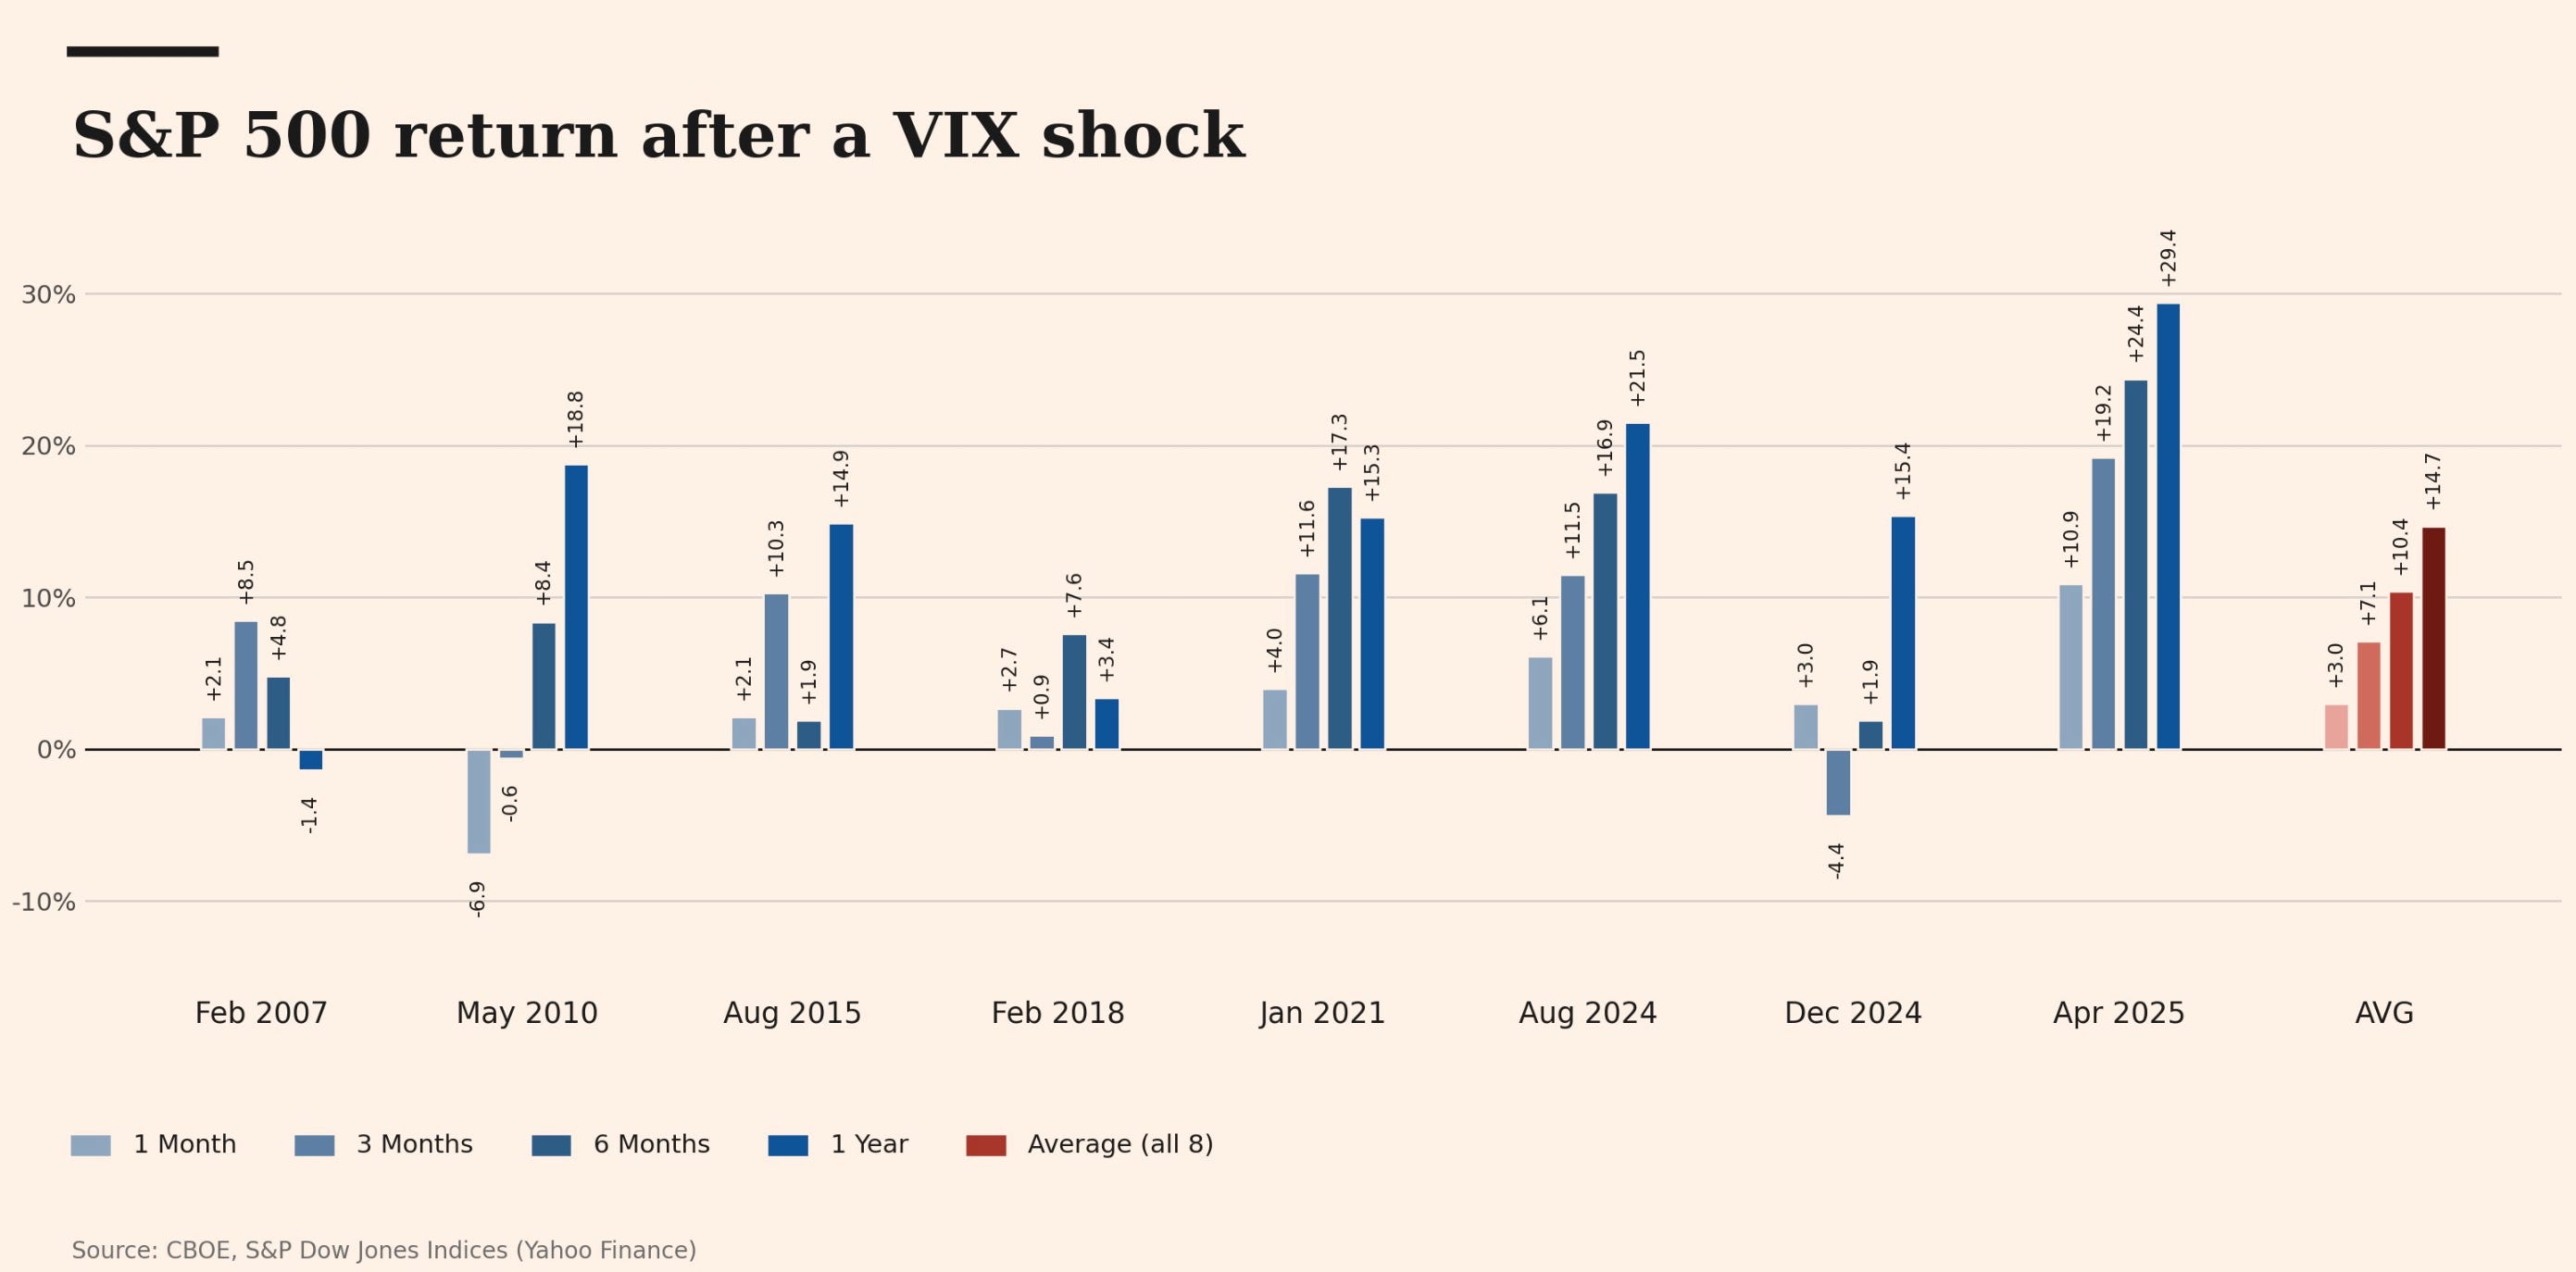
Fear spikes. Then it fades. The market has a habit of rewarding those who don’t panic.
So why did everyone panic this week? Let’s dig in.