
Investing Update: Was That The Bottom?
What I'm buying, selling & watching
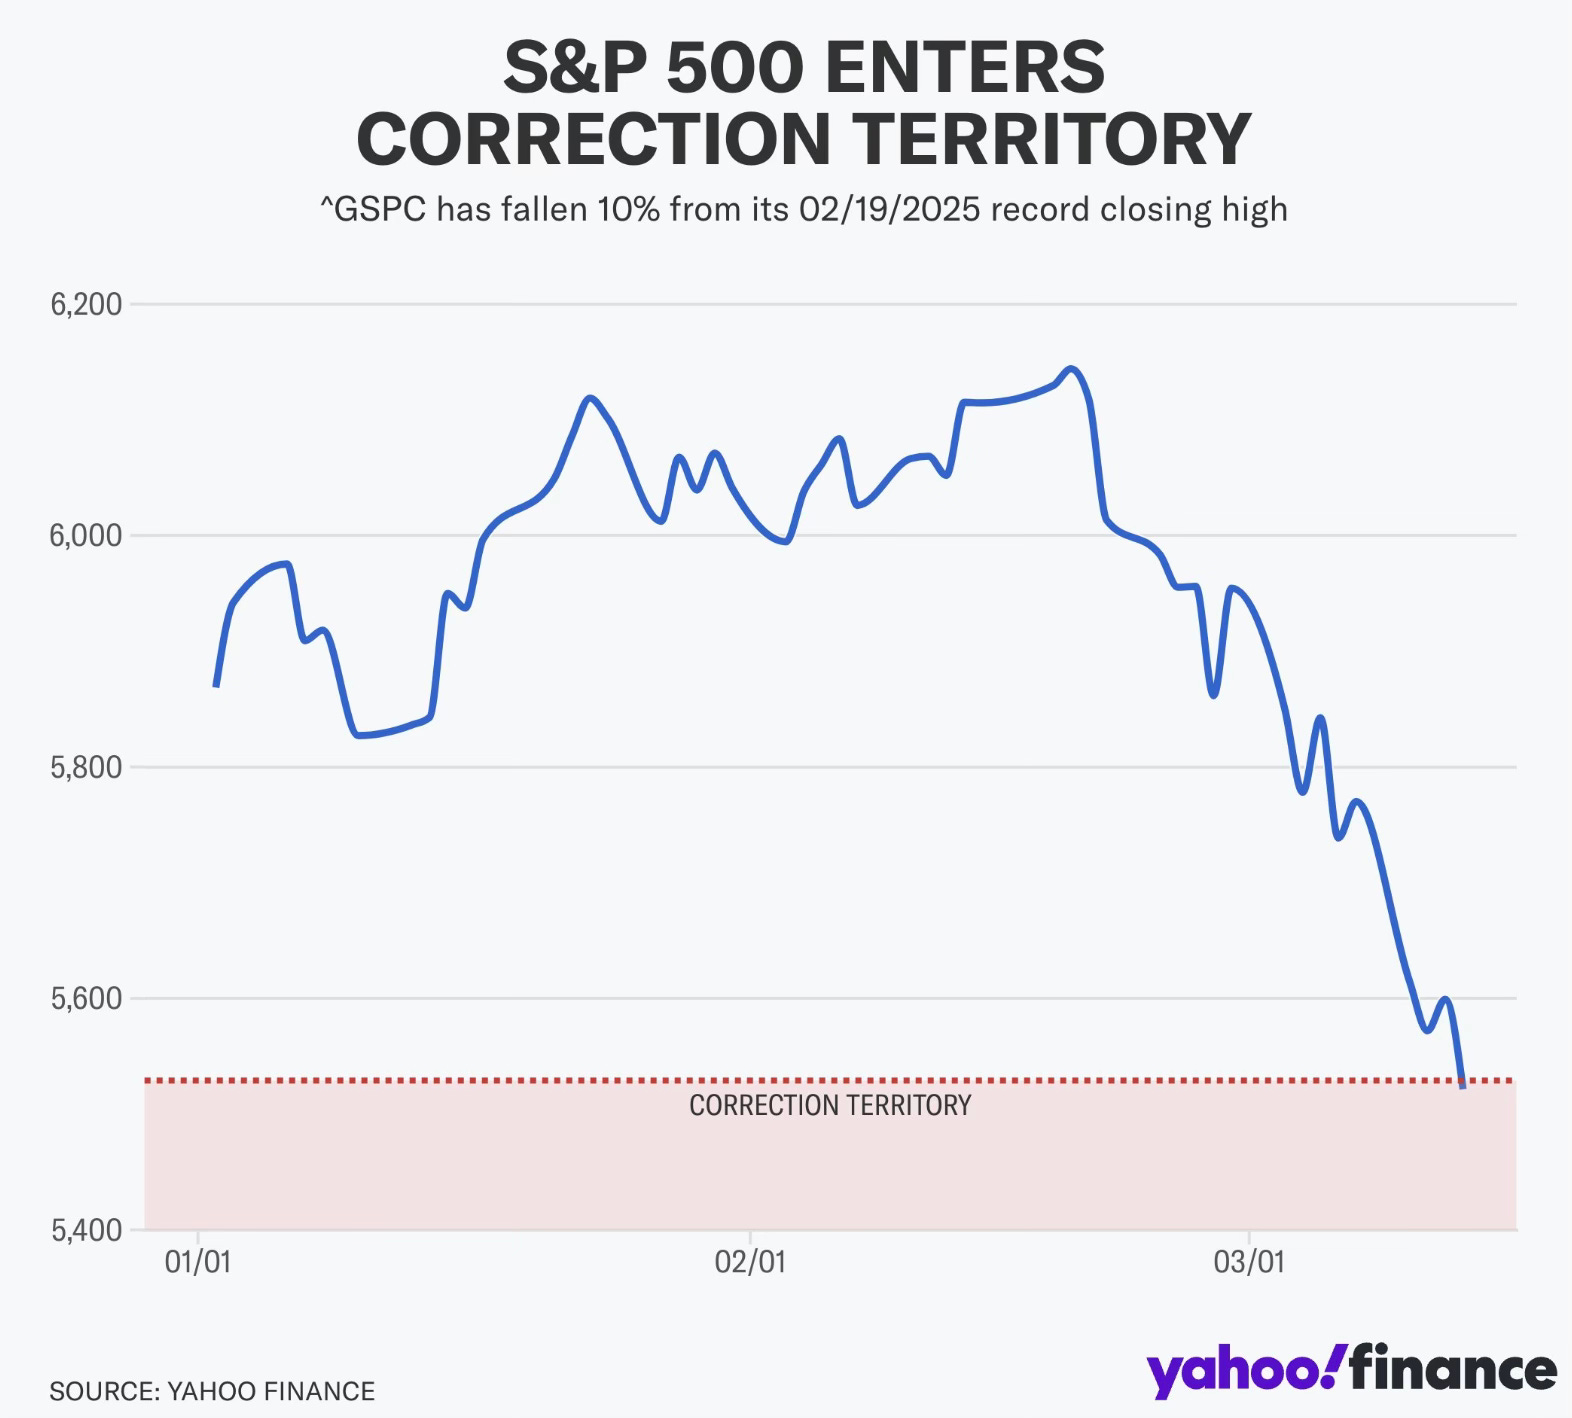
Earlier this week saw the S&P 500 hit correction territory, which means it had fallen over 10% from the recent peak.
Then the week ended with Friday being the best day since November 6th, the day after the election for both the S&P 500 and the Nasdaq. It was still the worst week since 2023 for all the major indices.
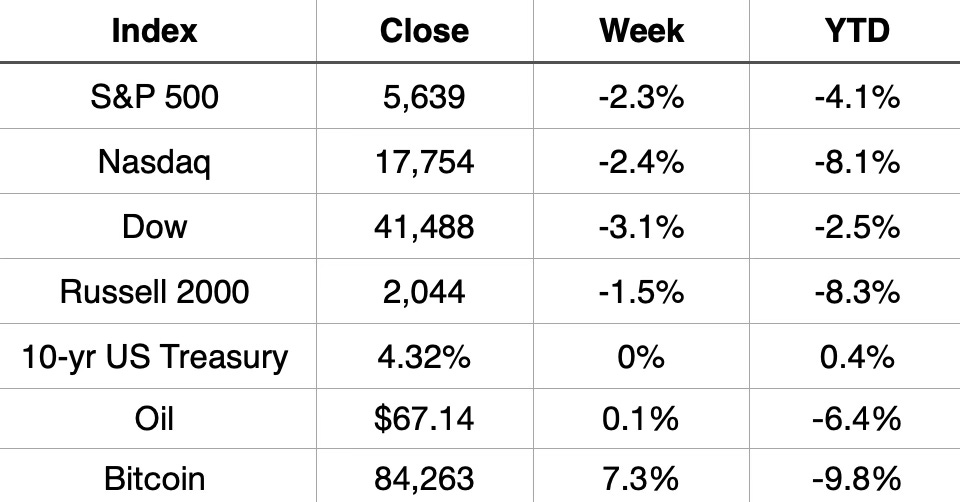
Market Recap
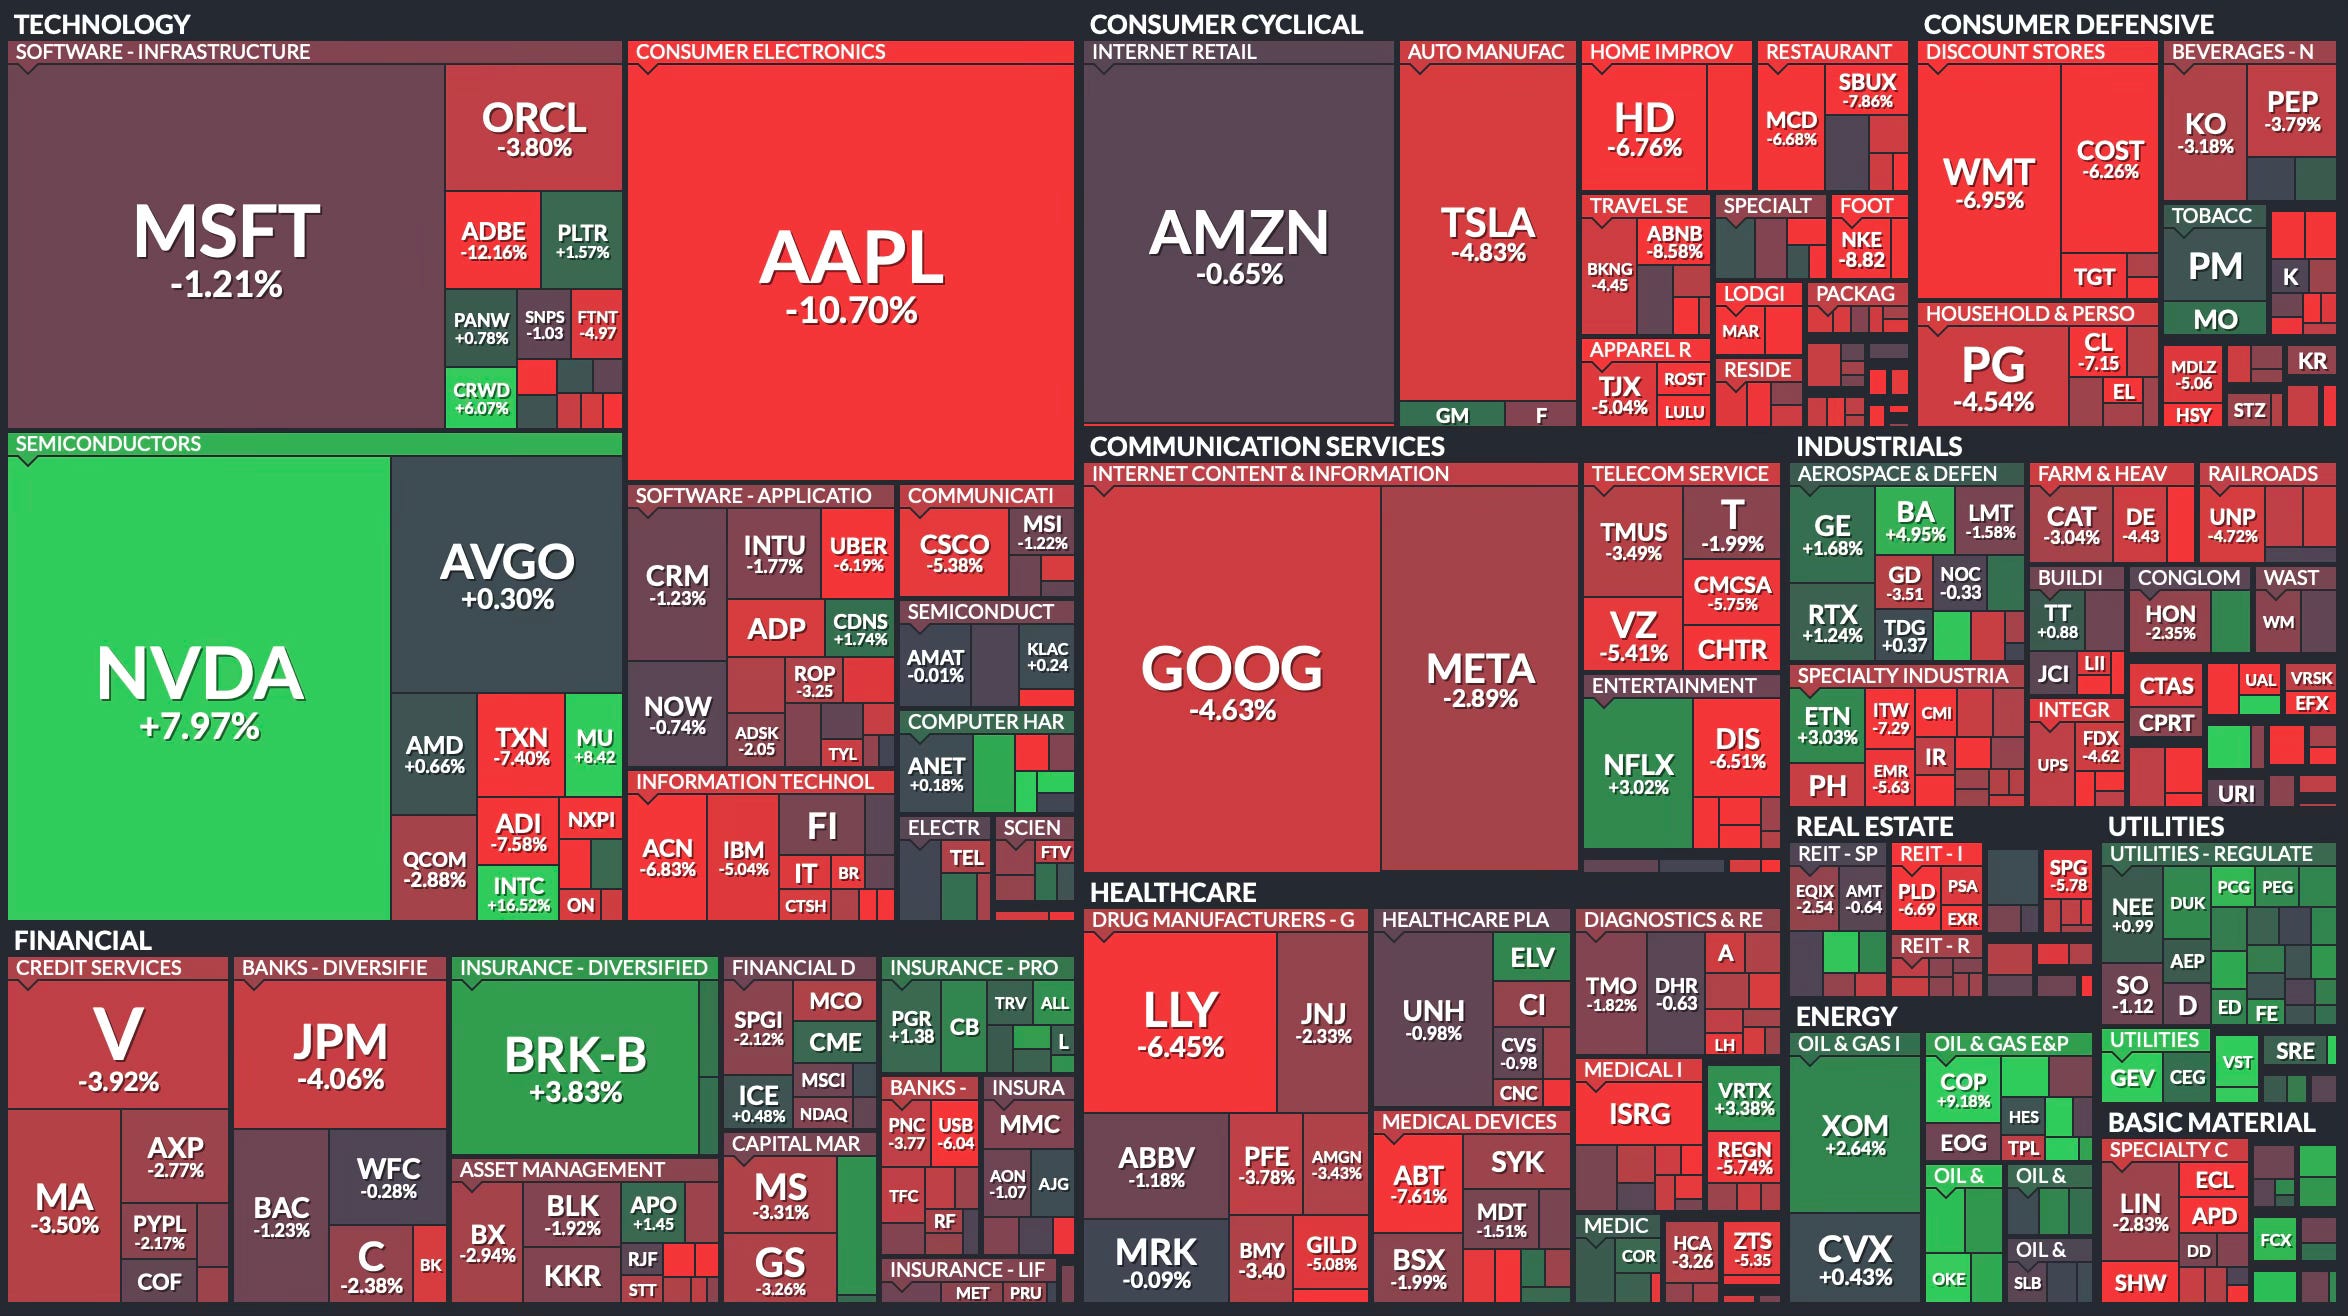
Weekly Heat Map Of Stocks
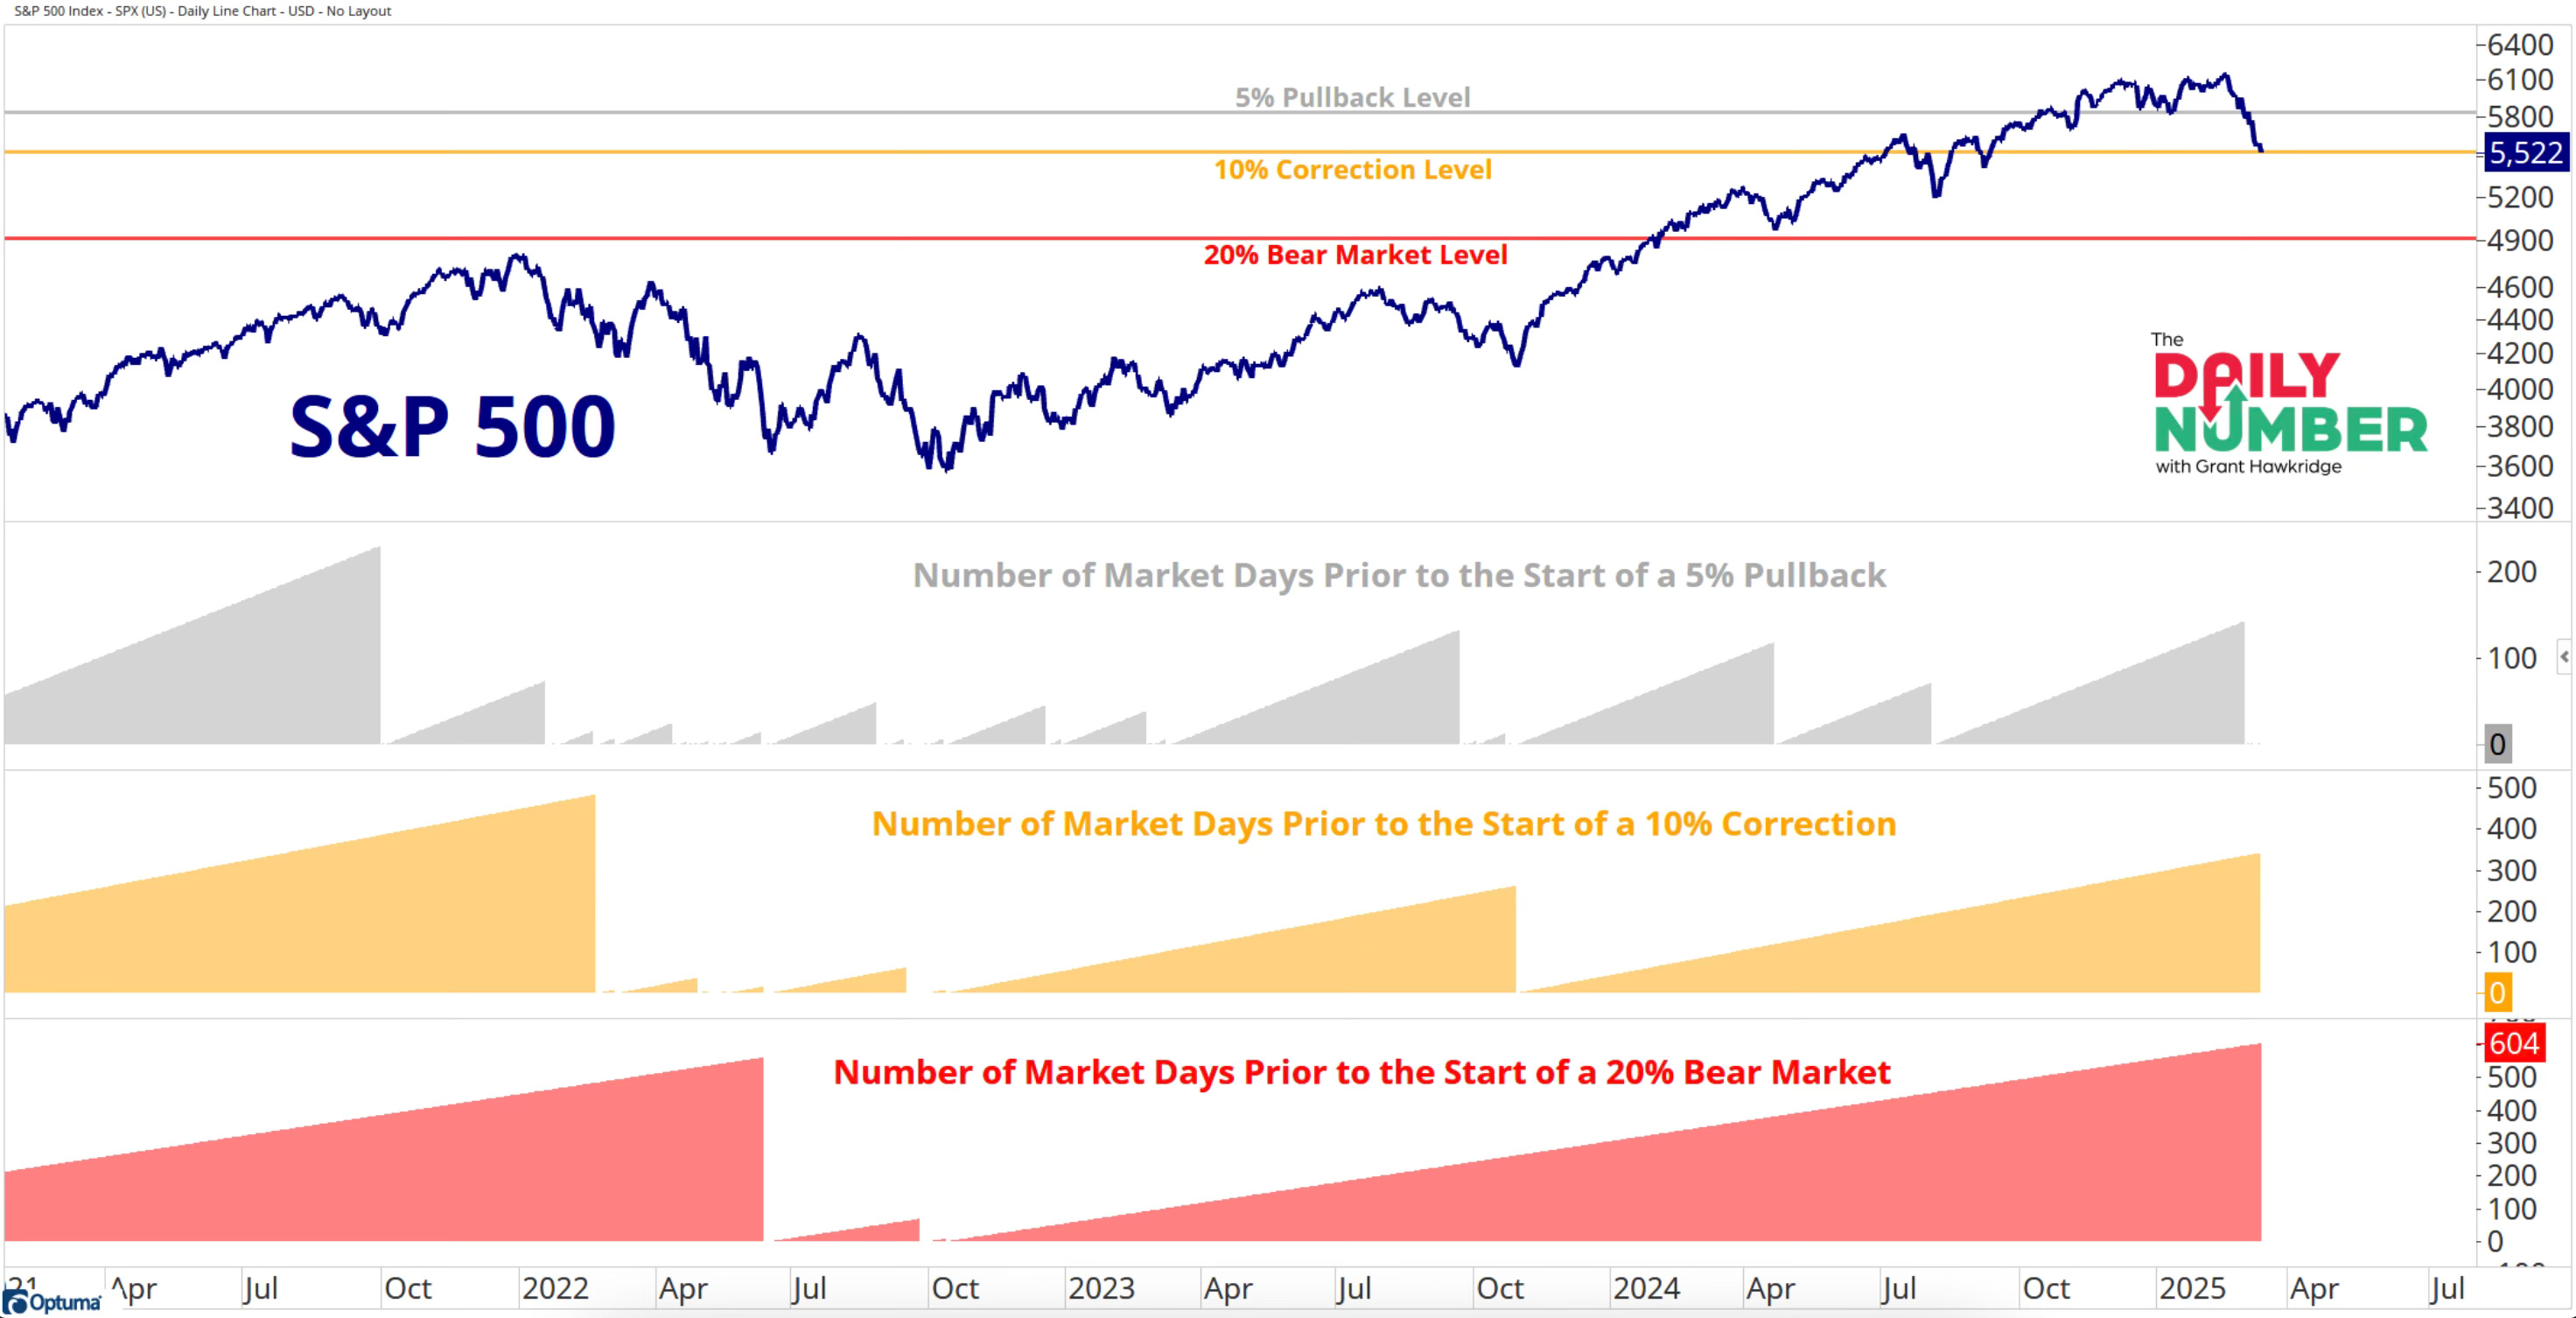
It only took 20 days for the S&P 500 to hit a correction from the record close. It only took 7 days to go from down 5% to down 10%.
That sure seems like a quick correction doesn't it? Well it was. This was the 5th fastest correction going back to 1950.
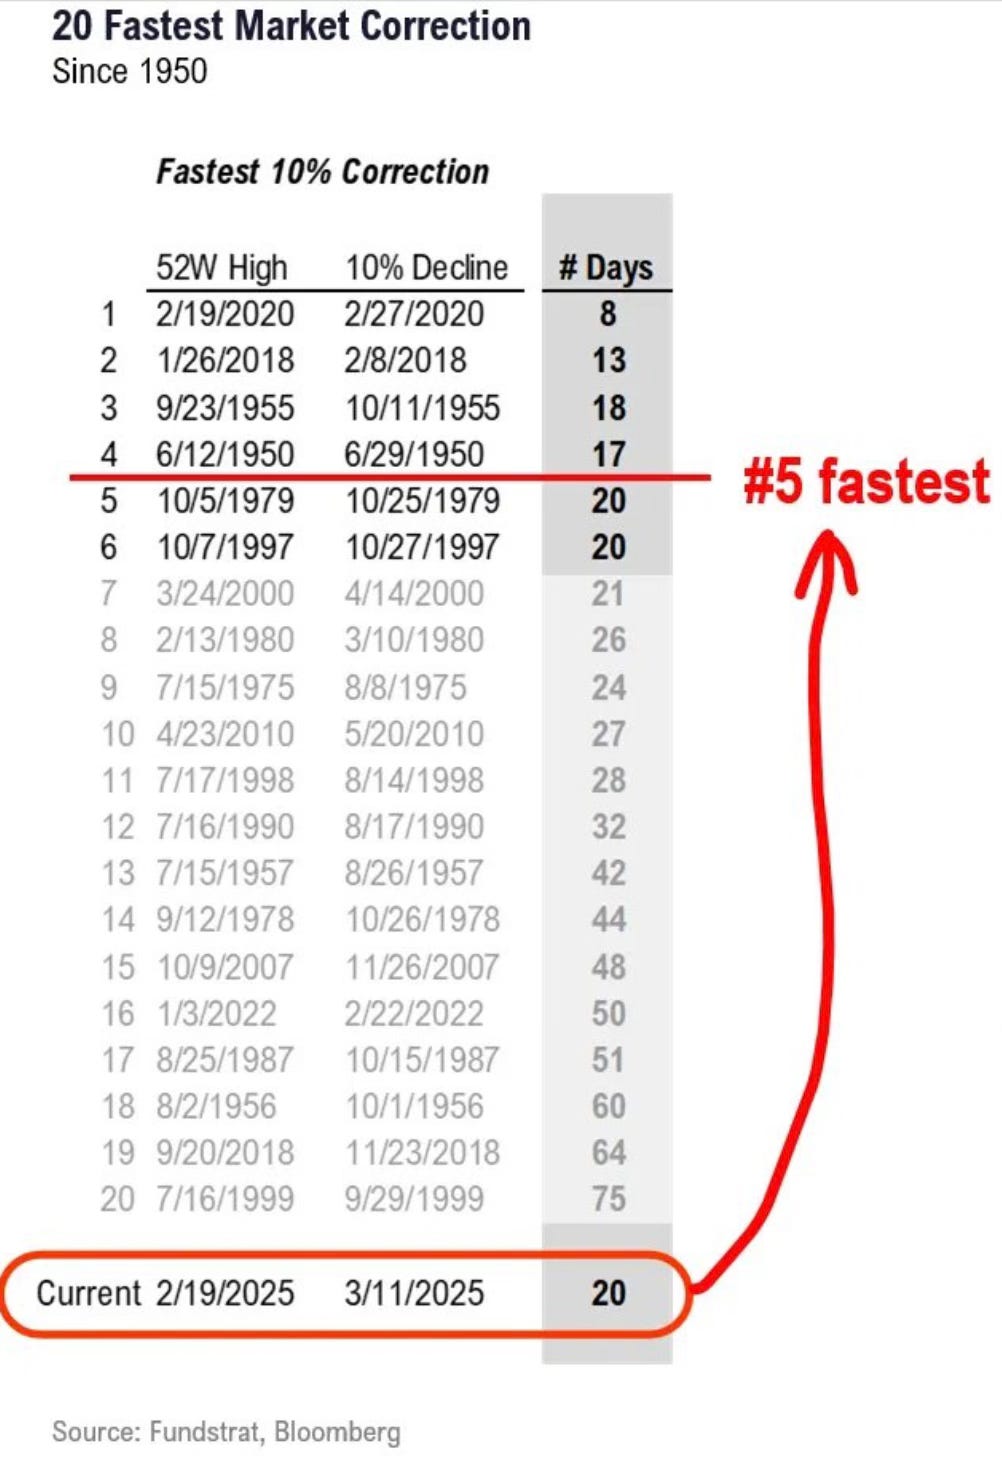
The last correction was October 2023. I love this chart from Grant Hawkridge.
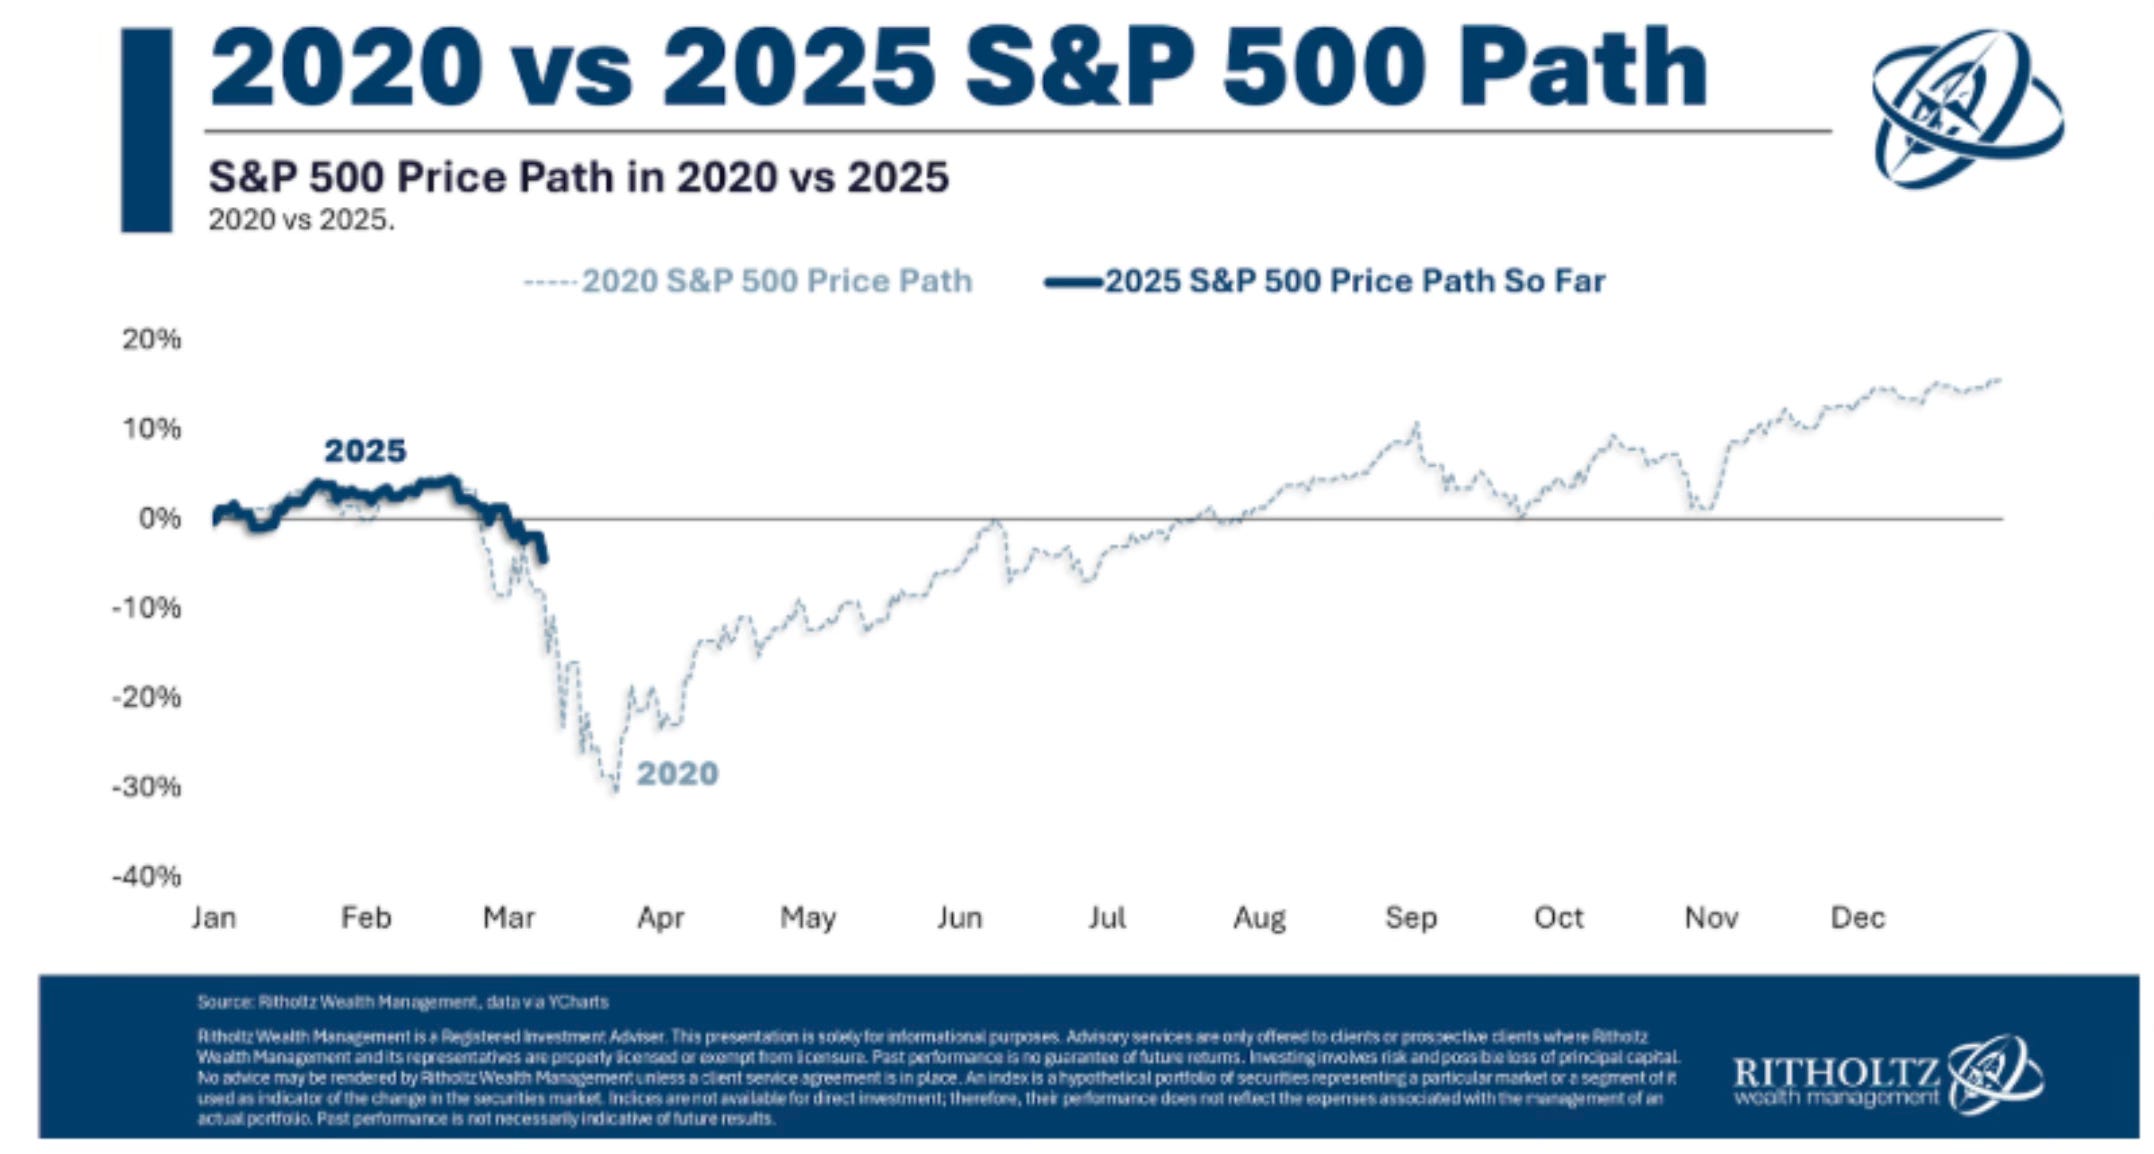
You would think that with this correction happening so fast that it would bring back memories of 2020. It sure sounds according to the media that it’s much worse than it is.
For context, this is nothing remotely close to what 2020 was. It’s not even in the same zip code. It still could be but it has a long way to go. Remember this the next time someone is trying to scare you about the stocks market crashing like in 2020.
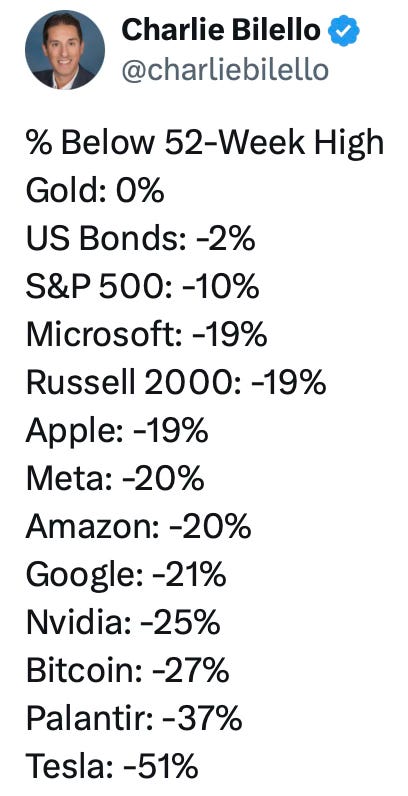
What this correction has done is really punish the most popular stocks. If something was up big, it likely received a haircut this week.
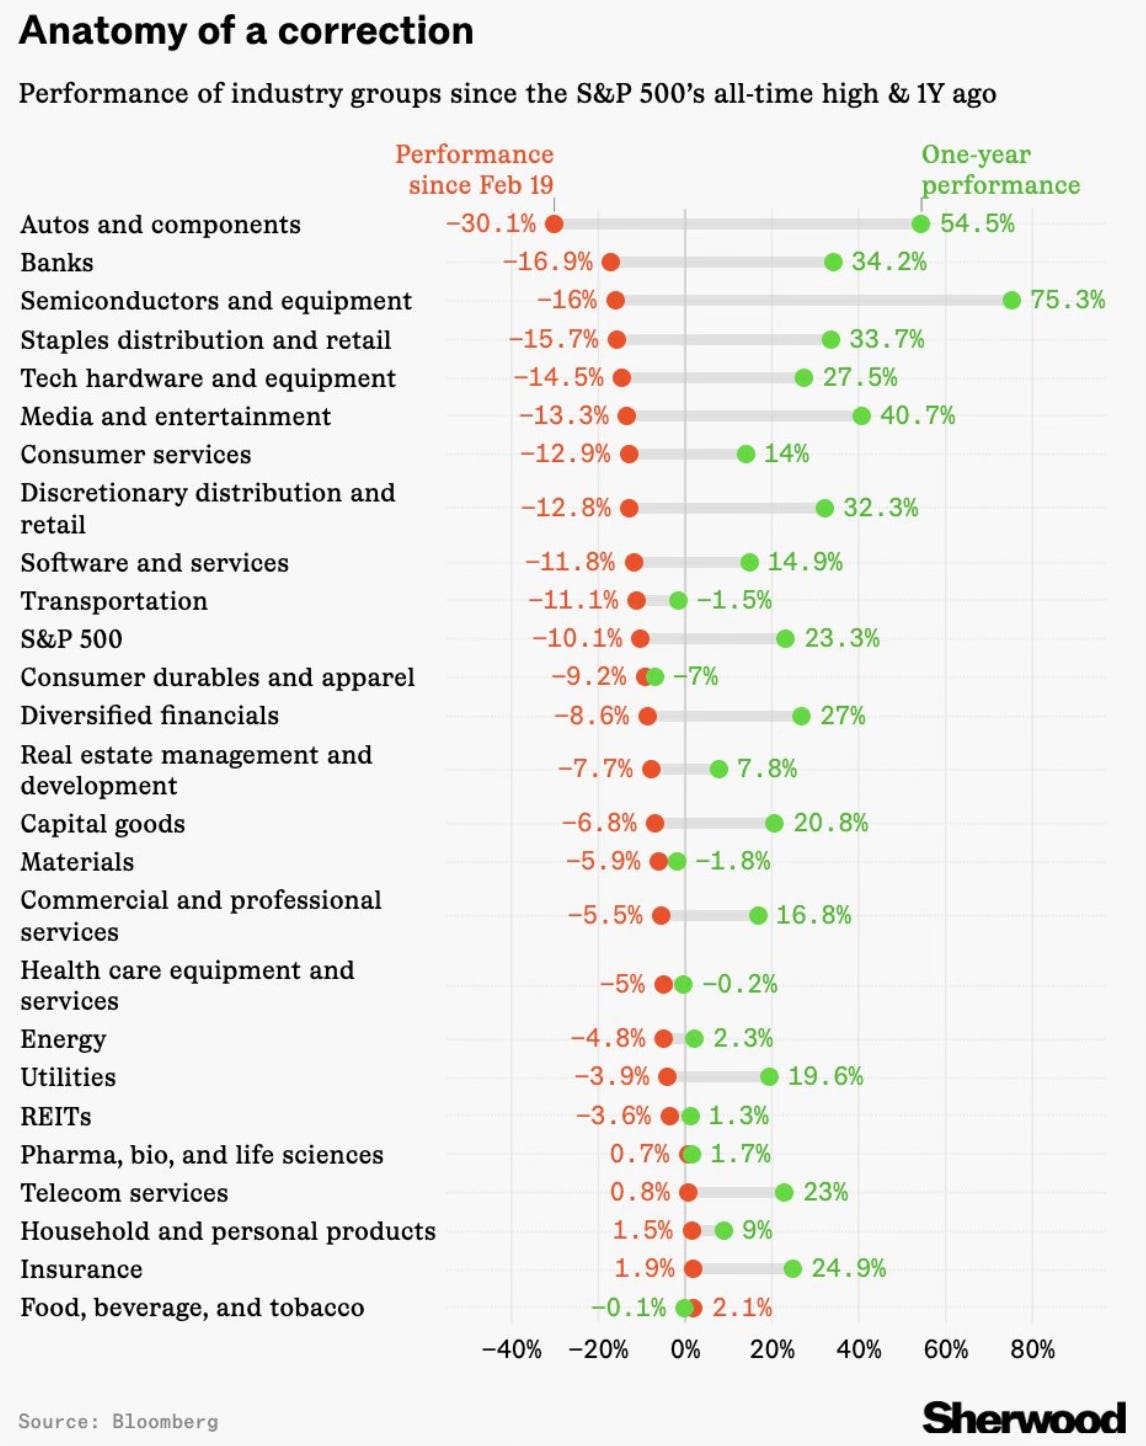
Take a look at how some of the industry groups have performed. There are some big shifts since February 19th.
Inflation Dips Lower
February CPI inflation fell to 2.8%. That was below the expected number of 2.9%. Core CPI also fell to 3.1%. That was below the expectation of 3.2%. It was the first decline in both since July 2024. It was nice to see inflation cool this week but I think this positive data was lost in all the other news this week.

It was good to see car insurance, shelter and airfares take steps lower.

Here is where inflation is and isn’t from a 12-month change. These numbers continue to shrink and the number turning negative is increasing.
