What a week! Coming into this week investors were already expecting to digest a lot with a slew of data and company earnings.
I don’t think everyone was quite expecting or ready for the return of hightened volatility as well.
Weak jobs (114,000 vs 175,000 expected) and unemployment (4.3% vs 4.1% expected) numbers, as well as underwhelming tech earnings sent the stock market tumbling to end the week.
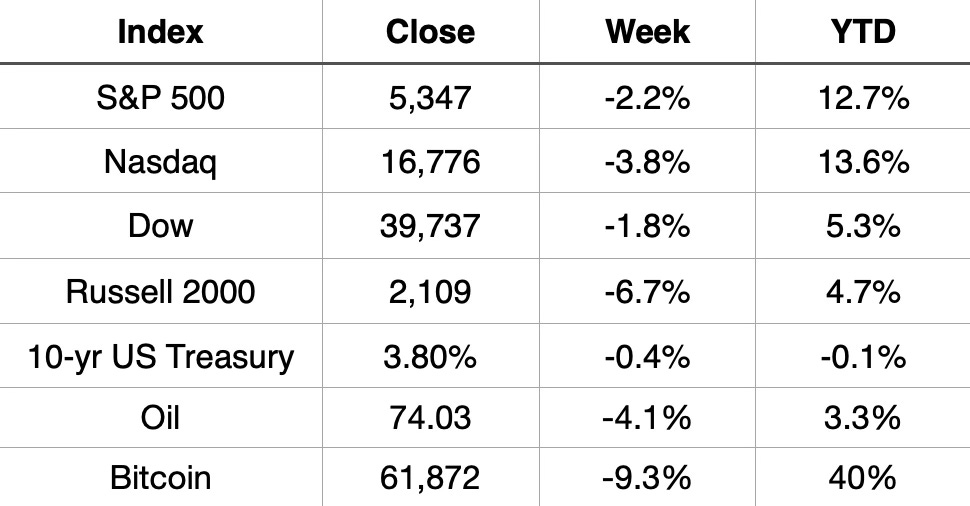
The S&P 500 (-2.2%) and Nasdaq (-3.8%) finished negative for the 3rd straight week. A string of 4 straight positive weeks for the Dow was snapped.
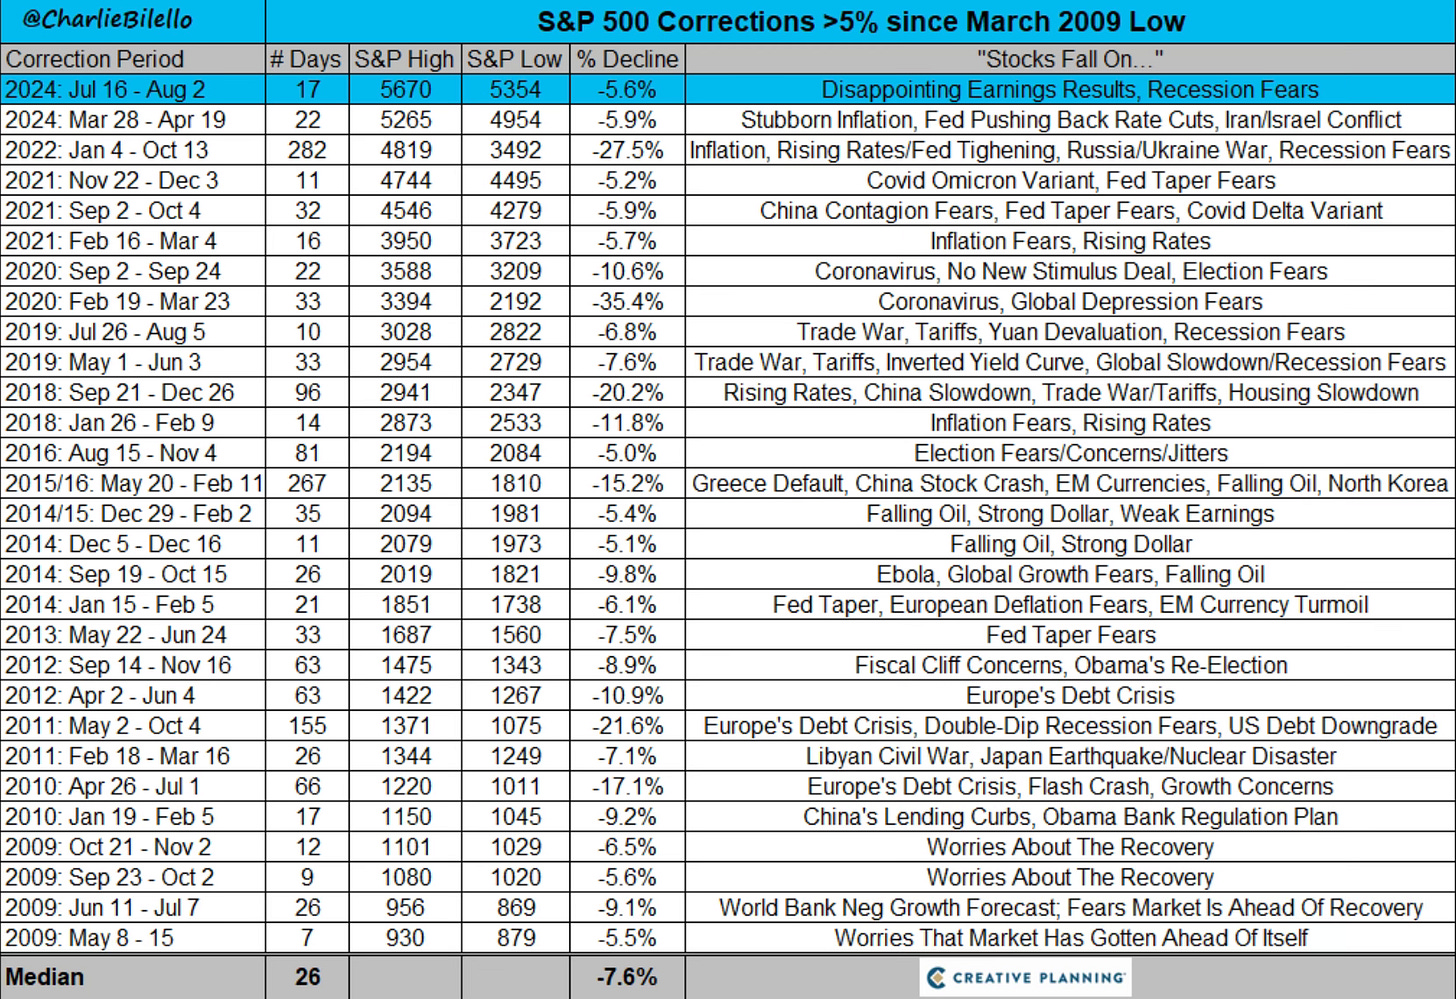
The S&P 500 is now down 5.6% from its peak on July 16. The 2nd over 5% or more pullback of the year. This is the 29th correction of 5% or more from a high since the March 2009 low. How many of these do you even remember? They all proved to be a good time to buy the dip.
Market Recap

Volatility Returns
Did you really expect the smooth road for the market to continue all year? After 38 new all-time highs in the 1st half of the year you had to expect a different road in the 2nd half. It was nice while it lasted.
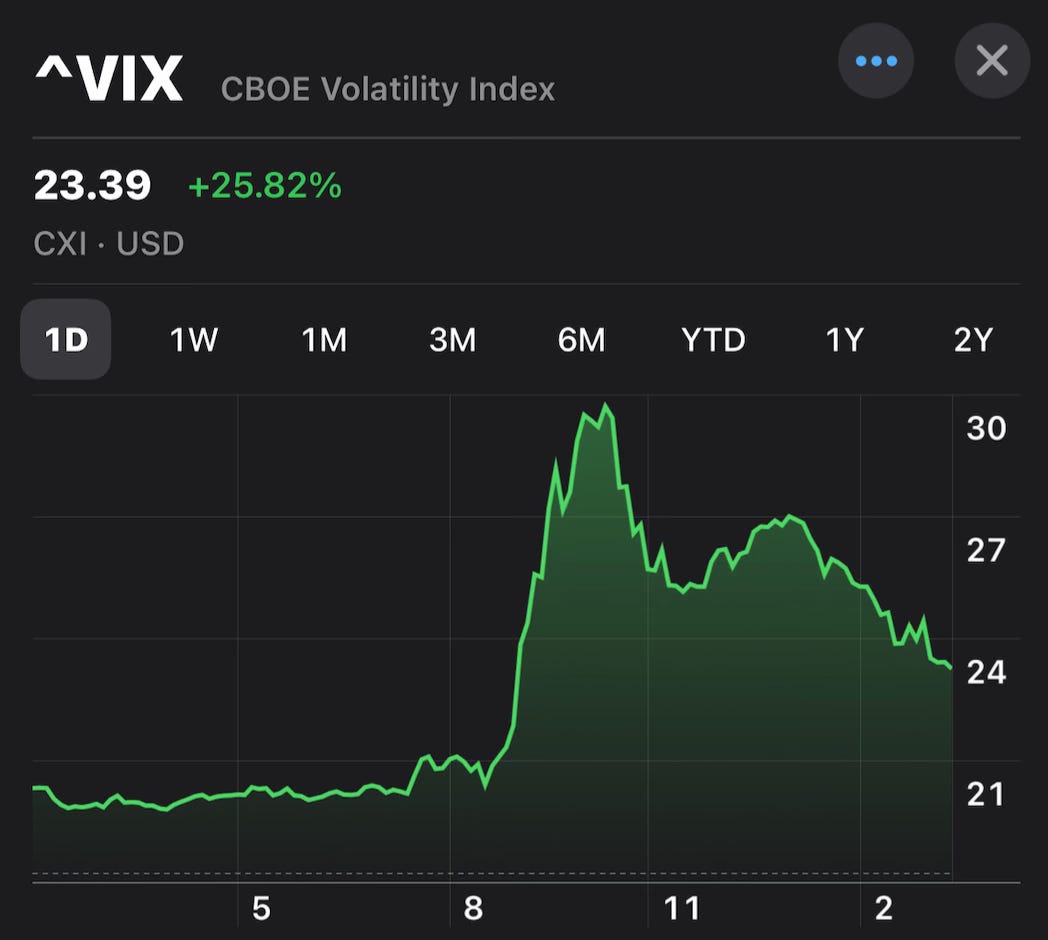
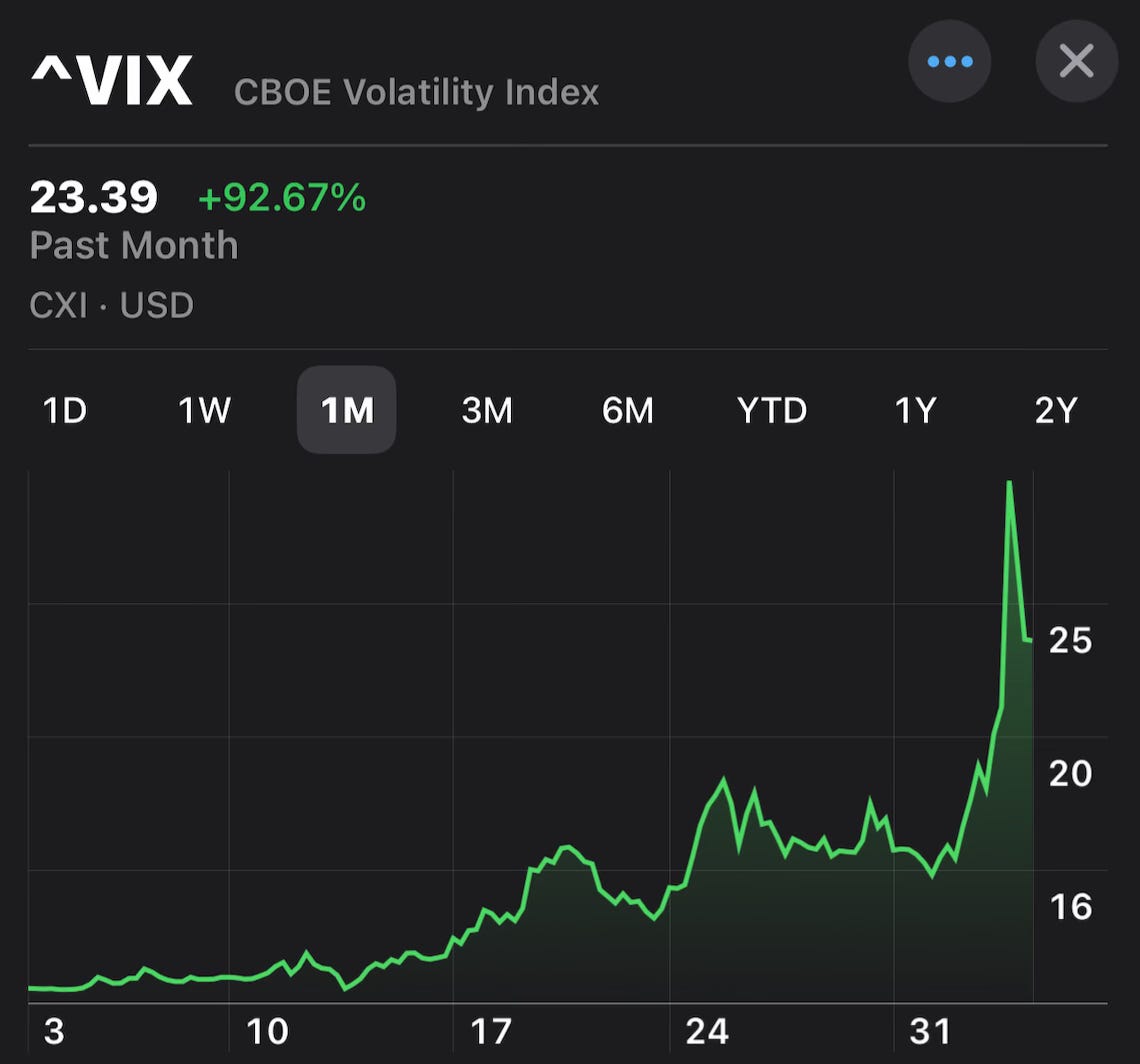
It seems we’re back to seeing 1% or more moves almost daily in both directions. Friday saw the VIX almost hit 30 before settling the week at 23.39.
You can see over the last month that the VIX has risen from around 12 to now over 23. Volatility is back incase you missed it.
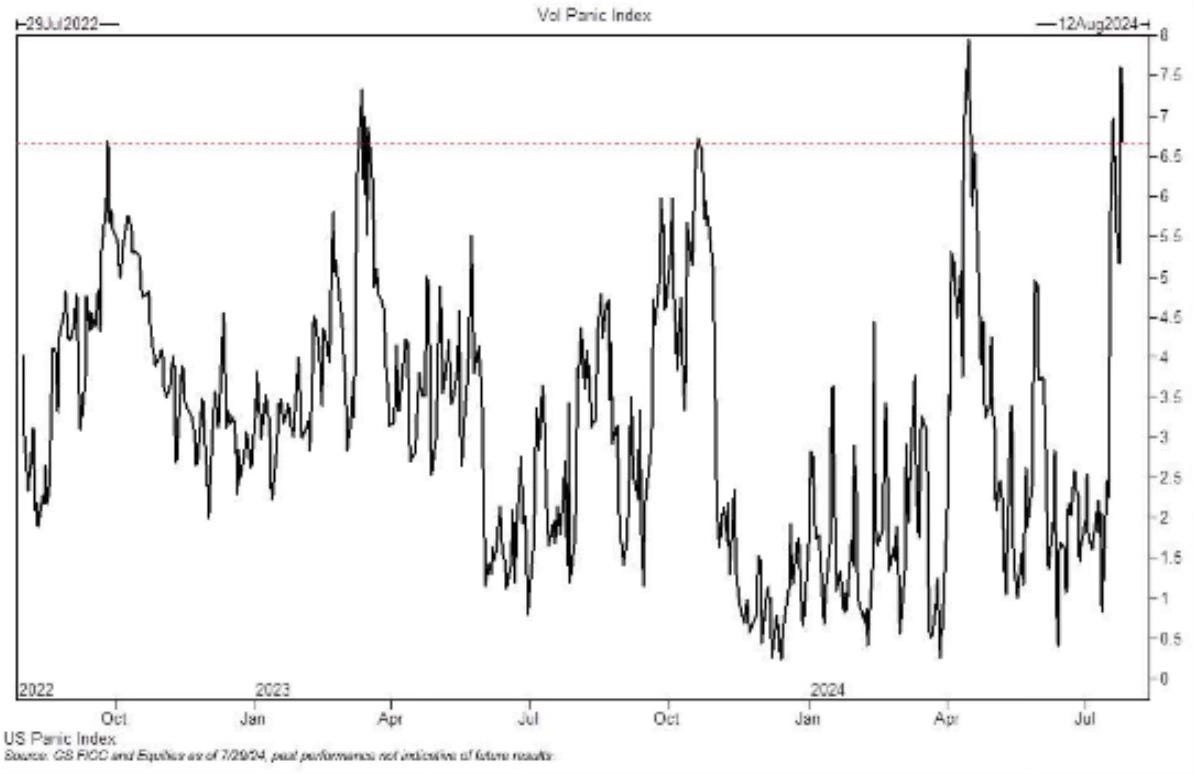
We also see that the Goldman Sachs Panic Index has also risen to its highest level in 2 years.
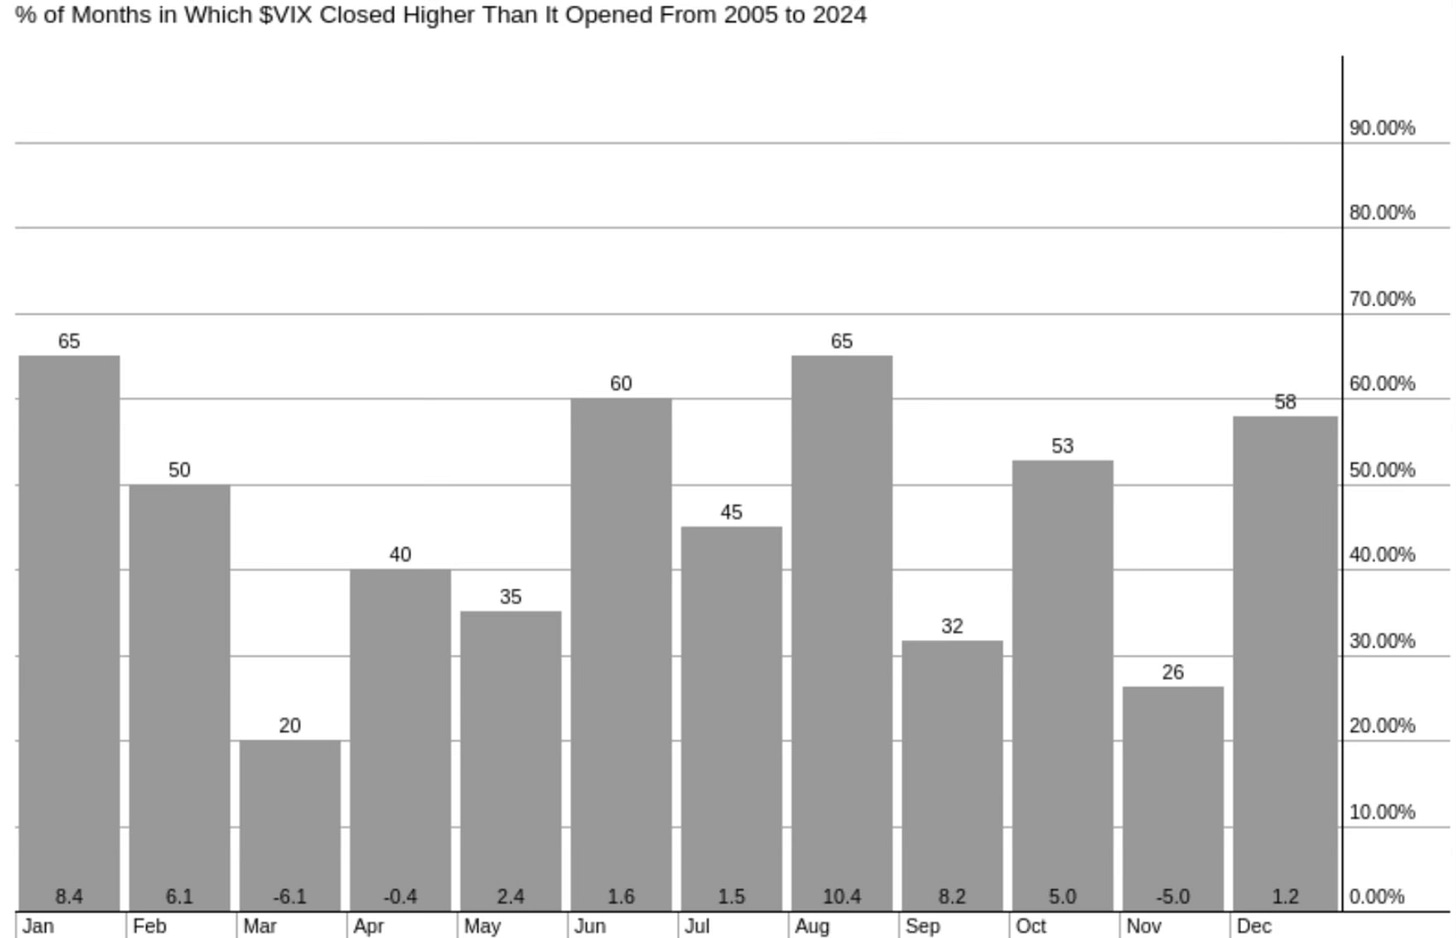
August is also tied with January for the best month of the year for volatility. In August, the VIX is up 65% of the time from where it began the month.
Labor Market Worries
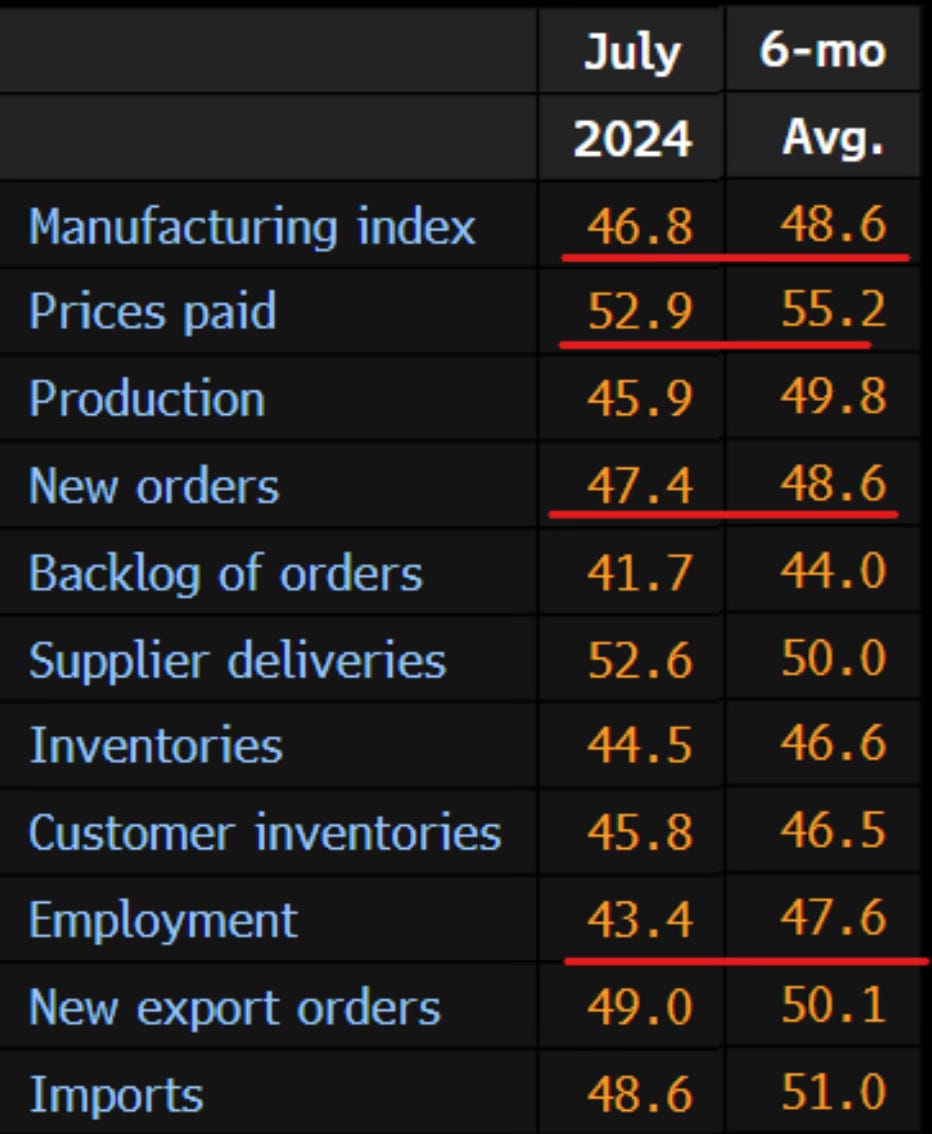
In addition to a weaker than expected jobs and unemployment number, the jobless claims on Thursday also failed to impress. I think with how weak the jobless claims were on Thursday, they were quickly overshadowed by the ugly jobs and unemployment numbers on Friday.
You can see from this breakdown that the jobless claims came in substantially lower than the 6-month average in numerous areas. This is telling me that under the surface there is a definite weakening and the labor worries may continue in the months ahead.
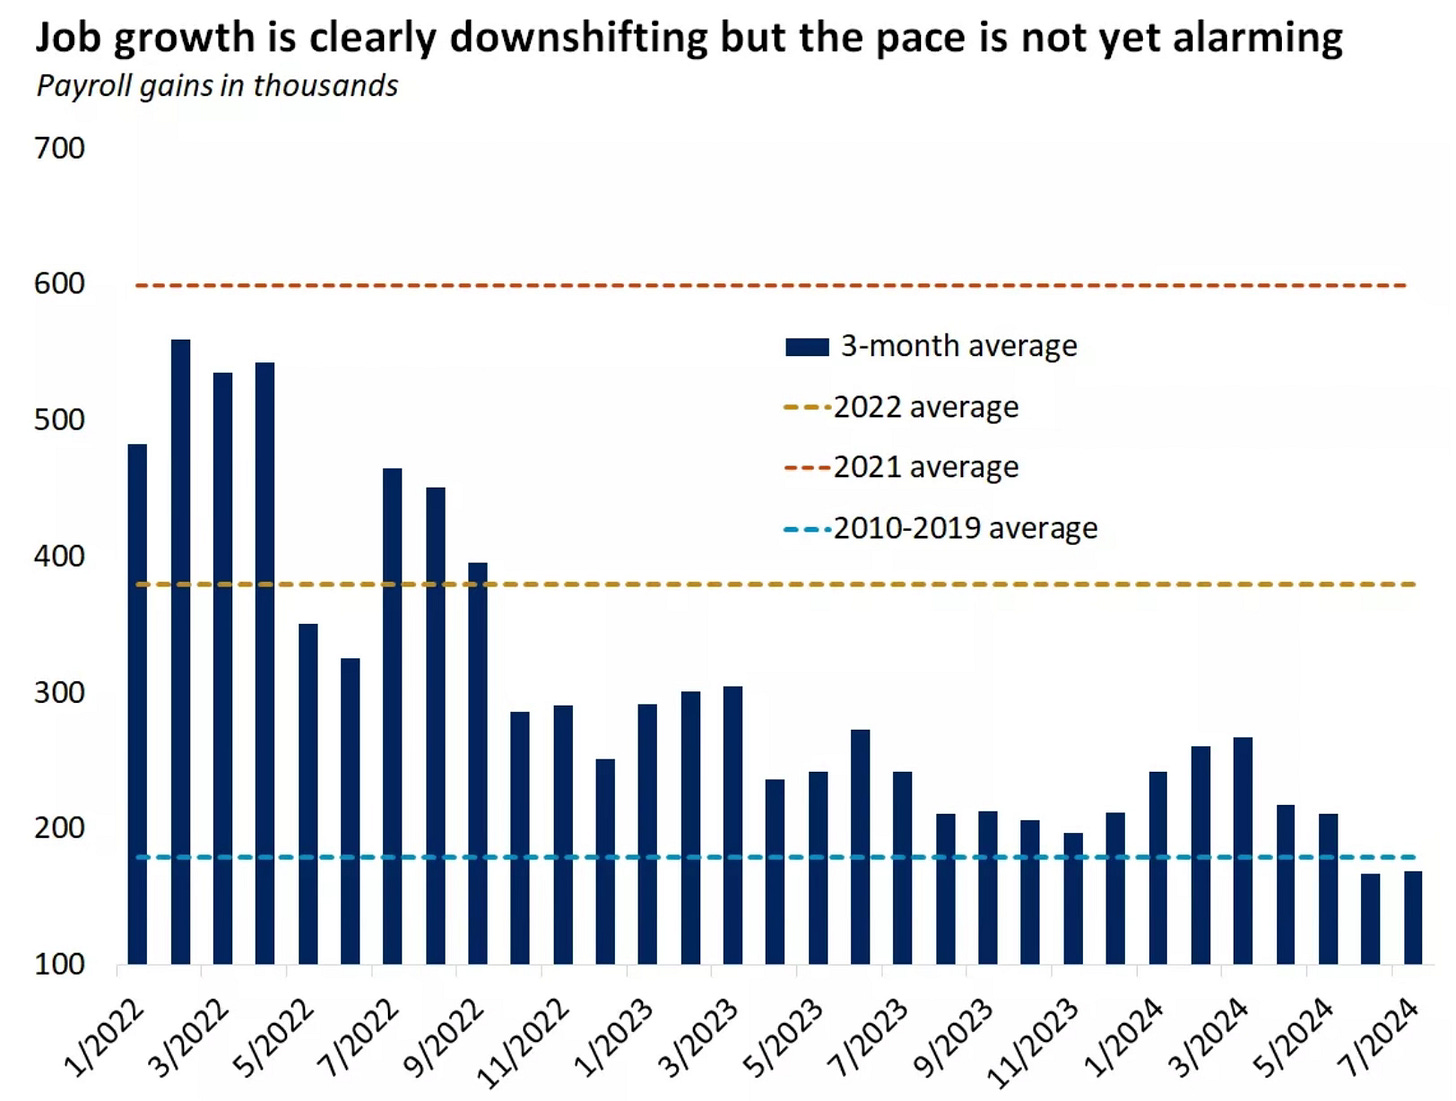
Job growth has slowed but it hasn’t completely broken down yet.
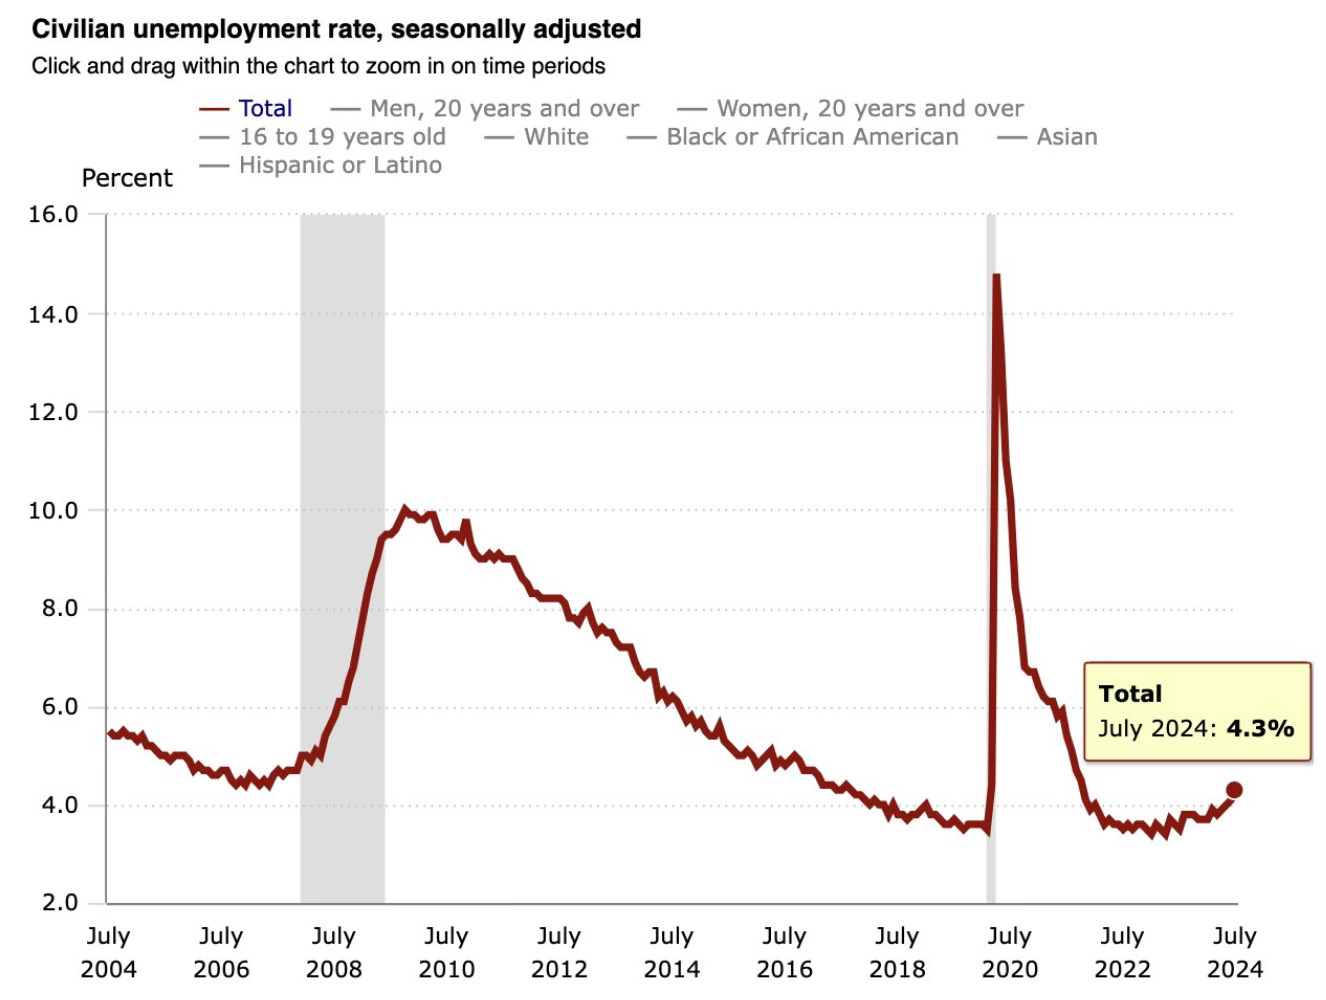
To me the biggest warning sign really comes from the unemployment rate. It was expected to be 4.1% and it came in at 4.3%. That’s the highest level since October 2021.
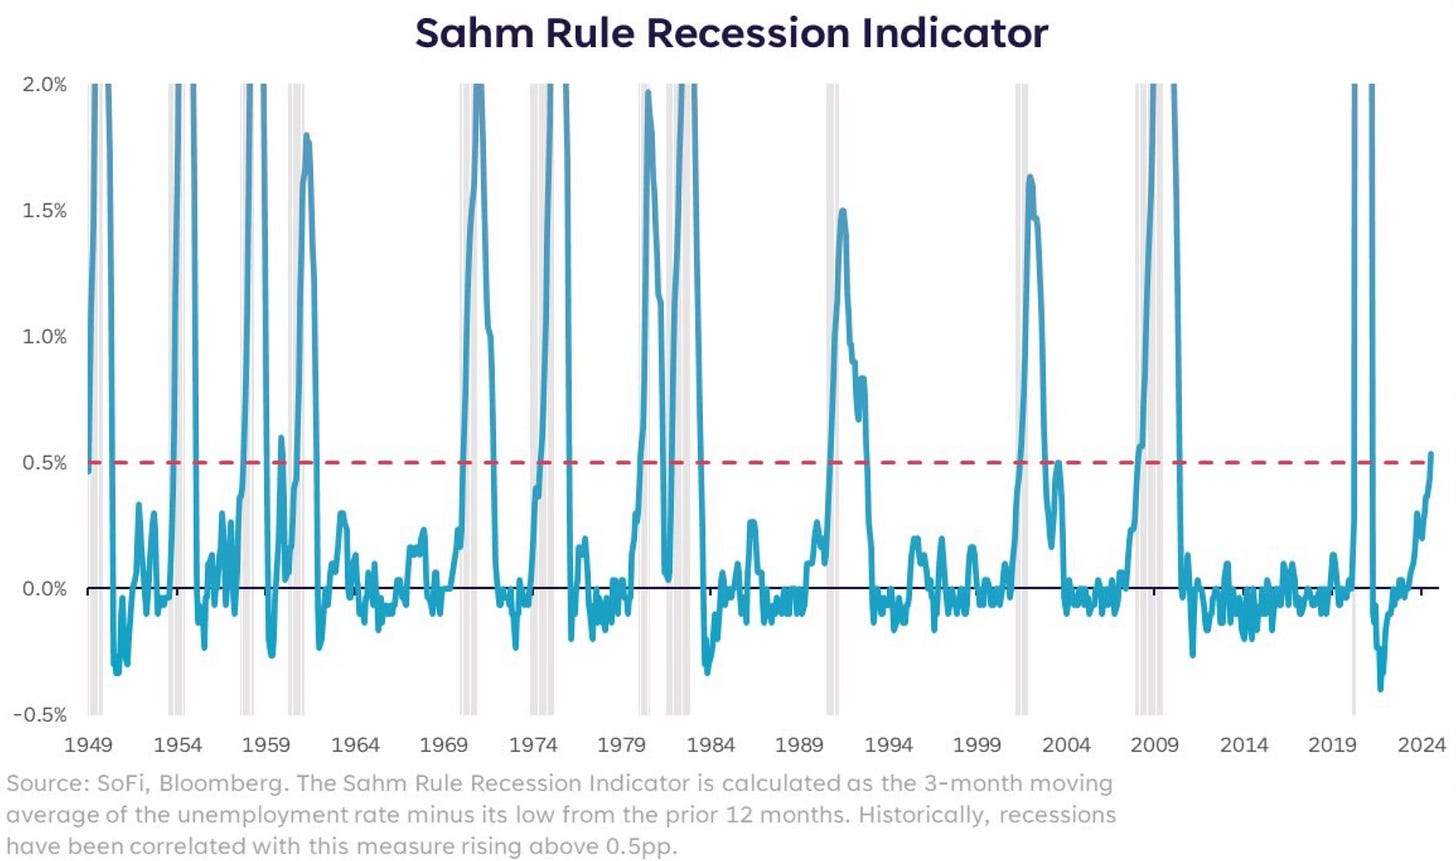
With the higher than expected reading the much discussed Sahm Rule Recession Indicator has now been triggered. I have reference this numerous times and now the switch has been flipped. We will see if this time is different.
In addition to the Sahm Indicator, I’m also watching what Warren Pies has put together.
The percentage of industries with job gains (YOY) has fallen below 65%. He points out that an average recession begins with this number just above 60%.
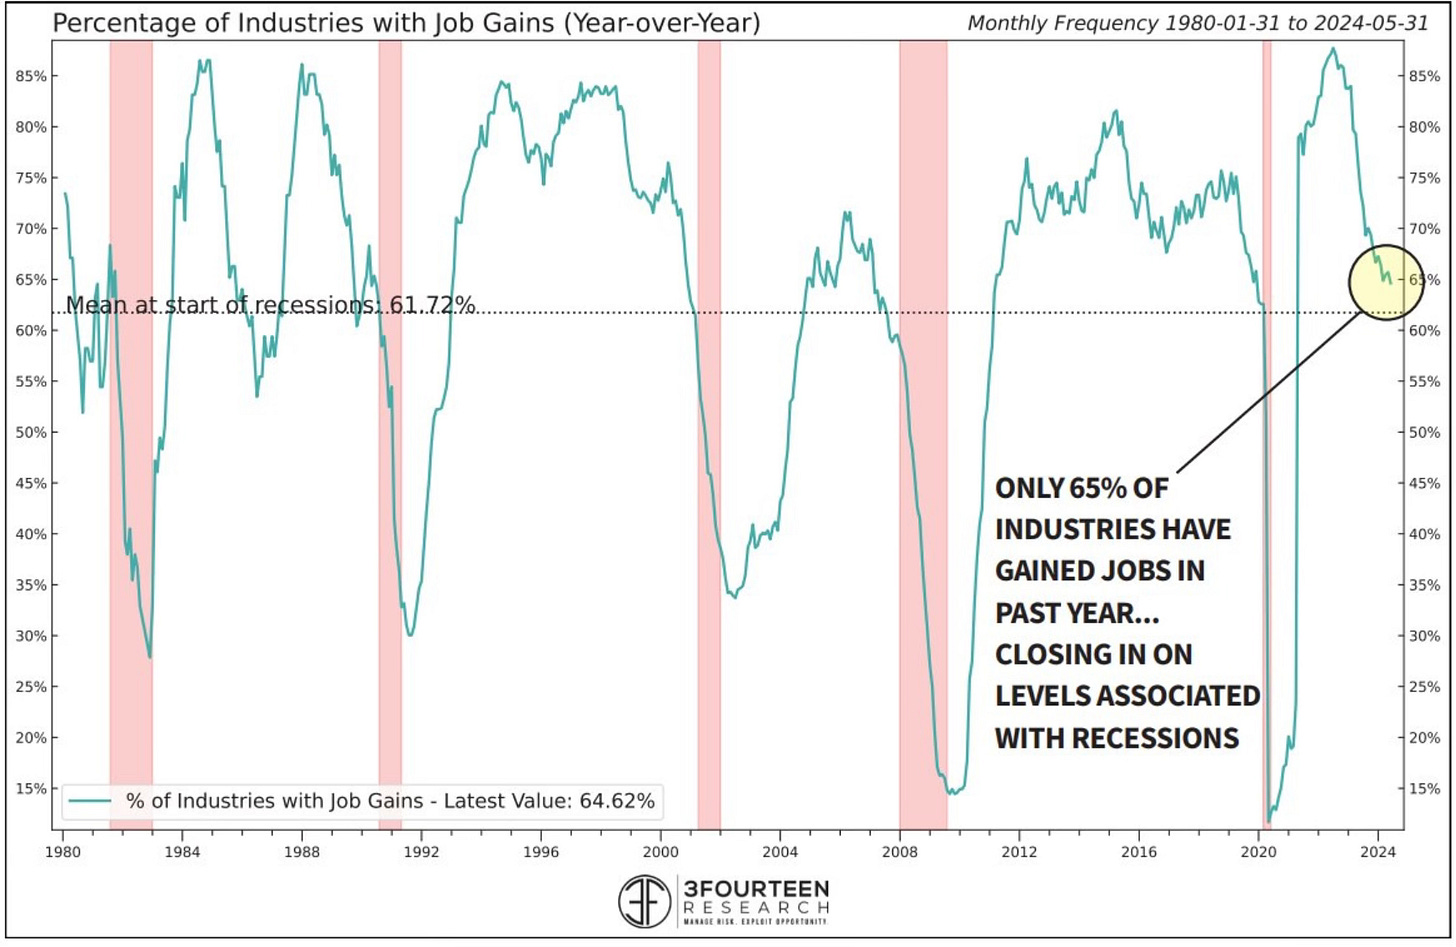
Then he shows just how much of a negative impact that this has on stocks. Once payroll breadth falls below 60%, stocks suffer.
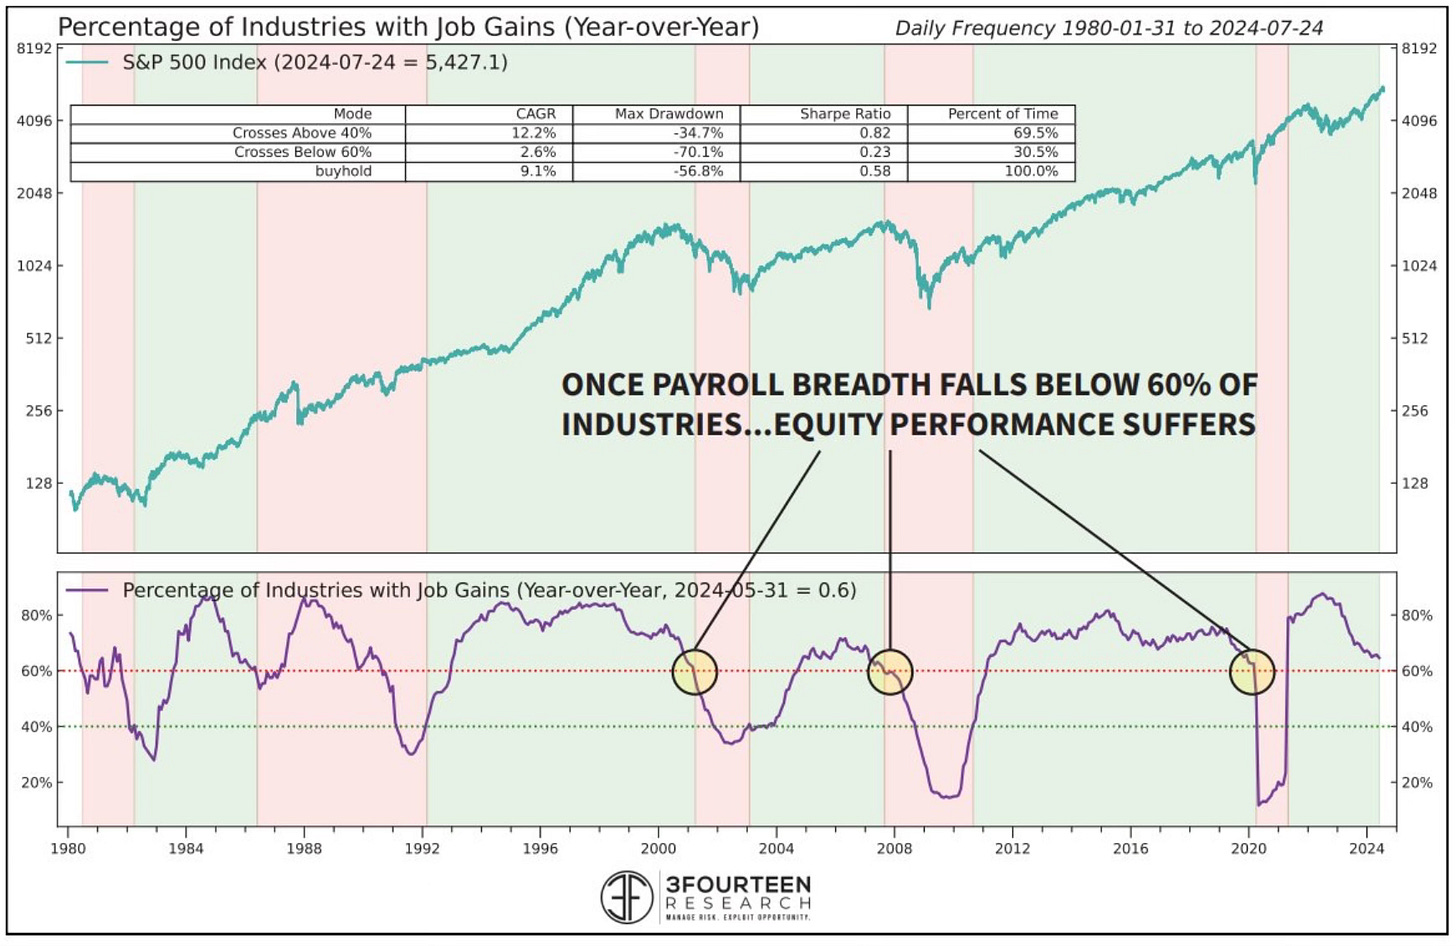
Labor market data is important because this isn’t something that can’t change on a dime. It’s very hard to reverse it.
What Can Be Expected From August
As the calendar turns to August, what can investor expect? Historically in election years August has done well. The S&P 500 is up 71% of the time, with an average return of 3.1%.
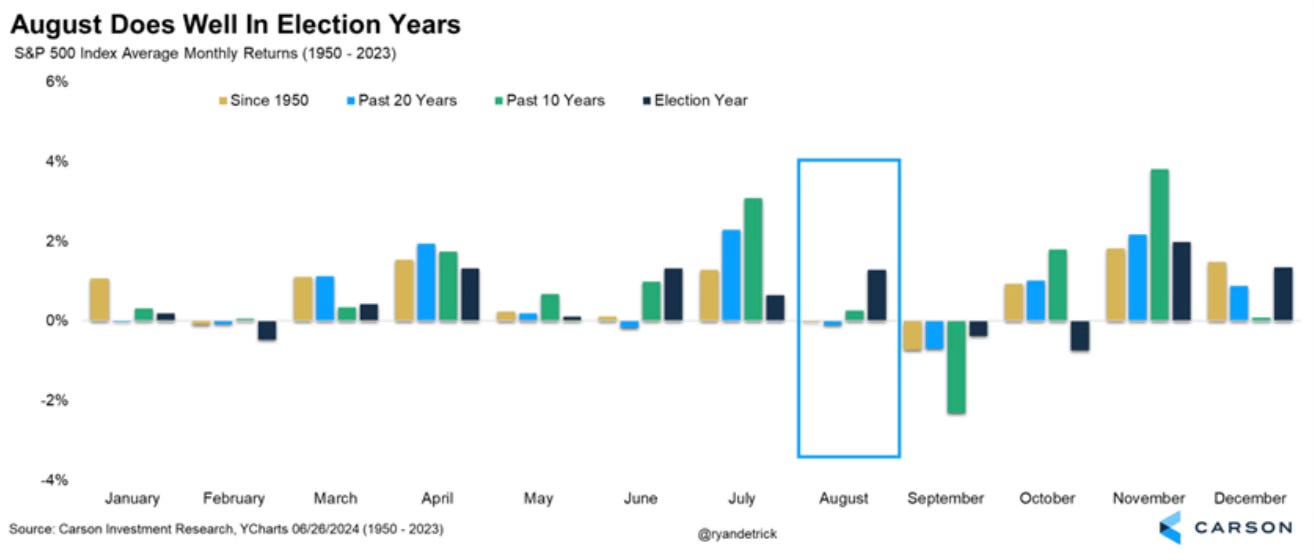
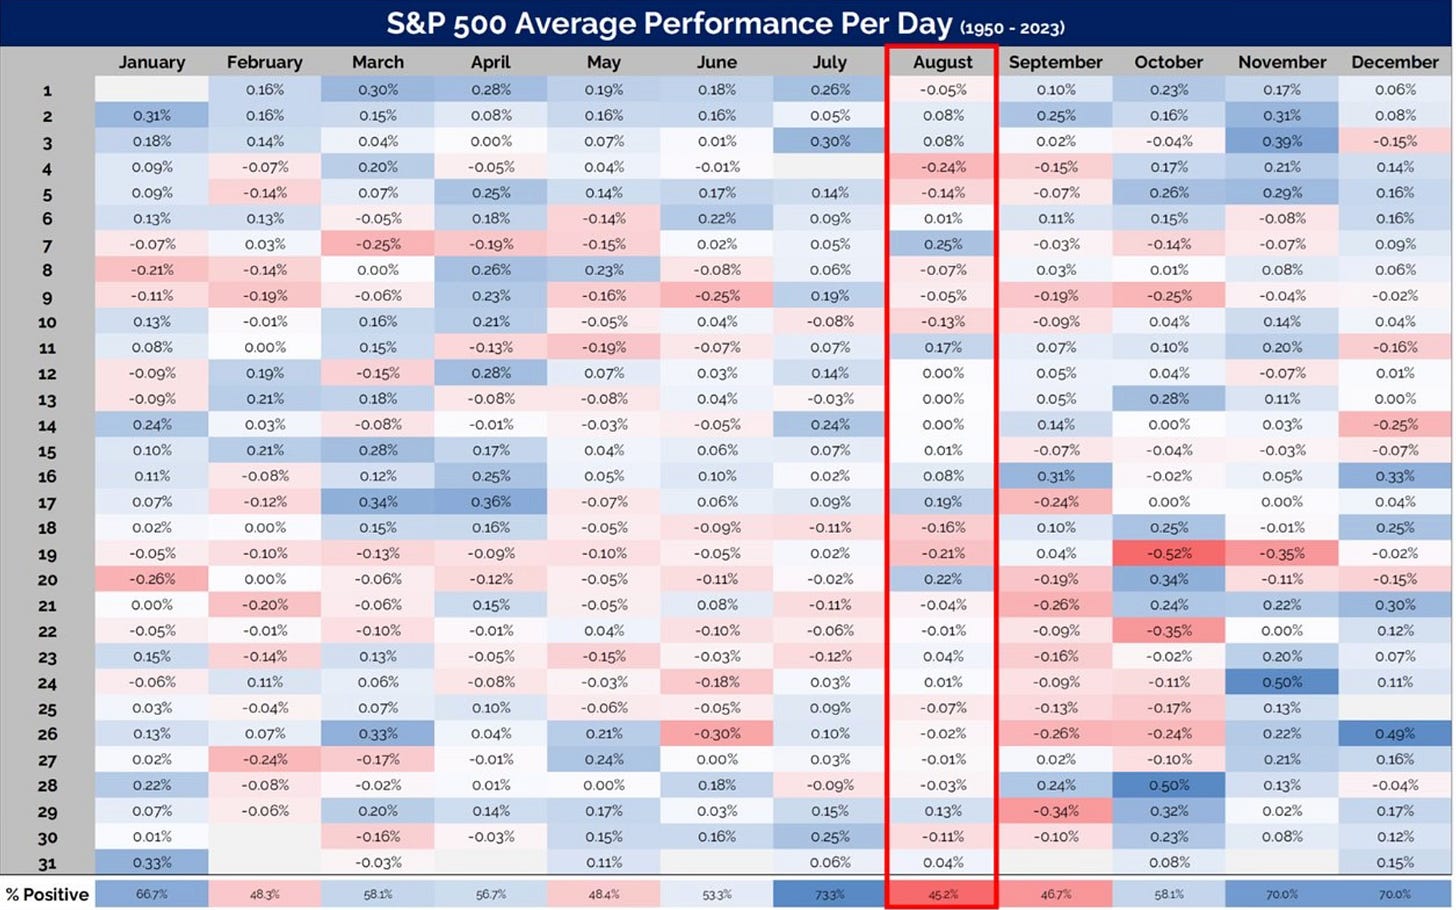
Outside of election years August returns have not fared well. Since 1950, August has only been positive 45% of the time. That’s the worst month of the year. What’s the 2nd worst month? It’s September which is next month. That’s only been positive 46% of the time.
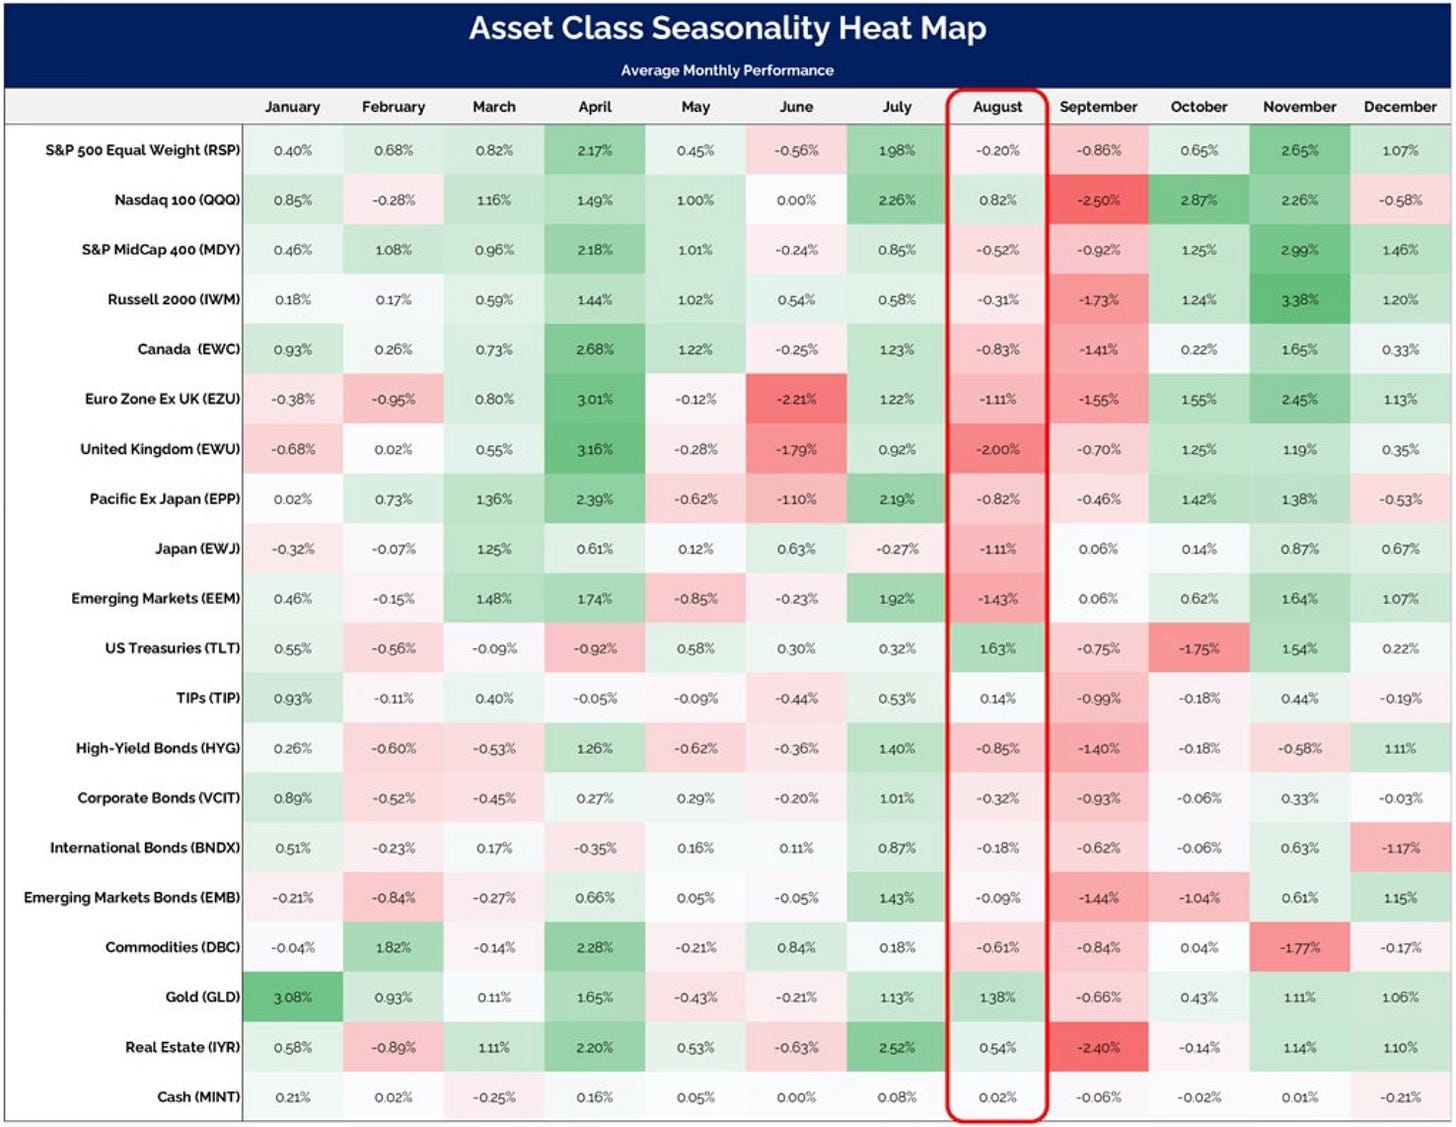
I really like this asset class breakdown by month from Grant Hawkridge. You can see that outside of treasuries and gold, not much performs well historically in August.
Magnificent 7 Buying Opportunities?
We’ve seen ETF sector flows rotate. Since July 11th, investors have moved $6 billion into non-tech sector ETFs. Only $1.4 billion has flowed in tech ETFs.

Investors have sold their tech stocks as they’ve rotated to other areas of the market. Some of that is also due to the Mag 7 earnings decelerating while the other 493 are accelerating.
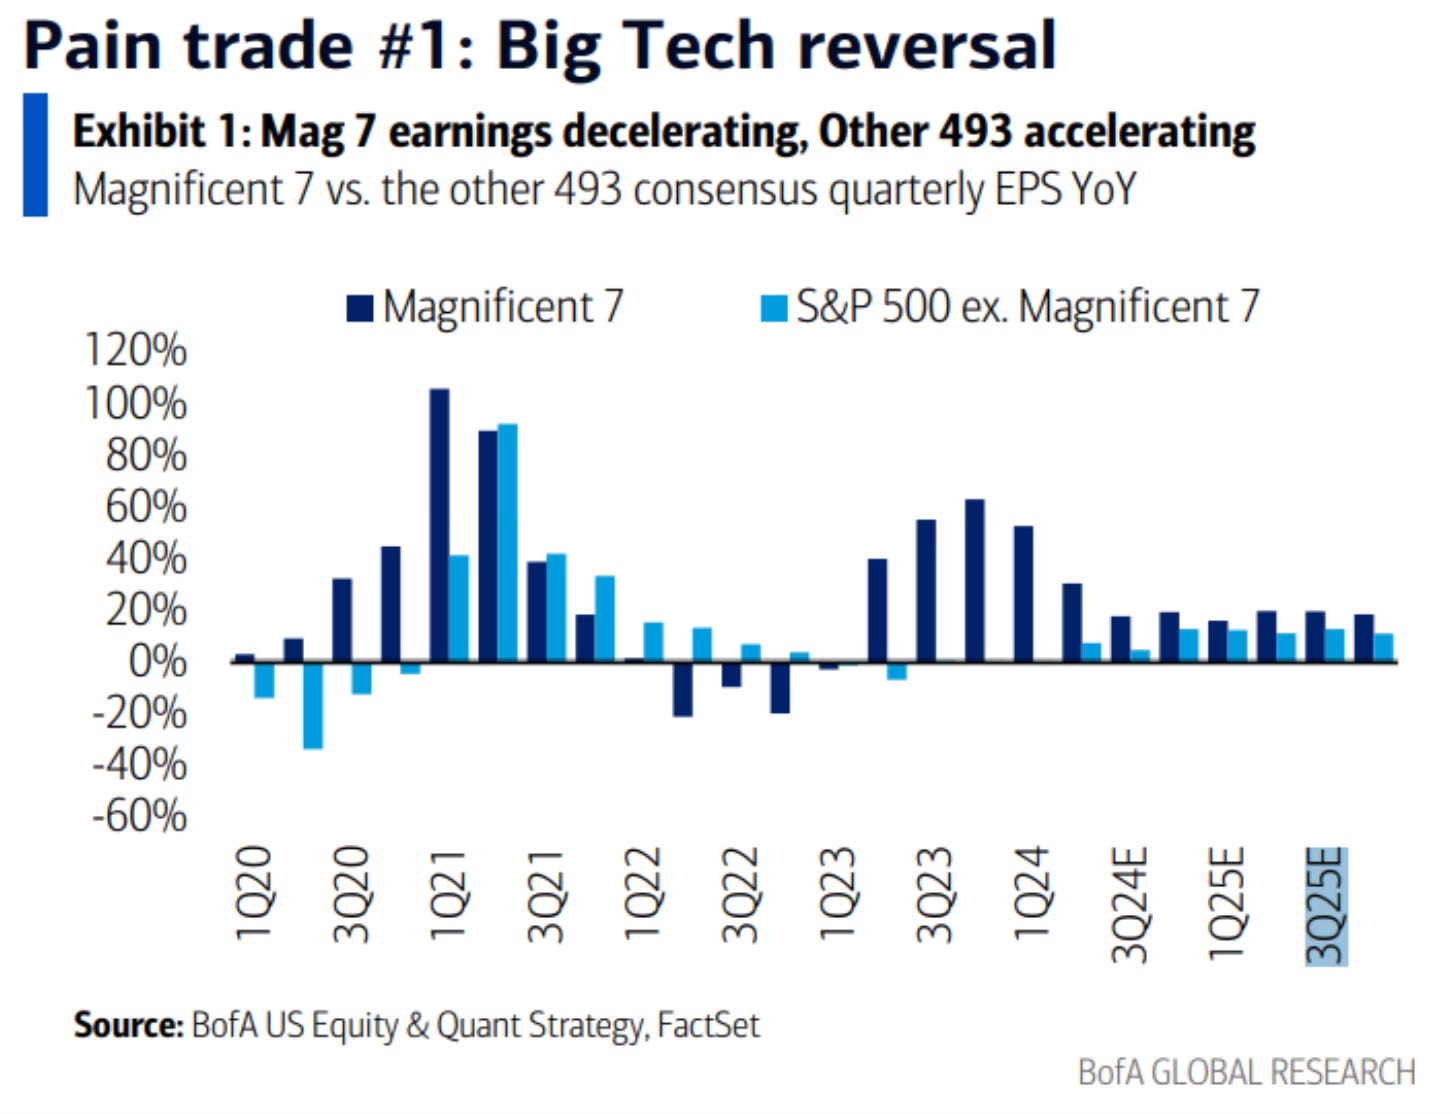
This chart does a good job of showing how much this has caused the Mag 7 to pullback against the overall S&P 500 and the equal weight S&P 500.
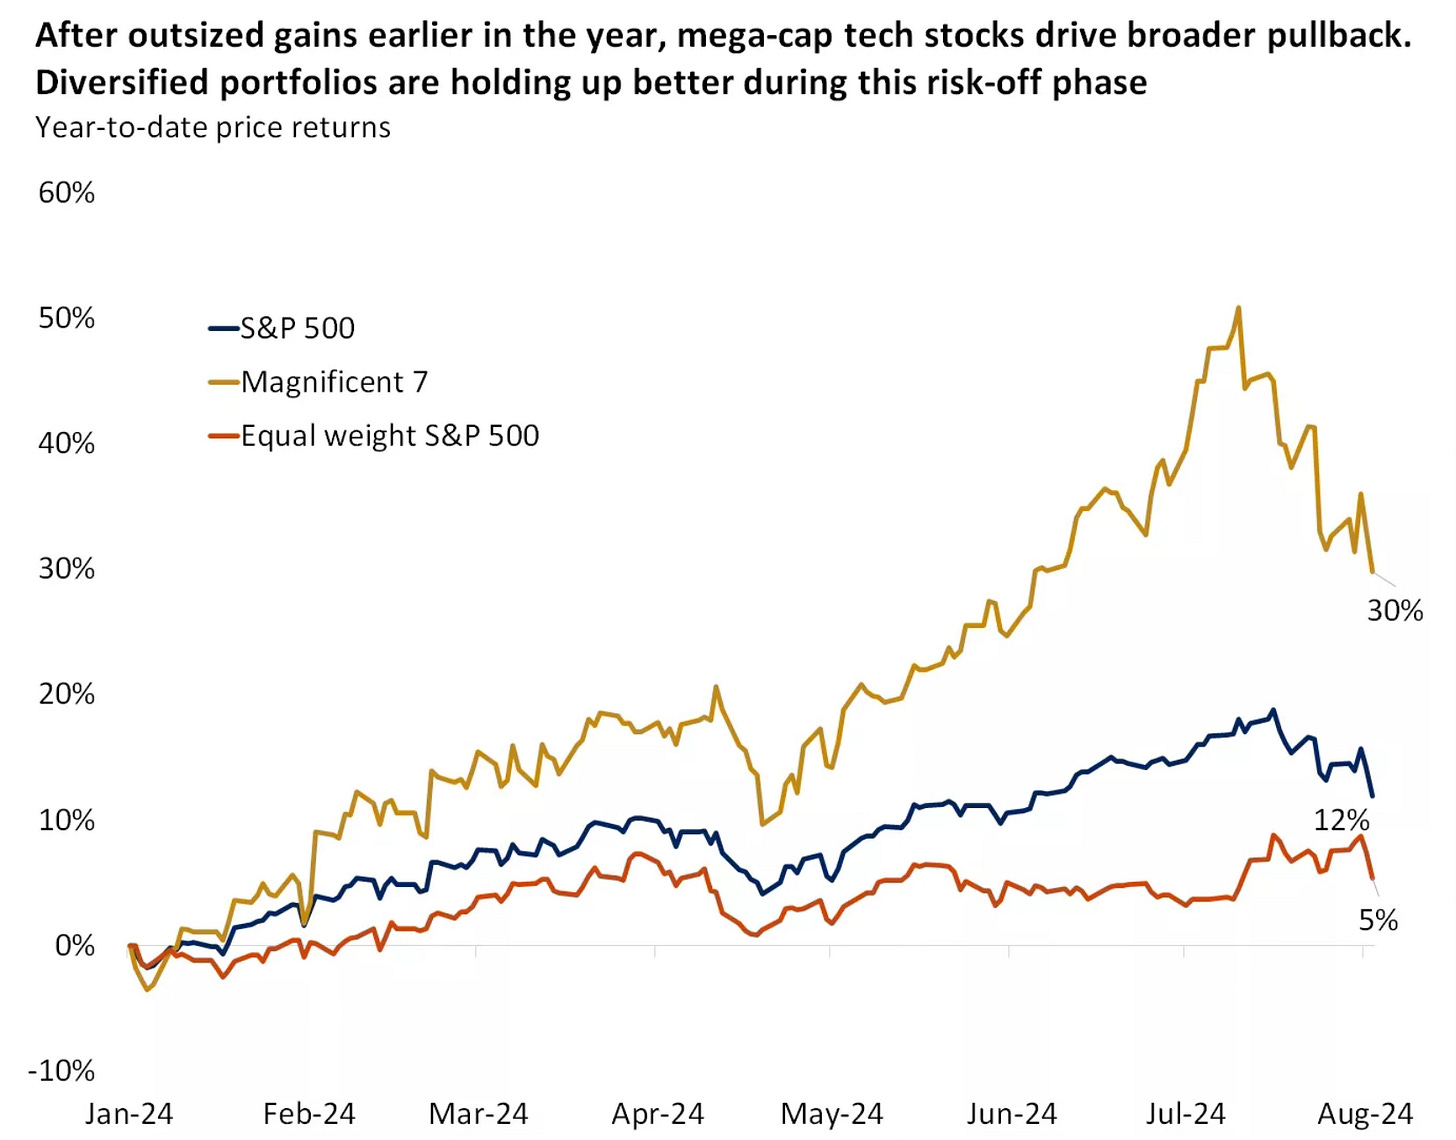
So the question is, does this pullback create a buying opportunity in some of the Mag 7 names?
They’re still heavily owned by long-only funds. Excluding Tesla, each of the Mag 7 names is owned by at least 70% of large cap funds. That’s much higher than the 13% for the average stock in the S&P 500.
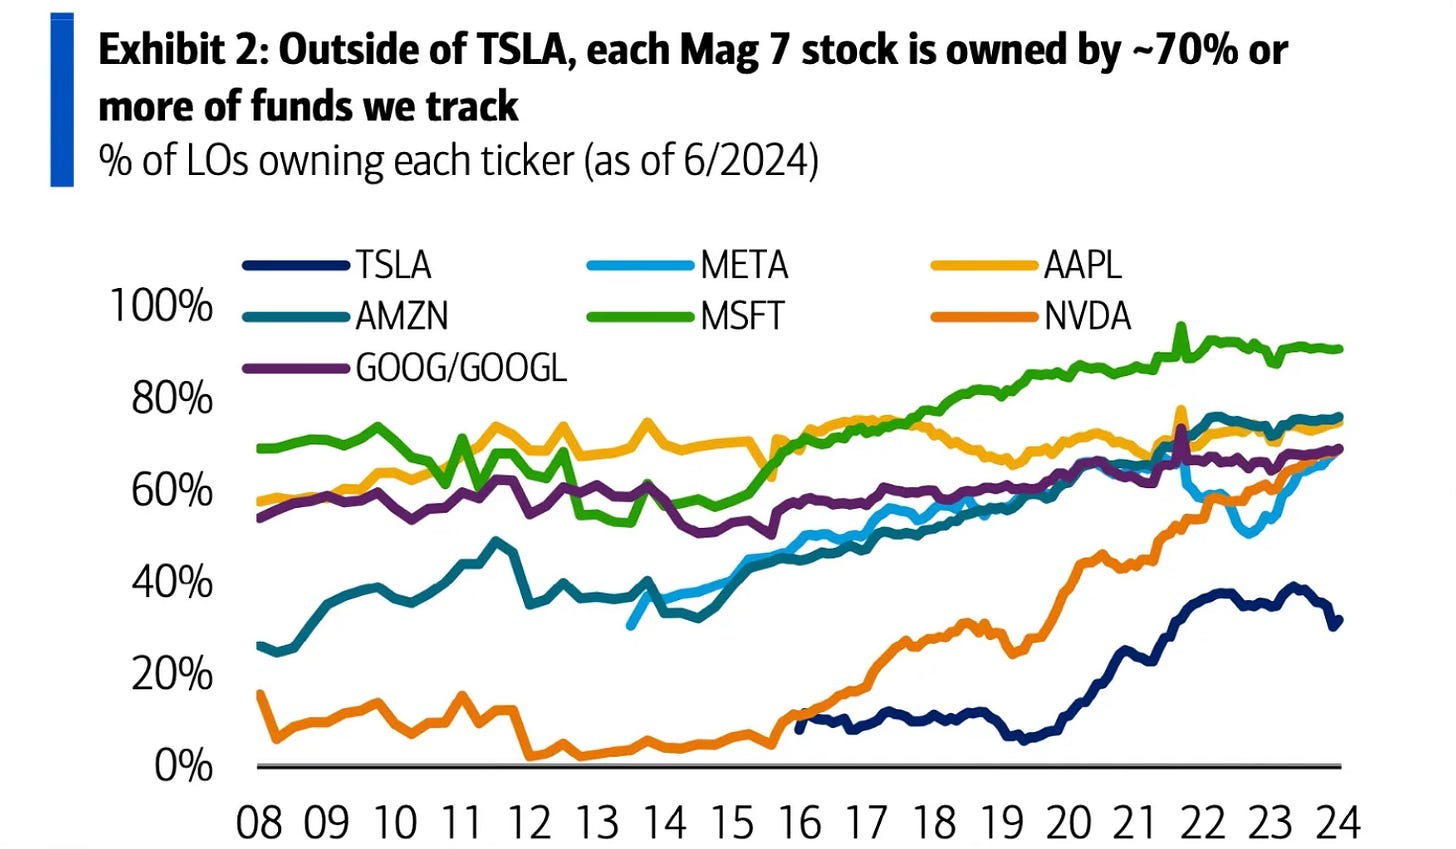
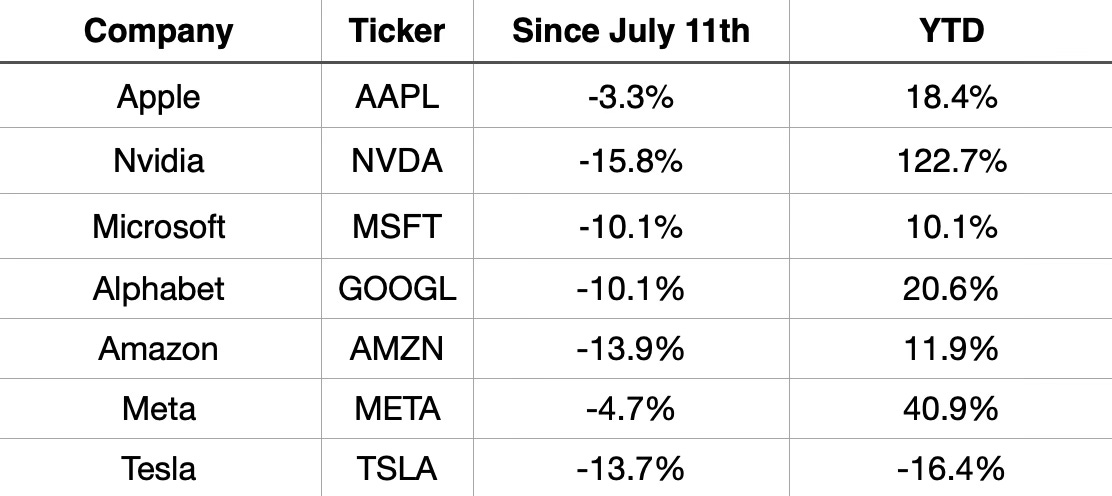
One could actually make a case for buying any of the Mag 7 here. Yes, even Nvidia after it’s seen an over 15% selloff since July 11th. As you’ll read below I bought more Amazon. Tesla is still very intriguing to me.
Moves I’ve Made
S&P 500 Index I added to my S&P 500 index position on Friday.
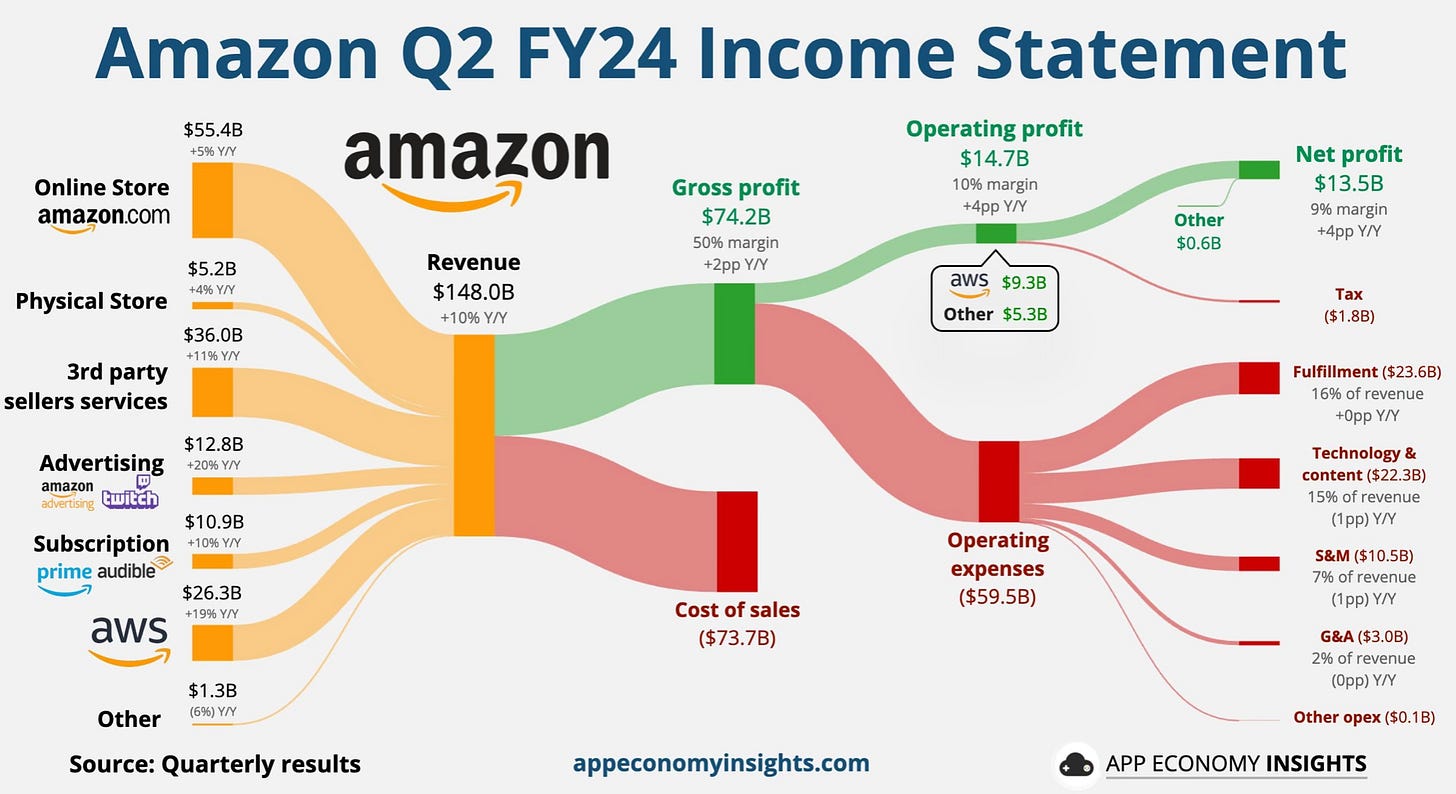
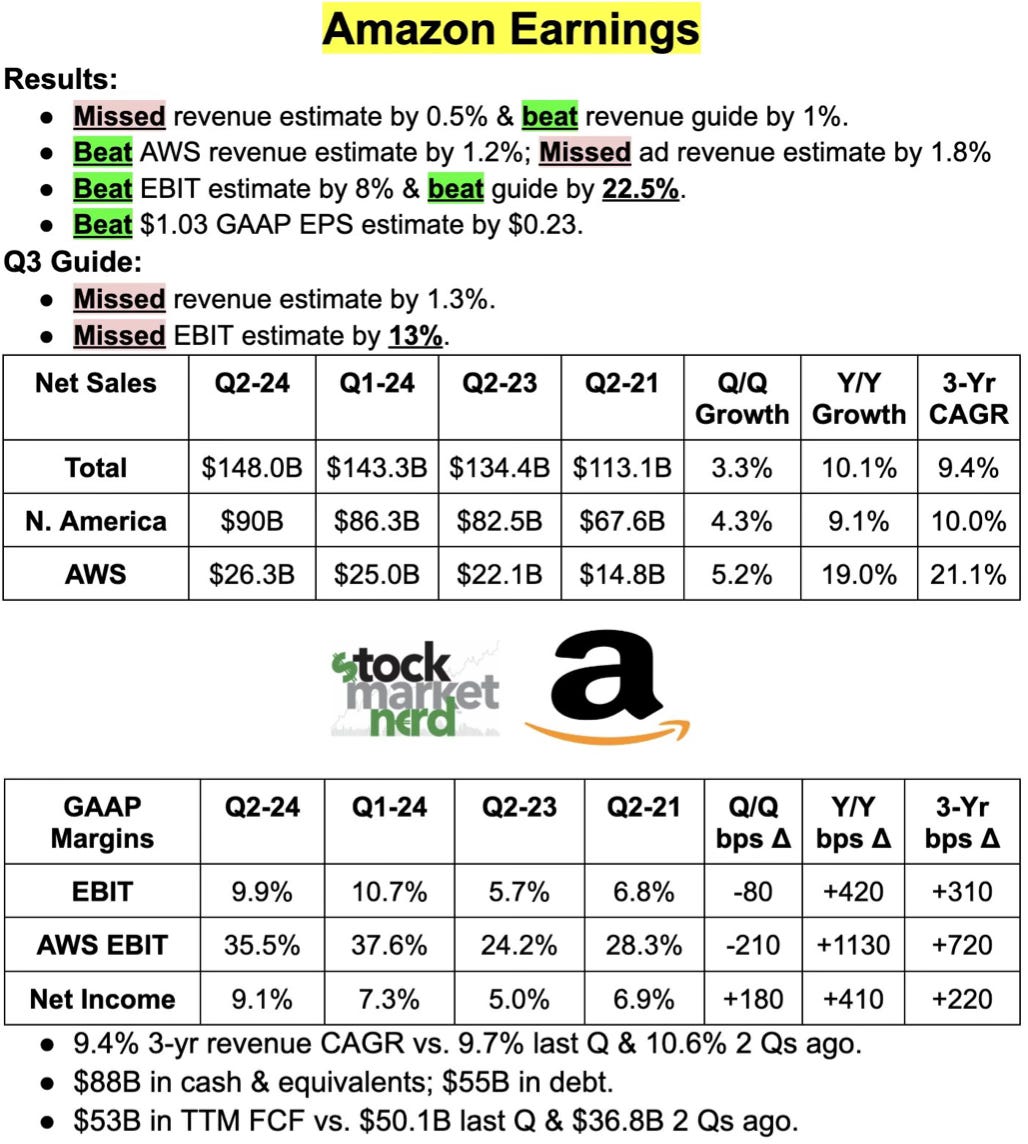
Amazon I added to my position in Amazon at $167 a share. After reporting a quarterly miss and combined with the tech selloff (Amazon’s worst day since 2022), I used this as a place to add more shares. I’ve been watching this name and was looking for a time to buy more. It was near the top of my shopping list. Down 15% over the past month. I think many forget that Amazon is still growing double digits.
CrowdStrike I added again to my CrowdStrike position at $269. Yes I do keep getting cut trying to catch this falling knife. I’ve been in this name since the early $120s in 2020. It’s a very long term position for me and still a favorite of mine.
If I were in this stock for a trade (short term), I would have sold it by now. The next couple quarters they will be in the penalty box. It could go lower and I will likely add more again. This will pass, but it’s already been punished, down 44% in the past month. Again, you buy stocks based on future looking qualities. Stocks are a forward looking measurement.
What I’m Watching
With a sea of red as well as doom and gloom to end the week, I think we have to take a broader context on where the state of the market is at.
The bull market remains intact. Contrary to what someone may try and convince you otherwise, we’re still firmly in a bull market.
We’ve just seen 70% of S&P 500 companies outperform the index. That’s the highest percentage in 30 years!
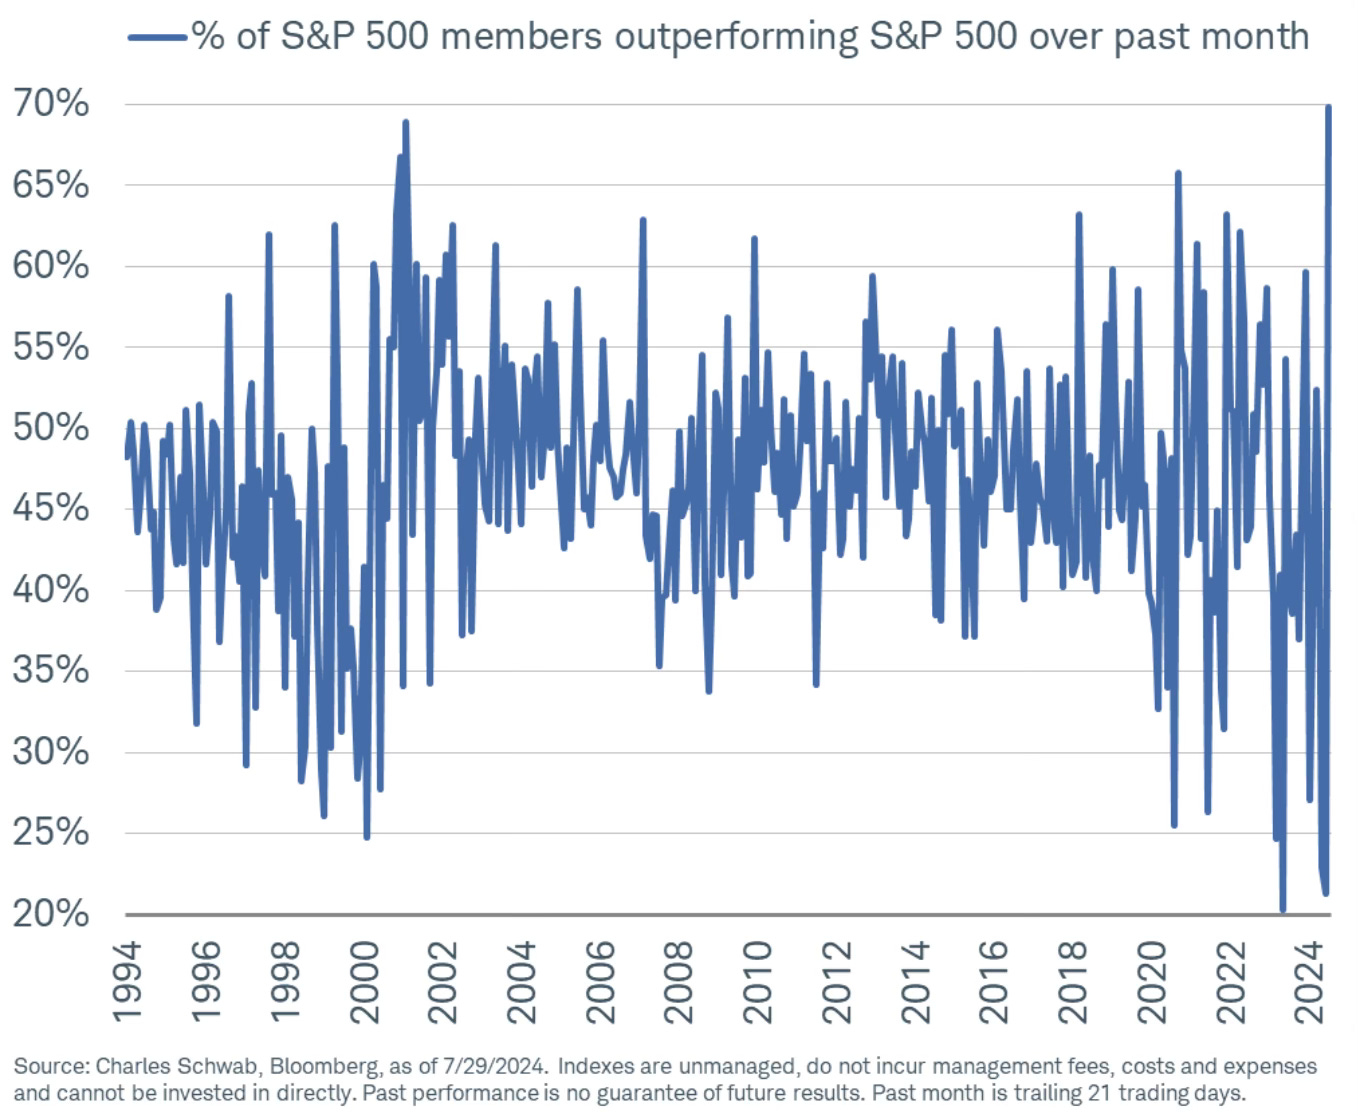
This from Willie Delwiche is quite notable.
More than 40% of industry groups across all cap levels (including 54% of small-cap groups) made new highs last week. That is a new high for the cycle.
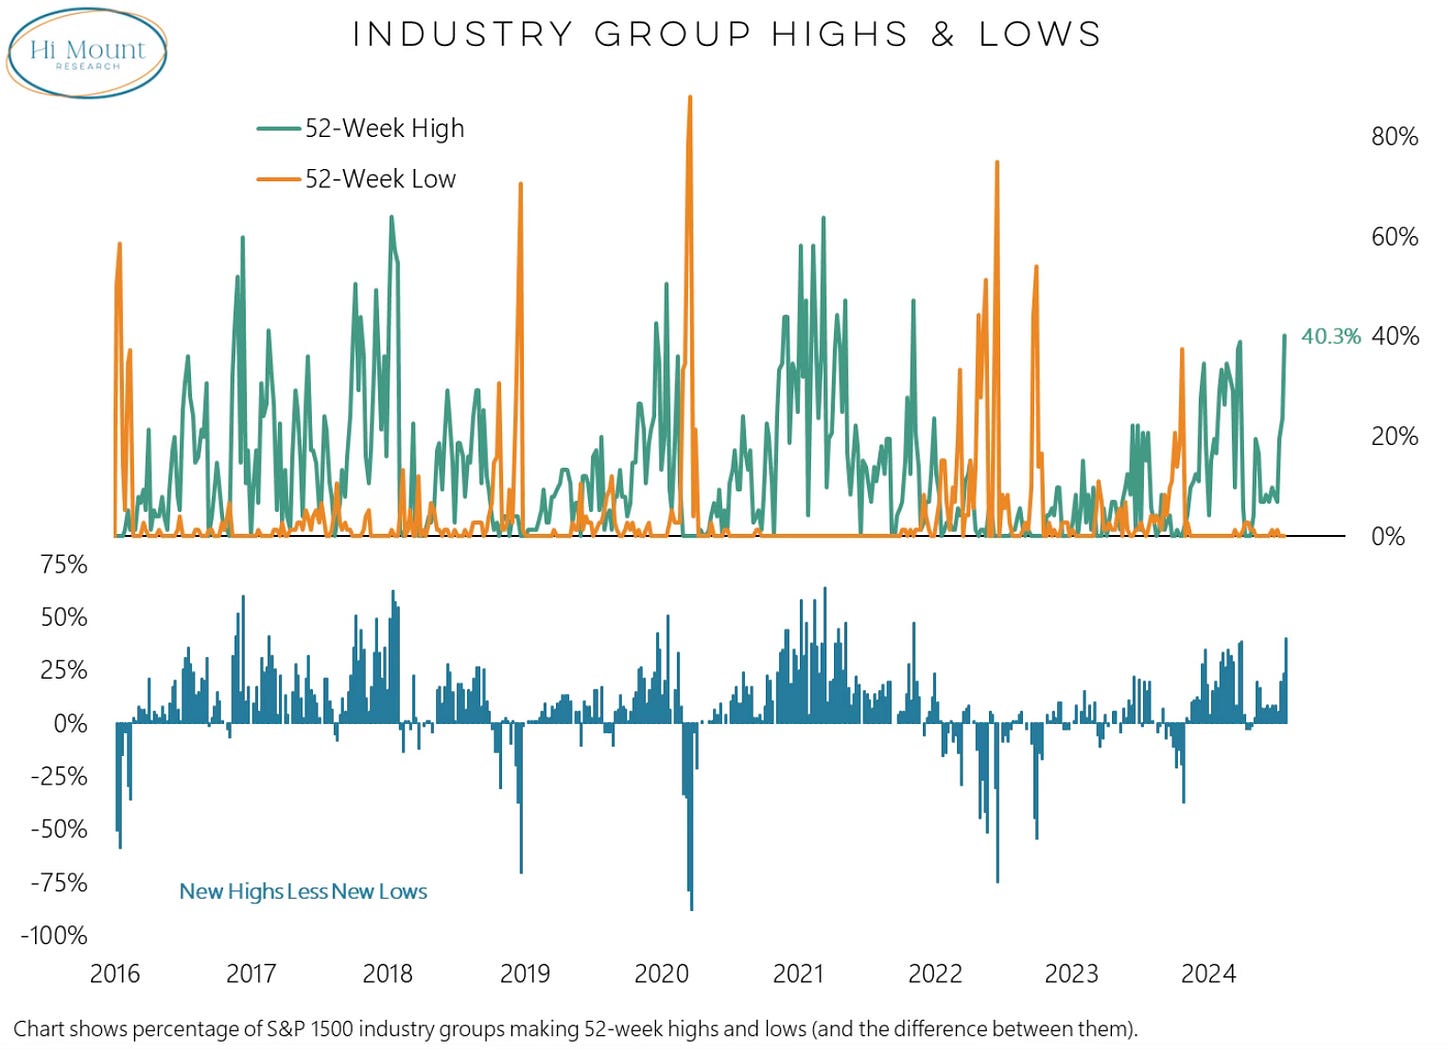
The breadth across all market cap sizes remain green and intact. If we start seeing more red here is when we can start to worry. Until then, enjoy the green.

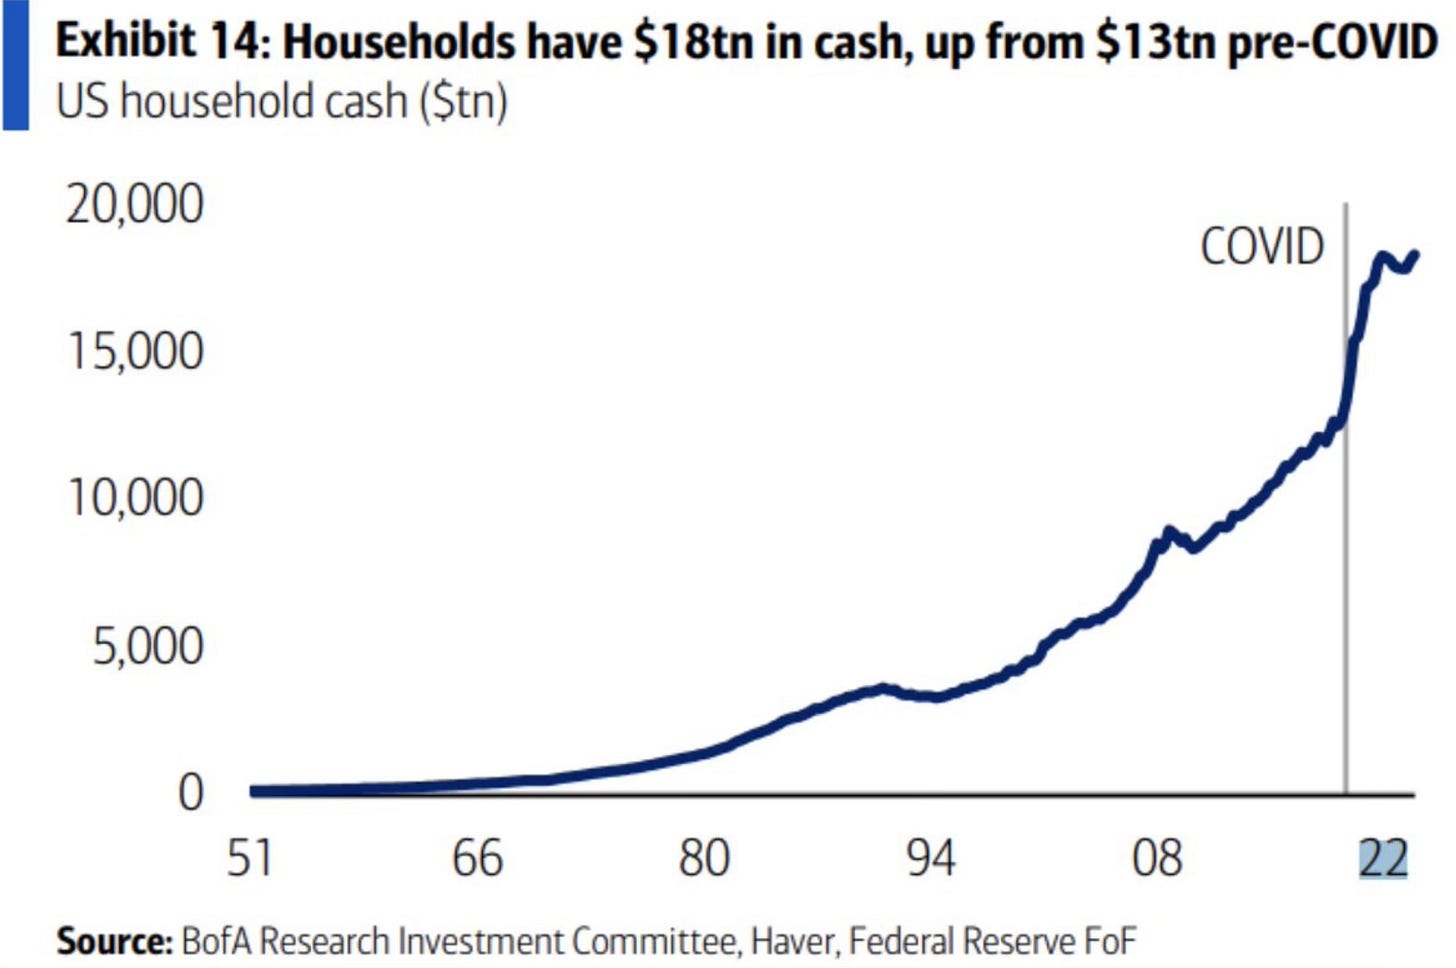
Then there was this chart that caught my attention this week. If the consumer can handle any type of slowdown, this is the time. Take a look at the amount of cash US households have now compared to pre-COVID. $18 trillion vs. $13 trillion. That’s over 40% more cash now than in 2019.
Another area that I will closely be watching is what housing does. A silver lining to what is happening with the looming interest rate cuts, is that mortgage rates will push lower. The 30-year fixed mortgage rate on Friday already fell to 6.4%. That’s the lowest level since April 2023.
I’ve been conditioned to buy dips in a bull market. Not fear them. I still firmly believe we’re in a bull market. That’s why I’ve been buying.
I’m trying not to overthink it. It’s why I wrote the piece Wednesday called, Reasons To Sell. I’m taking advantage of the opportunity. There are still many more reasons to buy than sell.
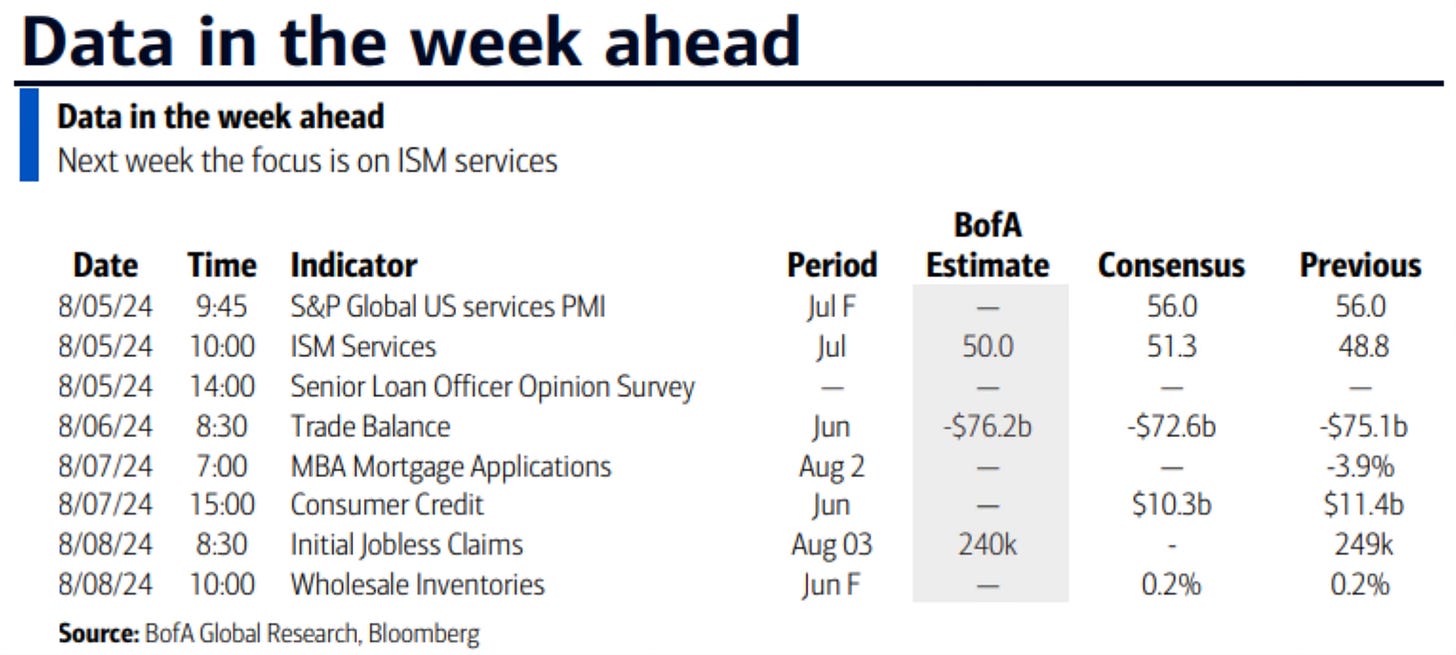
Upcoming Earnings & Data

The Coffee Table ☕
Josh Schafer of Yahoo Finance periodically does a chart blitz of charts from across markets and the economy and I absolutely love it. These are 32 charts along with the comments from whoever created the chart. Yahoo Finance Chartbook: 32 charts tell the story of markets and the economy midway through 2024
A special thanks to Ryan Detrick and Sonu Varghese for having me on 15 Minutes to the Bell on Friday. As readers know these are two of the best and it was nice to talk markets and the economy with them on a busy Friday. You can listen to the recording here.
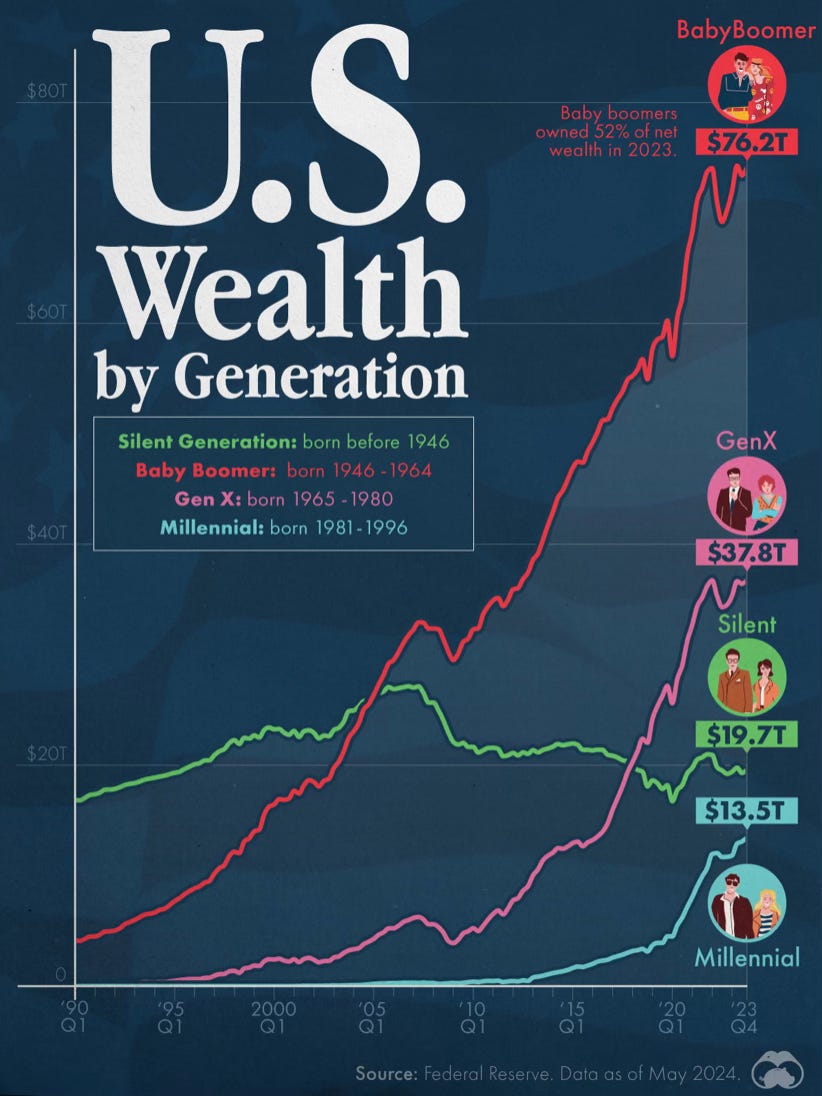
Check out this U.S. Wealth by Generation chart. Baby boomers own 52% of the wealth in the America.
Source: Visual Capitalist
Thank you for reading! If you enjoyed Spilled Coffee, please subscribe.
Spilled Coffee grows through word of mouth. Please consider sharing this post with someone who might appreciate it.
Order my book, Two-Way Street below.


