Investing Update: The Top Stock To Own Now
What I'm buying, selling & watching
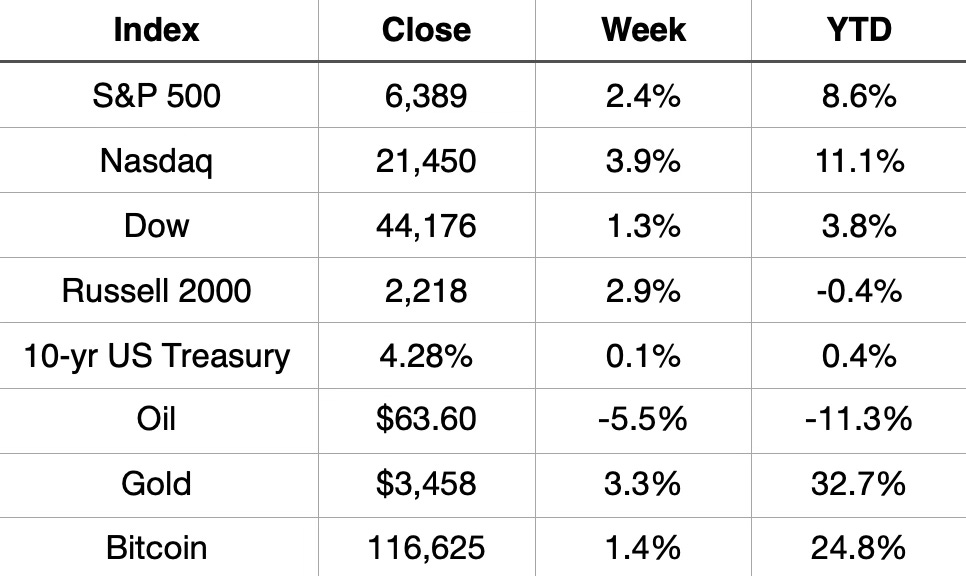
All the major indices finished up for the week. The S&P 500 closed right at the last all-time high level of 6,389. Finishing just shy of a new record. The Nasdaq posted a new record high to end the week.
YTD the Nasdaq leads the way up 11.1%, the S&P 500 is up 8.6% and the Dow is up 3.8%.
Market Recap
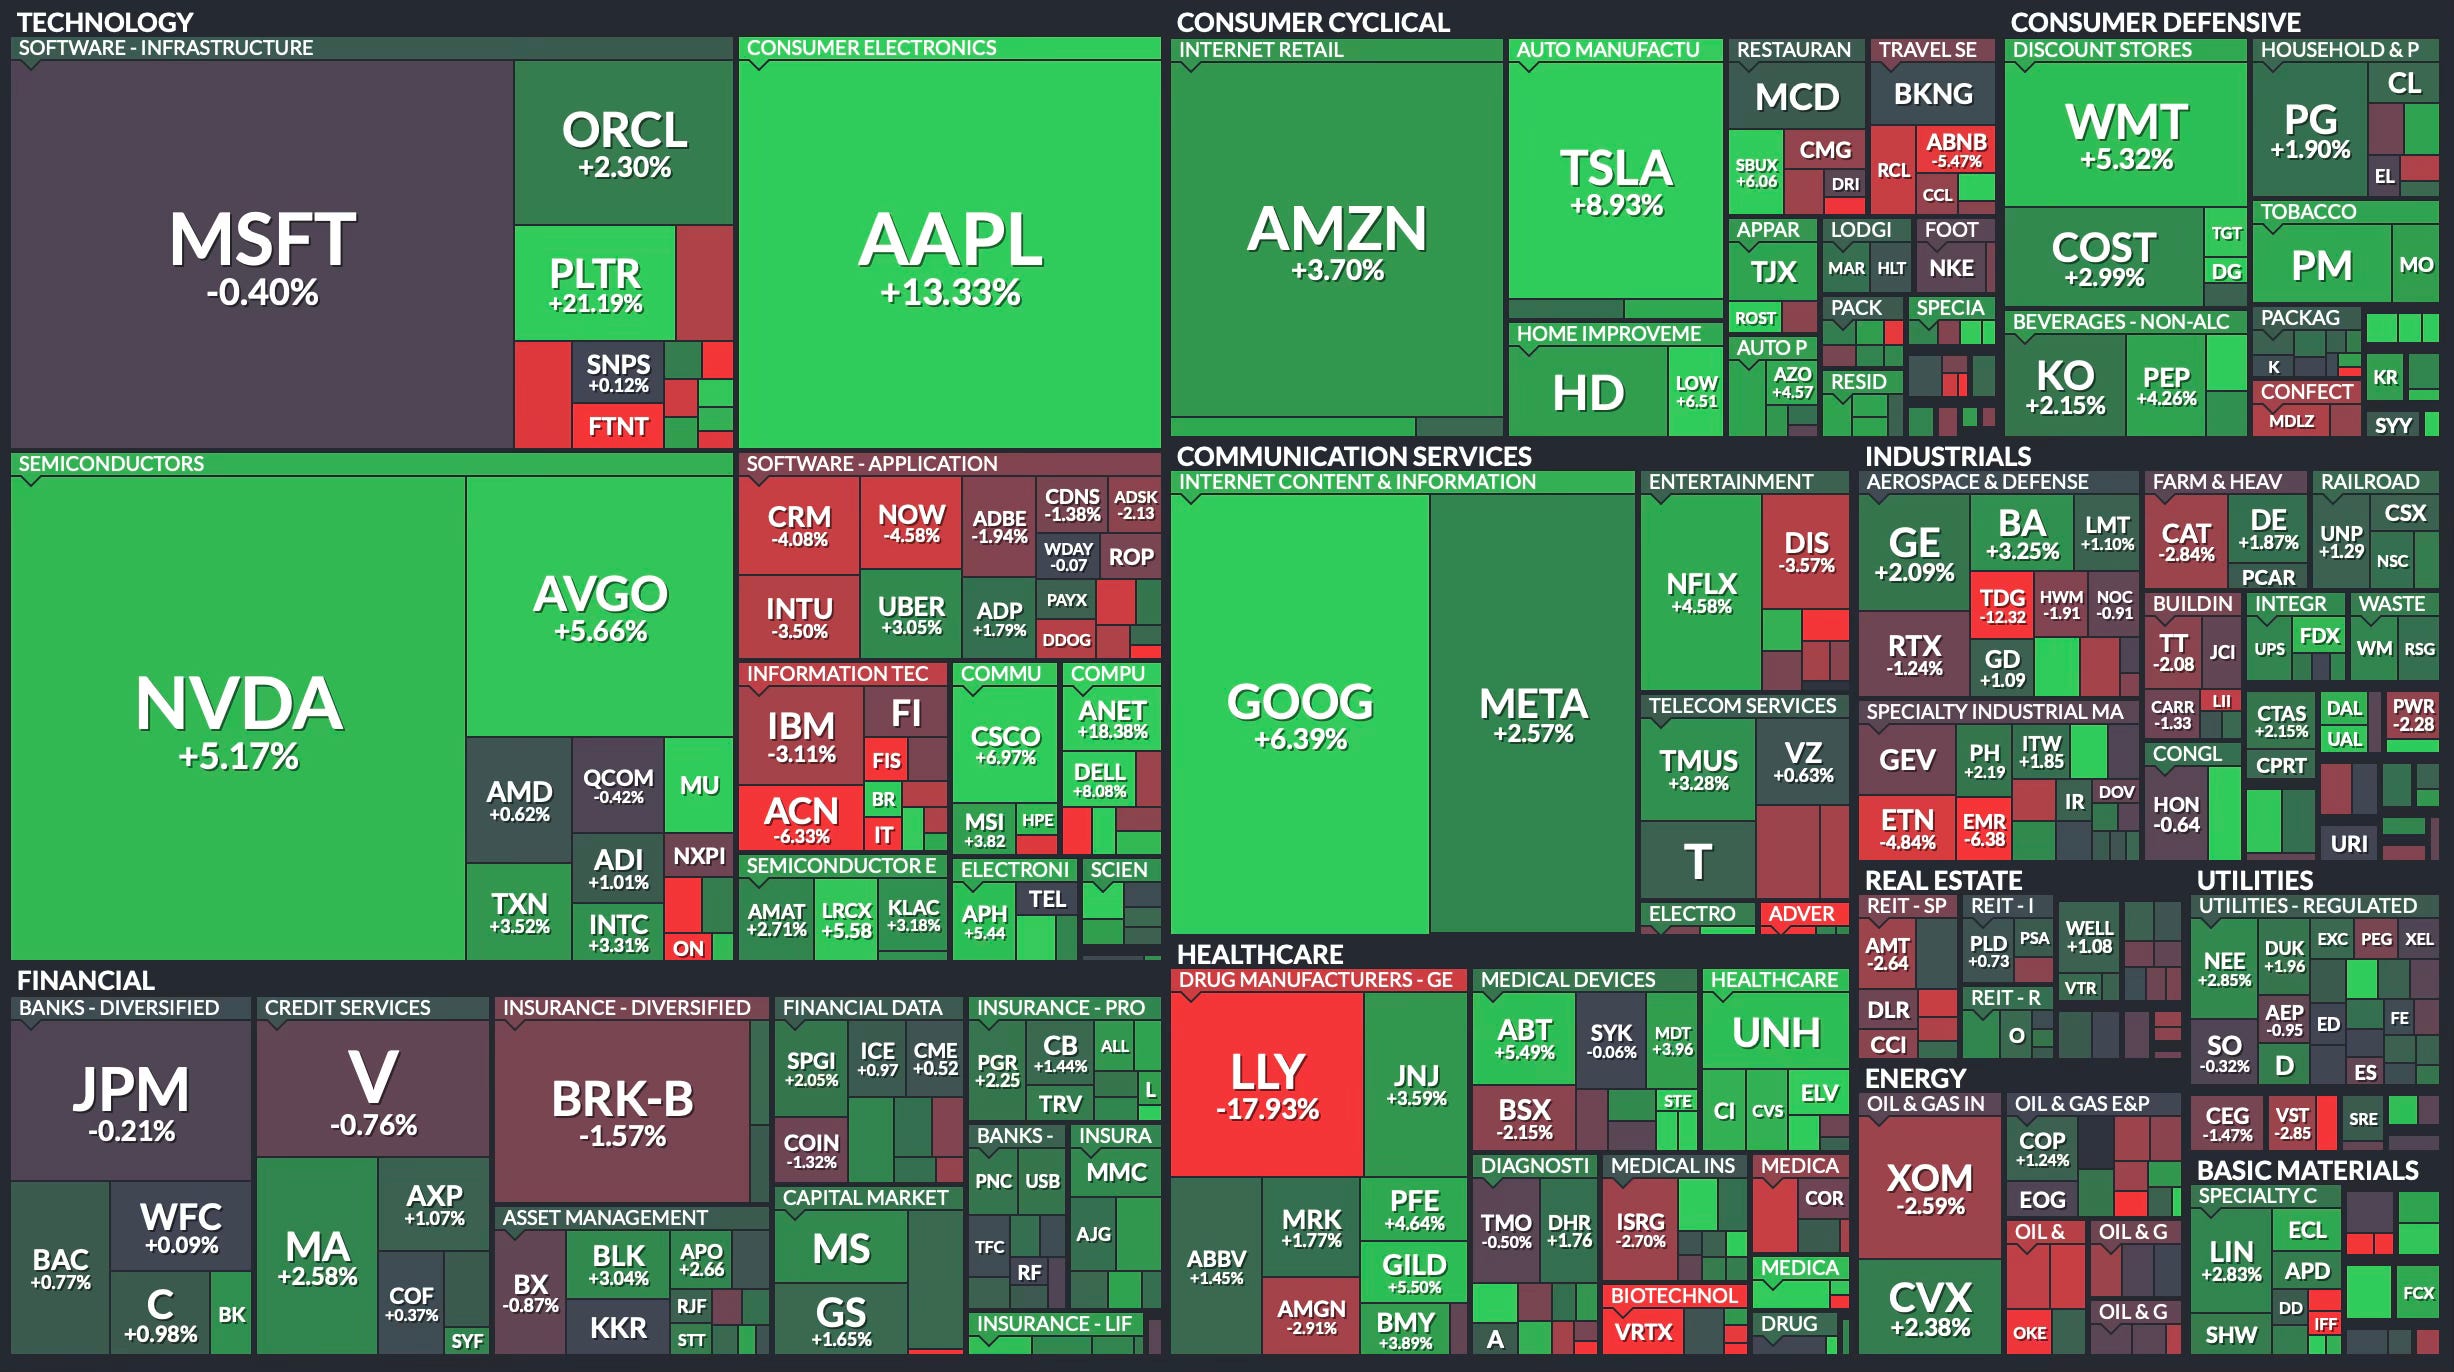
Weekly Heat Map Of Stocks
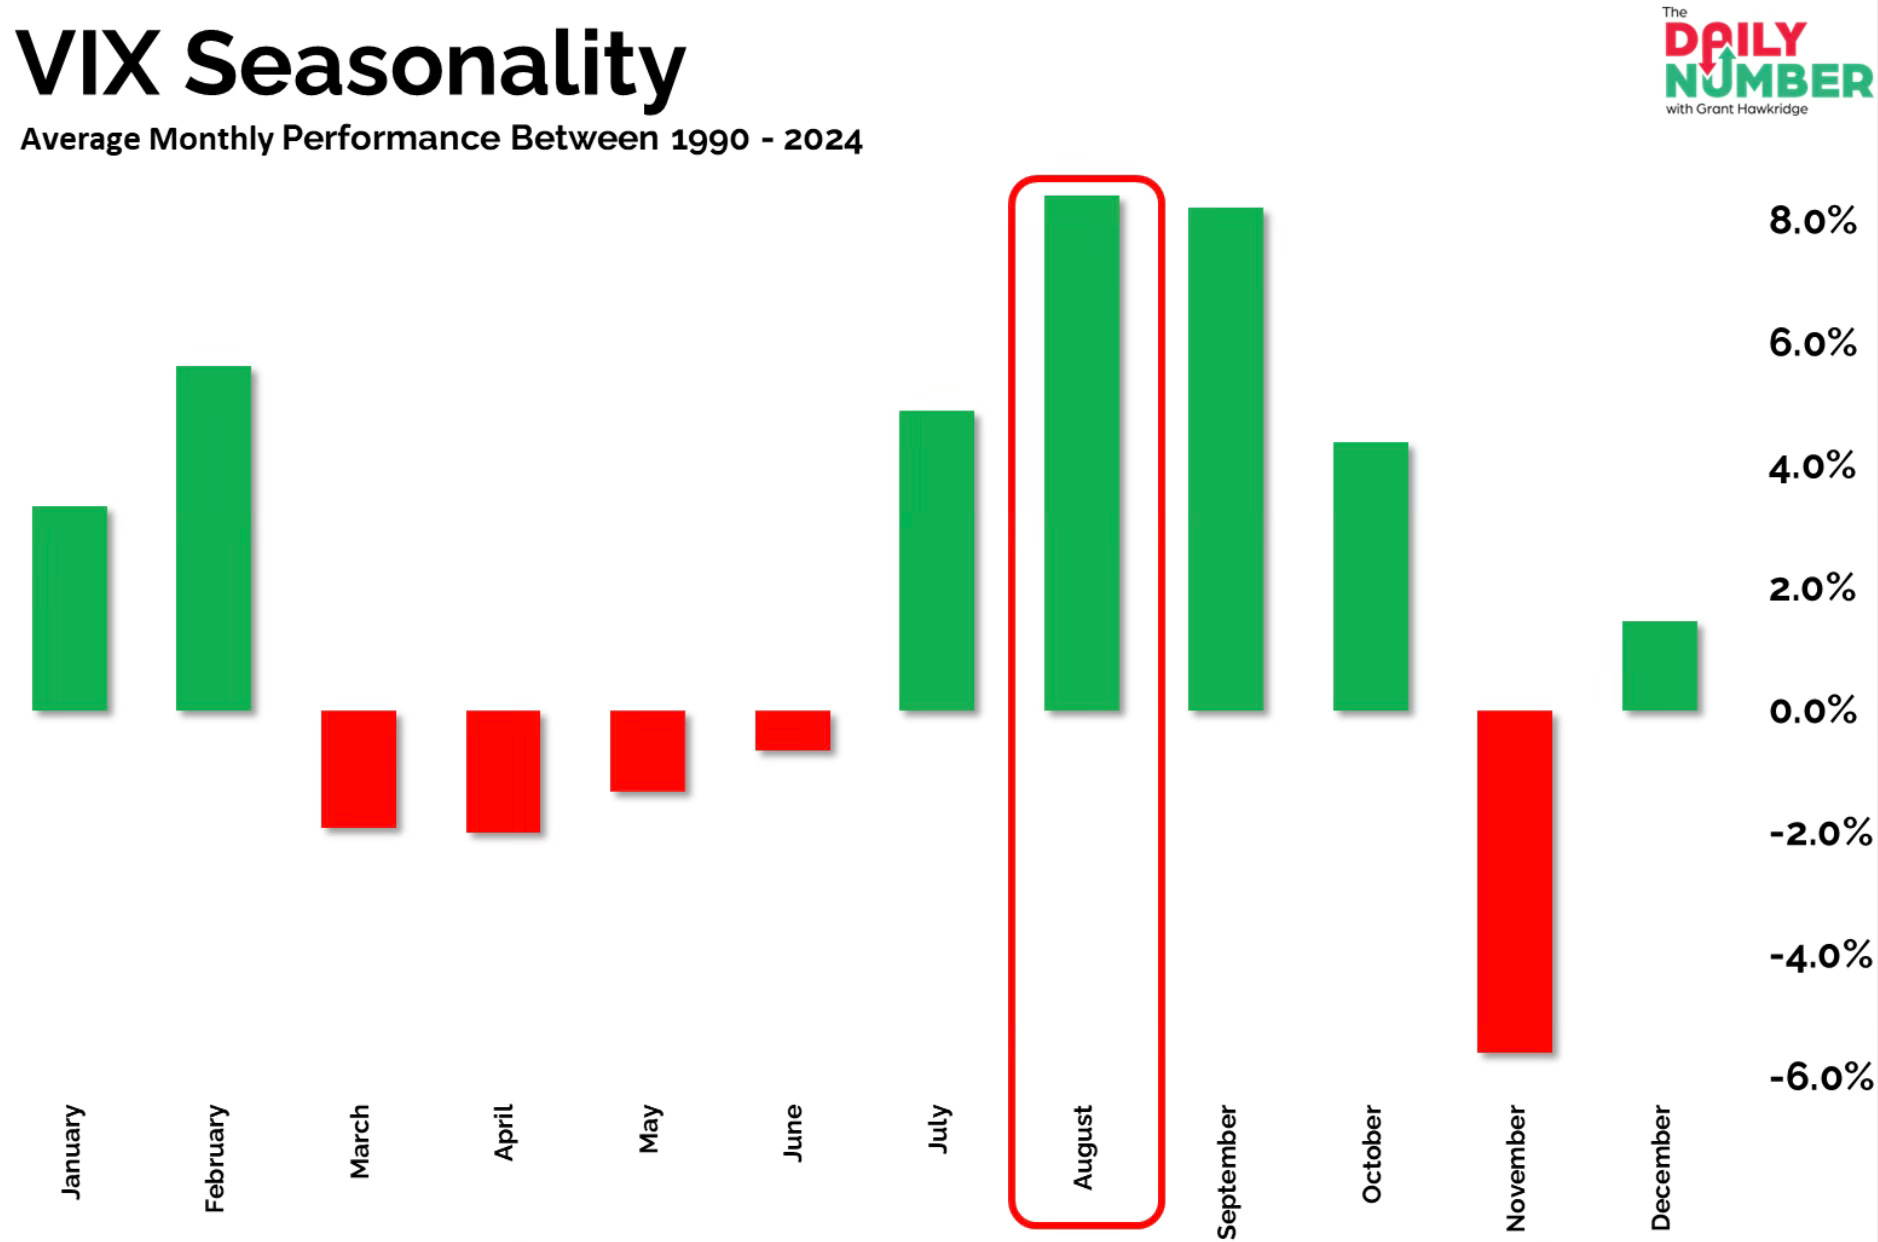
Is this the peak before the seasonal fall? I ask this because this is when the seasonal decline usually begins.
This chart from Ryan Detrick does a nice job showing historically what happens at this point in the post election cycle. Right about now in early August, the slide starts.
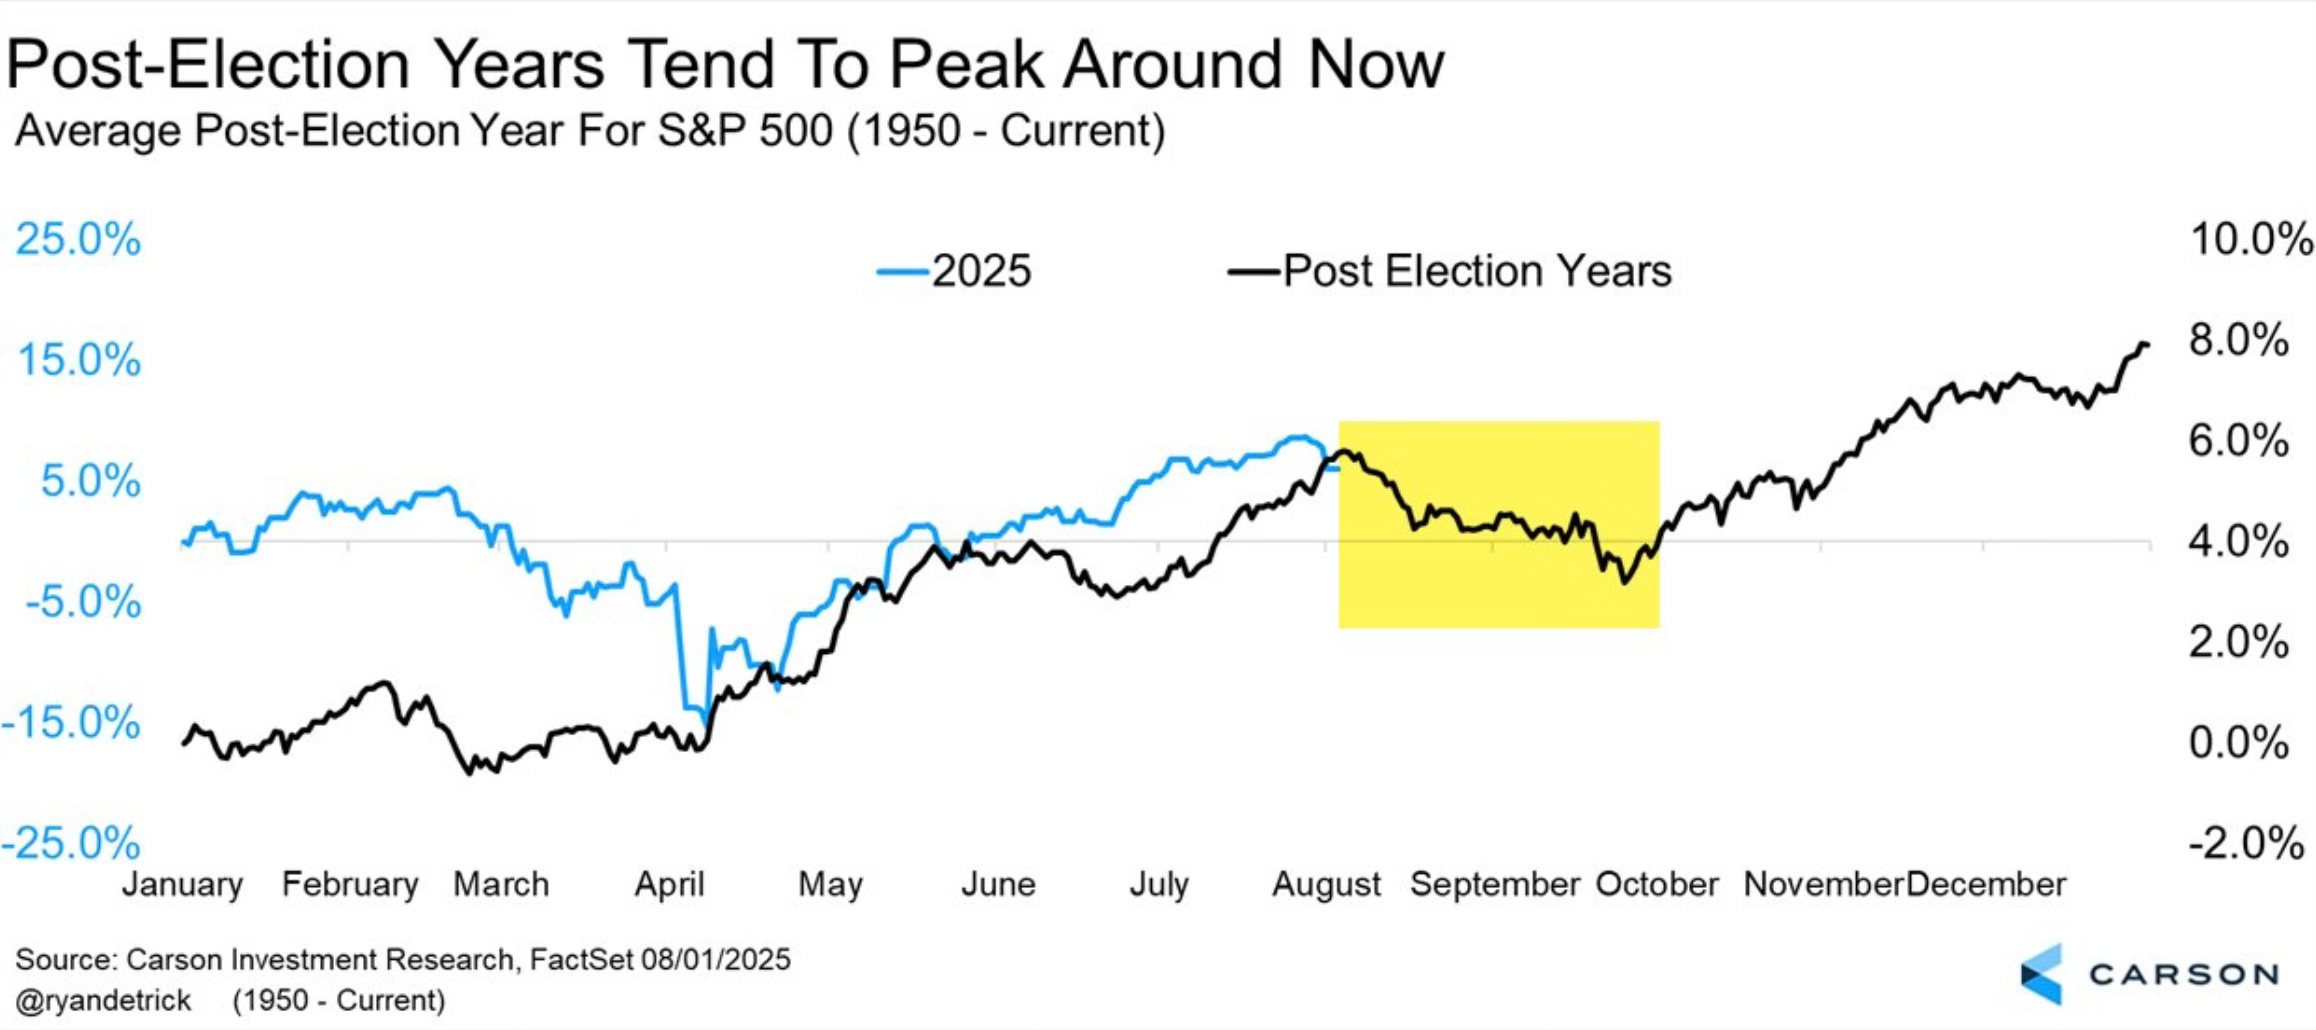
August and September are seasonally weak. In Q4 that historically changes.
The internal data right now isn’t pointing to any slide. The uptrend is still strong.
Almost 46% of the S&P 500 stocks are above both their 50-day and 200-day.
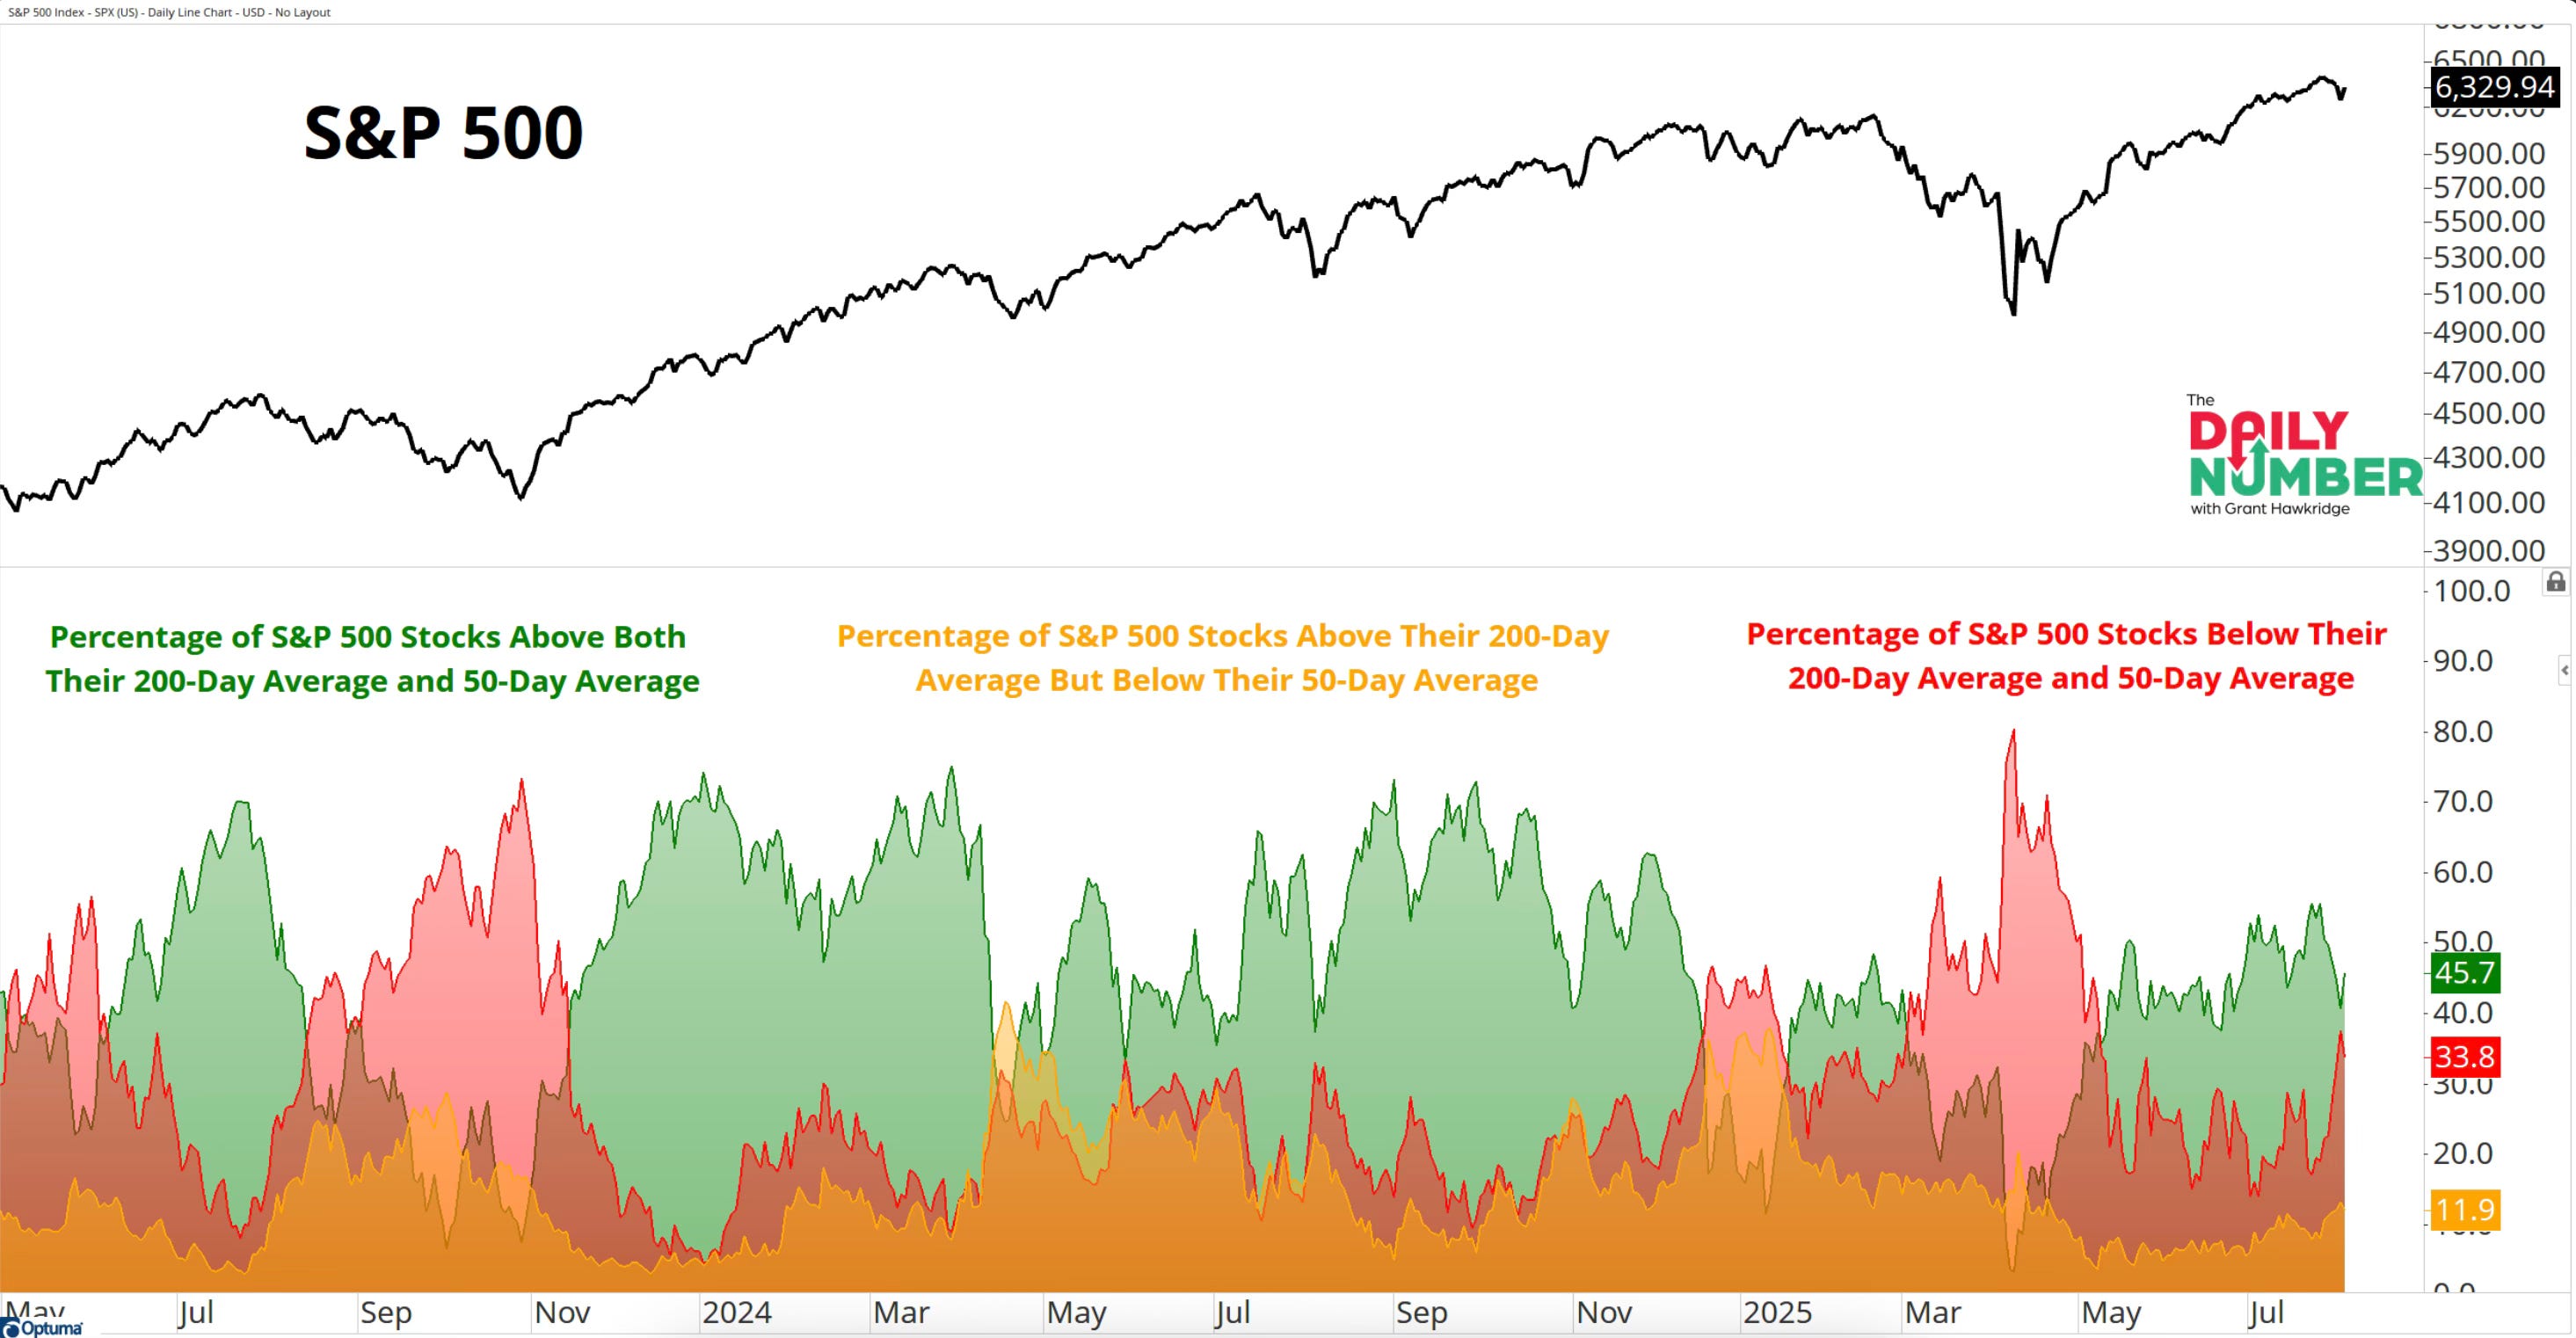
57% of S&P 500 stocks are above their 200-day.
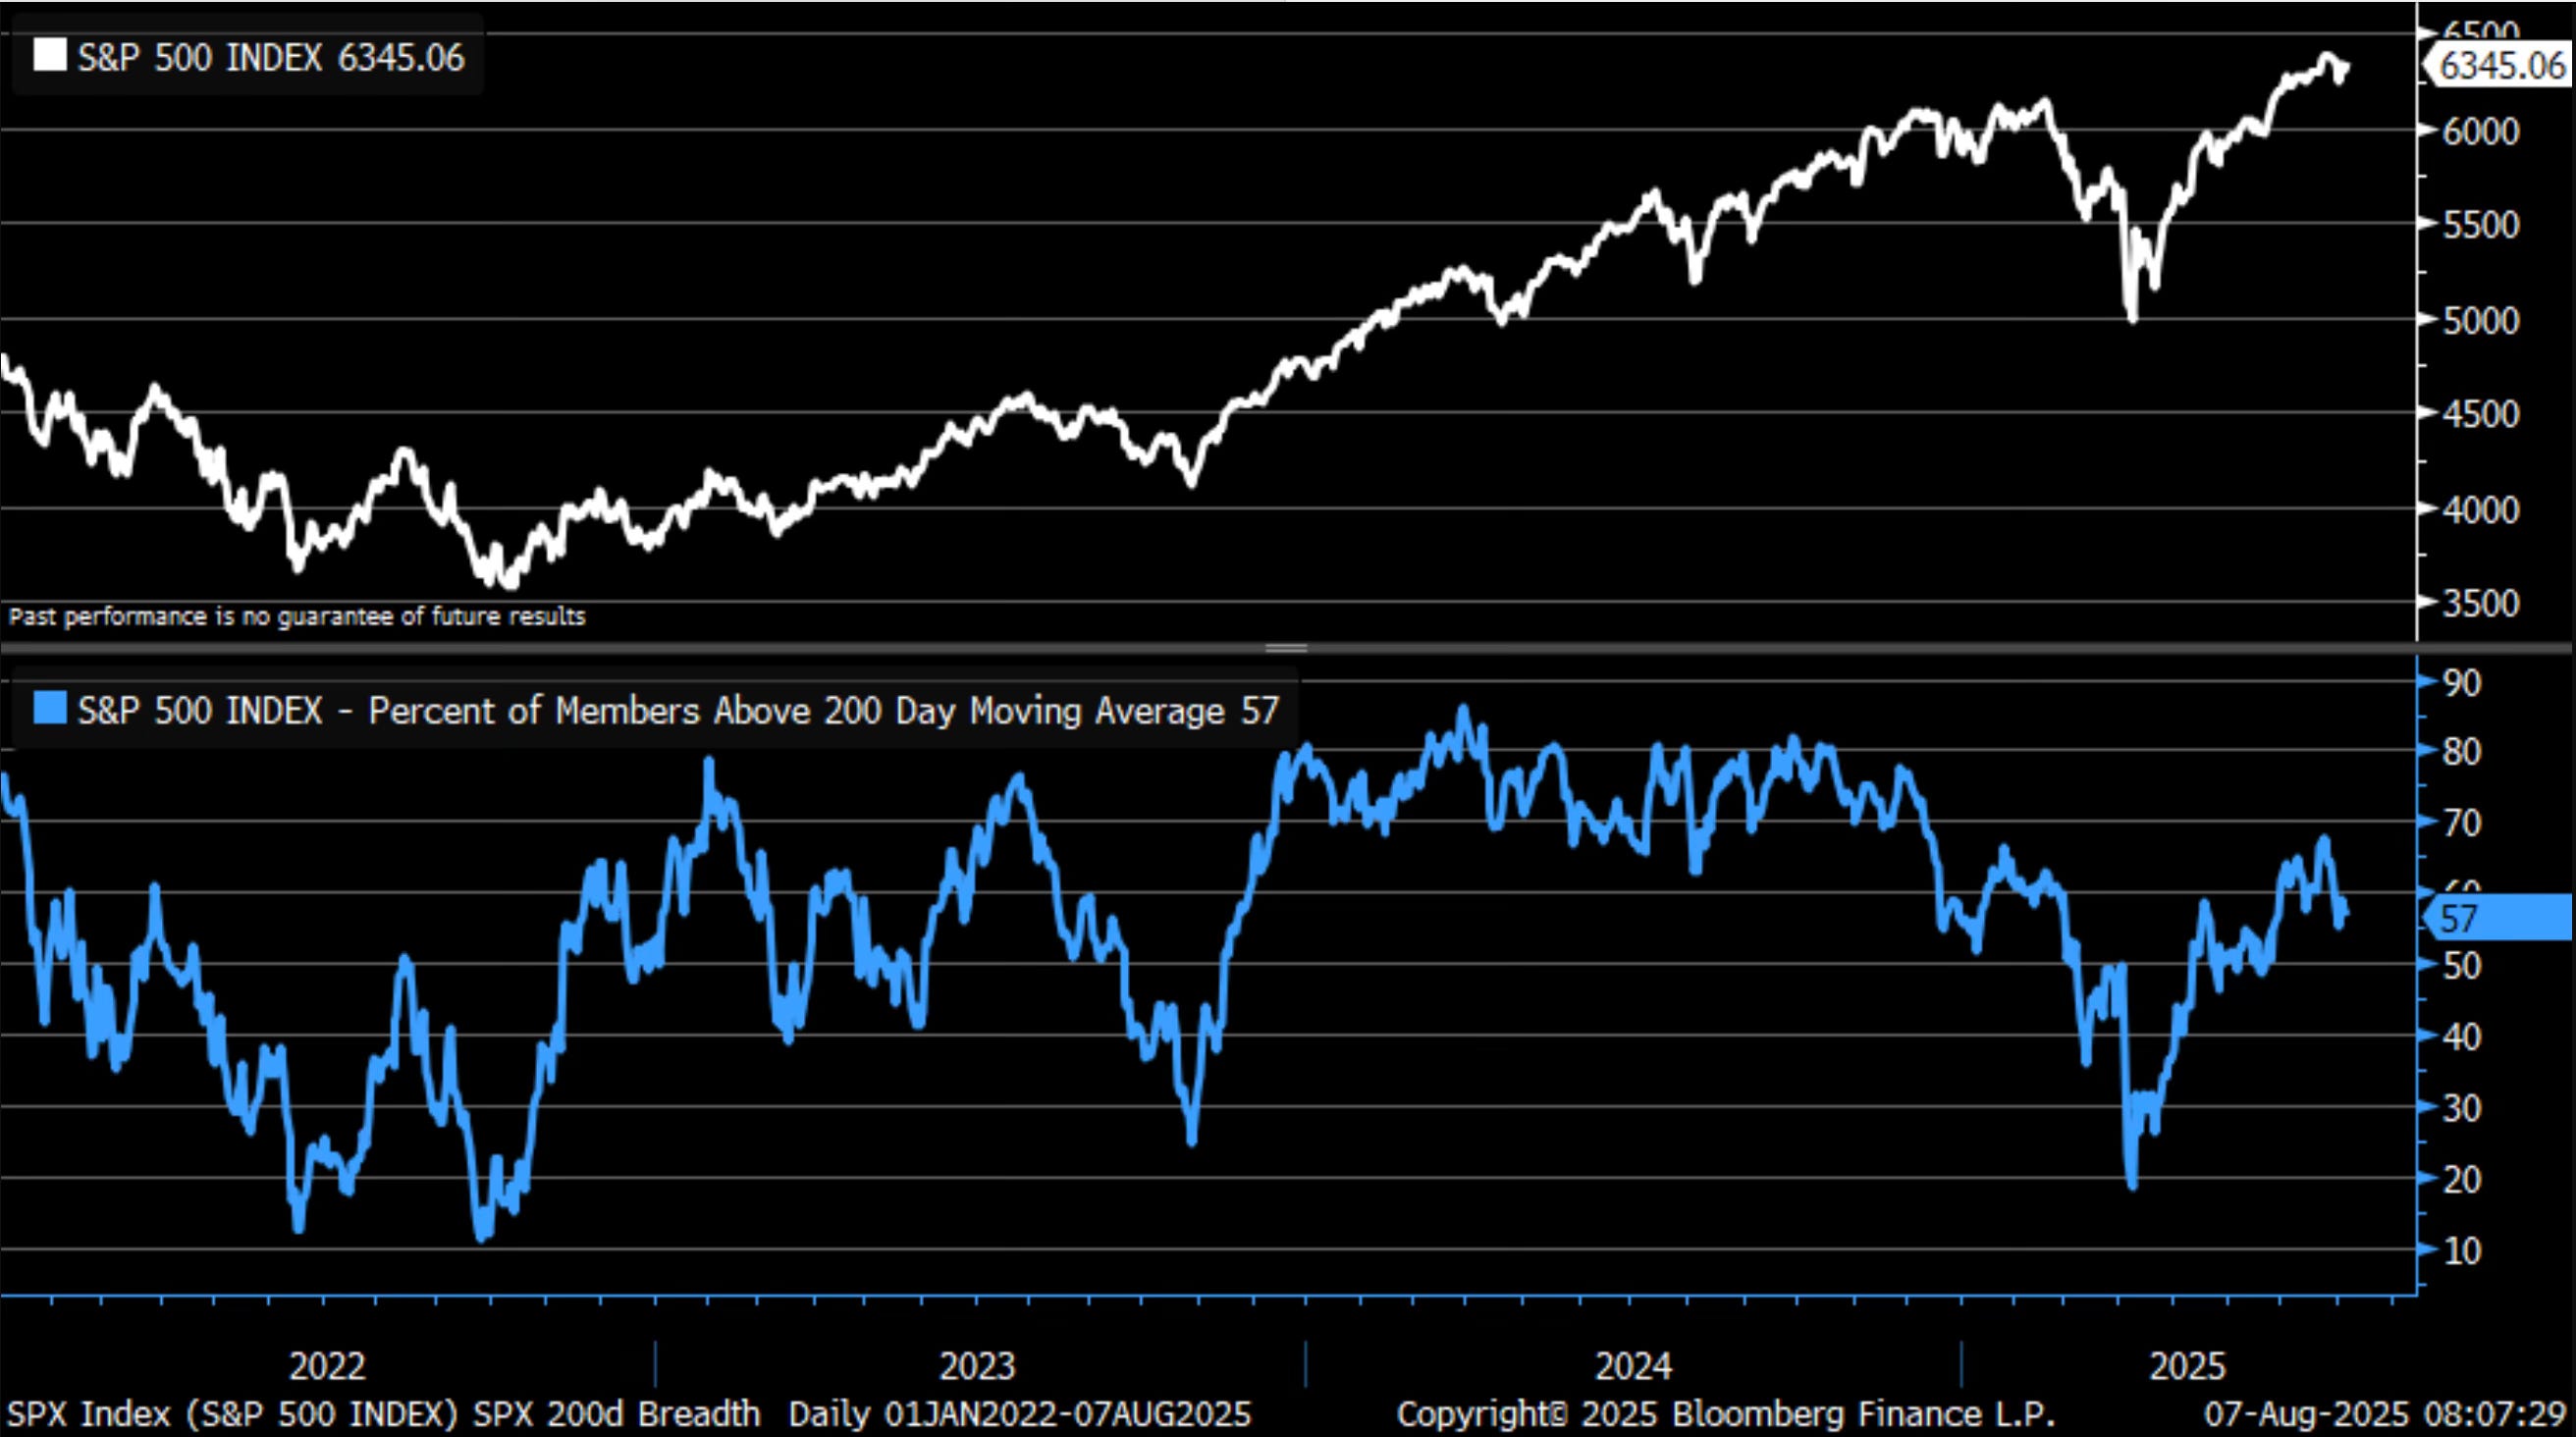
The seasonal swoon could start next week. We don’t know. All we do know, is that right now the underlying data still shows a strong bull market.
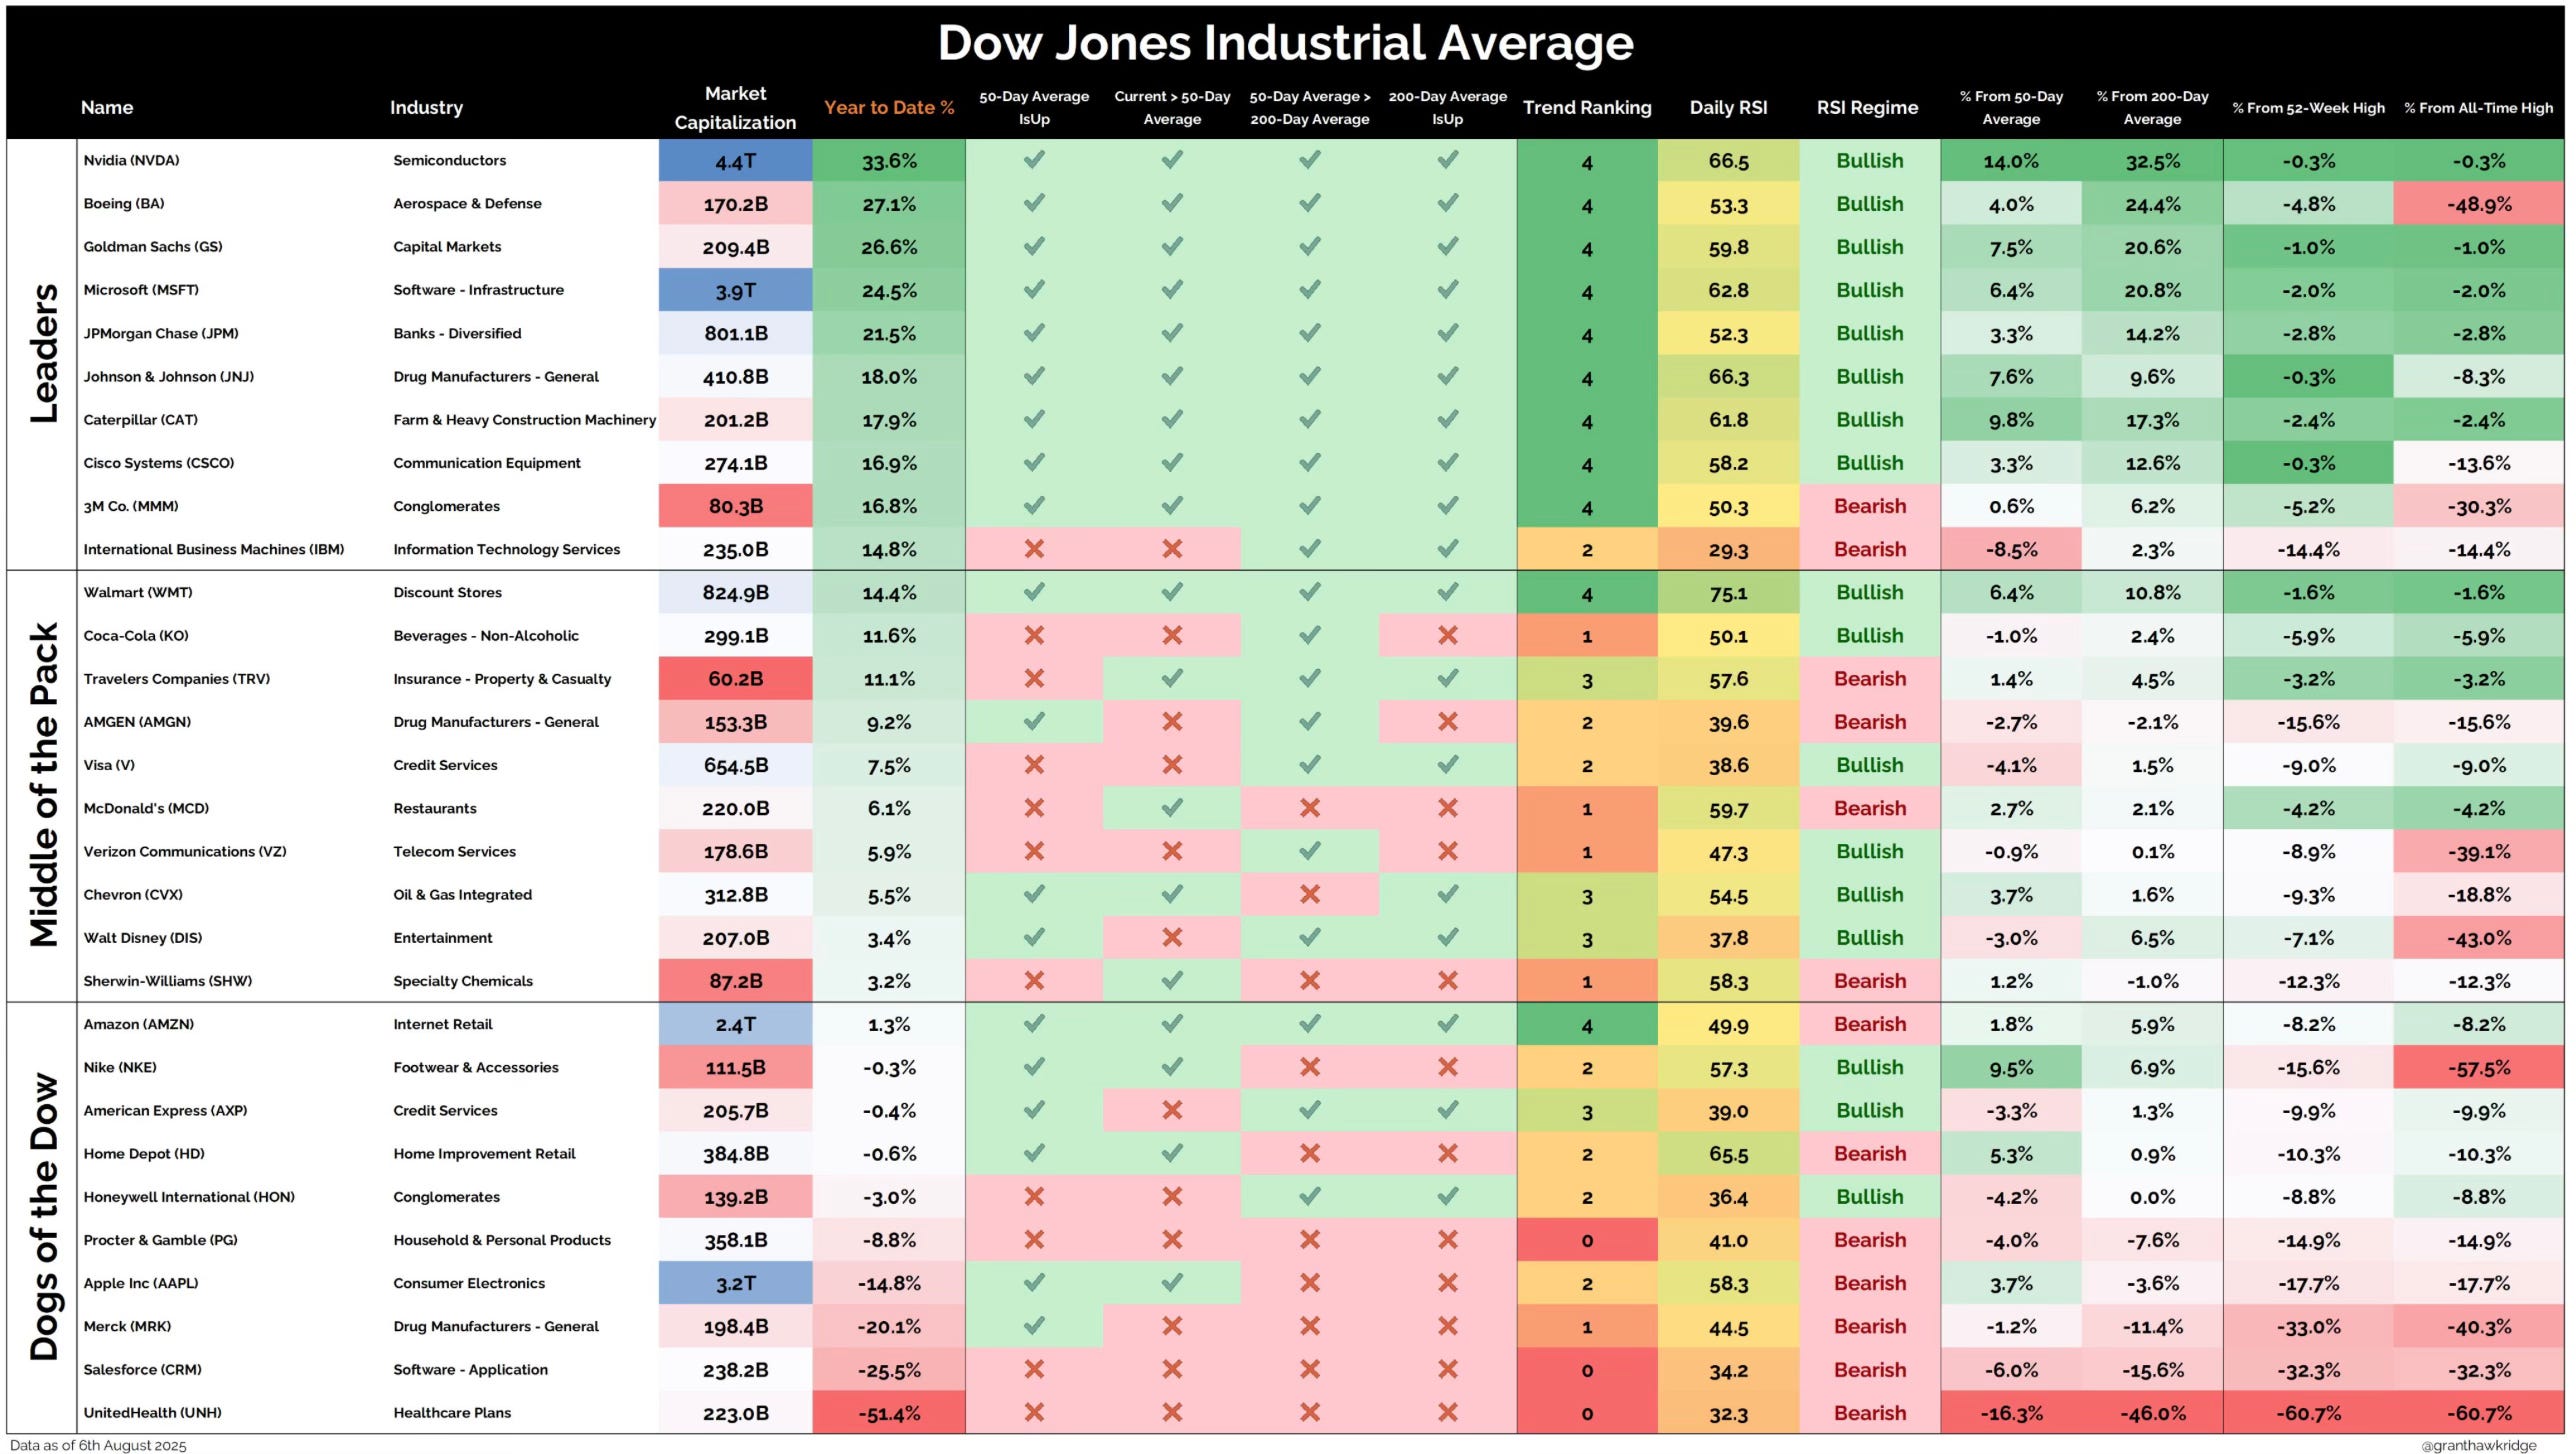
Dow Performance YTD
Here is a breakdown of what all the Dow components have done YTD.
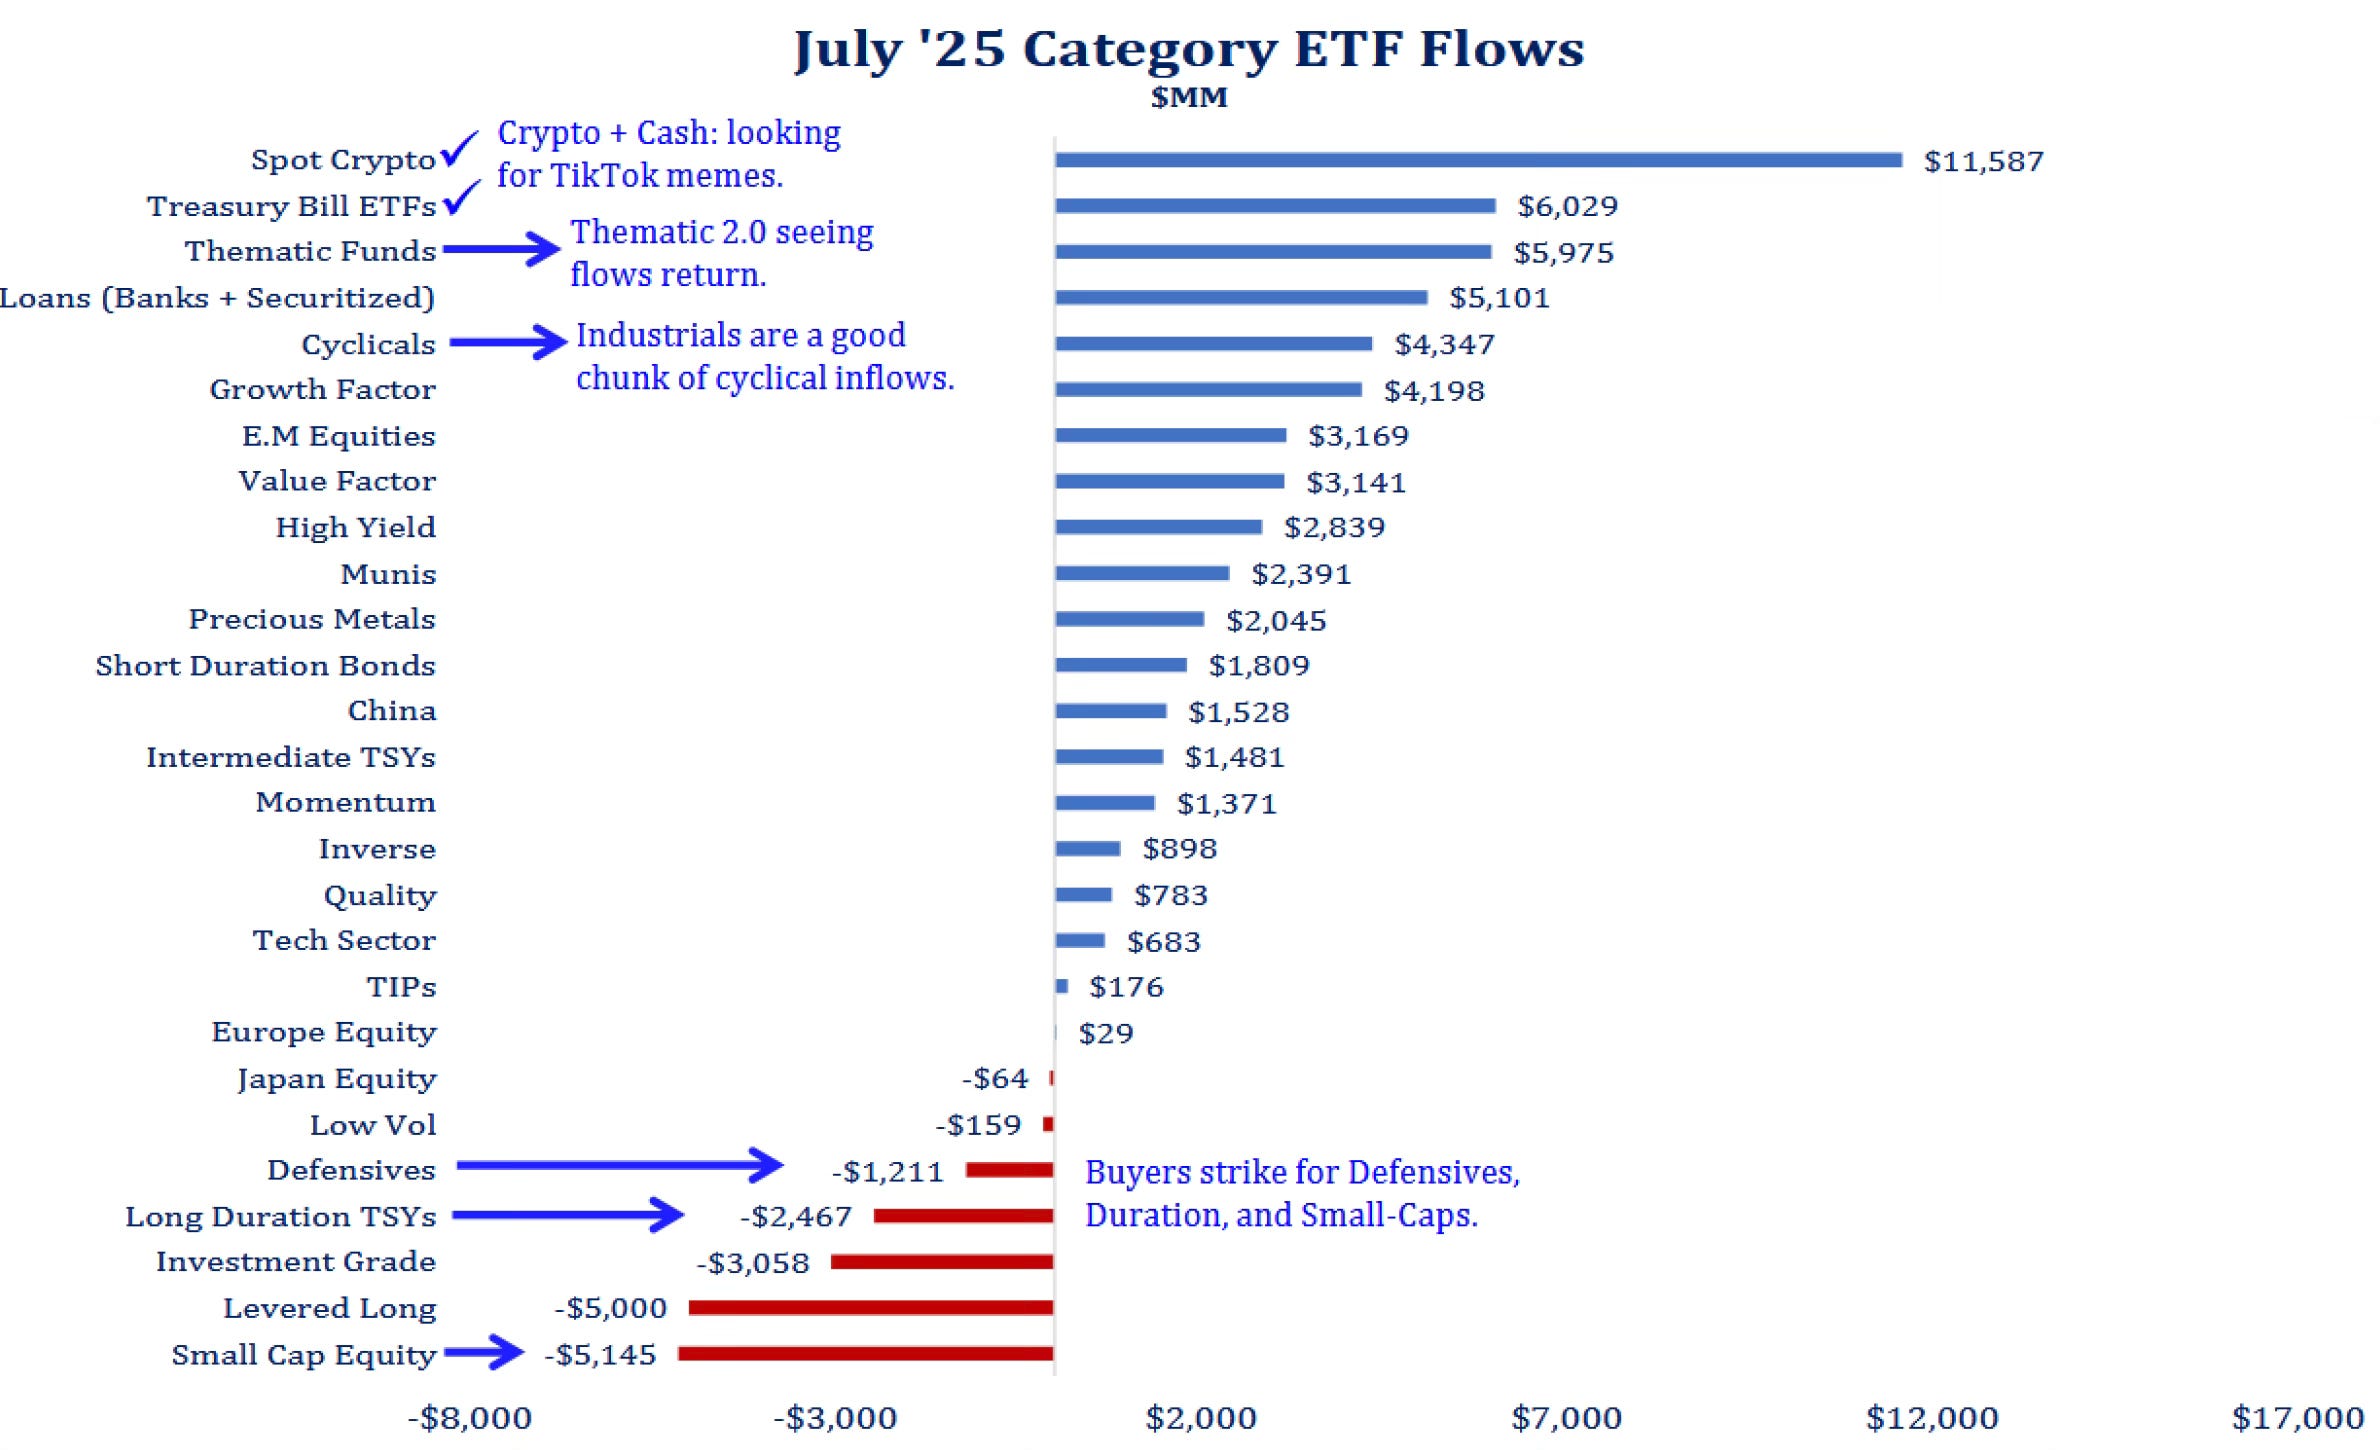
ETF Flows Through July
When we look at the ETF flows through July, we can see crypto has dominated flows. Thematic flows are returning as well. Small-caps just continue to get no love. The question is going to have to start being asked if small-caps are even investable.