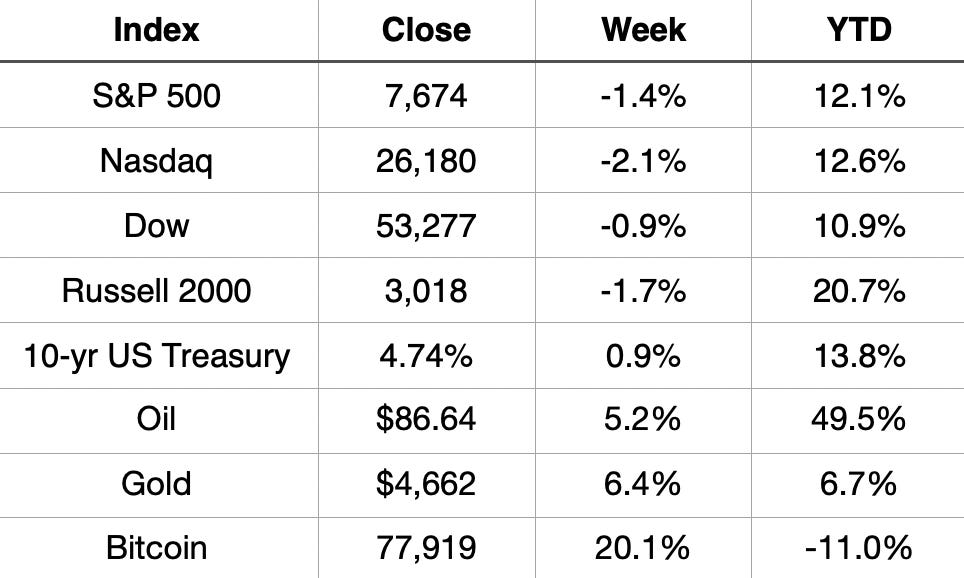
The Dow just had its worst week since March. The S&P 500 and Nasdaq both snapped a three-week winning streak, their first red week in the last four.
Small caps got hit hardest, with the Russell 2000 down 1.7% on the week, though it’s still up over 20% year to date. Bonds moved too, with the 10-year Treasury yield climbing to 4.74%.
Outside of equities, oil jumped 5.2% this week and is now up nearly 50% year to date. Gold notched its third straight week of gains, closing at $4,662. Bitcoin was the standout, up over 20% on the week, though it’s still negative for the year.
Market Recap
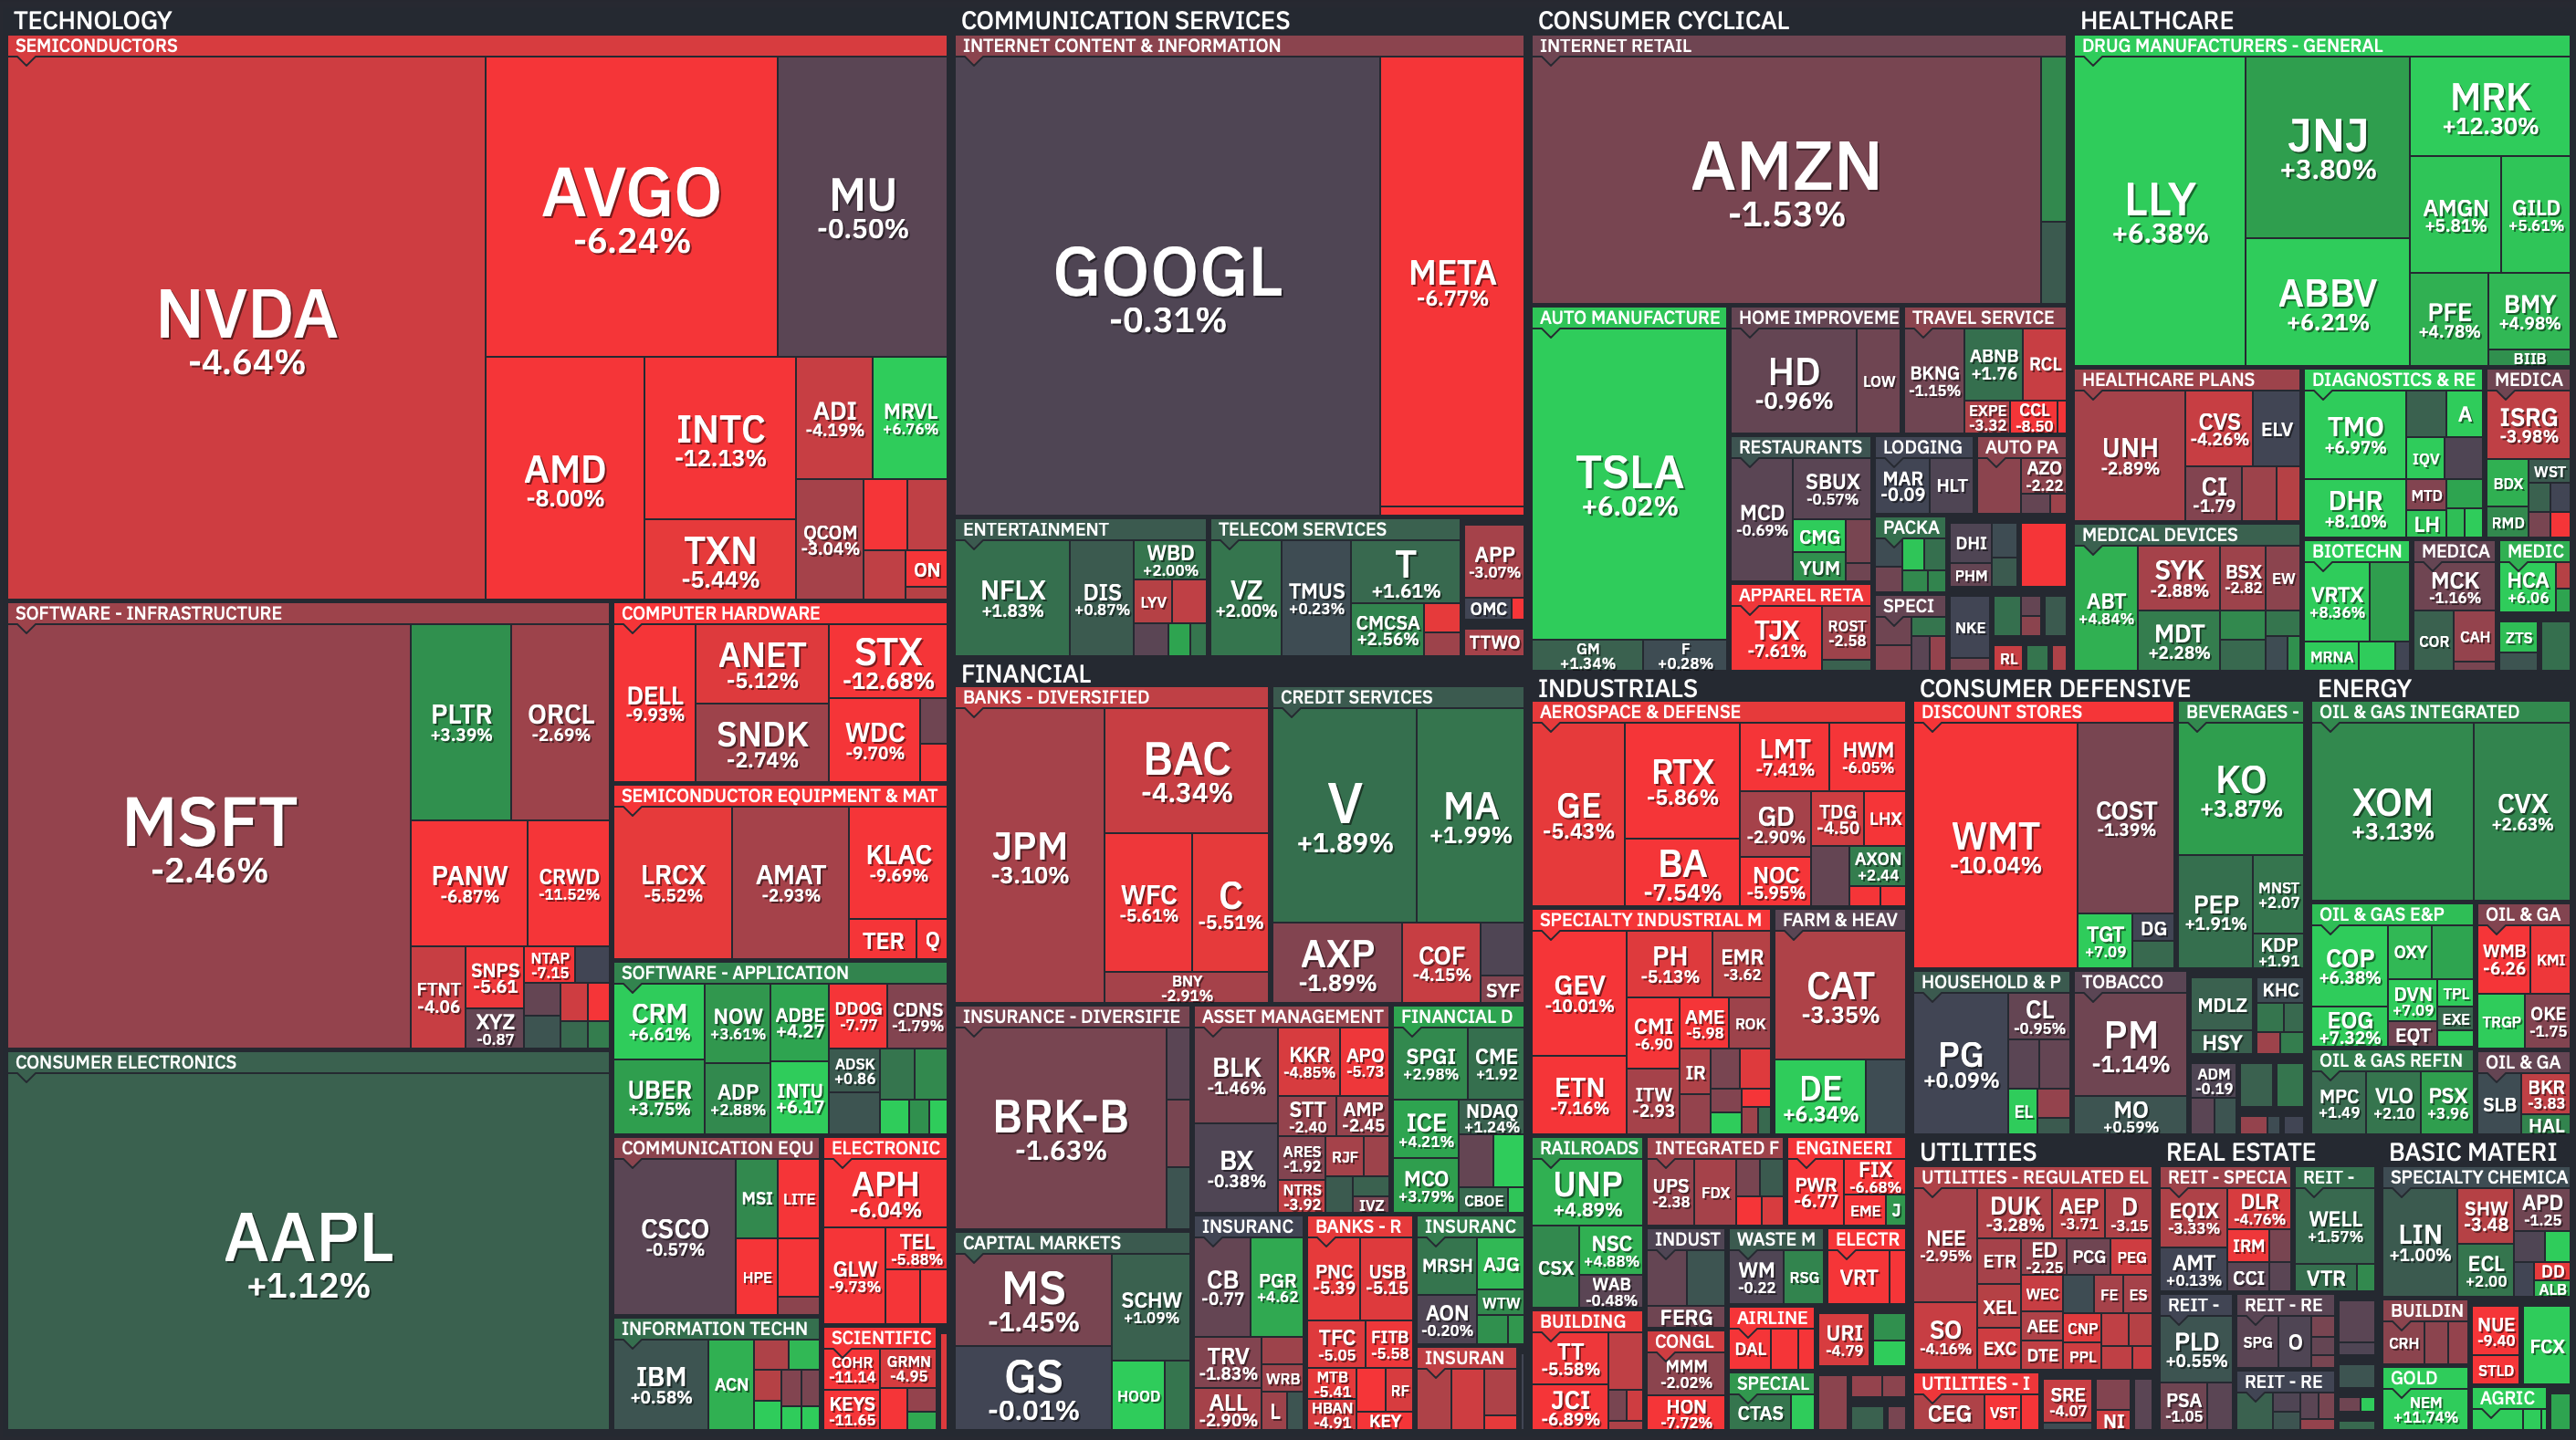
Weekly Heat Map Of Stocks
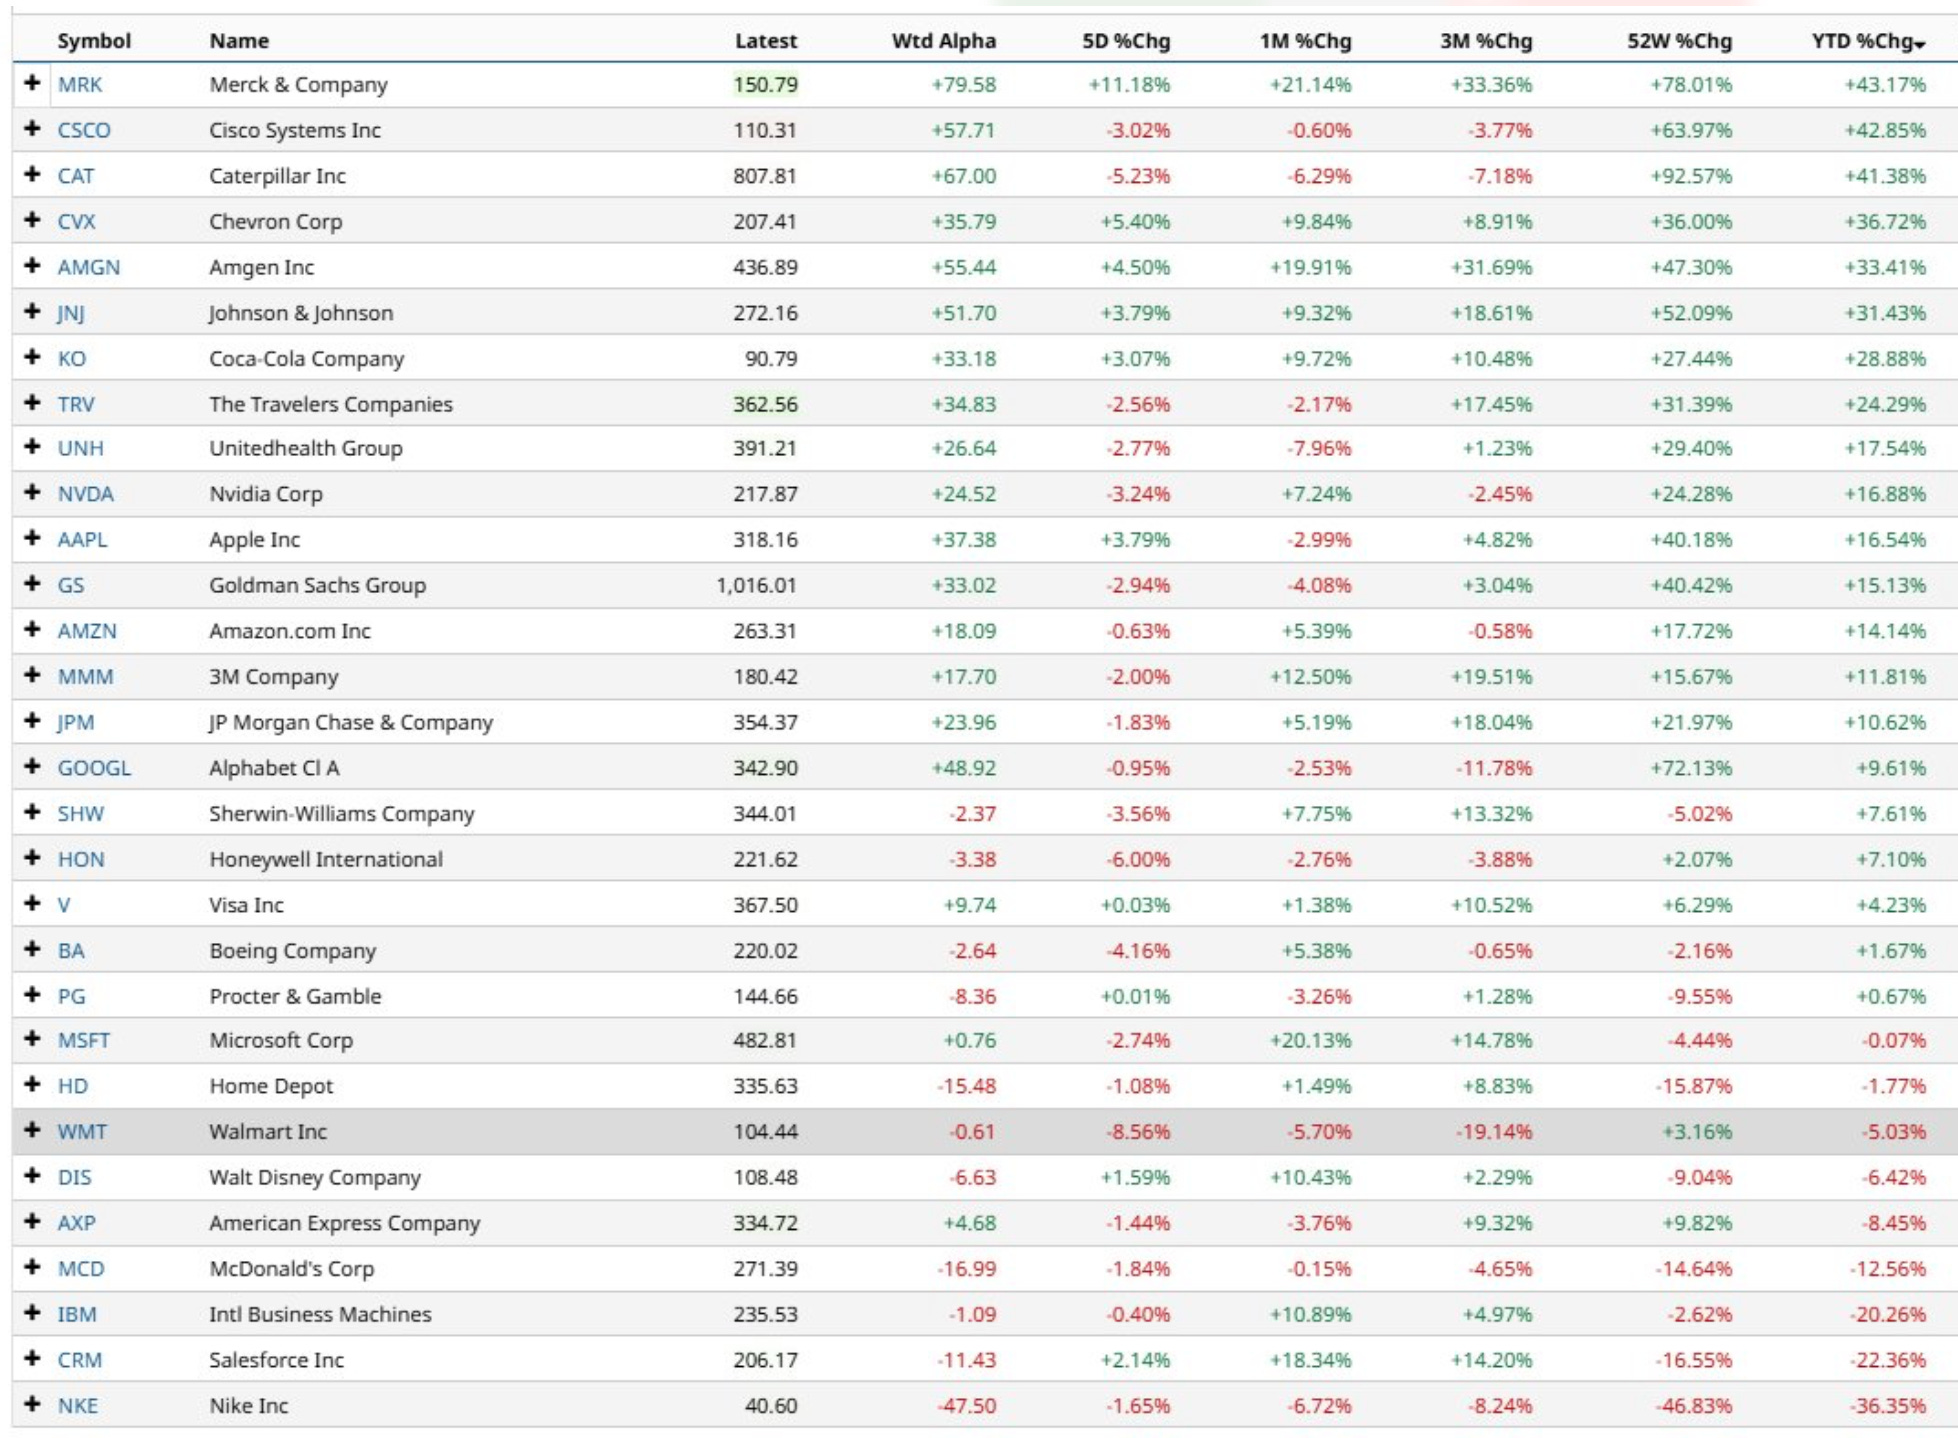
Dow Performance
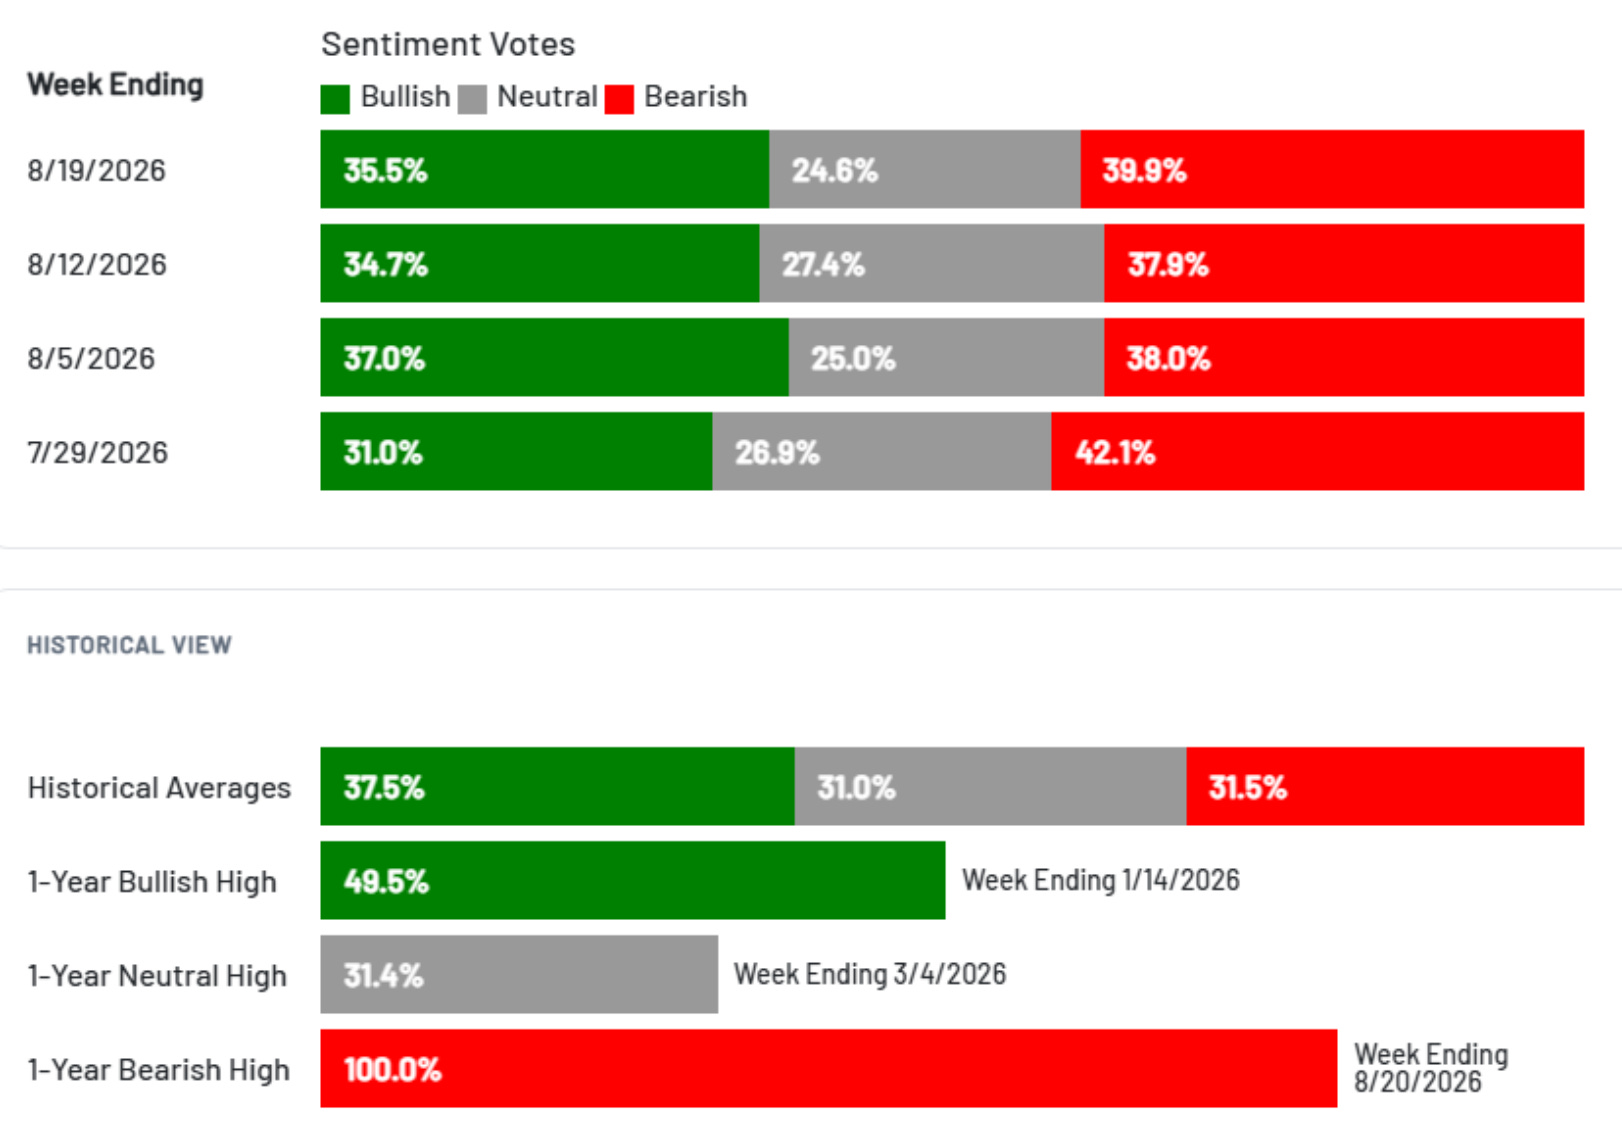
Sentiment Check
This now makes it 5 weeks in a row of more bears than bulls.
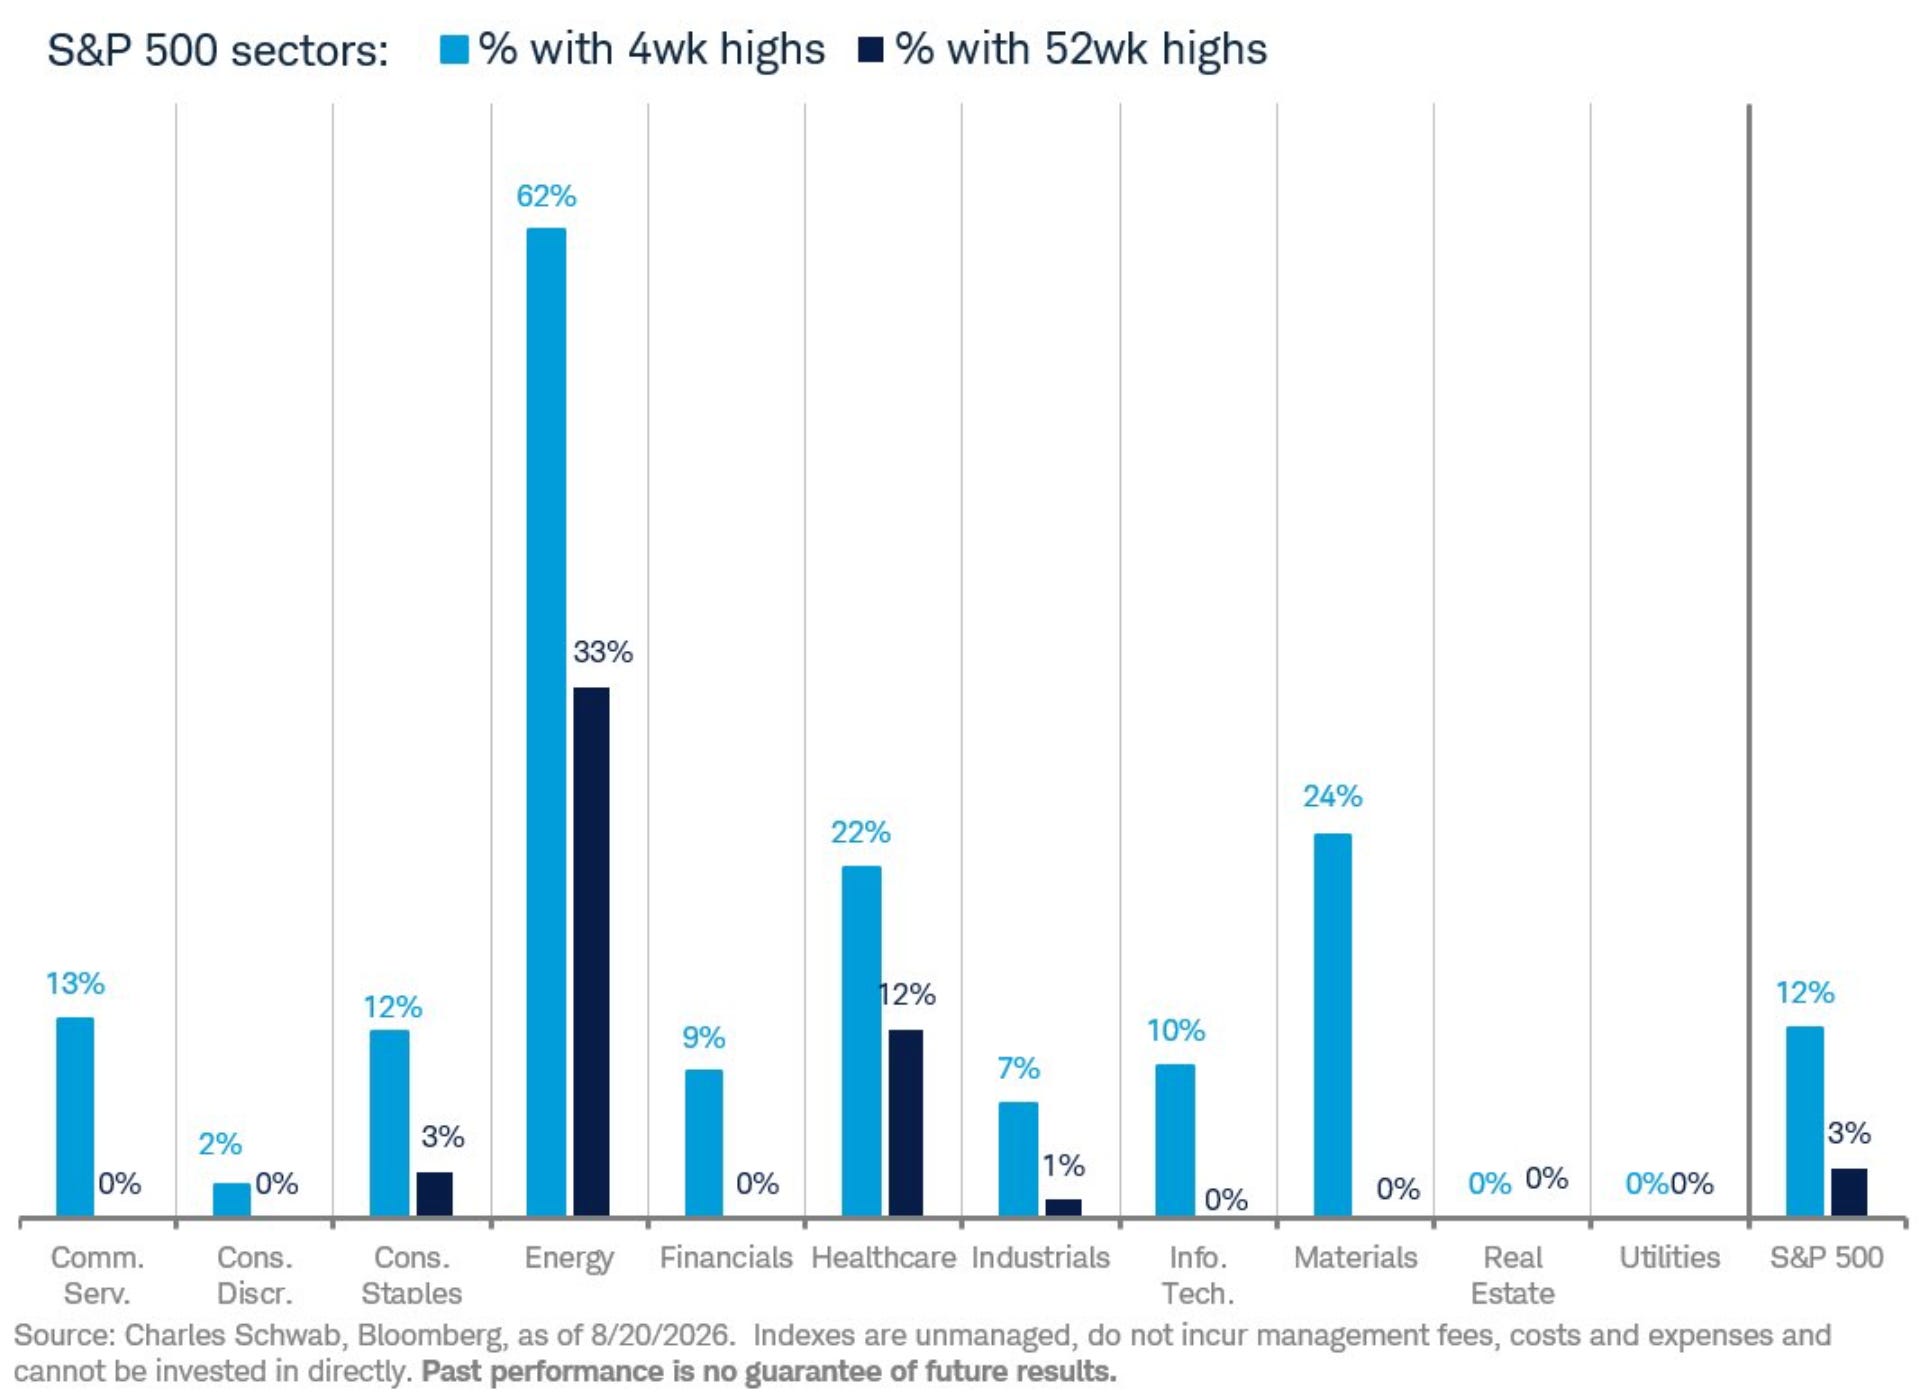
Sector Breadth
% of stocks in each sector at their 4-week and 52-week highs.
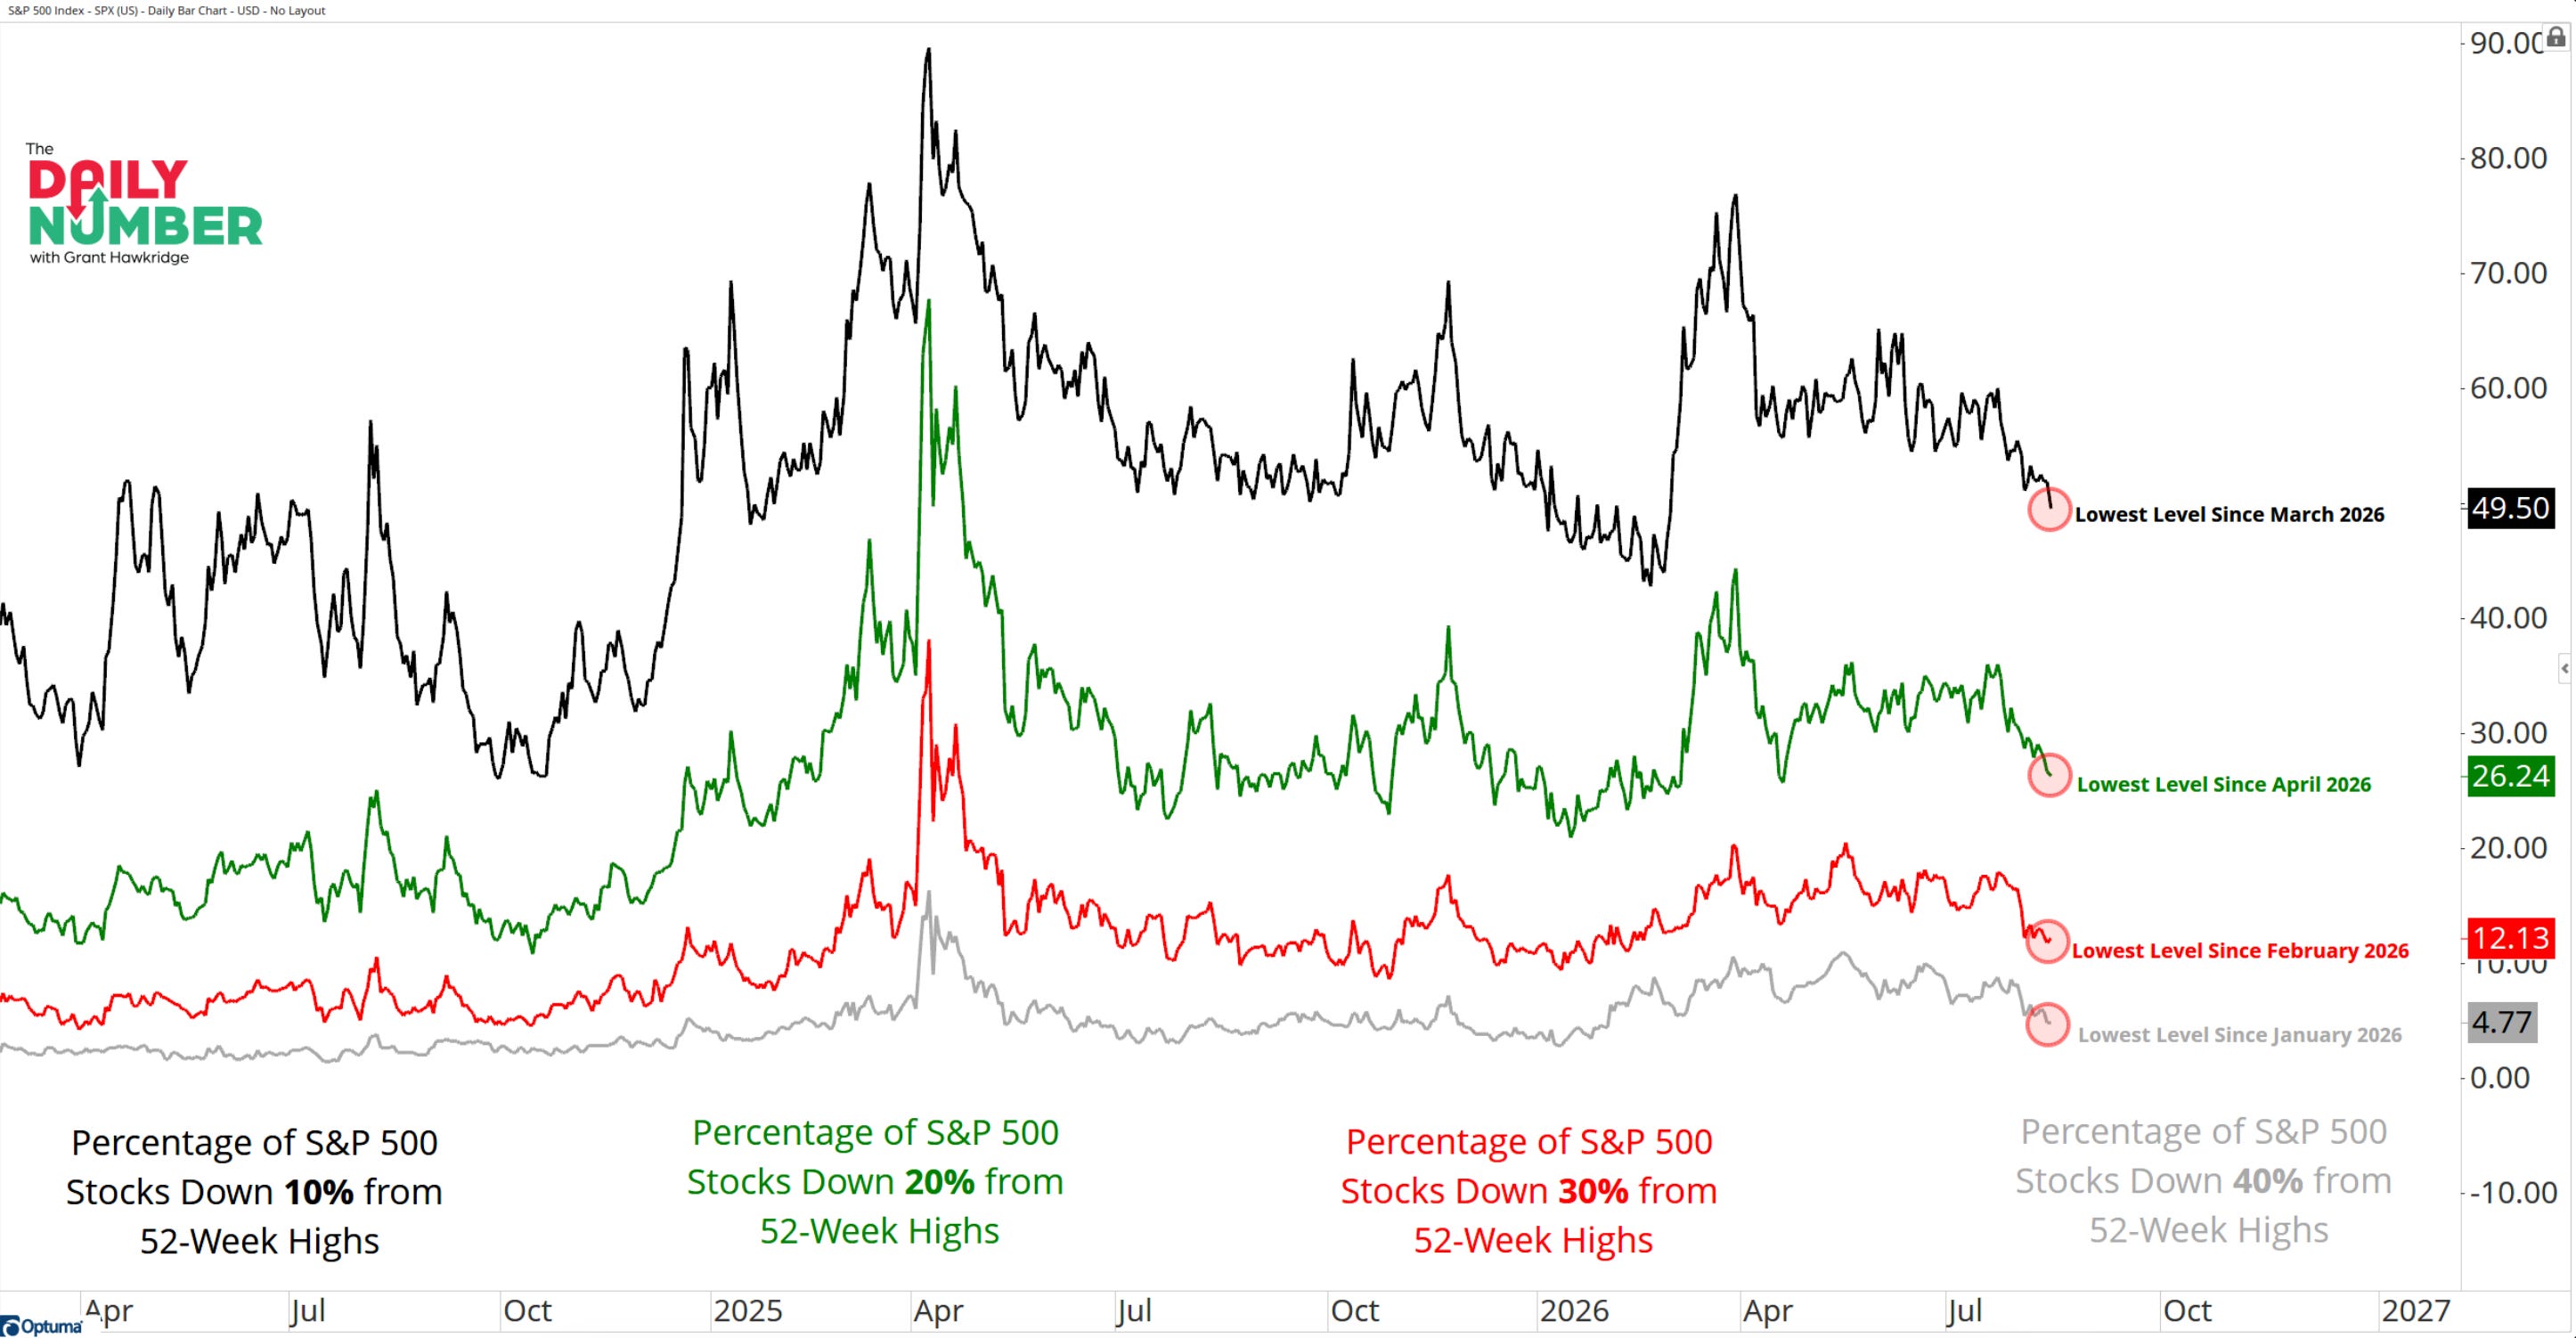
Where The Market Stands
The percentage of S&P 500 stocks trading at least 10% below their 52-week highs has fallen to 49.5%. That’s the lowest reading since March. That’s a healthy signal for a market sitting just 2% off its all-time high.
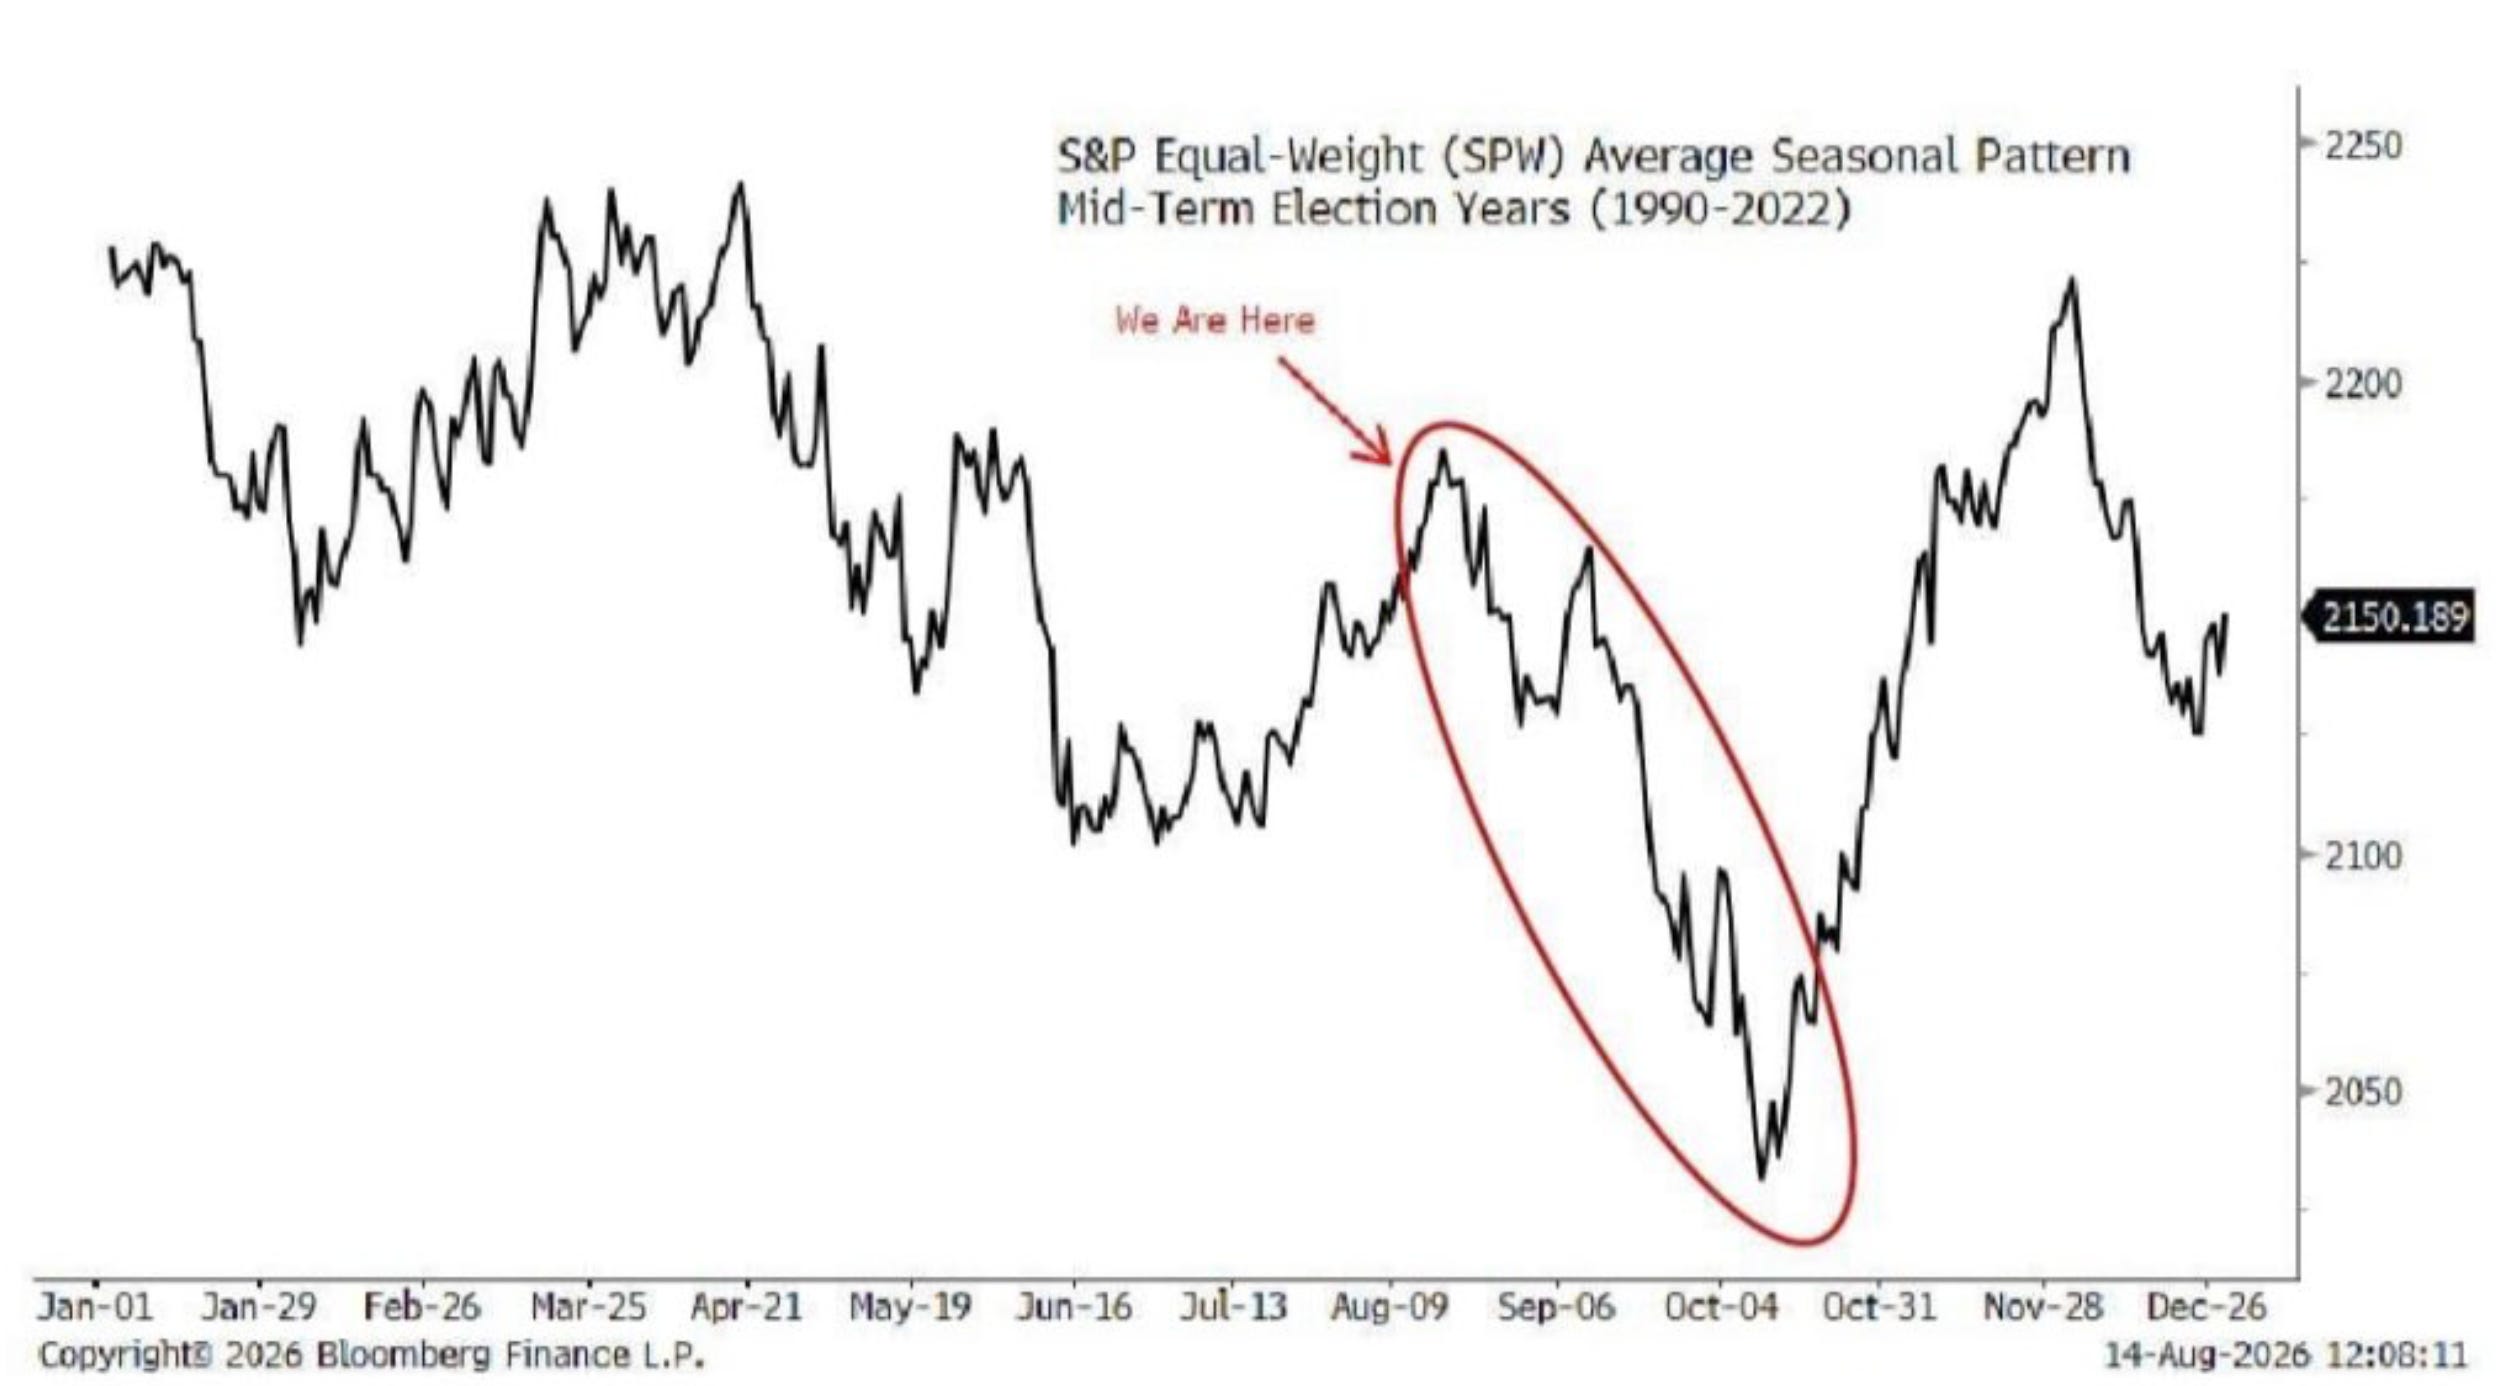
Here's the seasonal wrinkle though. In midterm years going back to 1990, the S&P 500 equal weight has historically peaked around August 18th. That’s followed by a roughly 8% average pullback into October.