
Investing Update: The Most Important Chart in the Market
What I'm buying, selling & watching
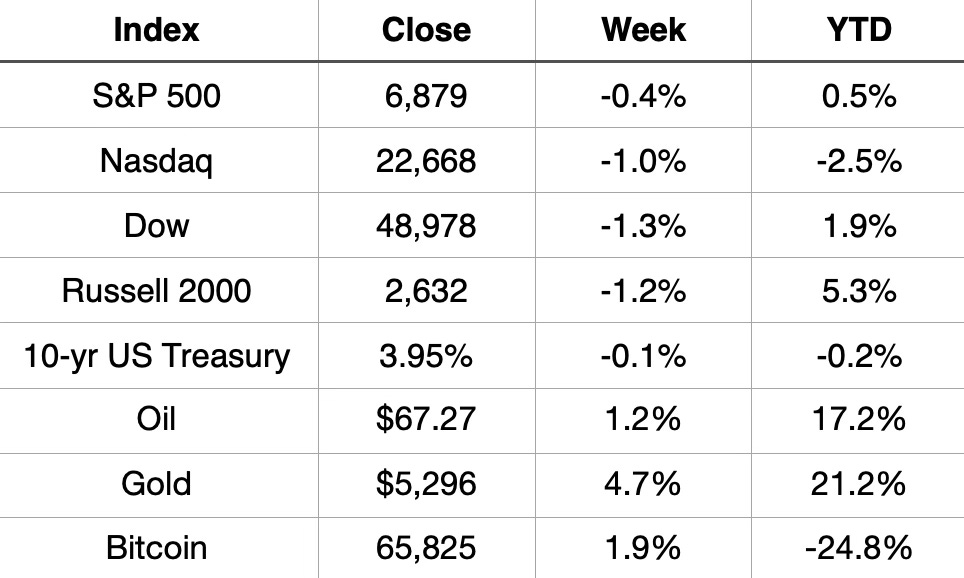
It was a rough week across the board. All four major indexes closed in the red, with the Dow dropping 1.3% and the Nasdaq falling 1.0%, now sitting at -2.5% on the year. The S&P 500 is hanging on to a slim 0.5% gain YTD, but the internals continue to tell a more cautious story.
The real headline? Gold. Up 4.7% this week alone and now +21.2% on the year. When gold is outperforming everything in sight, the market is telling you something about where investor confidence stands right now.
Oil quietly continues its run up 17.2% YTD, while the 10-year Treasury yield ticked down to 3.95%, a nod to the short rates are coming down environment we’ve been talking about.
Bitcoin had a decent week, up 1.9%, but remains one of the worst performing assets of 2026, down nearly 25% on the year.
The rotation continues to speak volumes. Safety assets like gold and bonds are winning. Growth and tech are struggling. The market is voting with its feet and right now, it’s voting defensive.
Market Recap
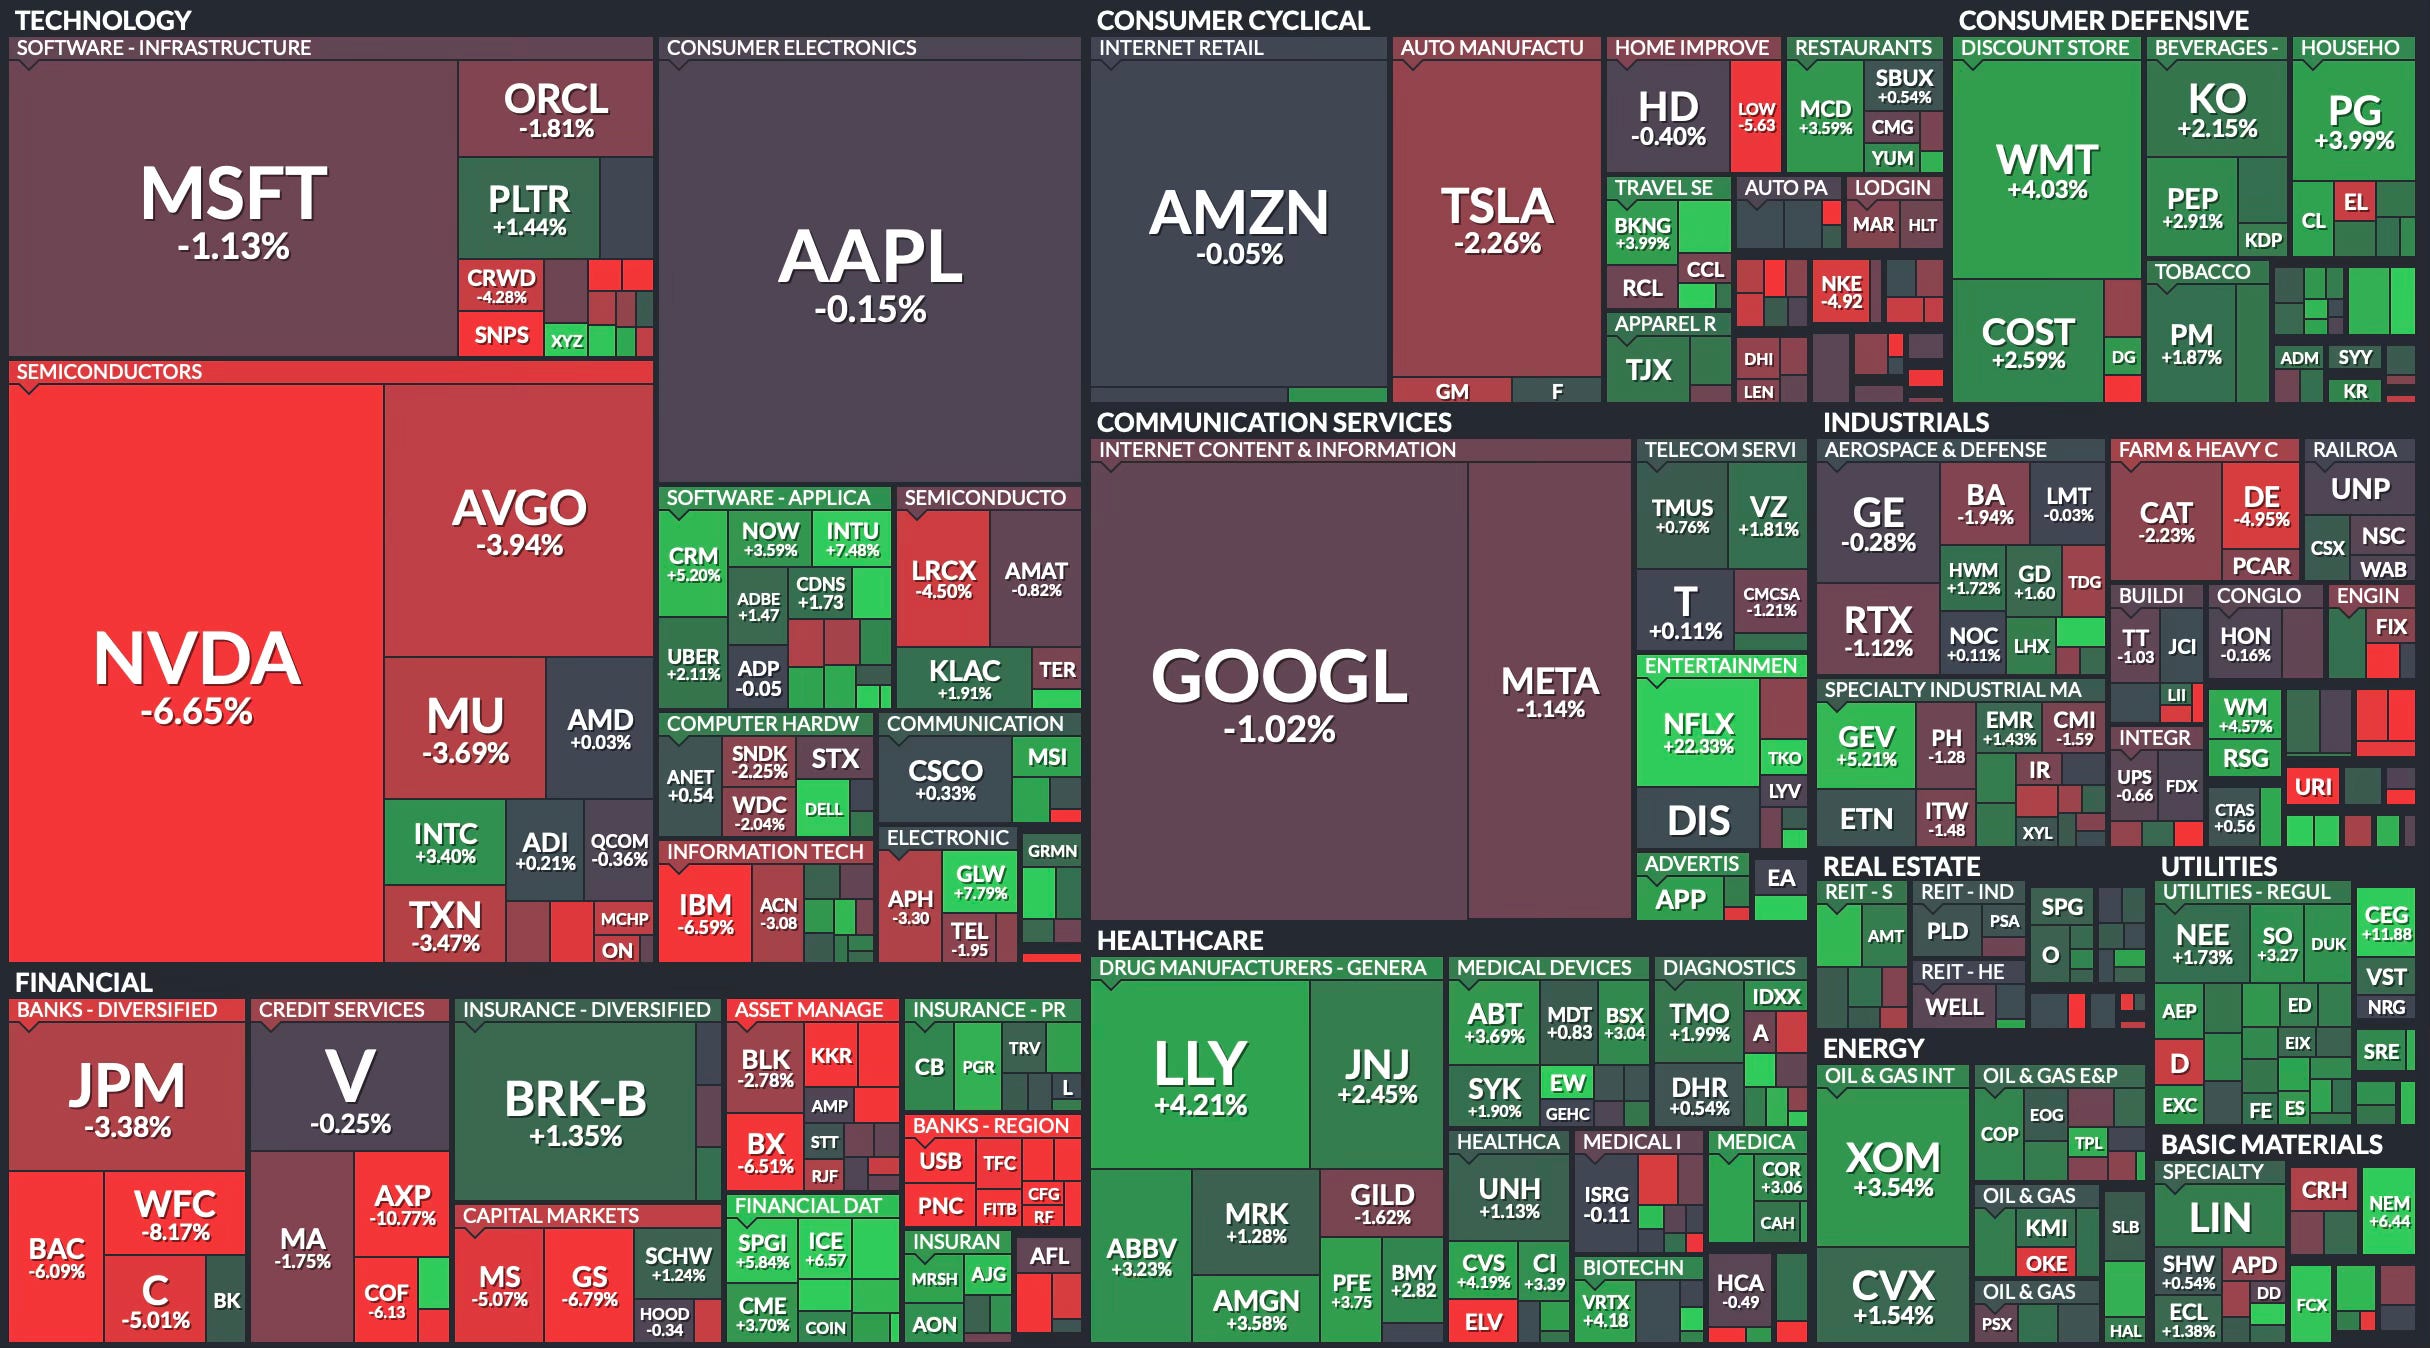
Weekly Heat Map Of Stocks
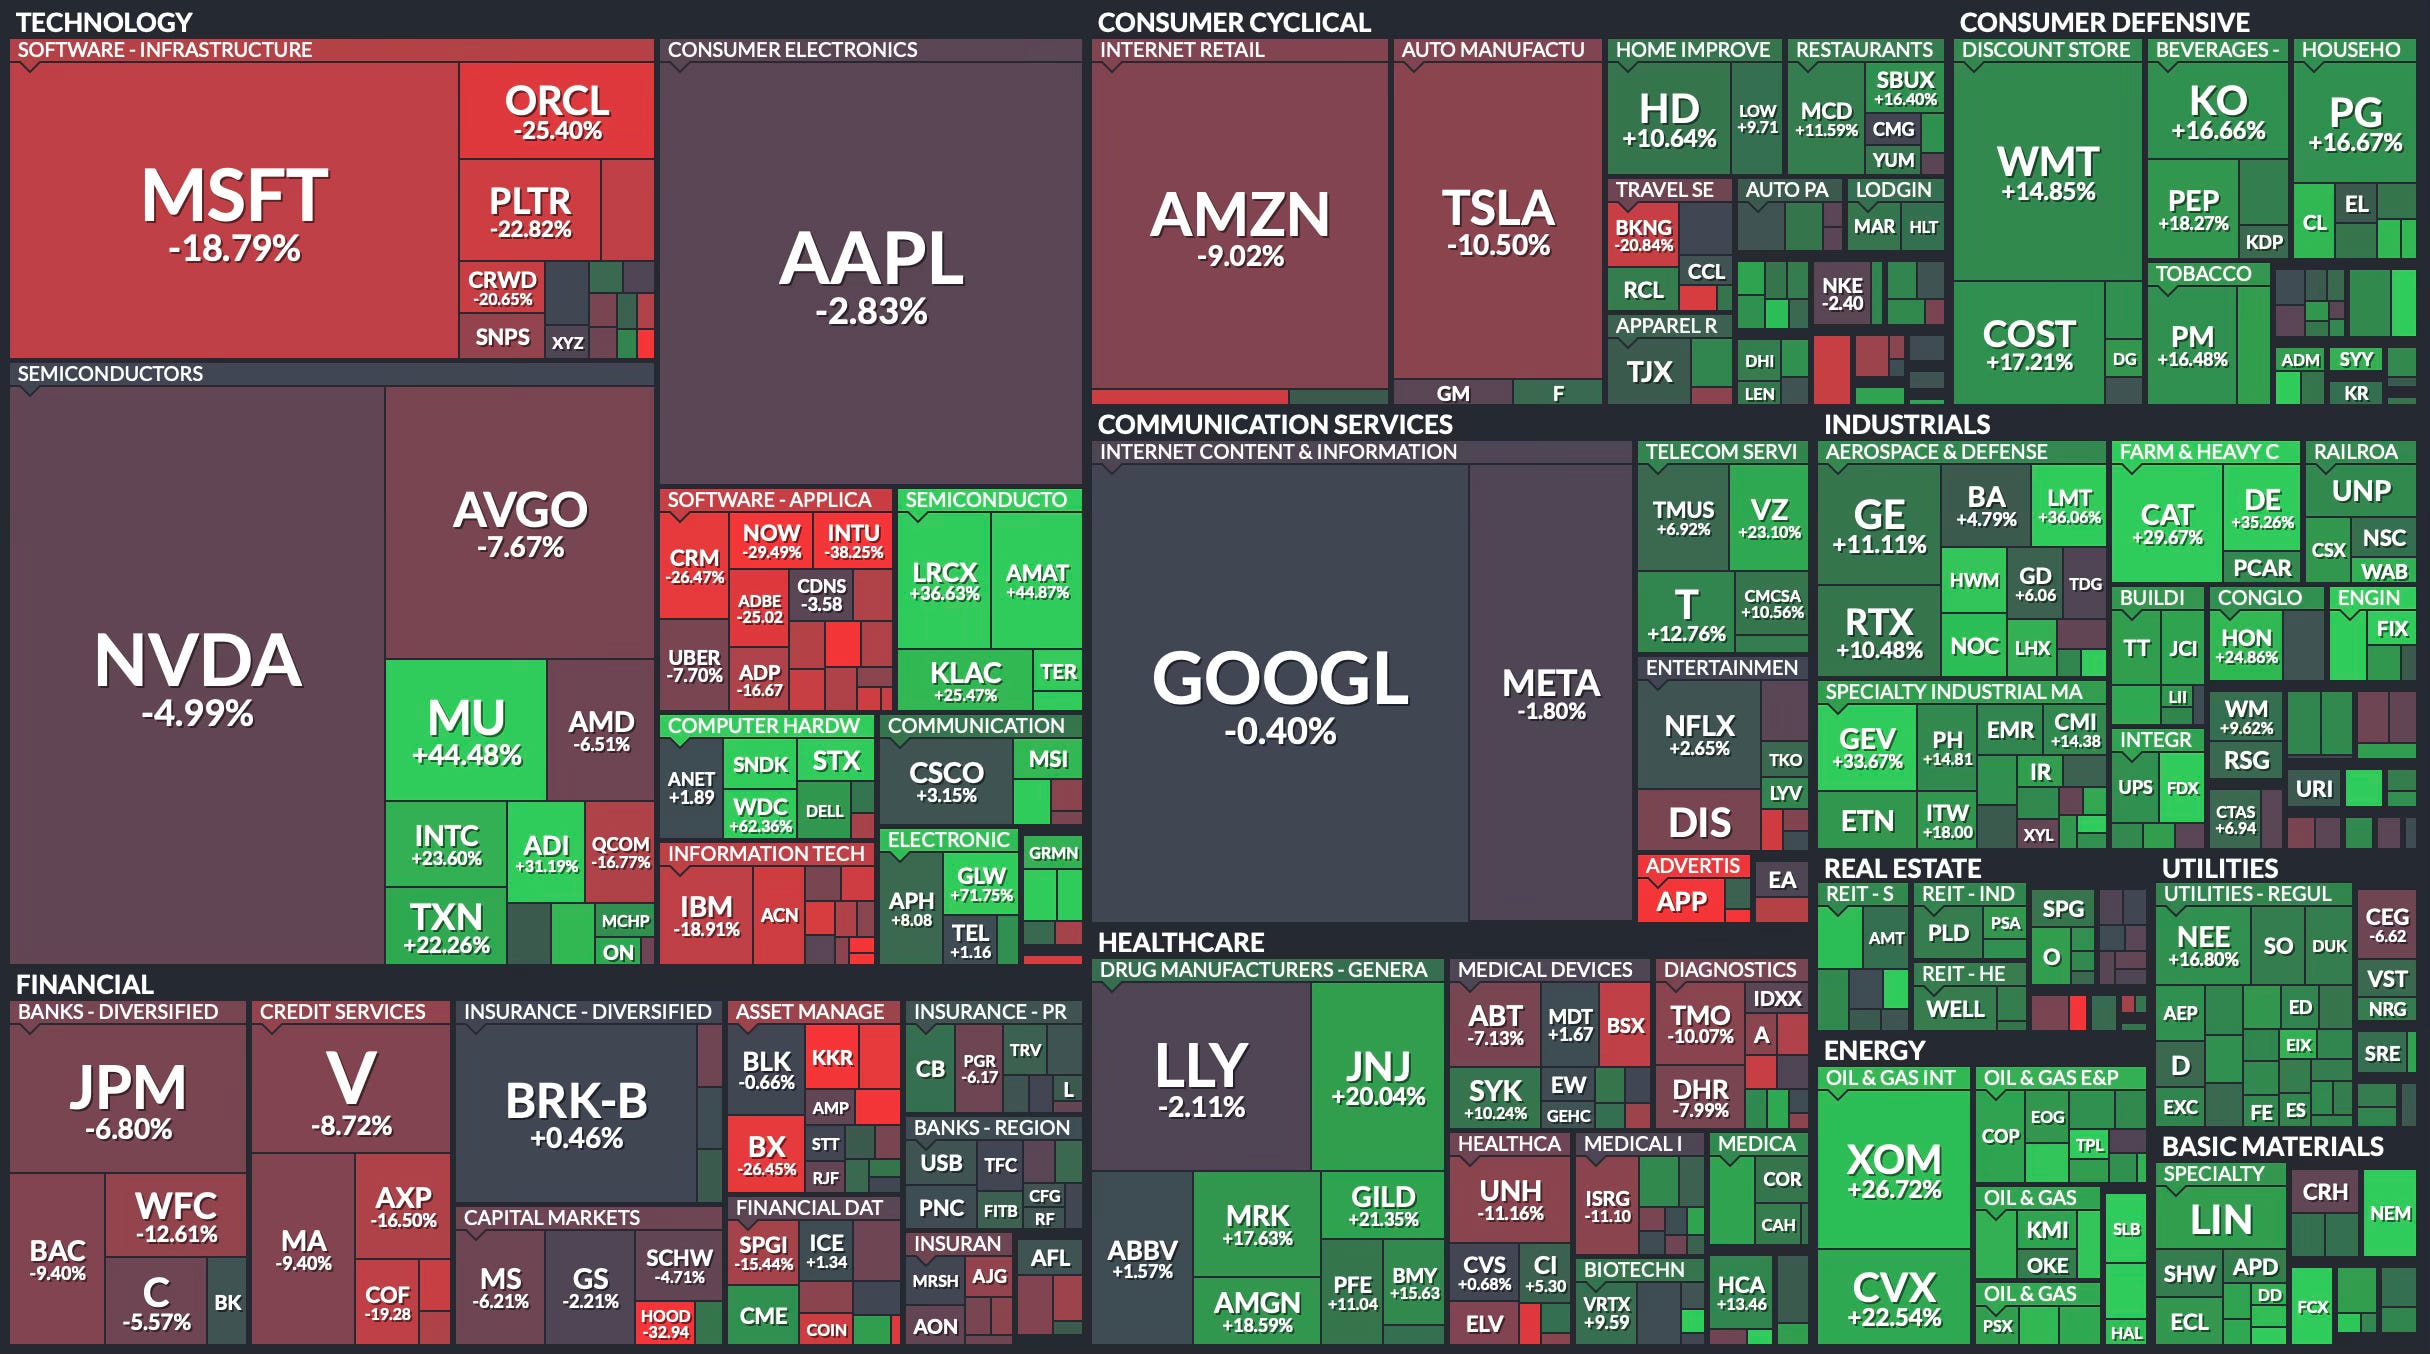
YTD Heat Map Of Stocks
S&P 500 Sectors In 2026
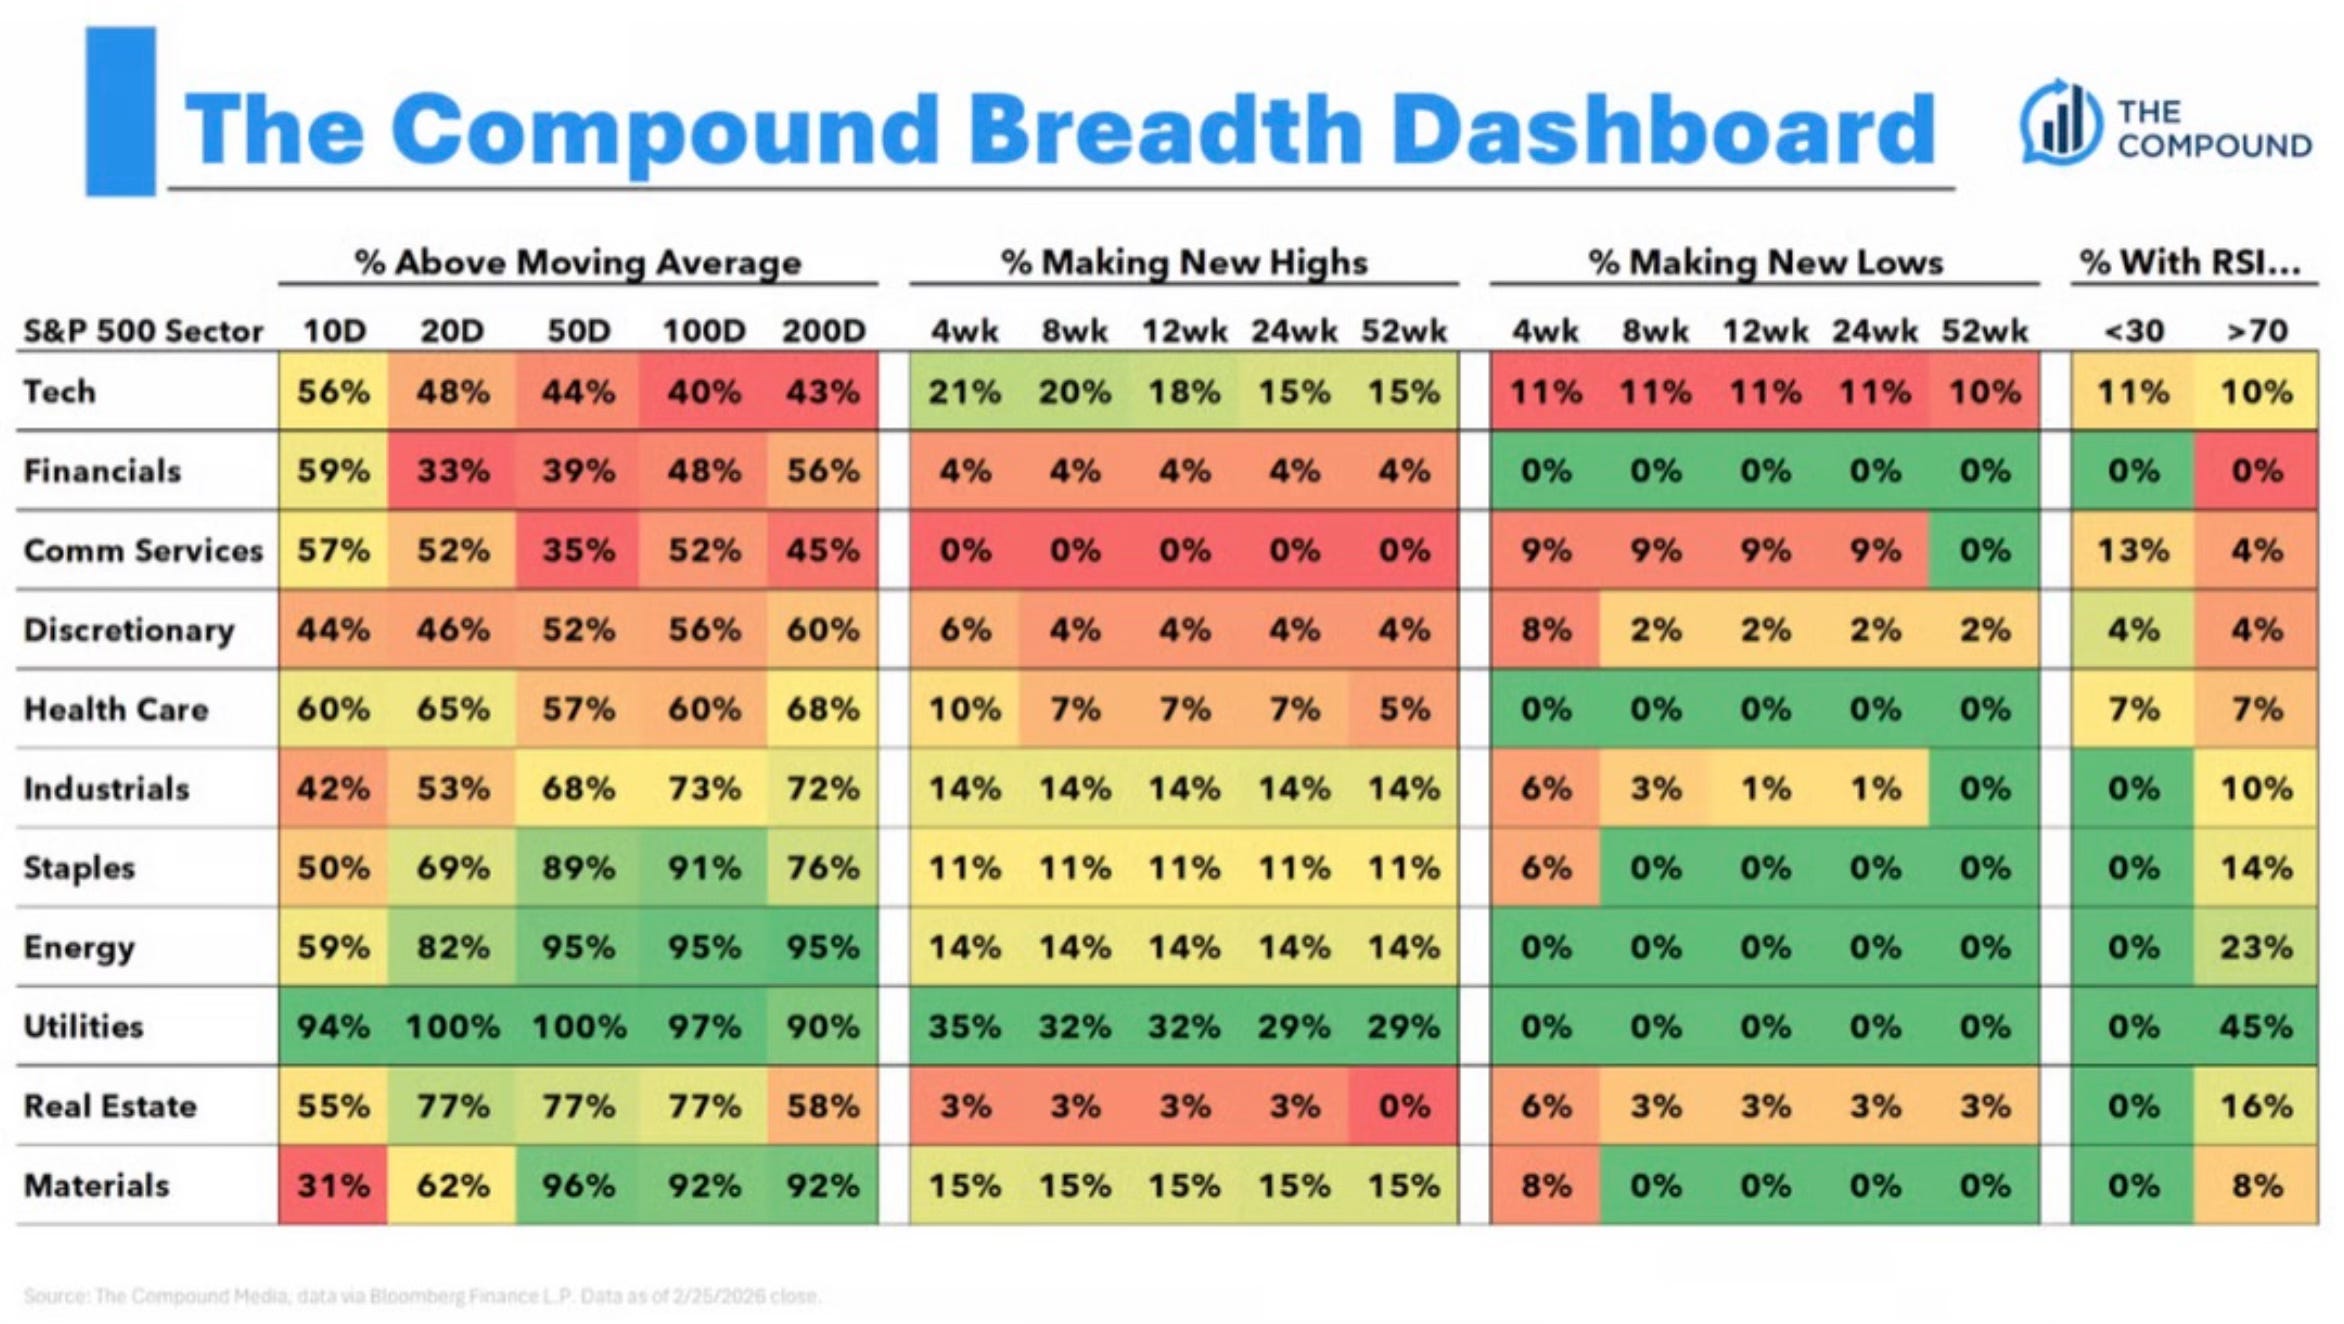
The S&P 500 may be sitting near all-time highs, but look beneath the surface and the picture gets a lot less comfortable. Energy, Materials, and Consumer Staples are leading the market in 2026, the classic defensive rotation. Meanwhile, Technology, Financials, and Consumer Discretionary are all negative on the year.
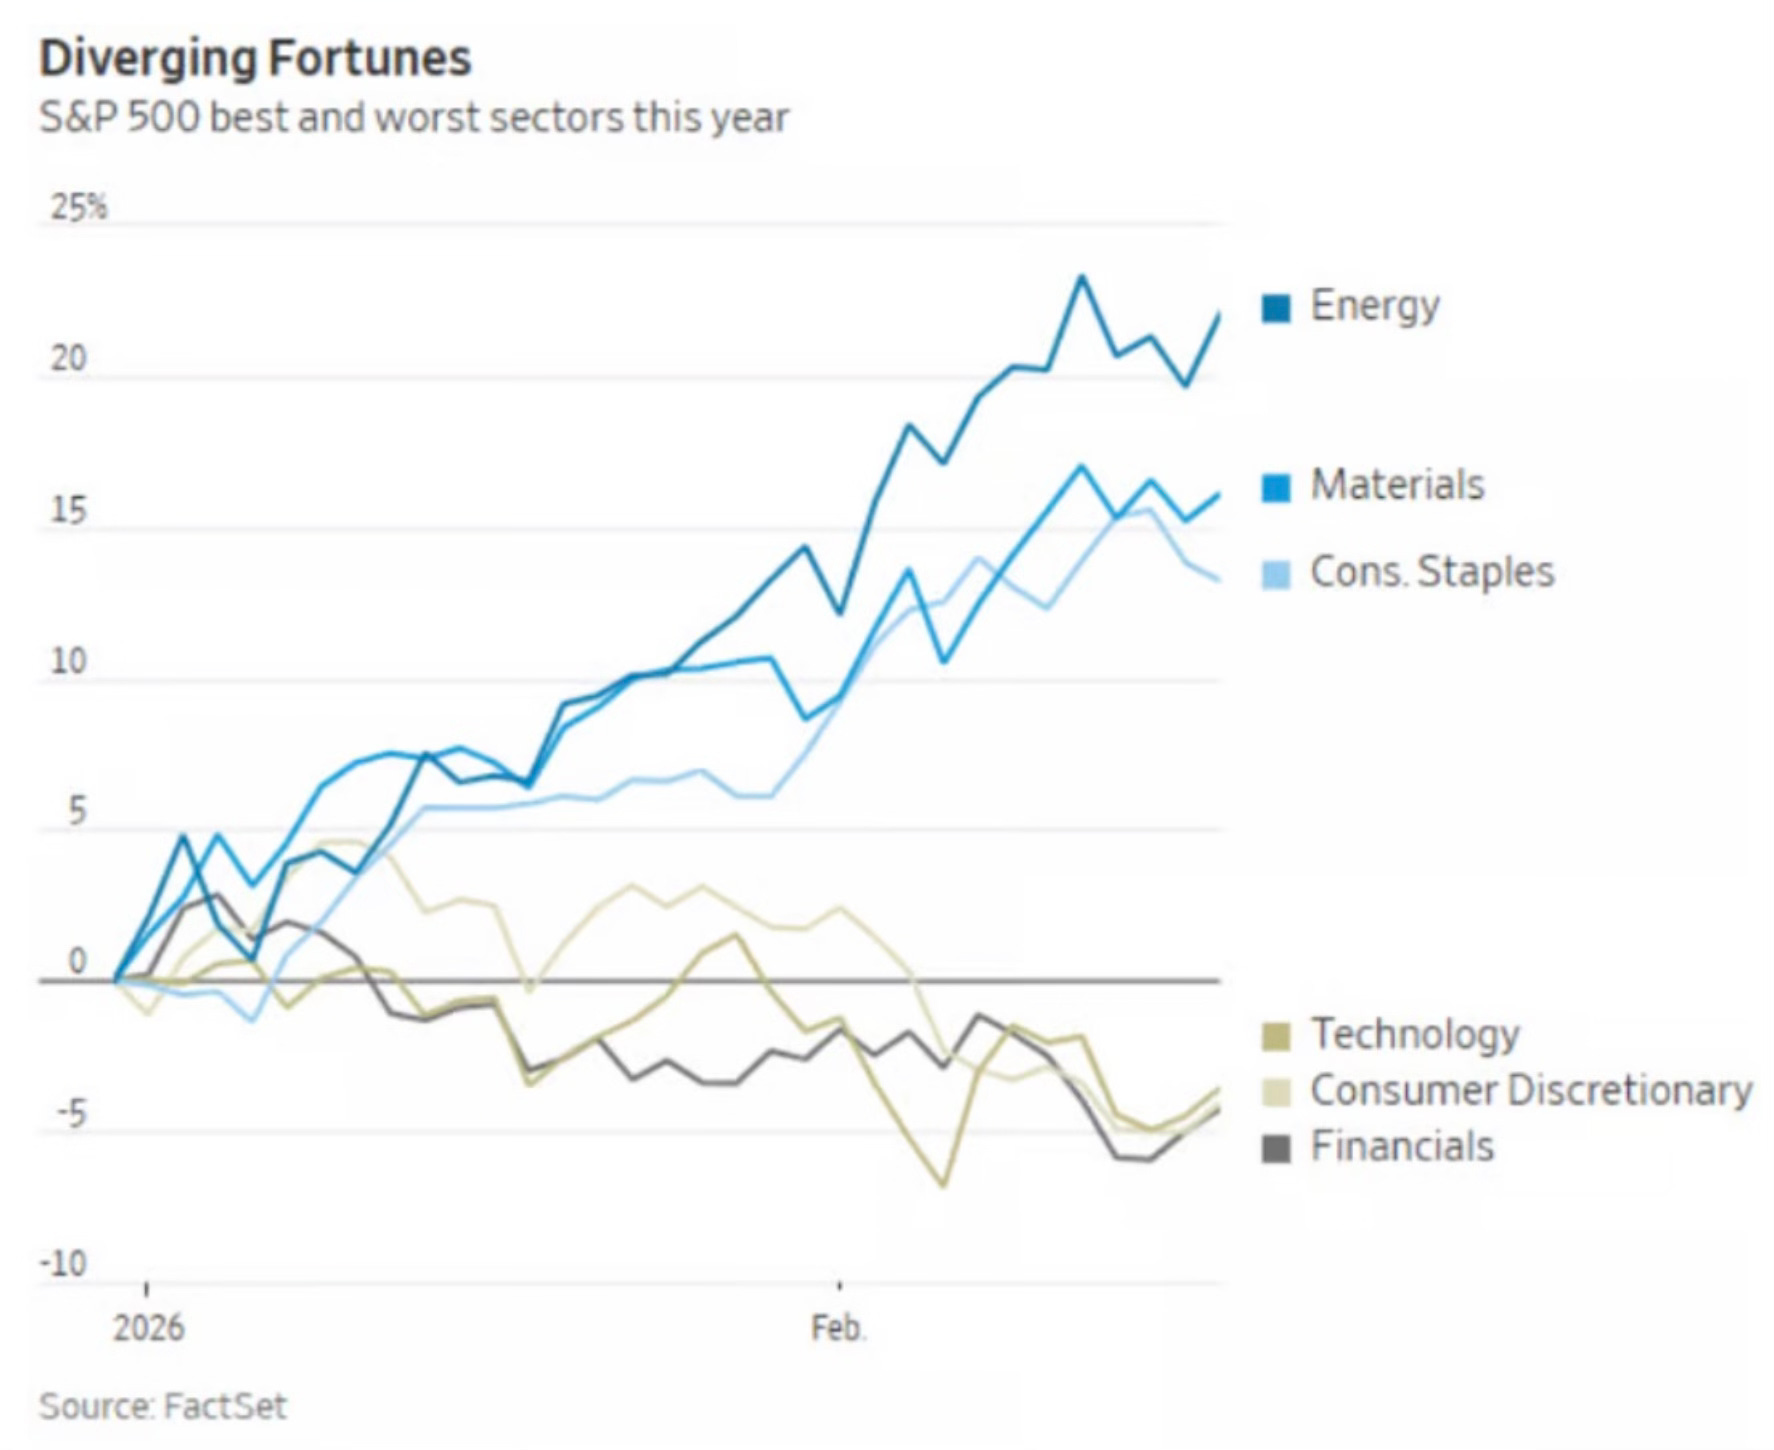
The Breadth Dashboard makes it even clearer. In Technology, Financials, and Consumer Discretionary, fewer than 60% of stocks are trading above their 50-day moving average. That's a notable disconnect when the index itself is near record levels.
In today’s Investing Update:
The Most Important Chart in the Market
Risk-Off Signals Are Flashing
The Mag 7 Valuation Flip Nobody Expected
The VIX Signal That Has a Perfect Track Record
My Thoughts on Nvidia
Moves I’ve Made
Let’s get into it.