
Investing Update: The June Swoon?
What I'm buying, selling & watching
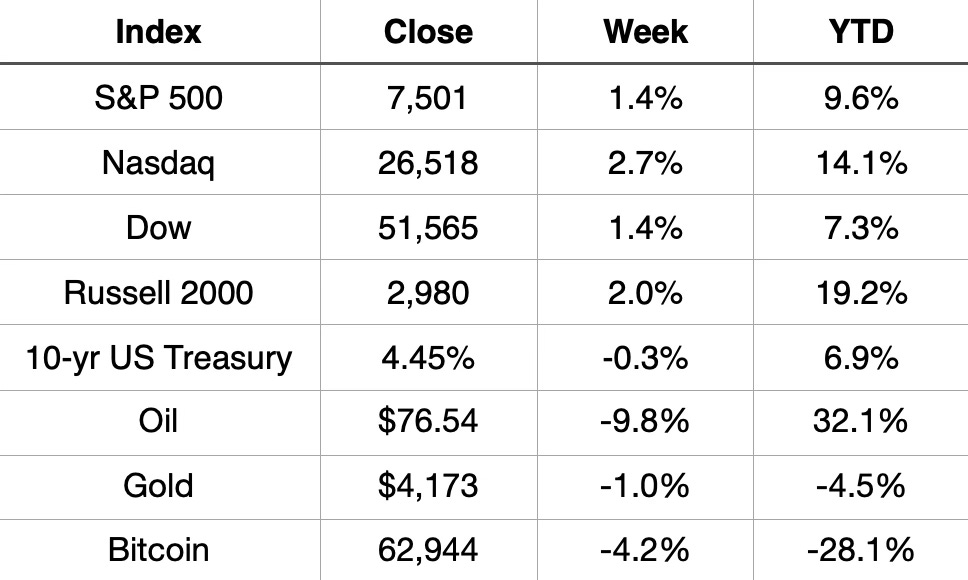
It was a shortened trading week, and stocks still found a way to put up a strong showing.
The Nasdaq led the way, up 2.7% on the week, with the Russell 2000 not far behind at 2.0%. The S&P 500 and Dow both gained 1.4%, keeping the broader market’s year to date gains intact at 9.6% and 7.3% respectively.
Oil was the standout move of the week, falling 9.8% even as the index remains up over 32% on the year. The 10 year held relatively steady, down slightly to 4.45%.
Bitcoin continues to struggle, down another 4.2% on the week and now off 28.1% year to date, still tracking as the cleanest read on risk appetite we have. Gold was modestly lower as well, down 1.0% on the week and negative for the year, an odd look for a traditional safe haven given everything else going on in the macro backdrop right now.
Market Recap
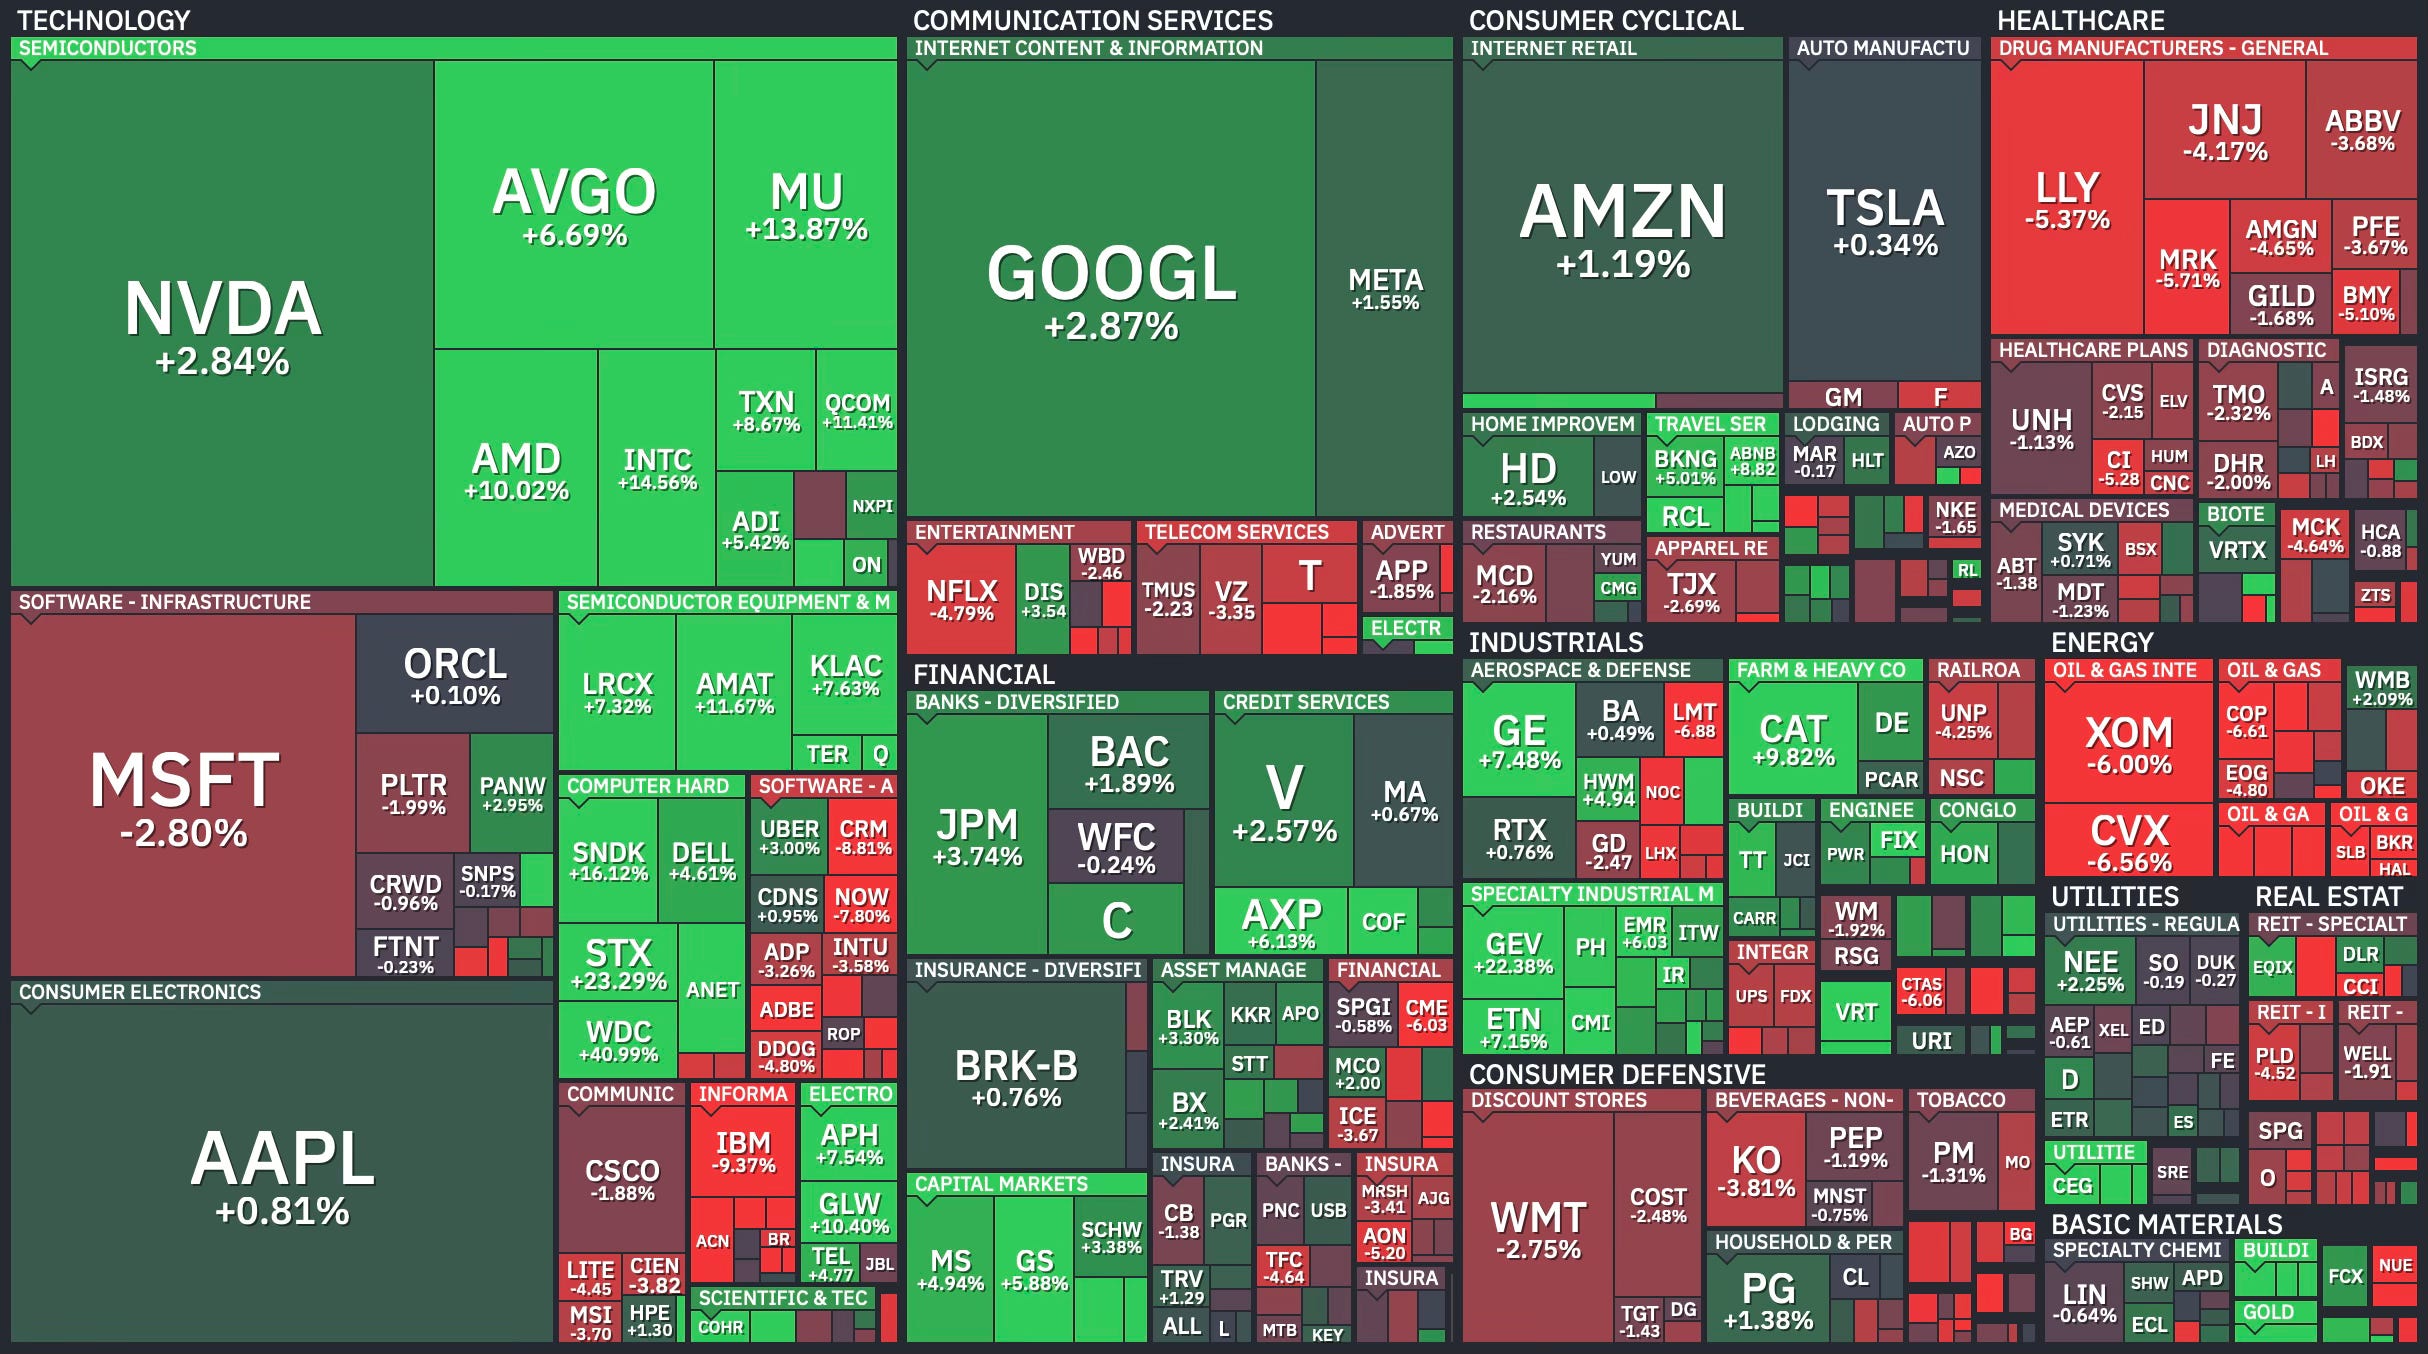
Weekly Heat Map Of Stocks
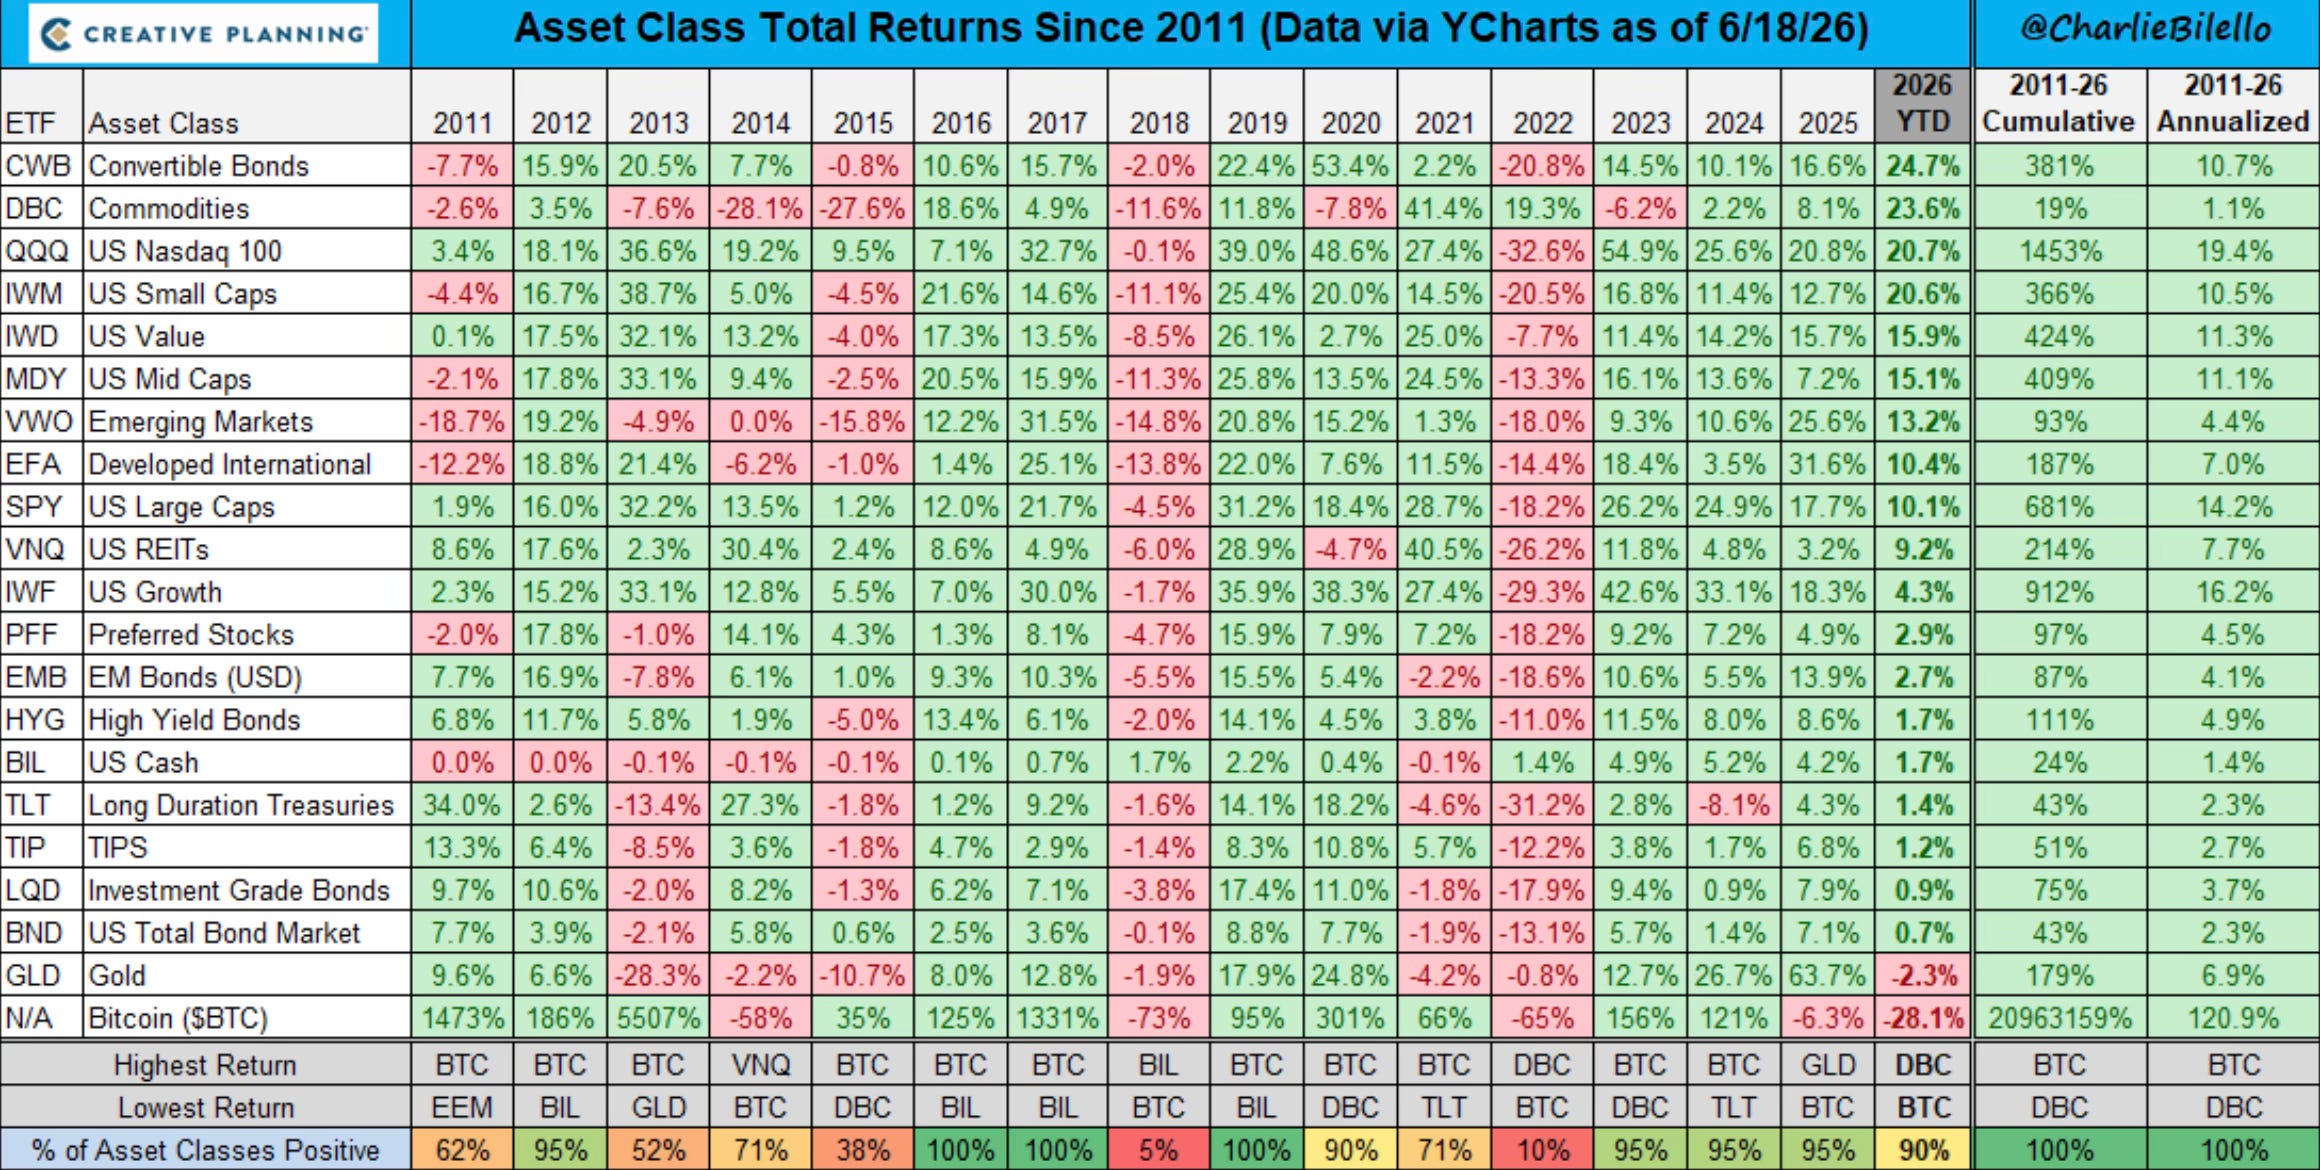
Asset Class Returns
Strength Begets Strength
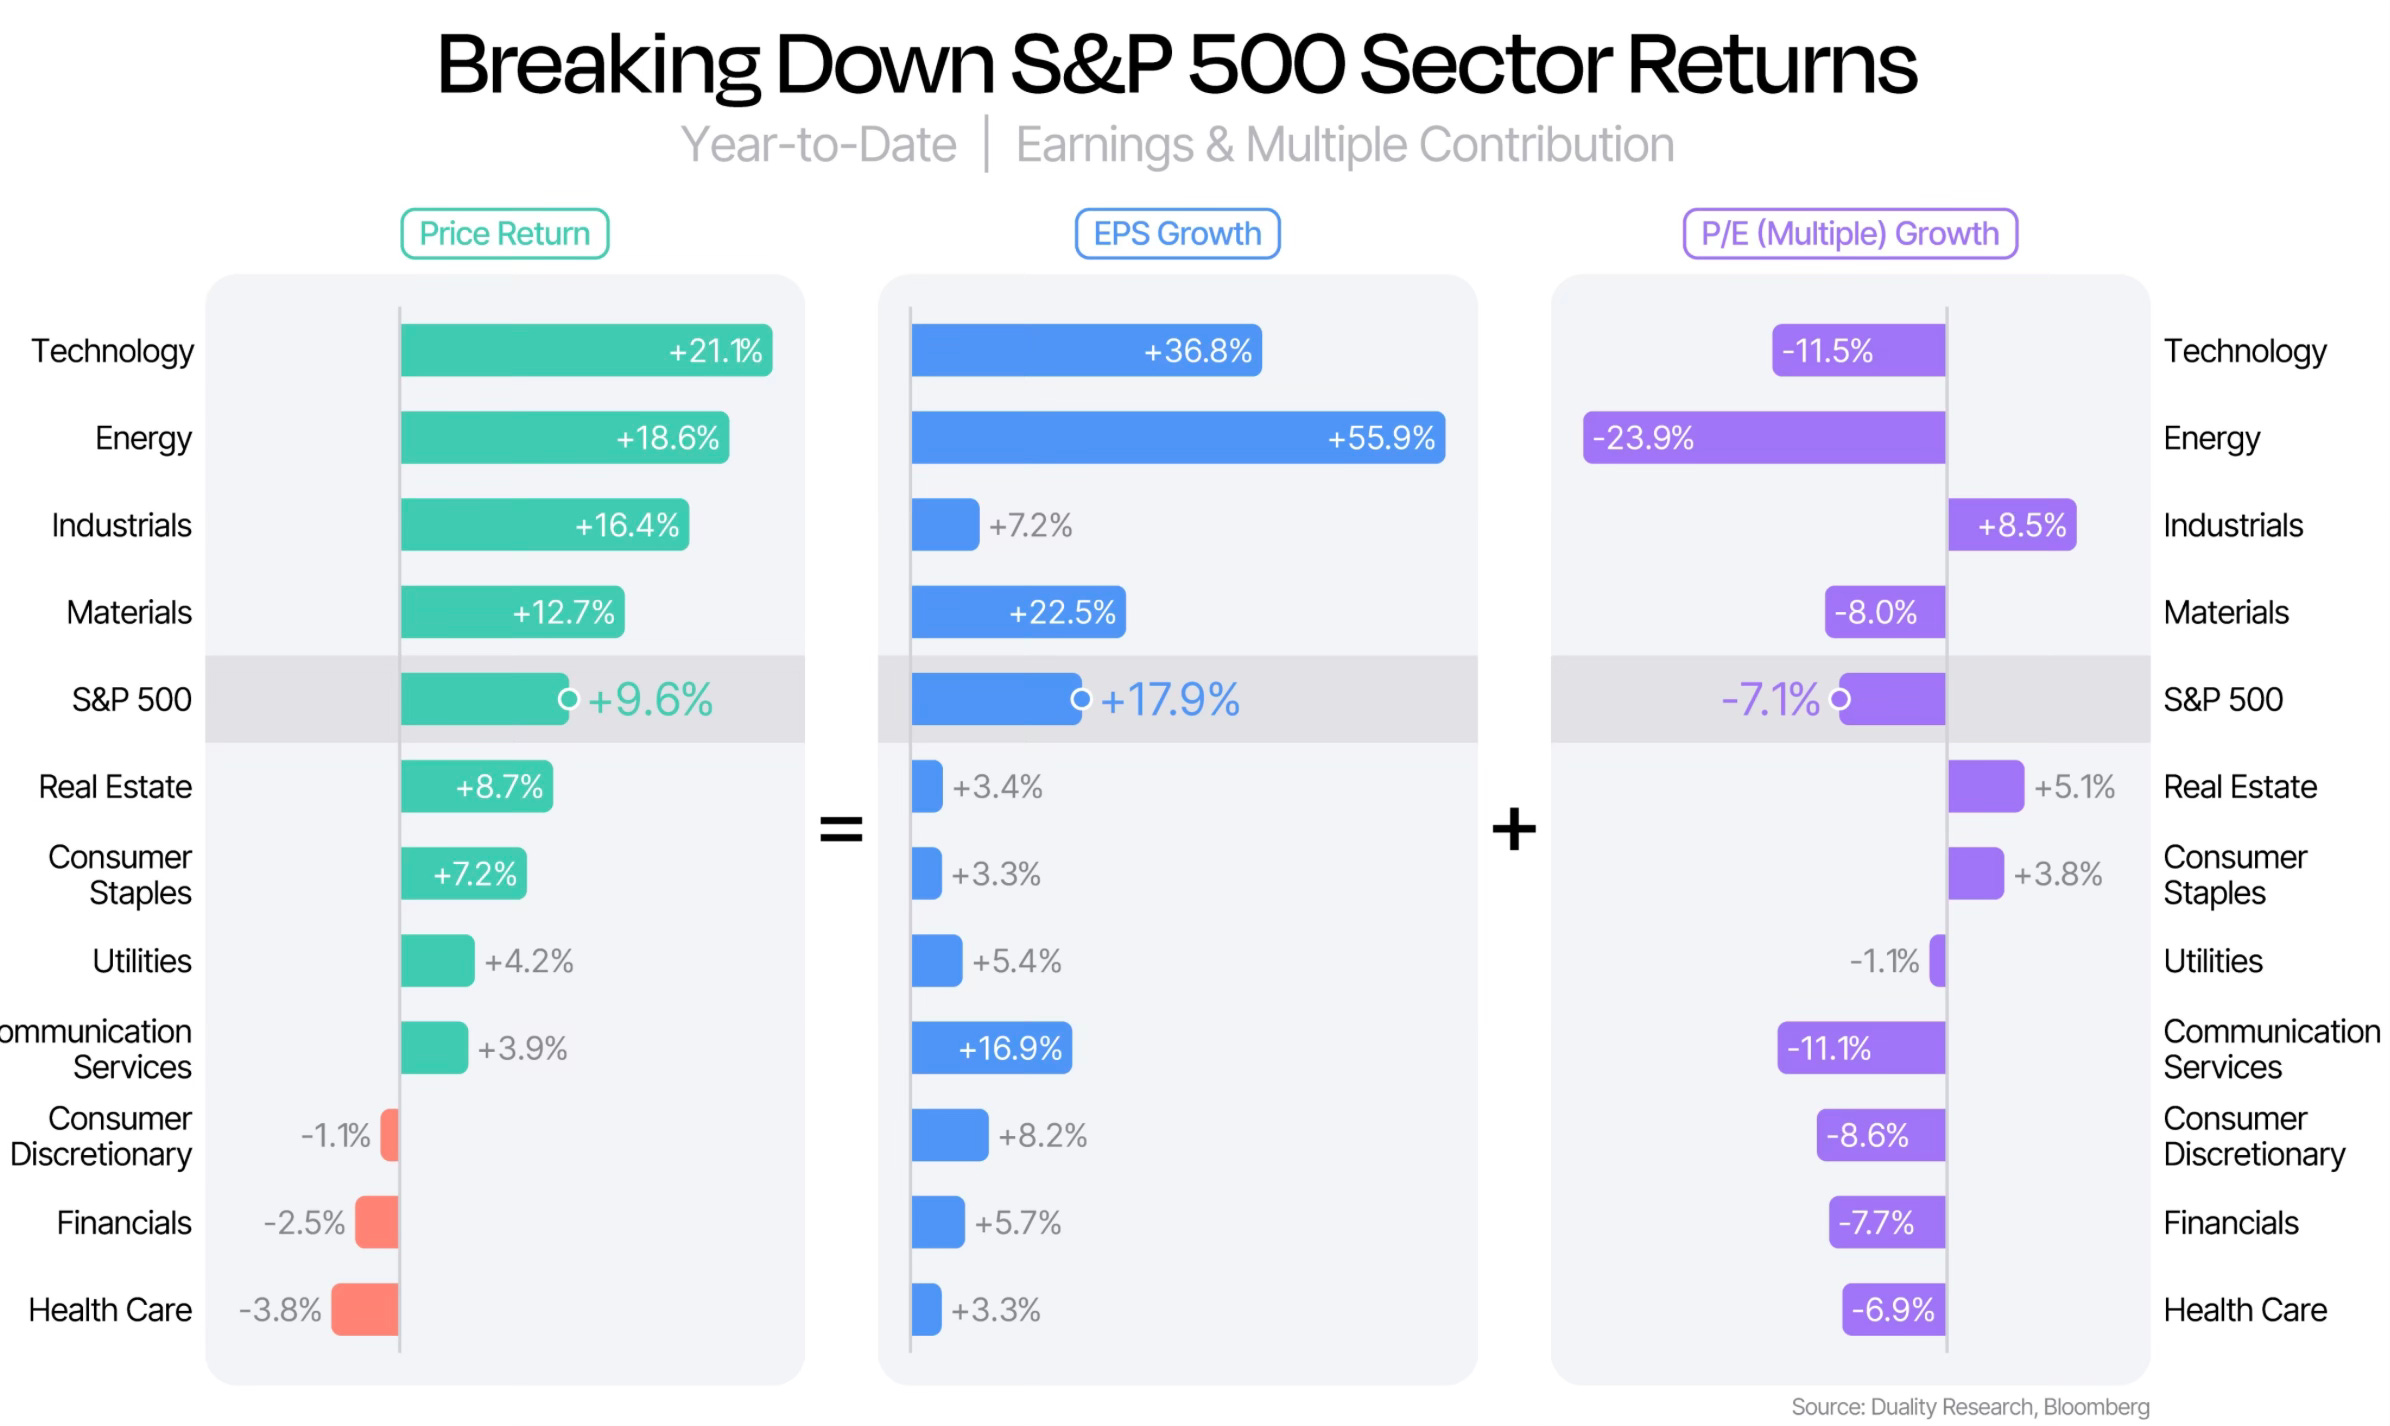
For the first time this year, Technology is the best performing sector in the S&P 500 year to date. After months of the AI trade getting picked apart and second guessed, the group that started this whole bull run is back on top.
The breadth underneath that move is just as encouraging. 64.2% of S&P 500 stocks are now trading above their 200 day moving average, the most since early March. This isn’t a market being carried by a handful of names anymore, more stocks are actually participating.
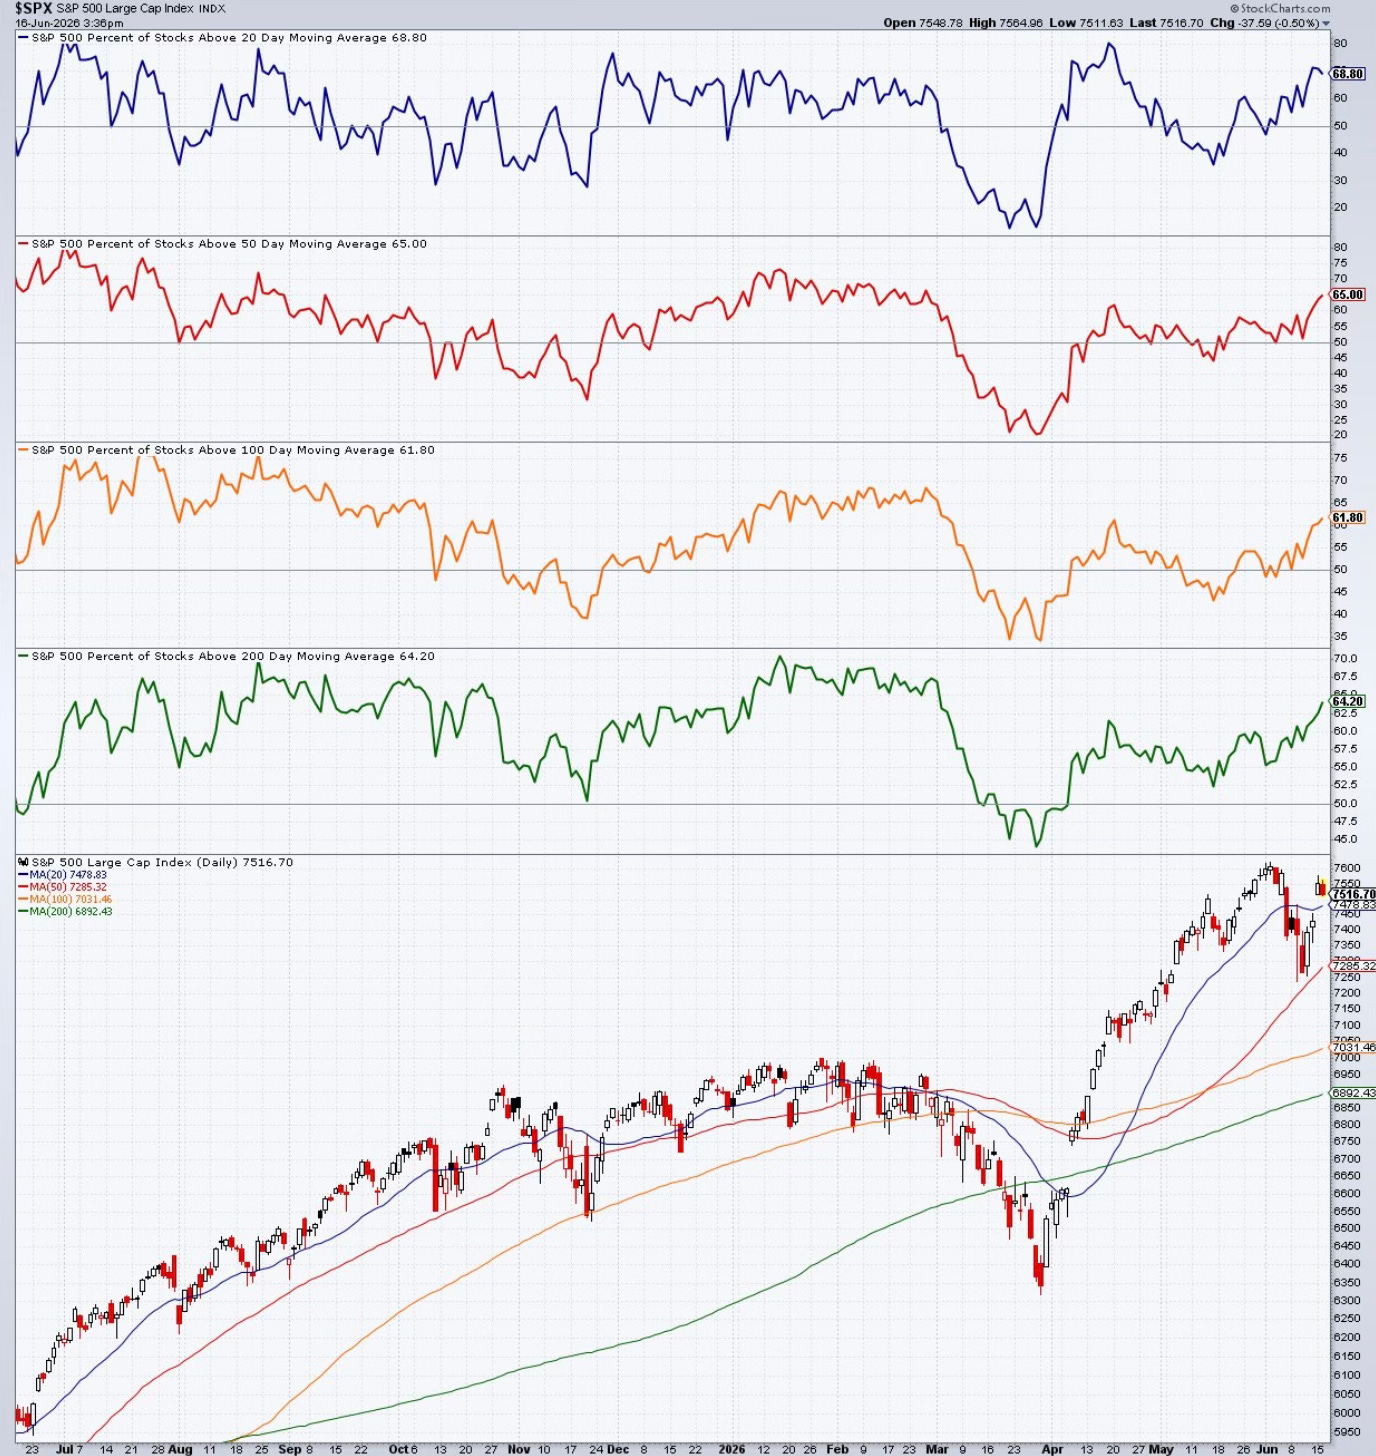
Zoom out to the index level and the picture gets even cleaner. Every major index, the S&P 500, the Dow, the Nasdaq, the Russell 2000, all of them, sits above both its 50 day and 200 day moving average right now. Every one of those moving averages is also rising. That’s about as textbook a definition of a healthy uptrend as you’ll find.
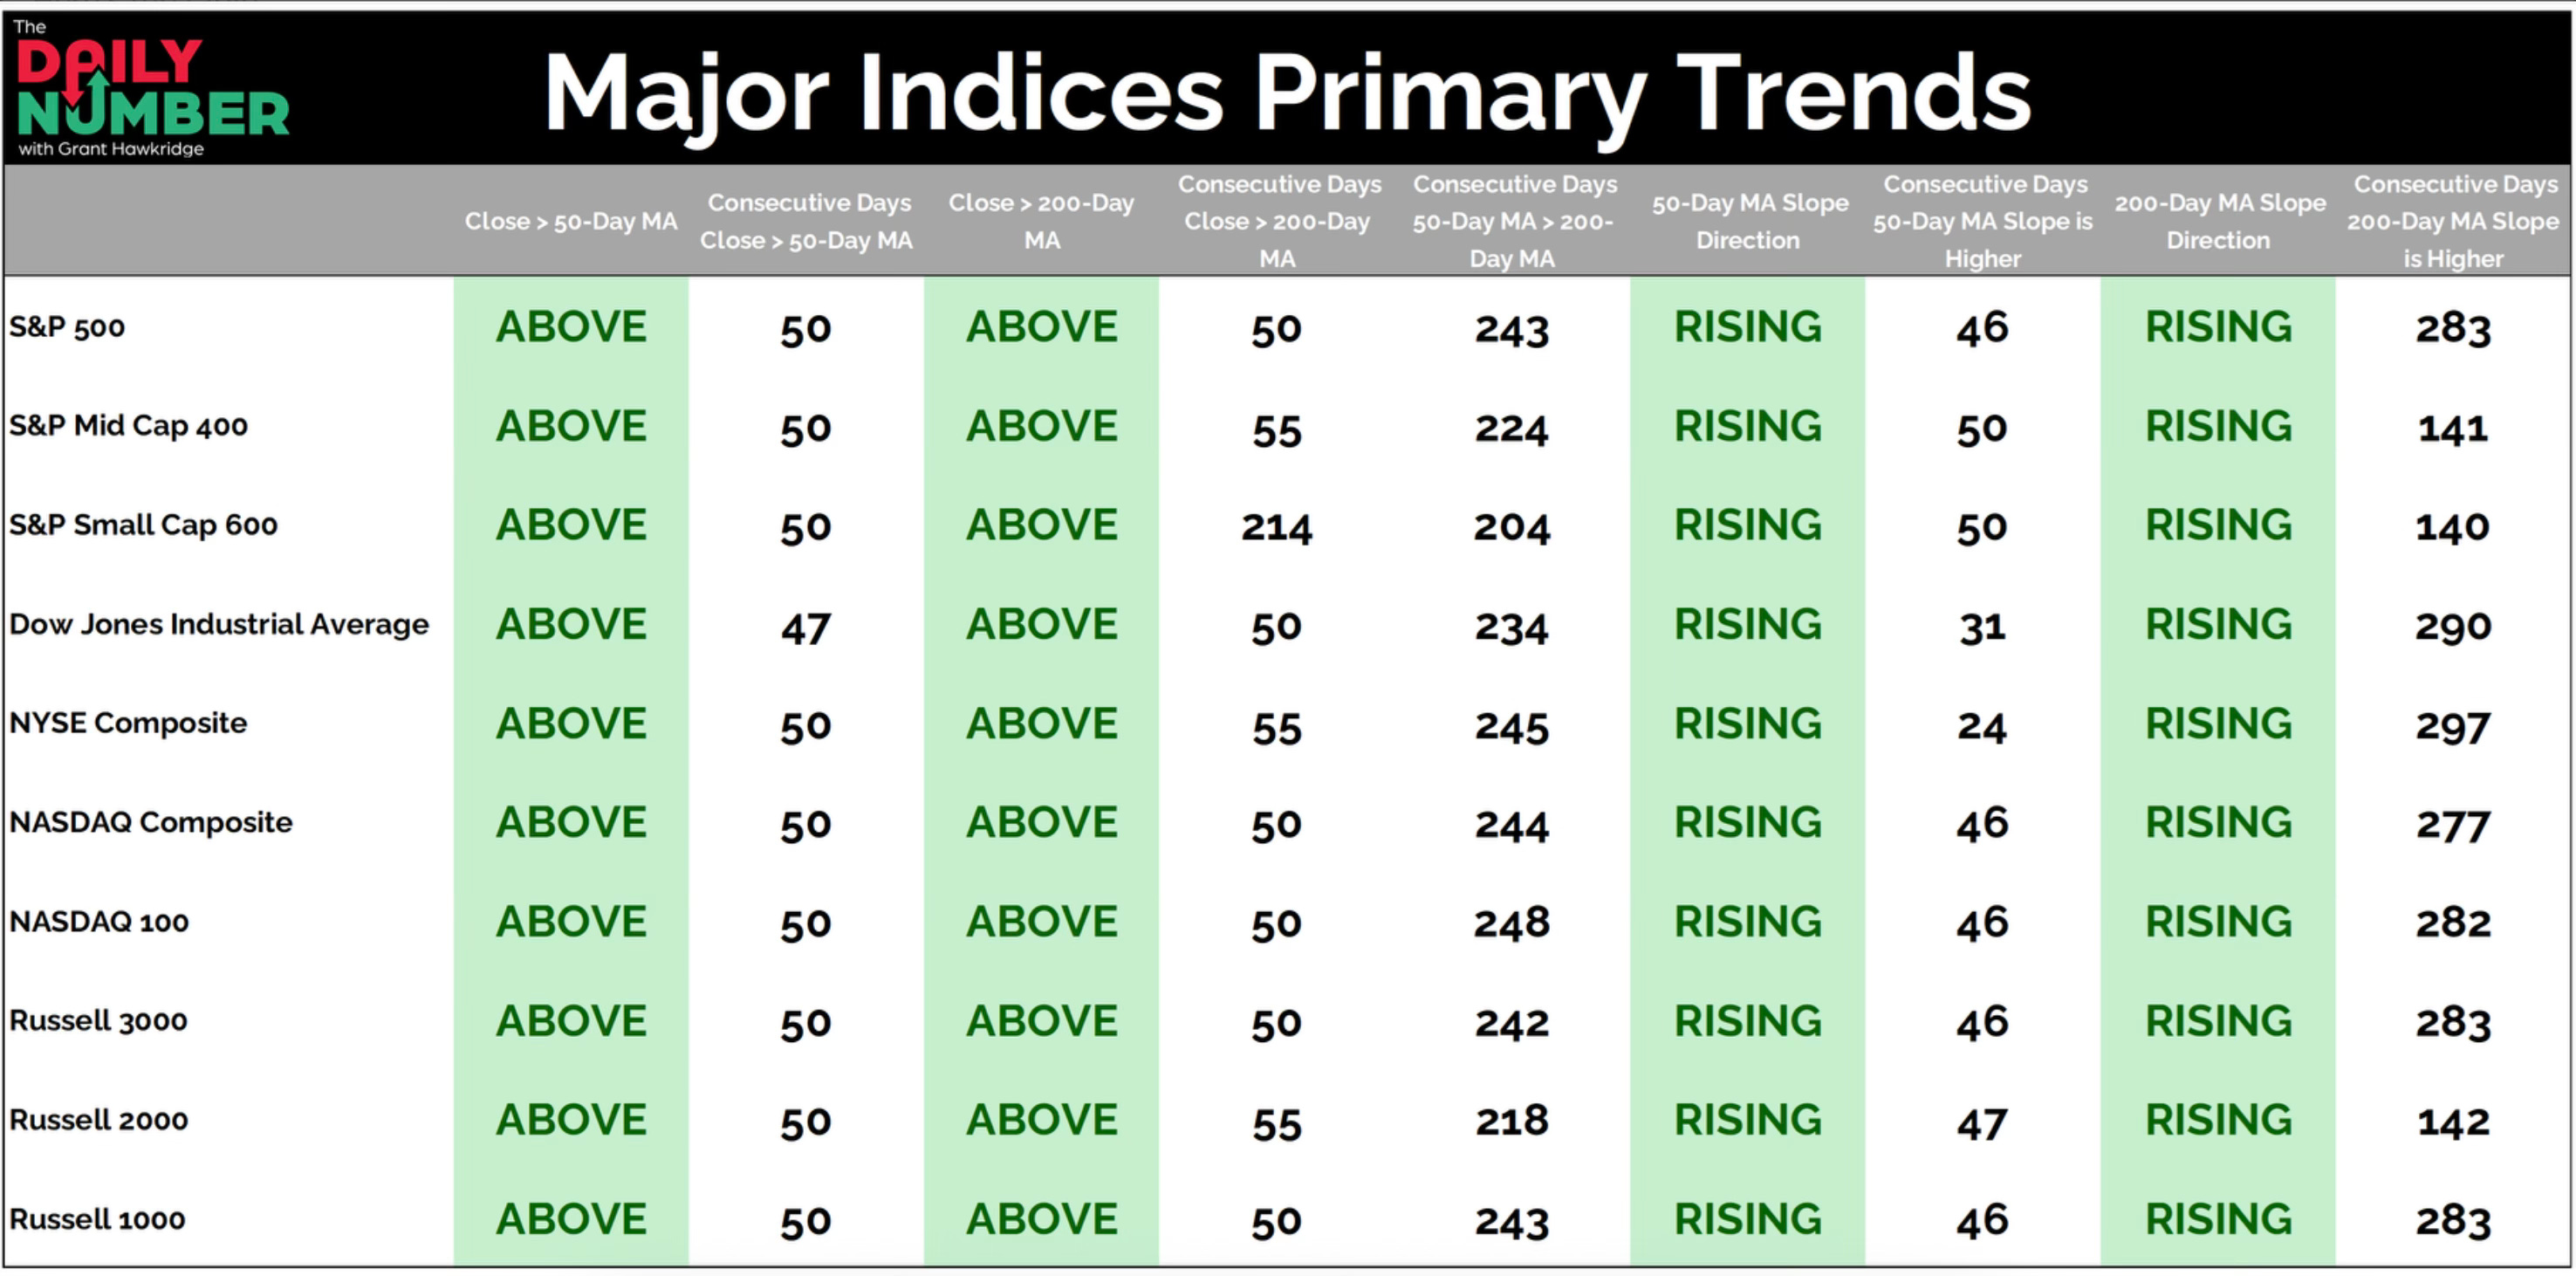
None of this means the path higher is guaranteed or that pullbacks are off the table. But strength confirming strength, with broad participation and rising trend lines across the board, is the kind of setup that tends to get the benefit of the doubt until something breaks it.
A Sentiment Check
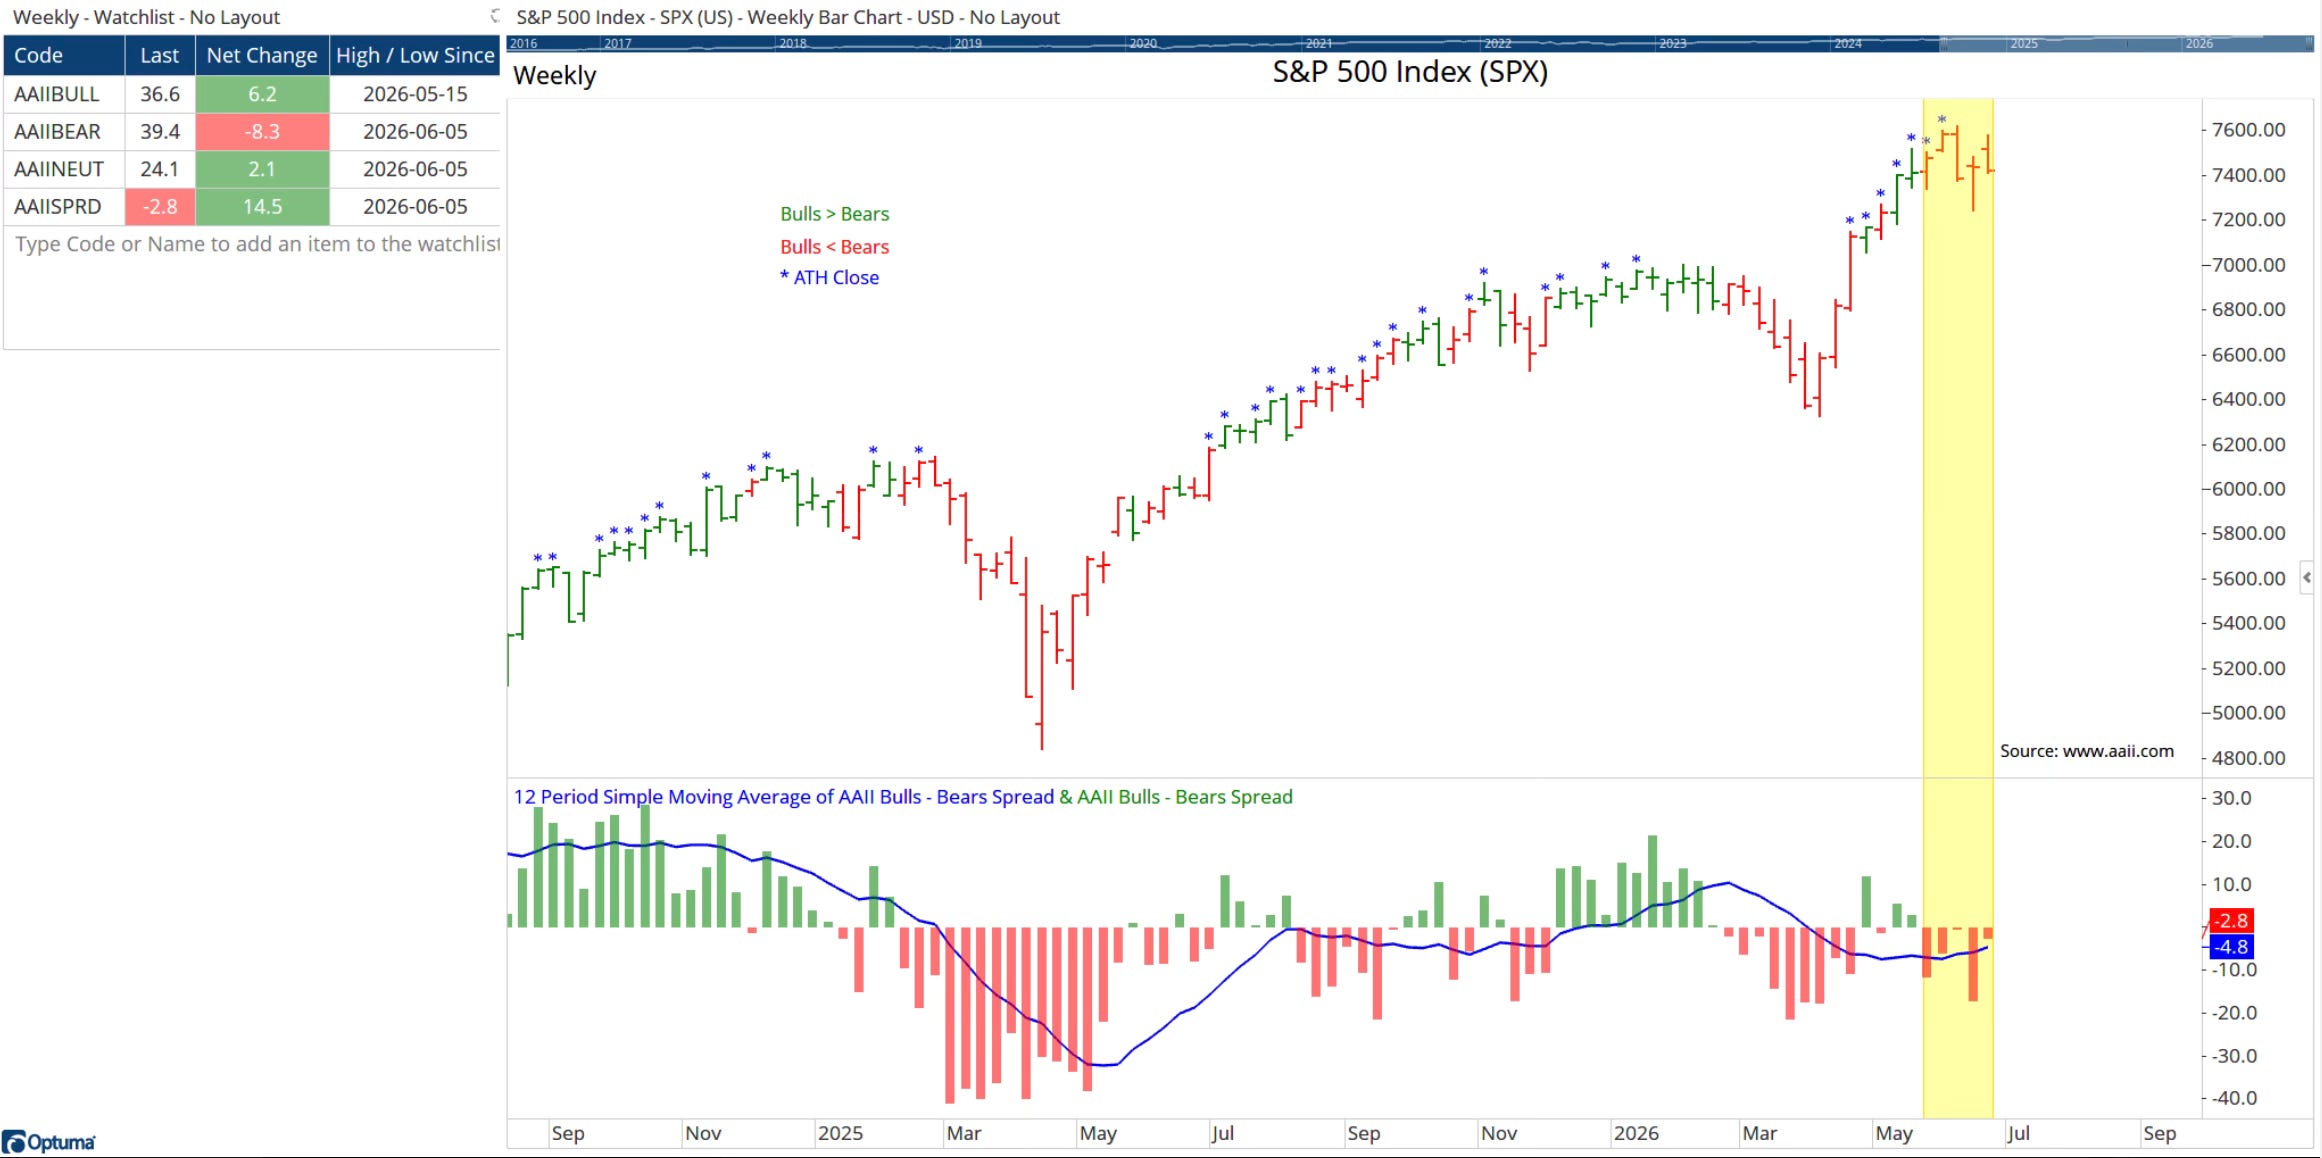
Here’s where it gets interesting. Despite a historic bull run and fresh all time highs, individual investors have now been net bearish for five straight weeks running. That’s an odd combination, stocks ripping higher while the average retail investor keeps telling pollsters they expect the opposite.
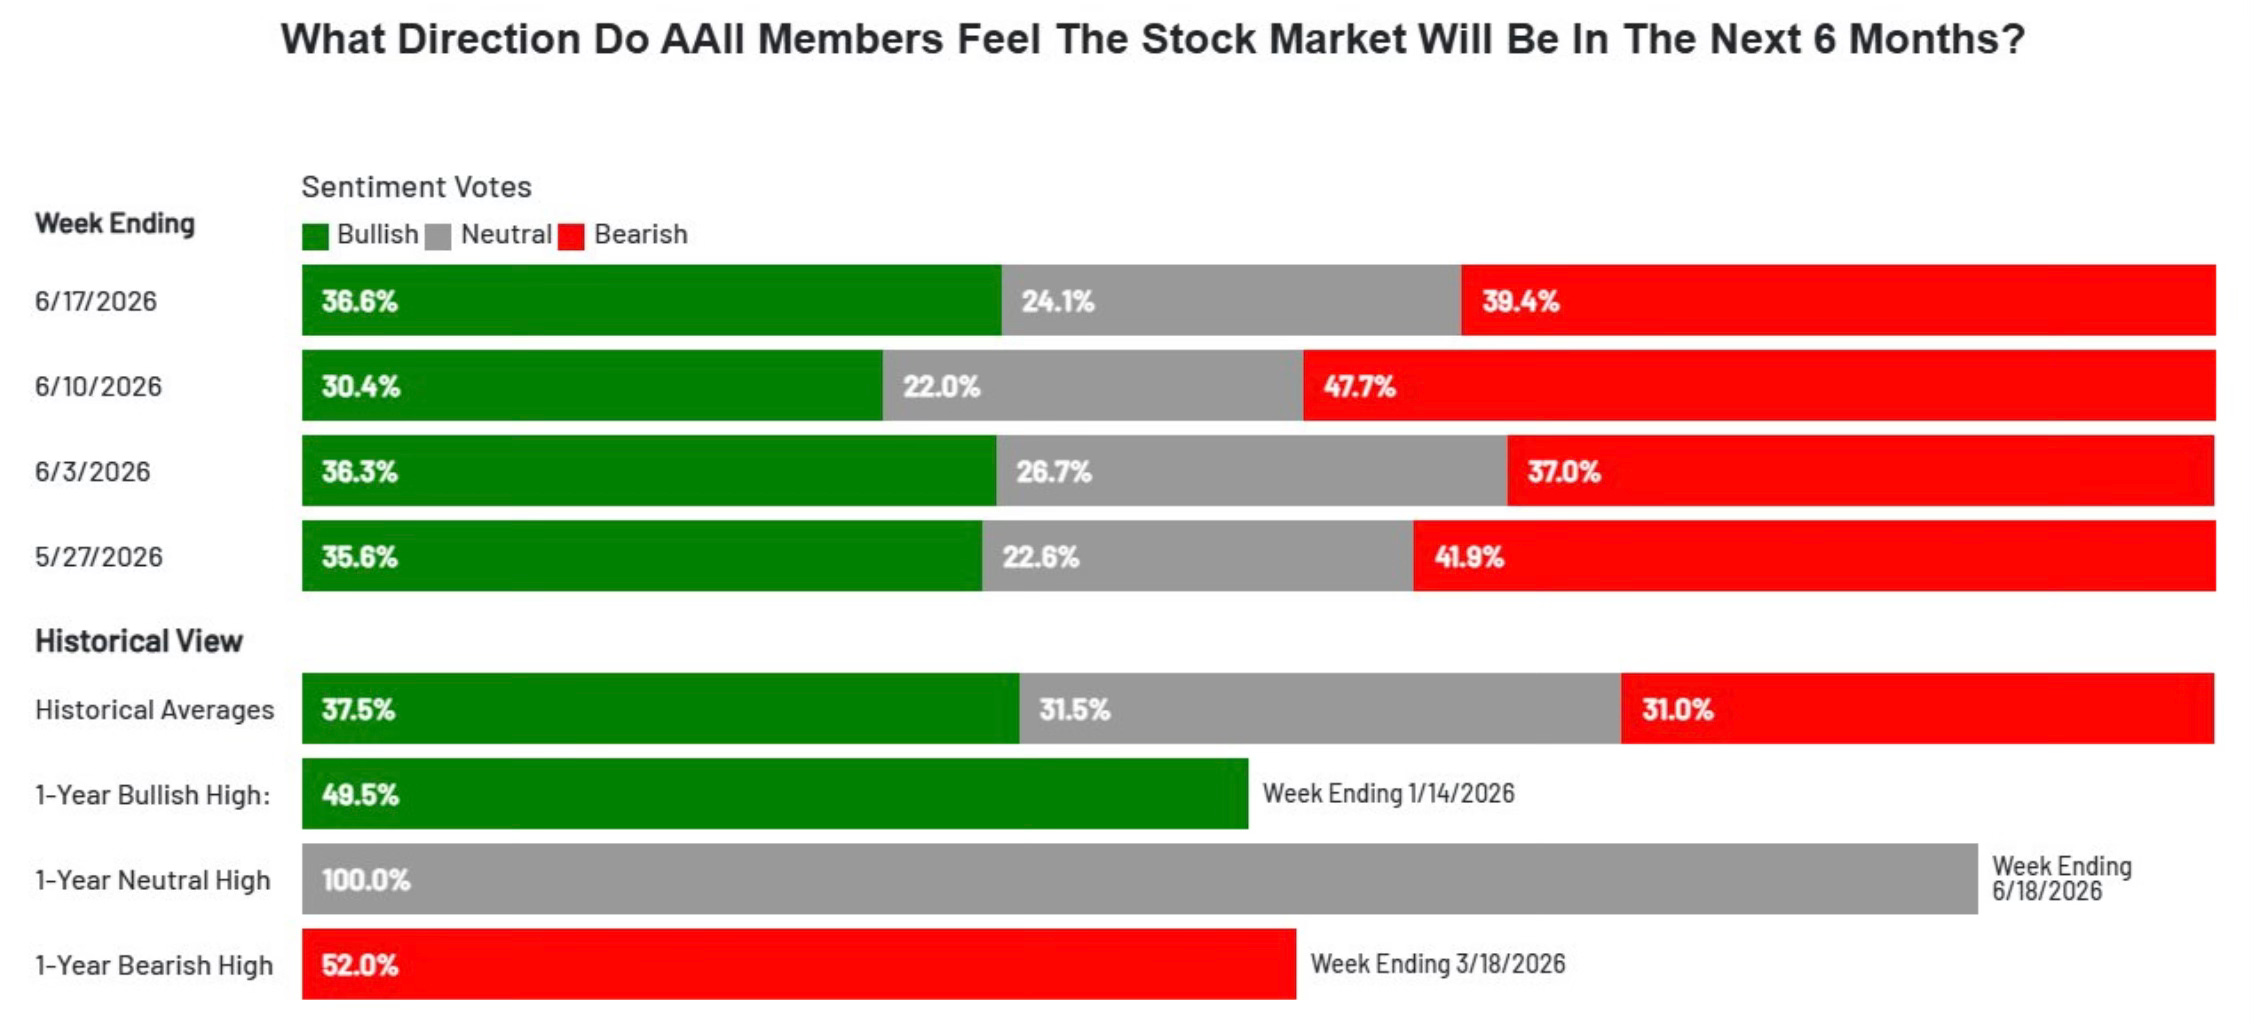
There are signs that’s starting to crack. The AAII bull bear spread narrowed to -2.8 this week, with bulls bouncing to a one month high of 36.6% and bears slipping to 39.4%. Still net negative, but the momentum looks like it’s shifting.
At this point in the cycle, I don’t know many people who are still genuinely bearish. That contrarian instinct is worth sitting with. When persistent bearishness shows up at all time highs, it usually means one of two things, either there’s real risk the crowd is seeing that the price action hasn’t caught up to yet, or sentiment is just lagging and about to flip, which is often a setup for more upside, not less.
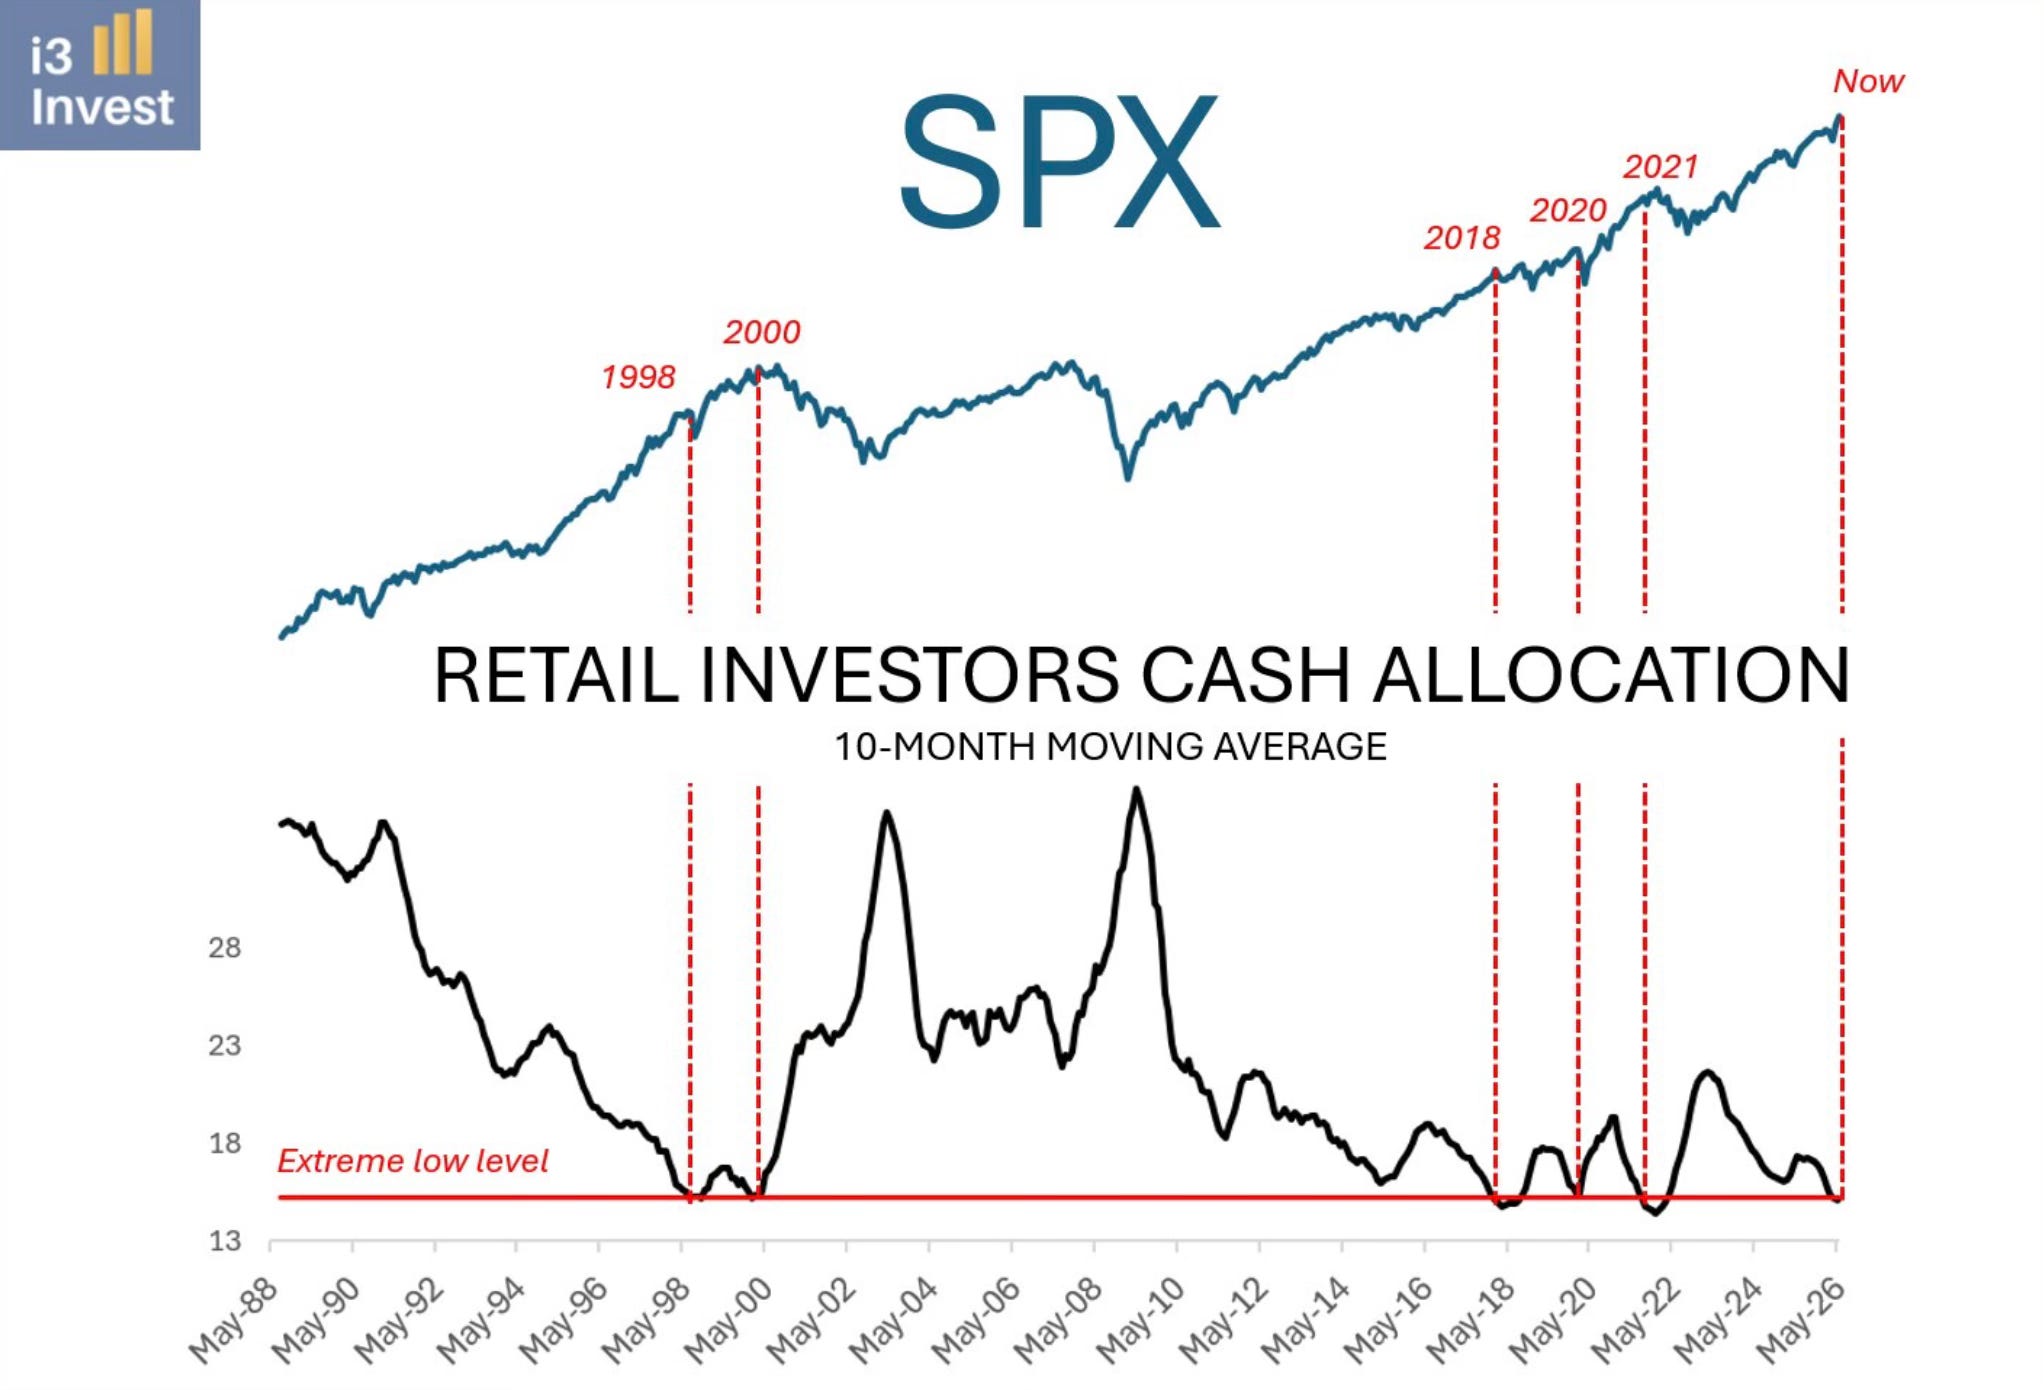
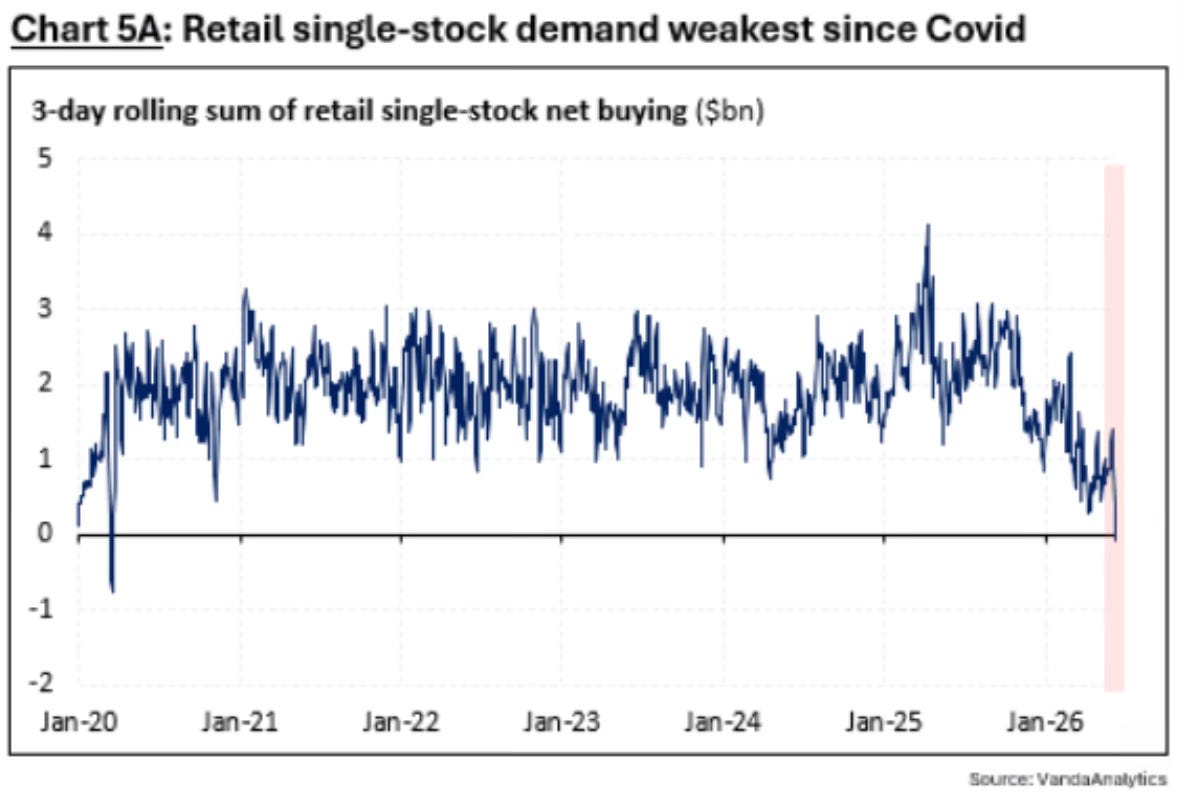
The behavioral data backs up the idea that people are holding back, not piling in. Retail single stock net buying has fallen to its lowest level on a rolling basis since Covid. Retail cash allocation is sitting at extremely low levels again too, which on the surface sounds bullish, since nobody wants to hold cash, but is usually exactly the environment where having some becomes valuable.
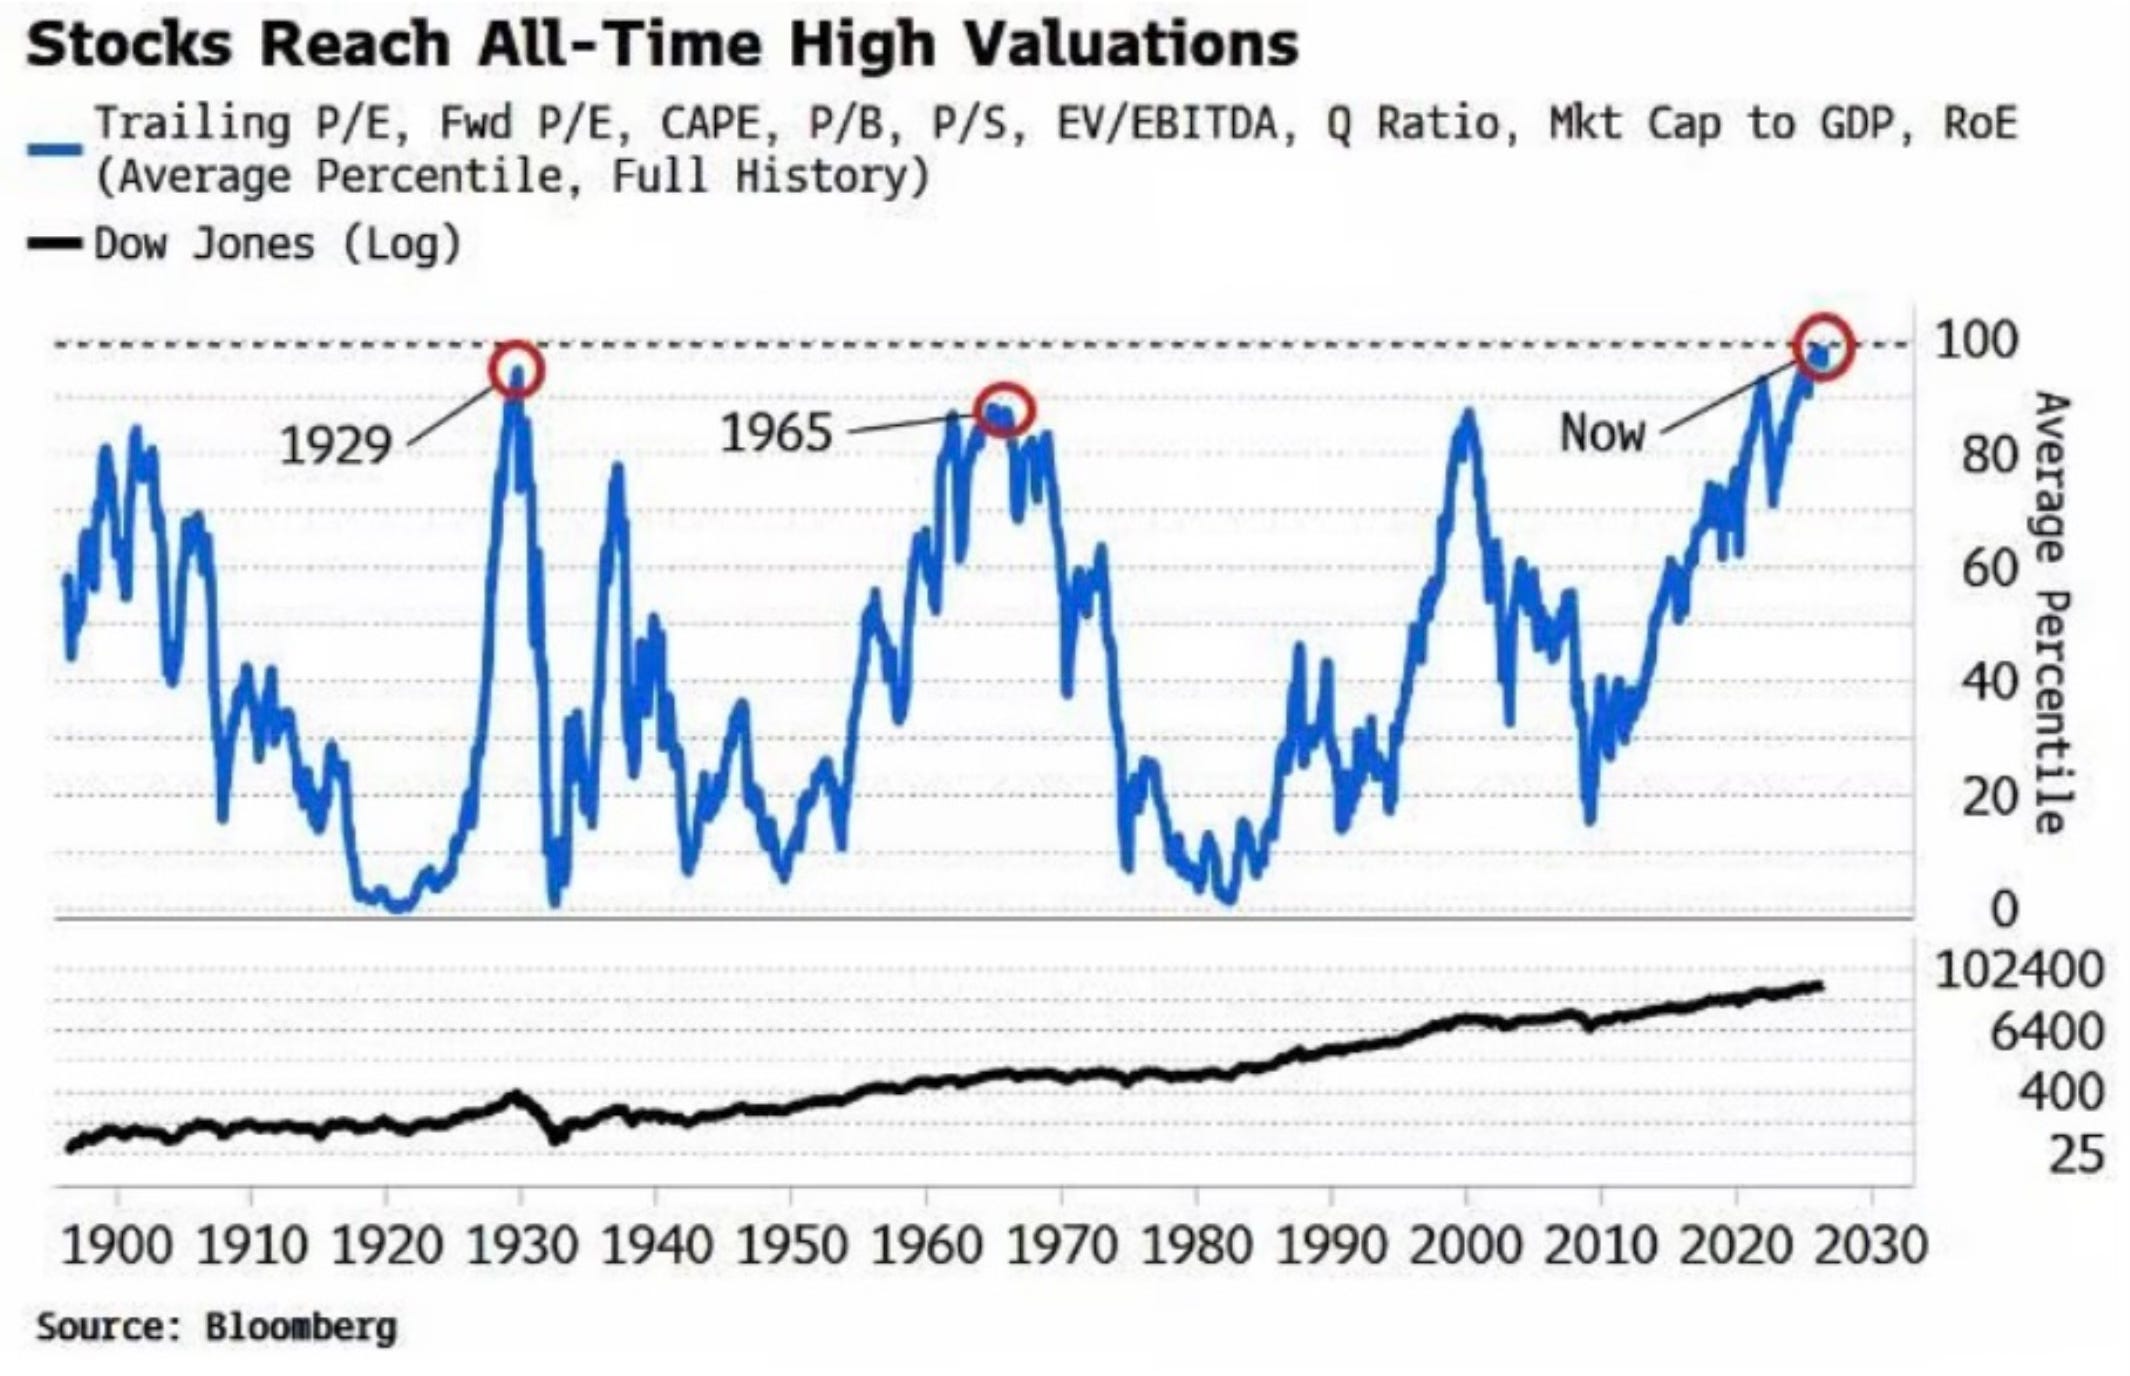
And then there’s valuation. A broad composite of measures, P/E, price to book, EV/EBITDA, return on equity, and others, now sits at the 99th percentile. Stocks are priced about as close to perfection as they’ve ever been.
None of this is a call to sell everything or panic. It’s a reminder to hold the trend with both hands and a little humility. Follow the trend, but don’t fall in love with it.
The Generals Aren’t Leading Anymore
For years the playbook was simple. Buy the Magnificent 7, ride the AI wave, and let everything else fight for scraps. That playbook just broke.