
Hi friends! 👋
We have a lot to discuss. Here’s what I’m looking at today.
September Stumbled. Q4 Usually Doesn’t.
The Index Is Lying to You
Look at What’s Actually Breaking
Are Small Caps Getting Left Behind?
Bonds Are Getting Interesting
Thanks for reading Spilled Coffee. Let’s get into it.
Eric
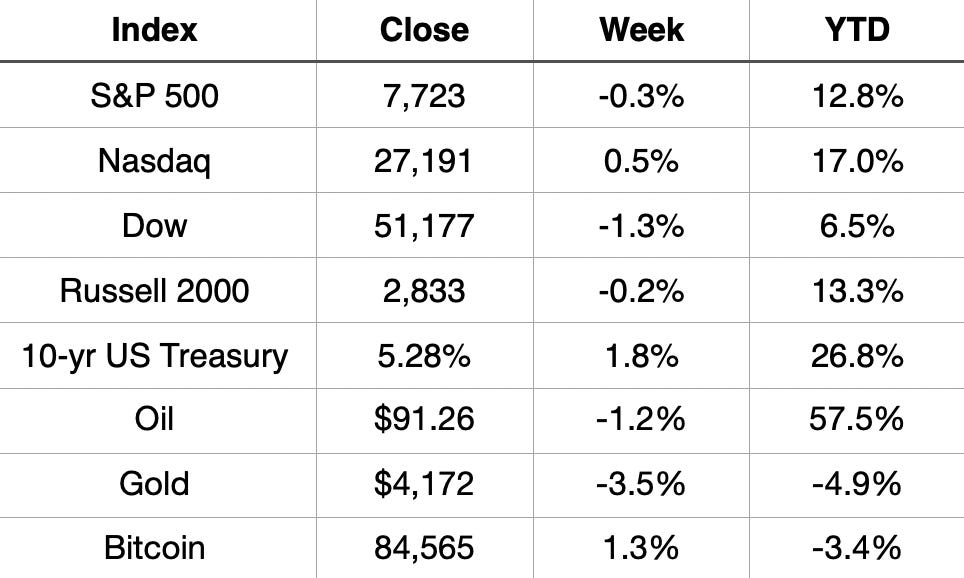
A mixed week to start Q4. The S&P slipped 0.3%. The Dow had the worst week of the big indexes, down 1.3%. The Nasdaq was the only major index higher, up 0.5%, as the megacaps did the heavy lifting again.
Small caps finished down just 0.2% after it finally snapped its 16-day losing streak on Thursday.
The 10-year keeps climbing. It closed at 5.28%, near its highest level since 2001, even with a weak jobs report on Friday.
Oil eased 1.2% on the week but is still up 57.5% this year. Gold dropped 3.5% and is now negative YTD. Bitcoin was up 1.3% but remains down 3.4% on the year.
Market Recap
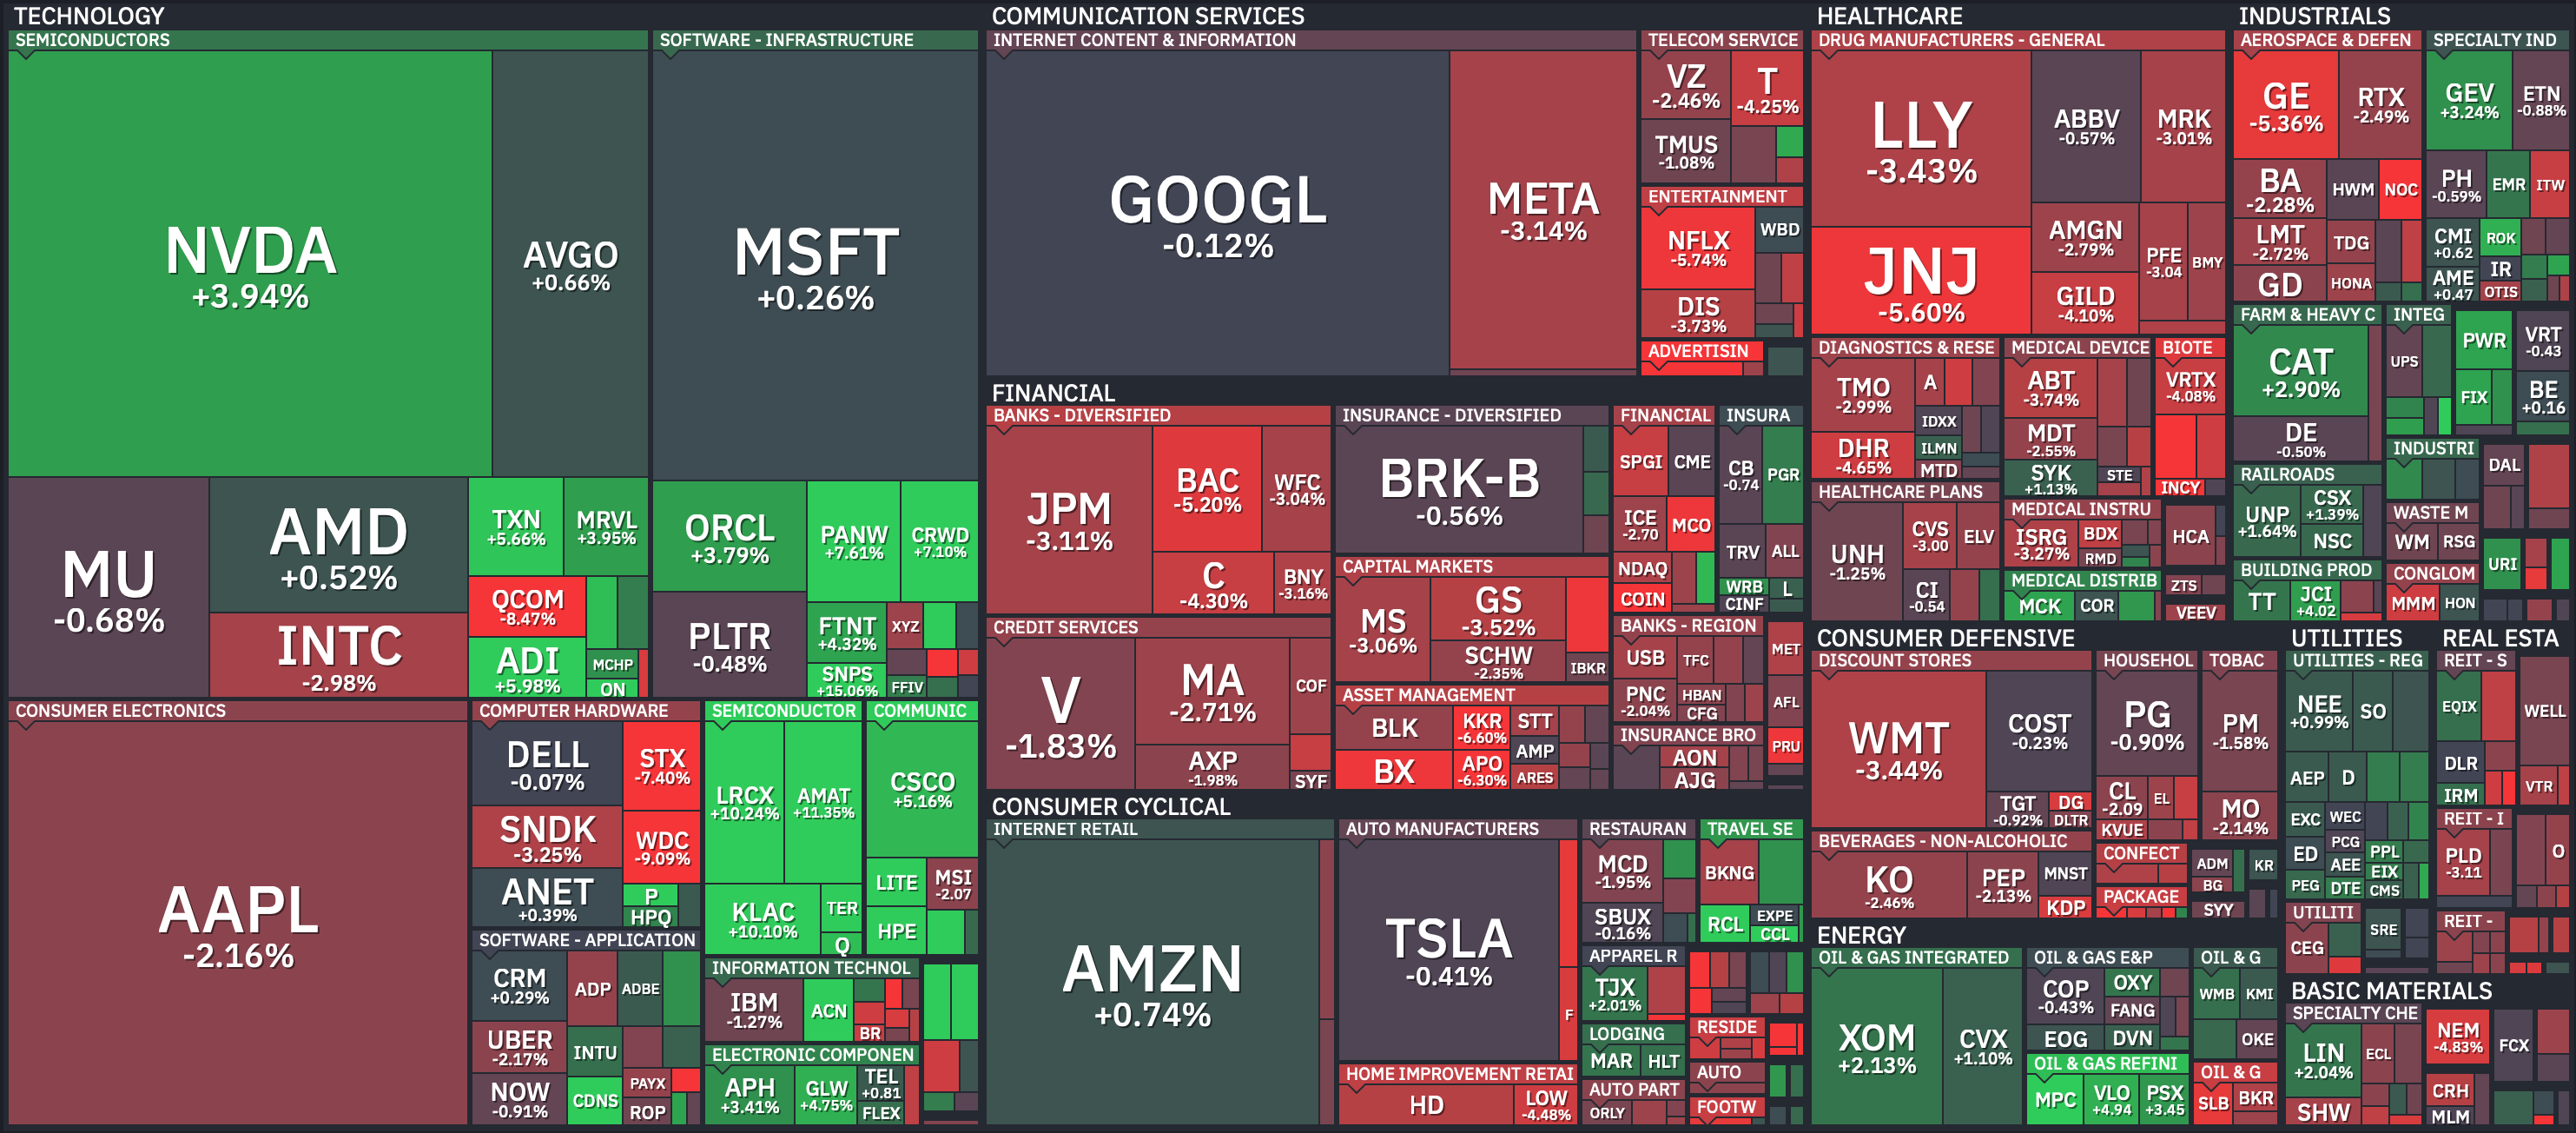
Weekly Heat Map of Stocks
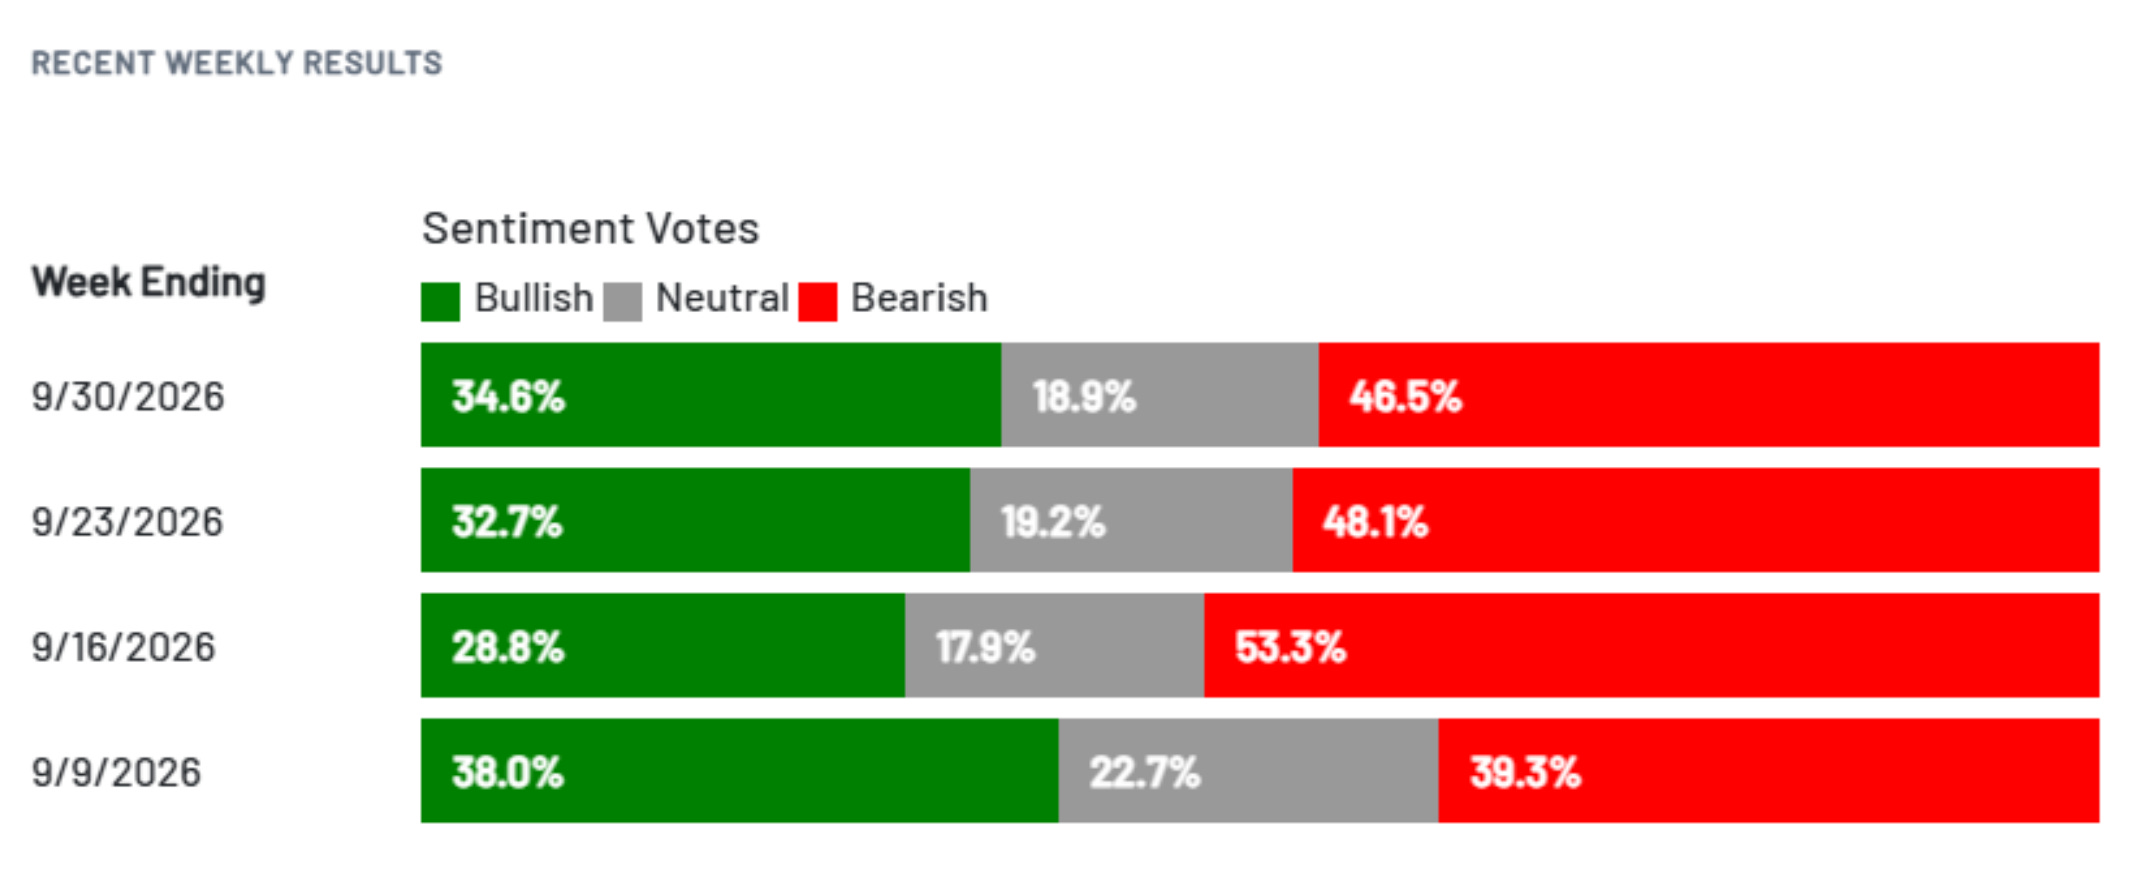
Sentiment Check
Still many more bears than bulls.
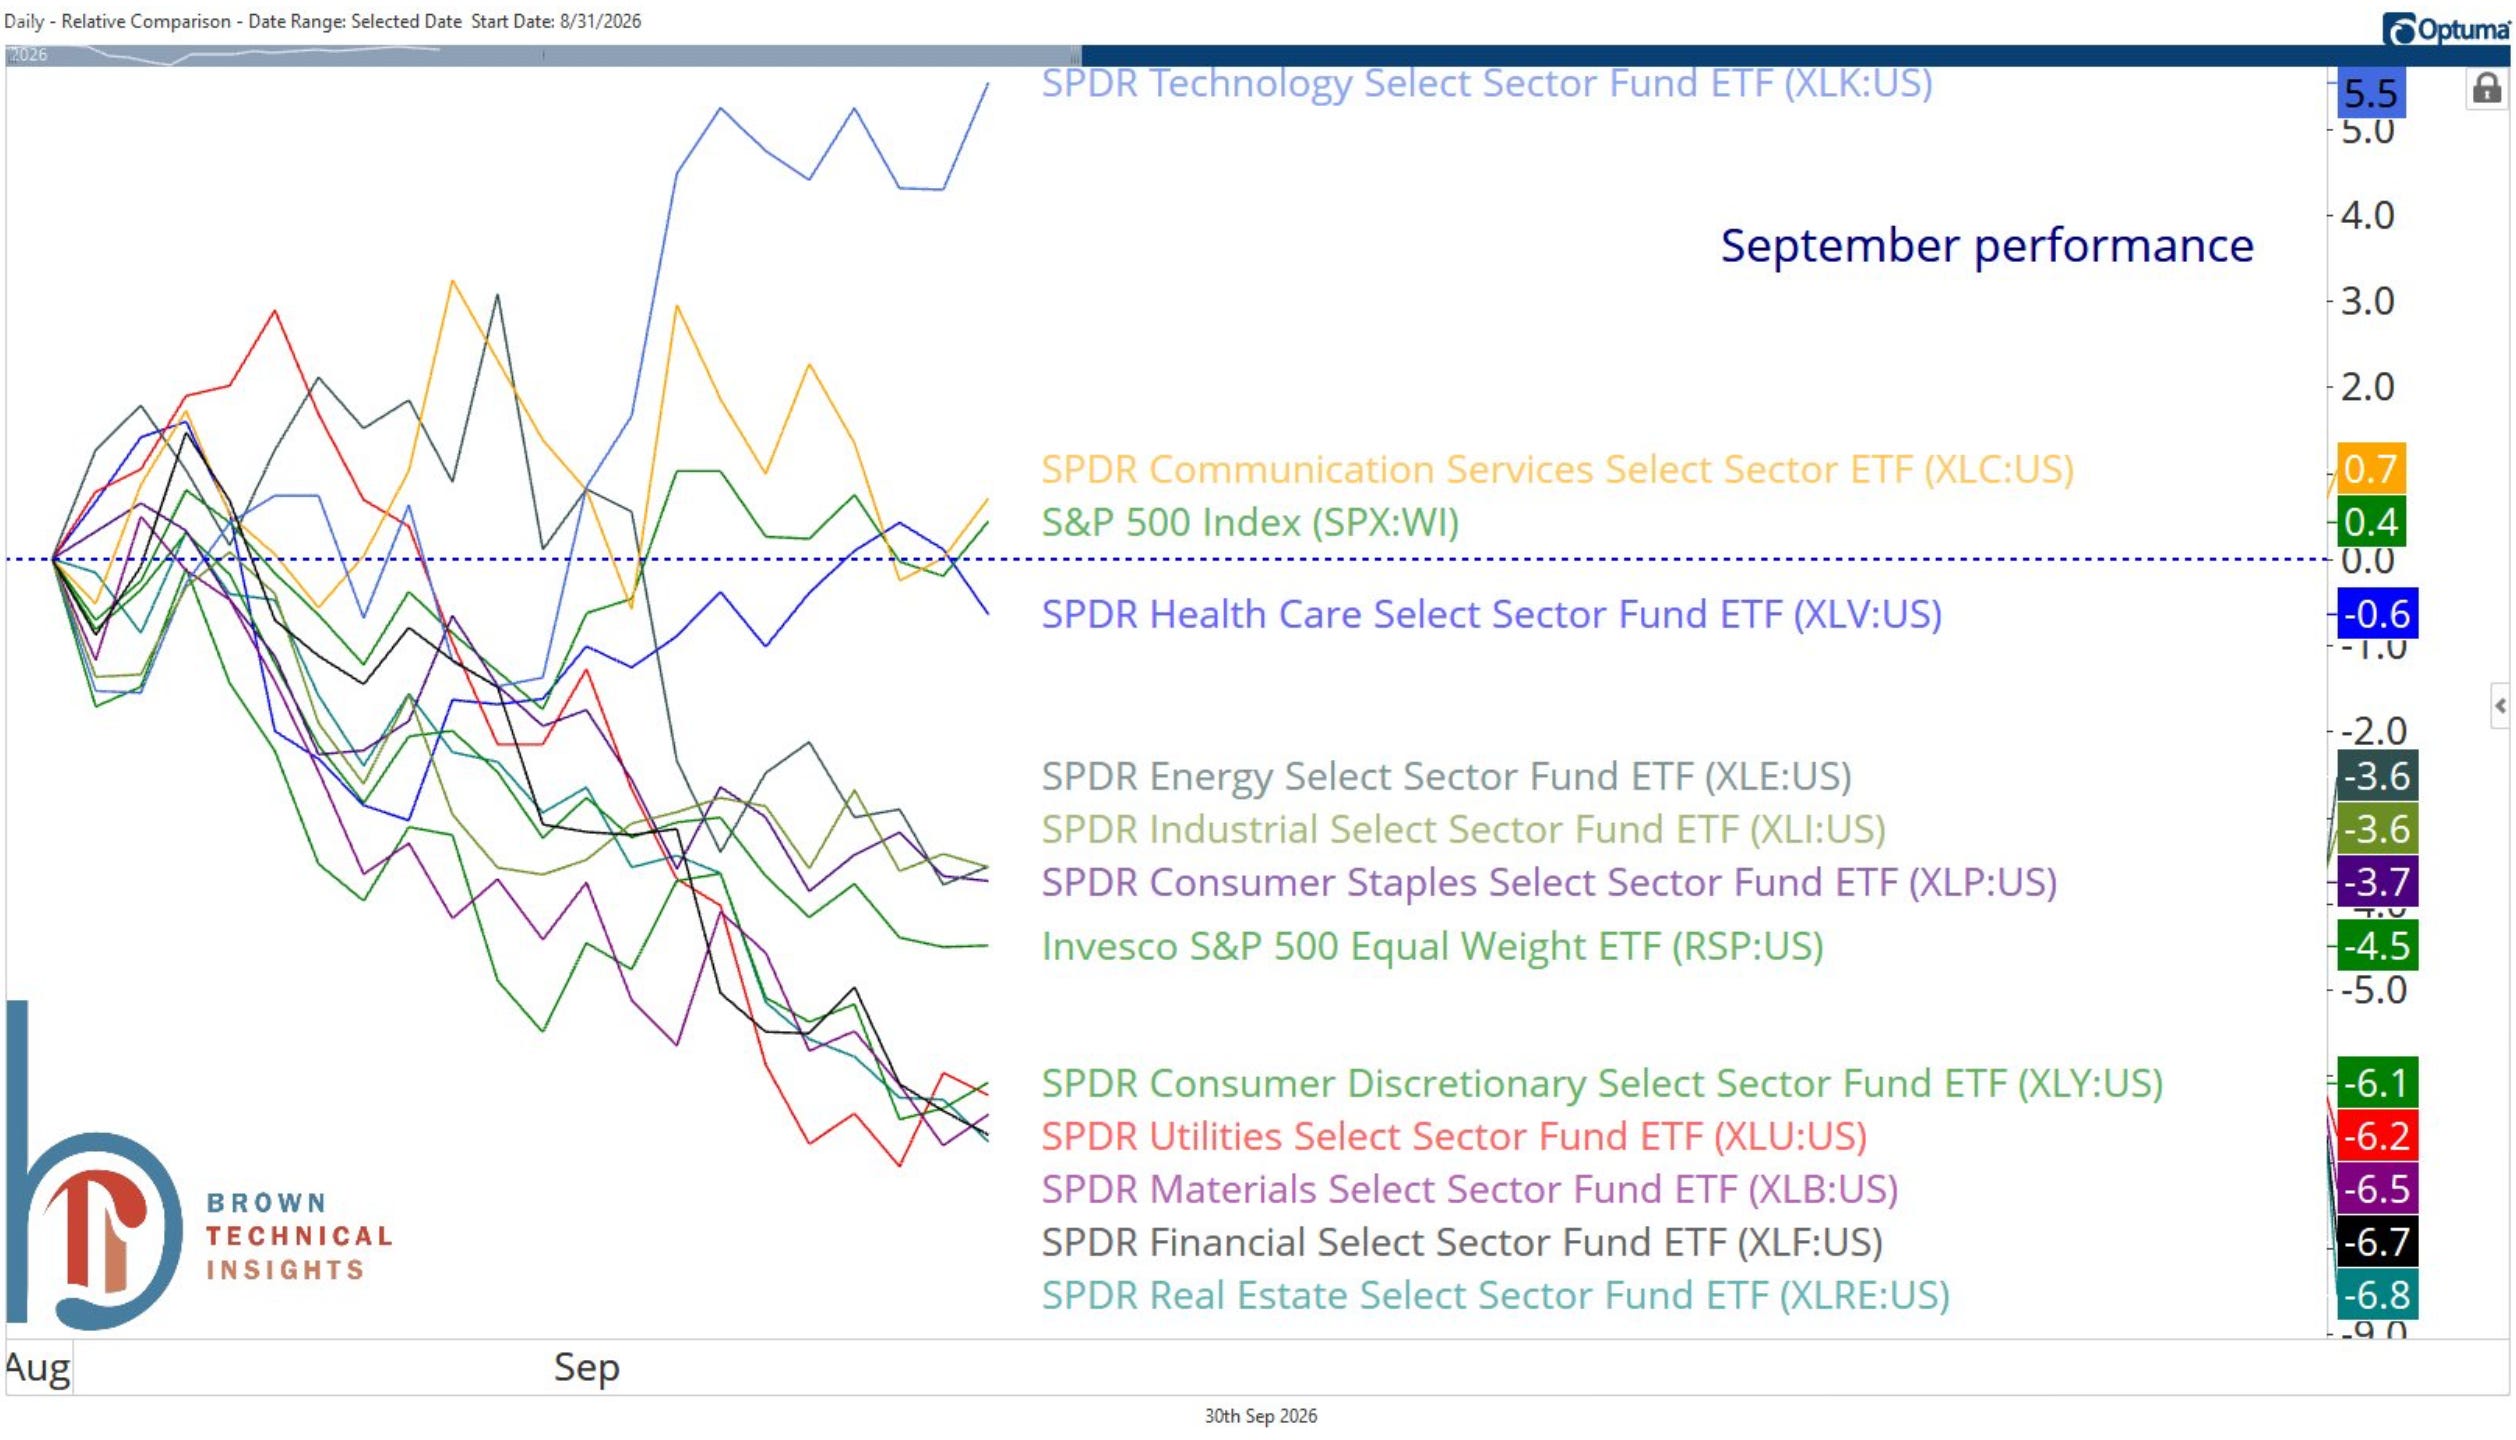
September Stumbled. Q4 Usually Doesn’t.
The S&P 500 finished September down 0.45%. Not a disaster. But it was the third losing month in the last four.
And the headline number hides how rough it really was. Tech carried the index while almost everything else got hit.
Only two sectors finished higher. Tech gained 5.5% and communication services added 0.7%. Five sectors fell more than 6%. Real estate, financials, materials, utilities, and consumer discretionary all took a beating. The equal-weight S&P fell 4.5%.
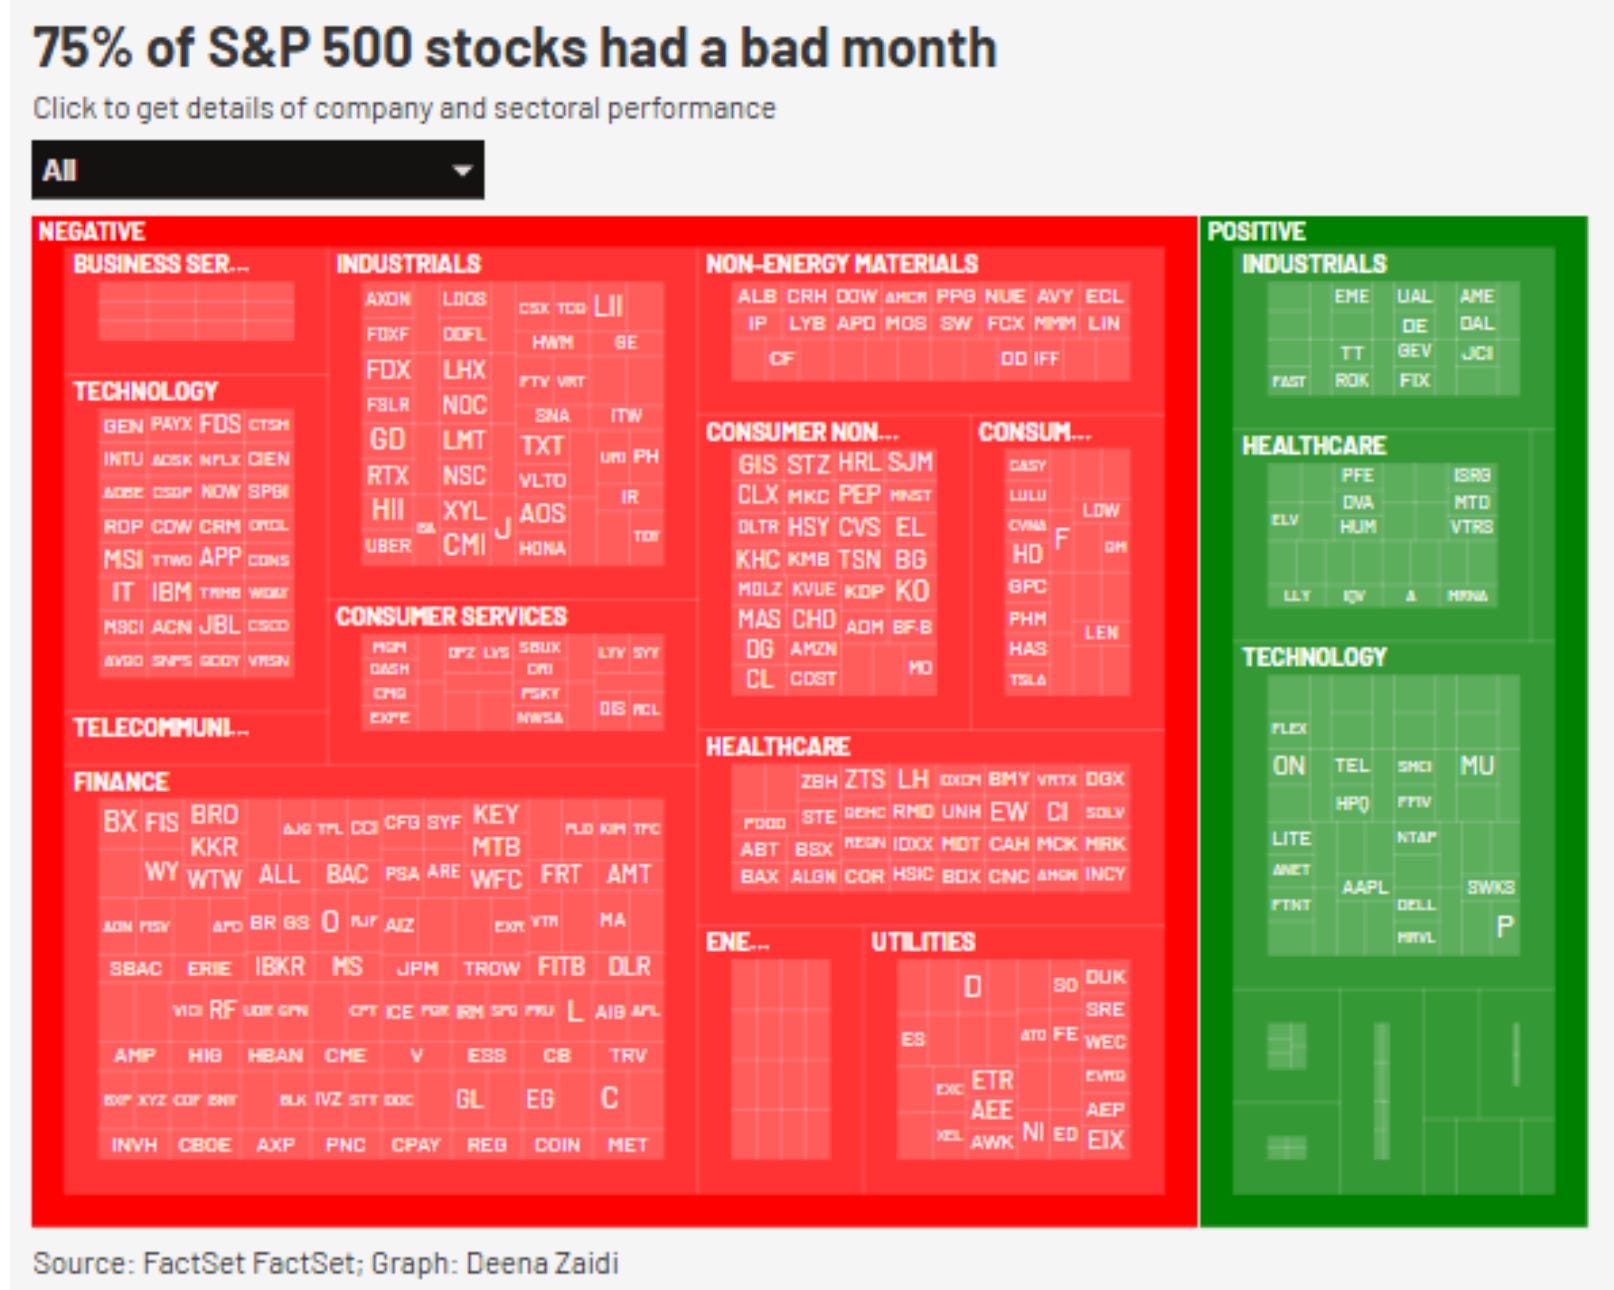
That’s how you end up with this. 75% of S&P 500 stocks were down in September. Three out of every four.
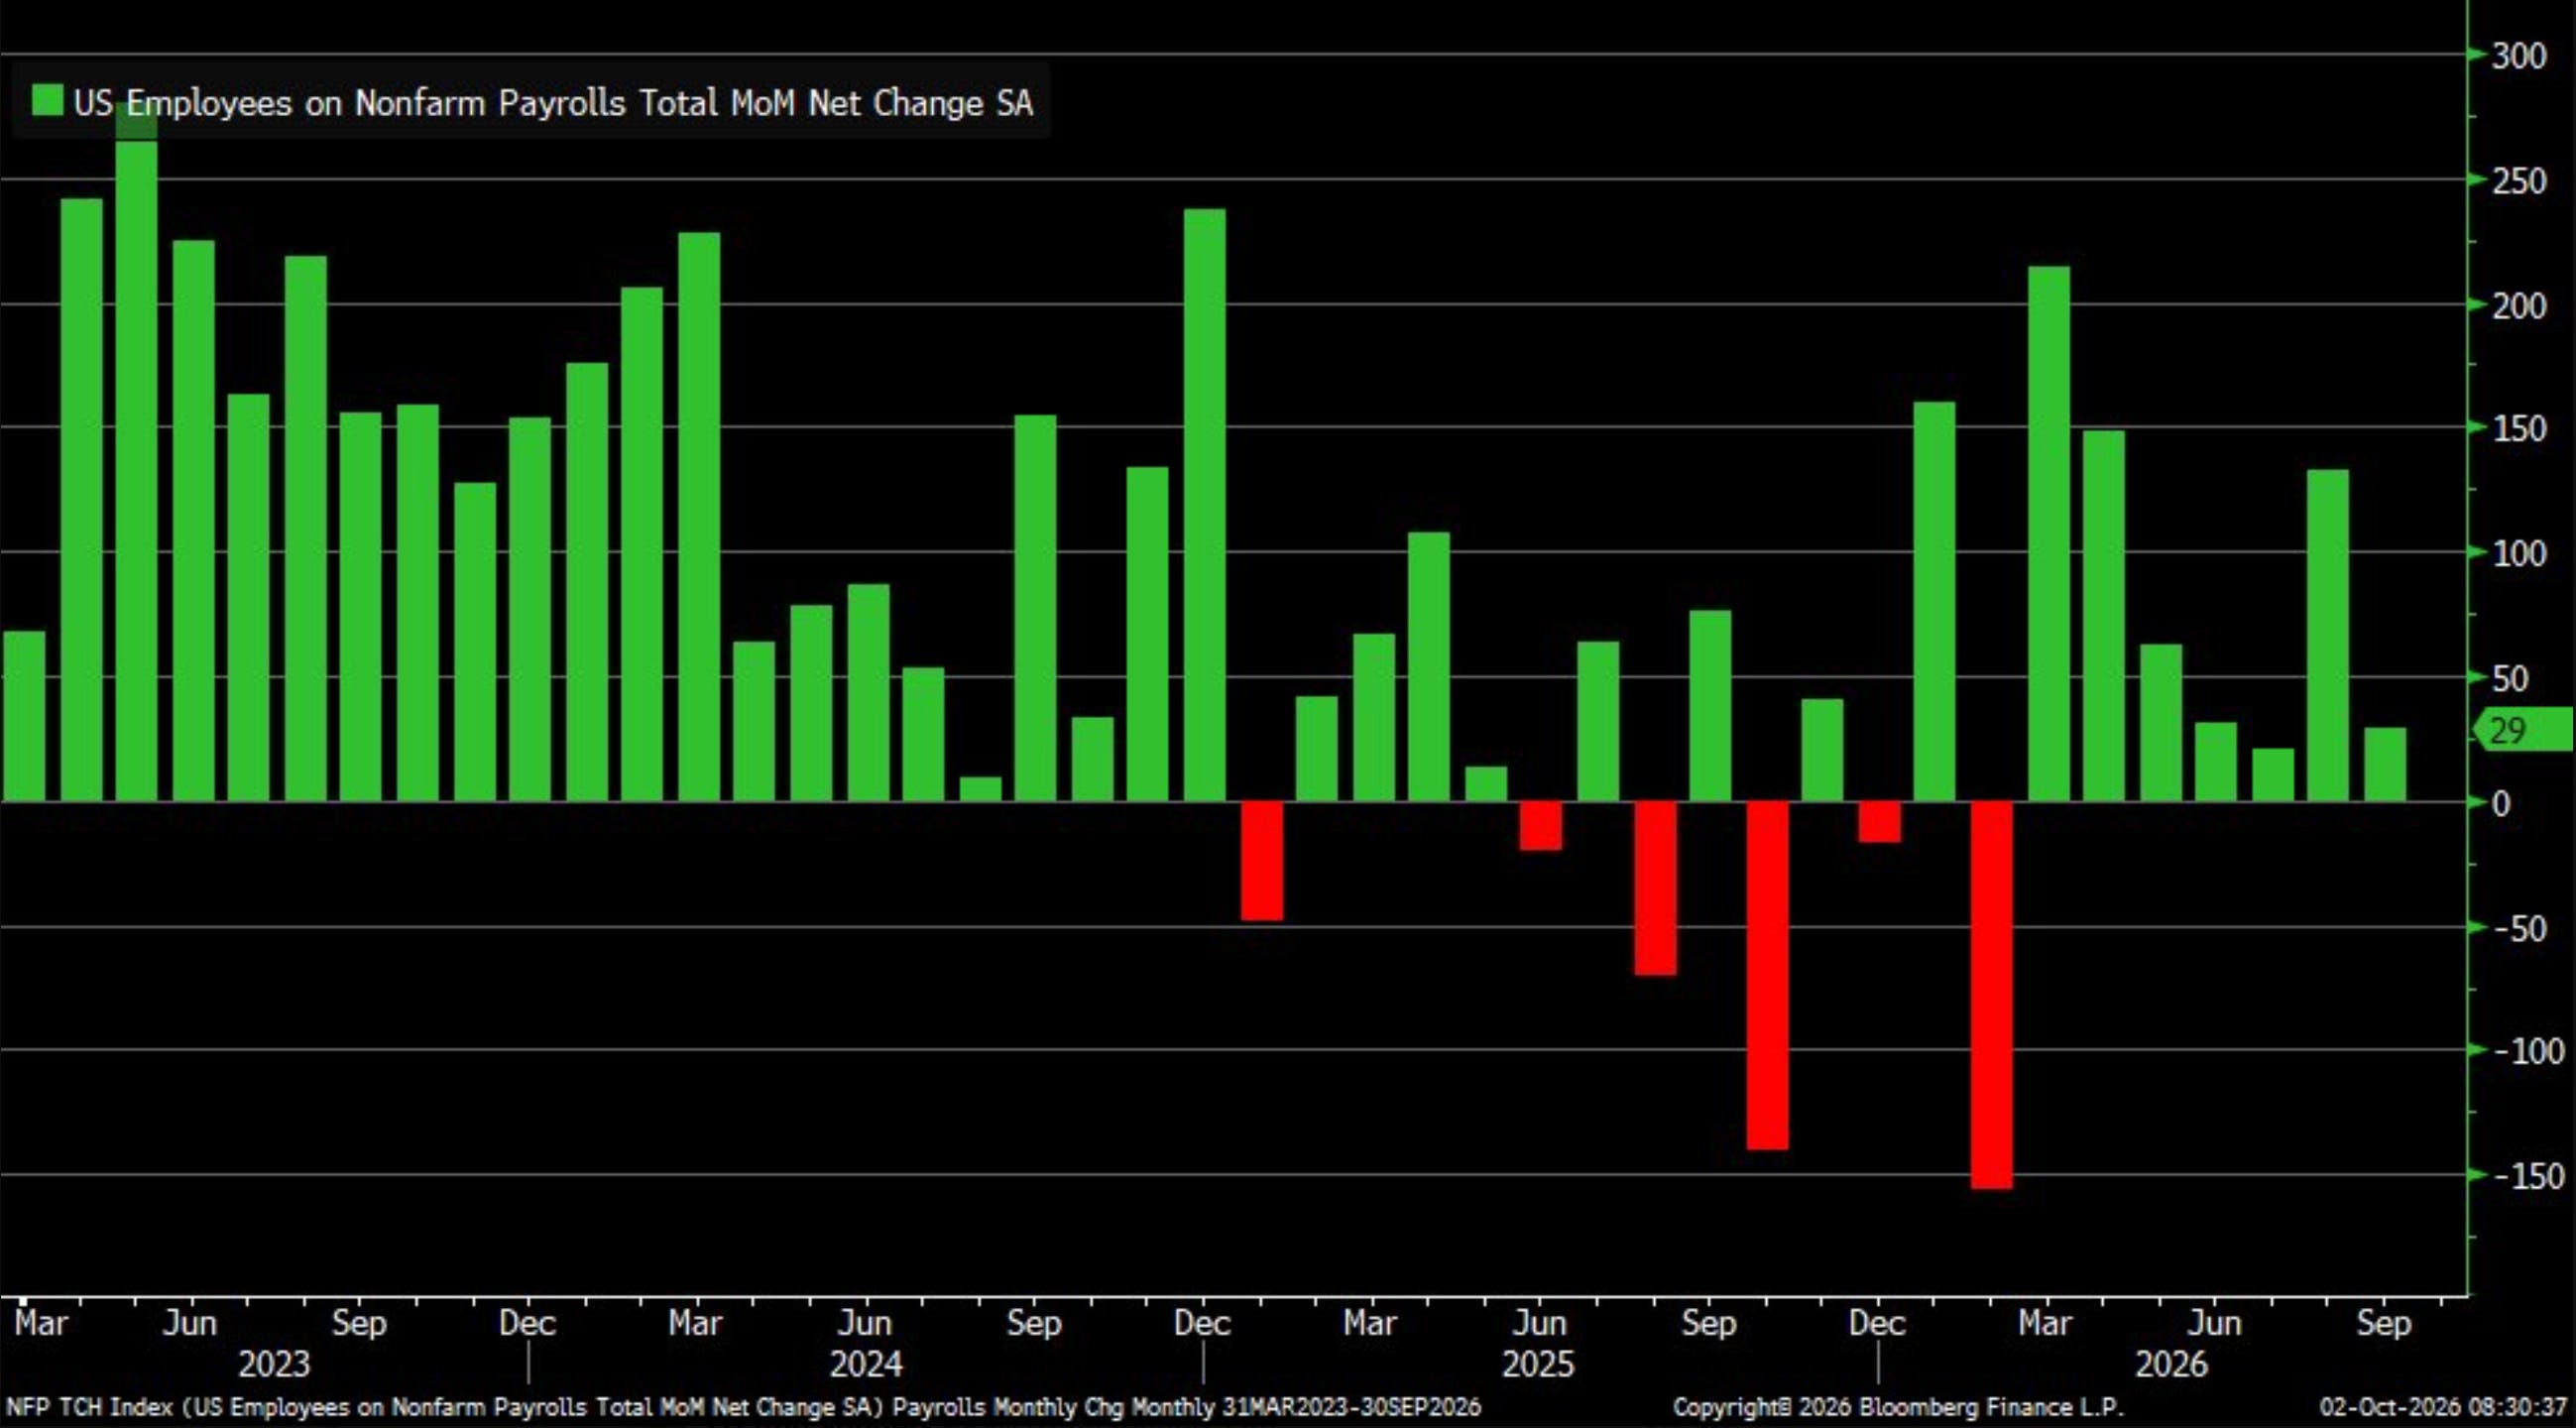
Then came Friday’s jobs report. Ho-hum. Payrolls came in at +29K vs. +90K expected. Unemployment ticked up to 4.2%. And August got revised down to +133K from +162K.
Not great. Not terrible either. I don’t think it changes the Fed’s path.
Now the good part. Q4.
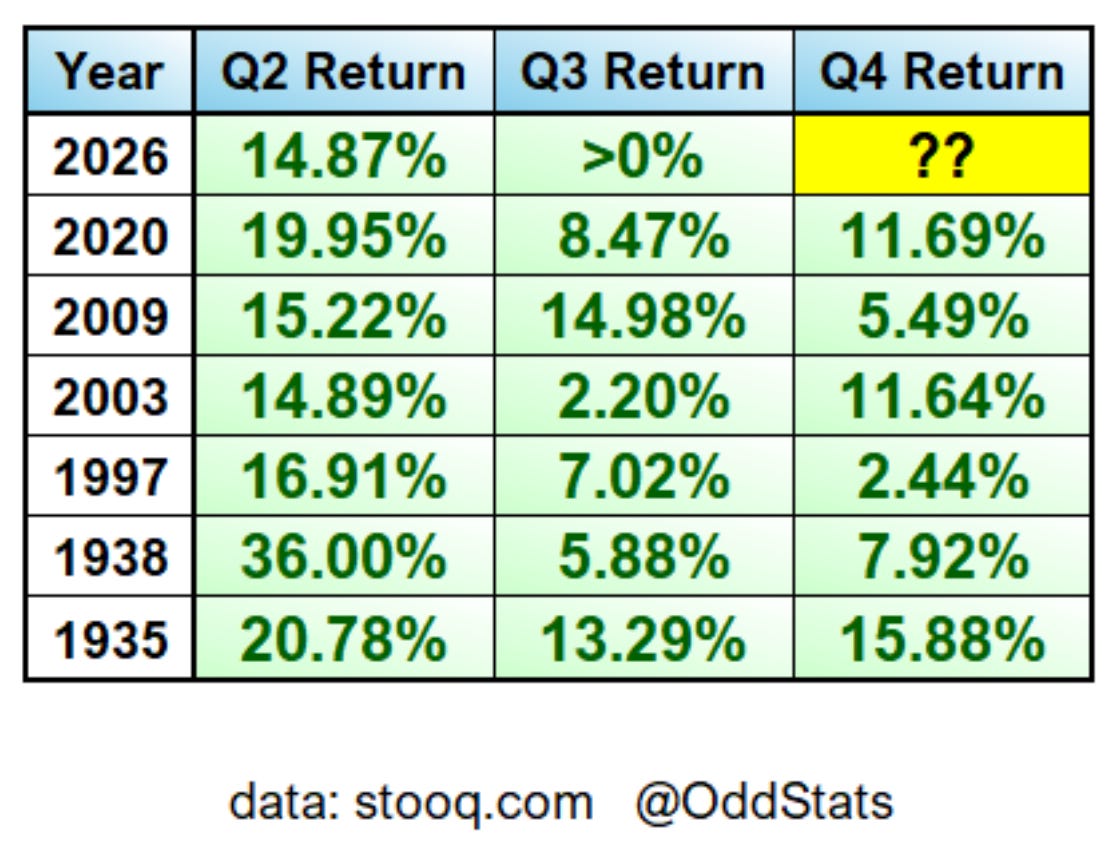
The S&P put up a nearly 15% gain in Q2 and followed it with a positive Q3. That has happened six other times since 1935. Q4 was higher every single time, with an average gain of more than 9%.
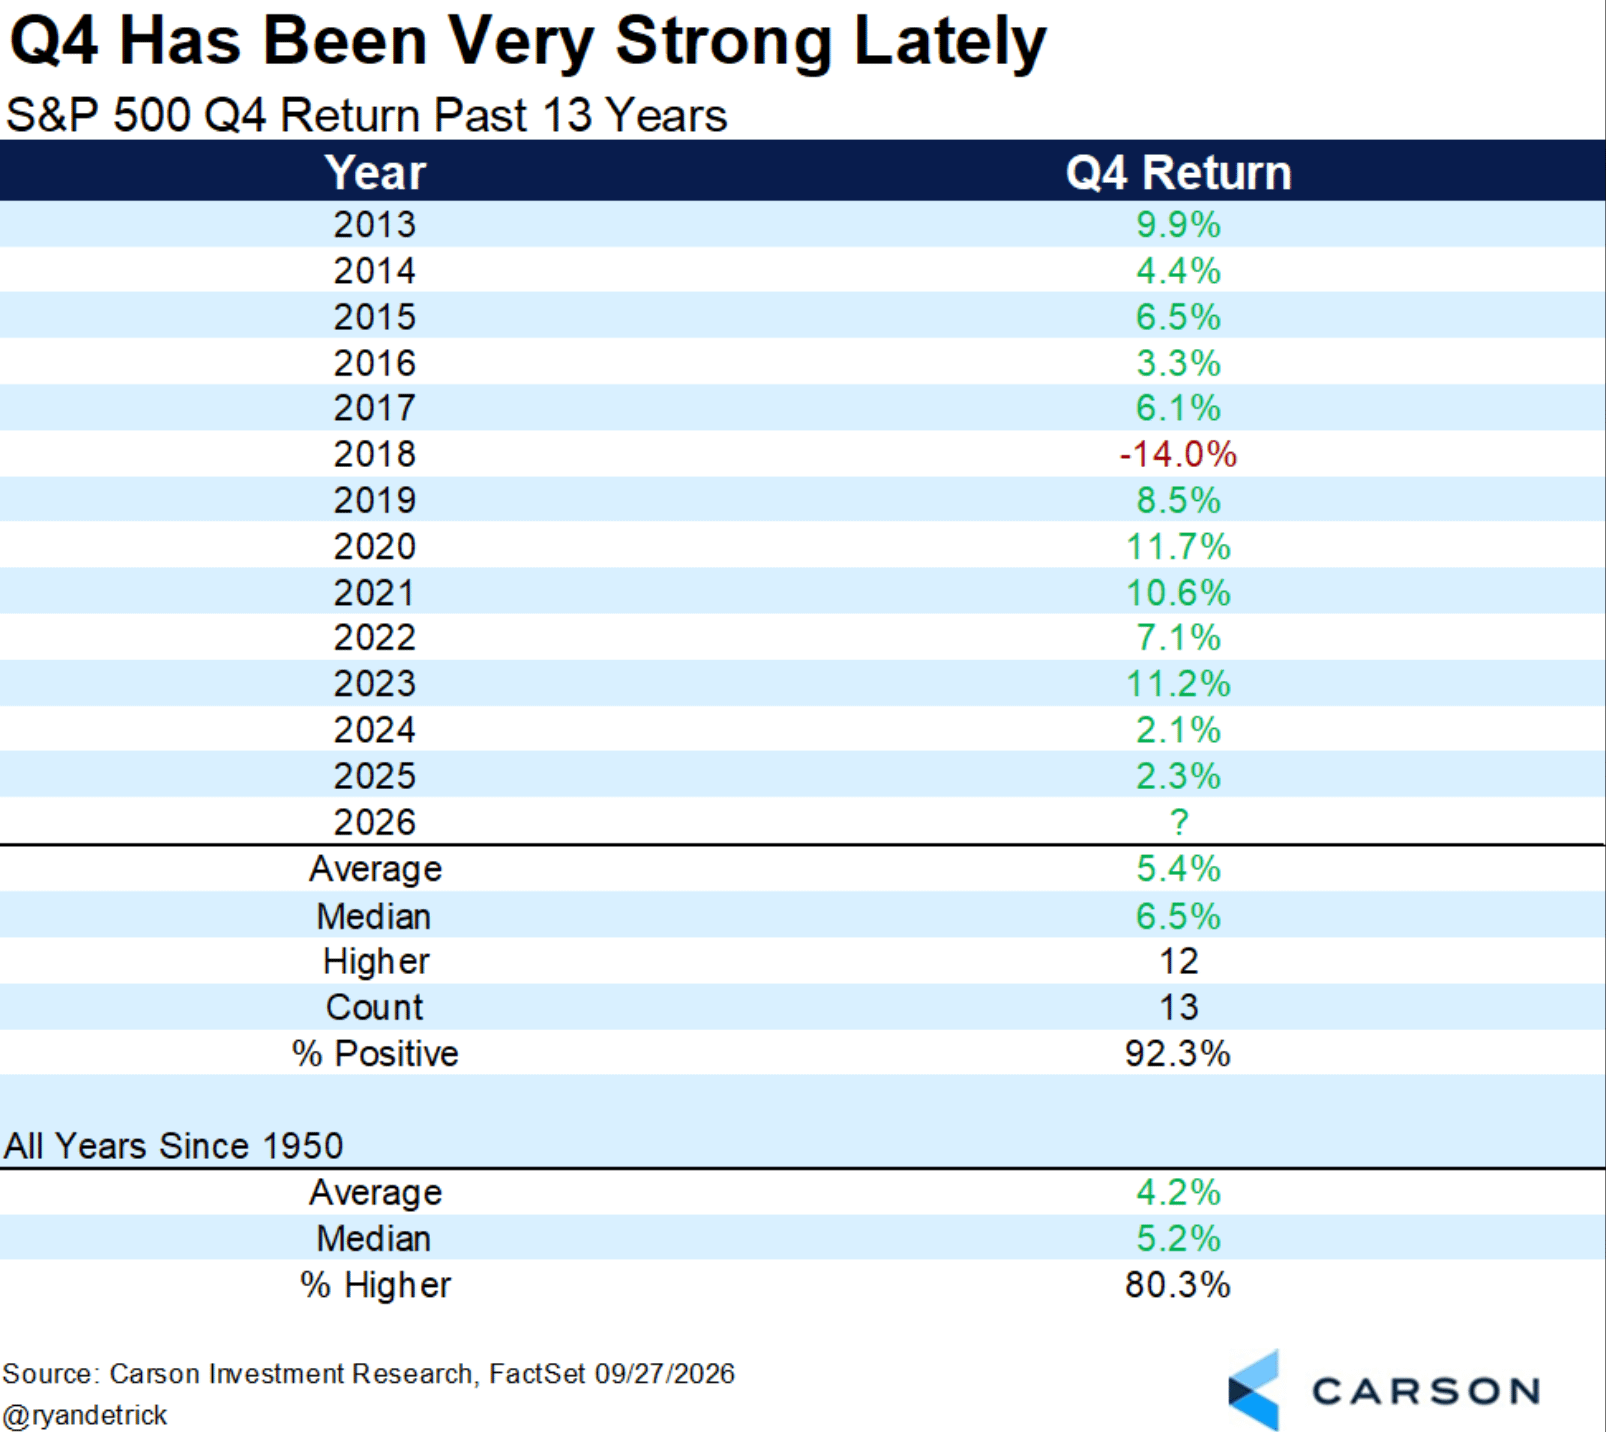
Zoom in on the last 13 years and it’s the same story. Q4 was higher 12 times. The only miss was 2018. The median gain was 6.5%.
I’ve had 7,900 as my year-end target since January. I’m not changing it. From Friday’s close, that’s another 2.3%. Less than an average Q4. I still expect some chop first, especially with the 10-year pushing toward 6%. Then a Santa Claus rally gets us there.
But first, let’s look under the hood. Because the index isn’t telling you the whole story.