Investing Update: Takeaways From January
What I'm buying, selling & watching
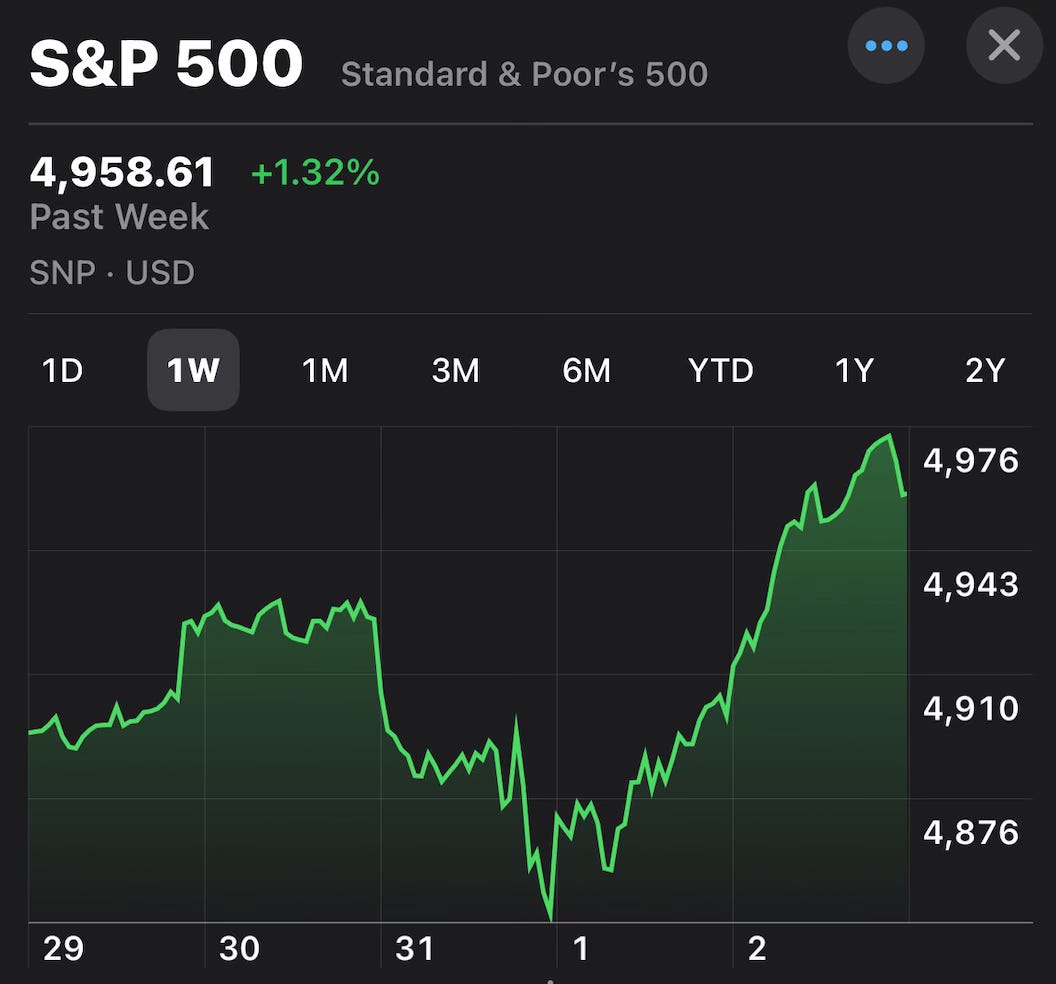
The week ended with the S&P 500 hitting yet another new all-time high of 4,958 and is now inching towards the 5,000 milestone level.
This comes during a week where Fed chair Powell said he doesn’t think it’s likely they cut rates in March. His exact words;
"I don't think it's likely that we will gain the confidence needed to cut in March. That's not the base case."
The stock market didn’t like that the Fed would be holding rates for longer and it closed at the lows of the day Wednesday and that was the low for week.
Things changed when an amazing jobs number came out at the weeks end. The expected number of adding 180,000 jobs was blown away by adding 353,000 jobs in January. The jobs number combined with solid earnings from most of the Magnificent 7, pushed the market to end the week at the highs.
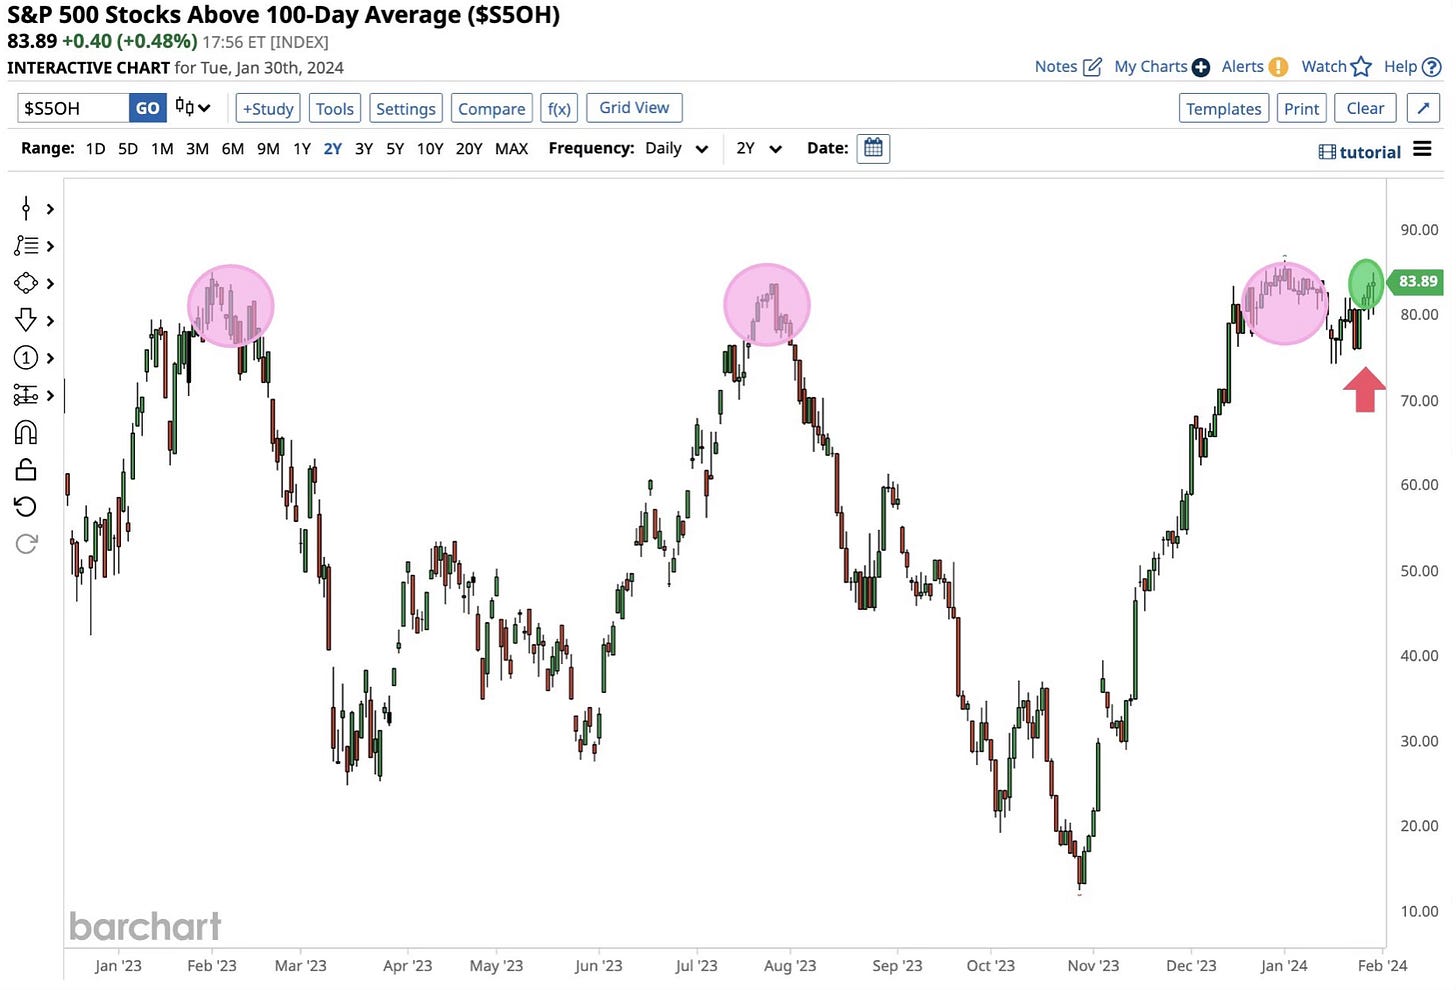
This bull market just continues to grind higher. In just the past three months we’ve seen the S&P 500 climb 20%. Currently 84% of S&P 500 stocks are trading above their 100-day moving average. That’s nearing an almost 2-year high.
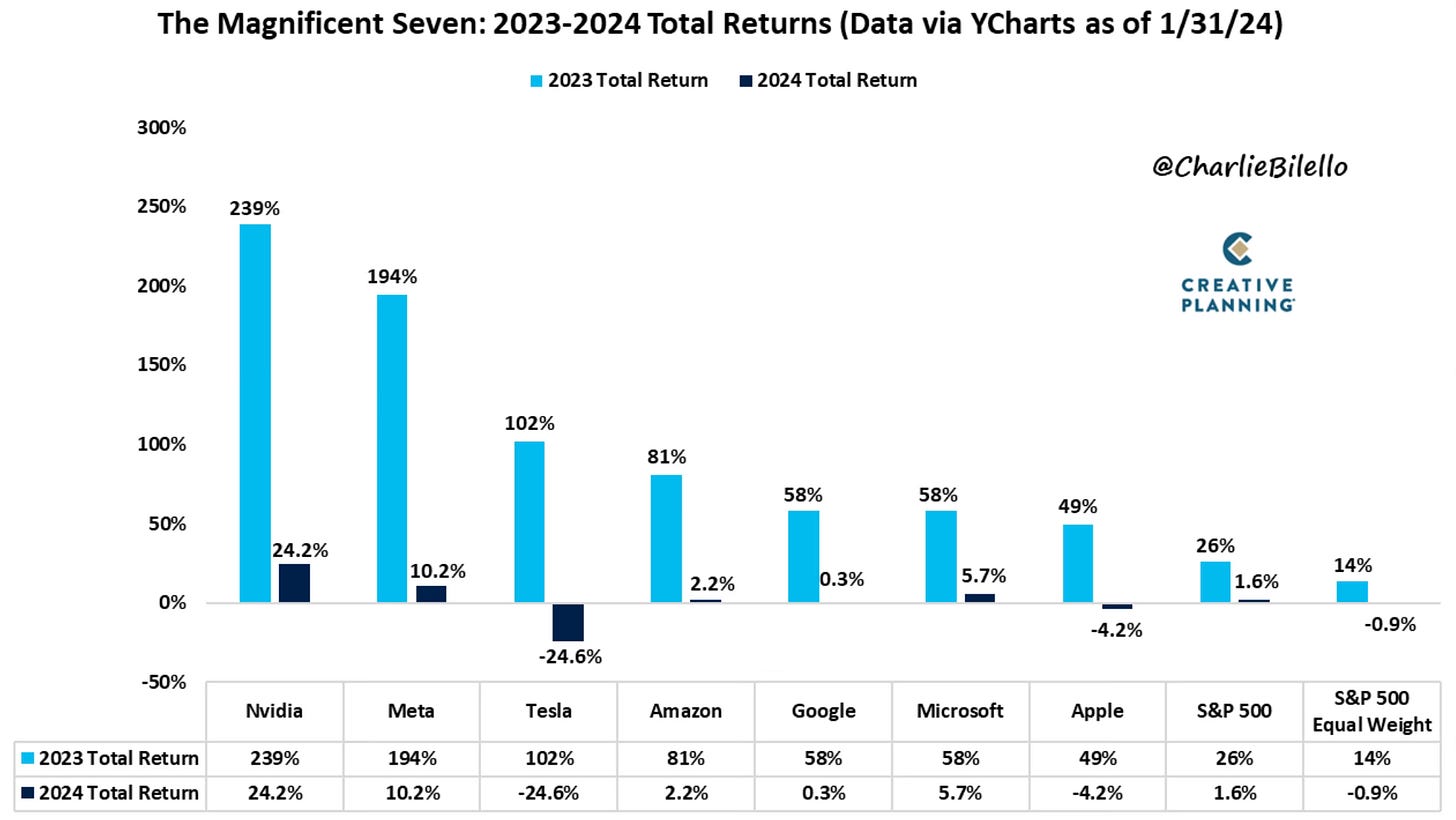
The market has been led of course by the Magnificent 7. Other than Tesla they have continued to show strength. This chart shows what the Mag 7 did in 2023 and how they’ve done through January.
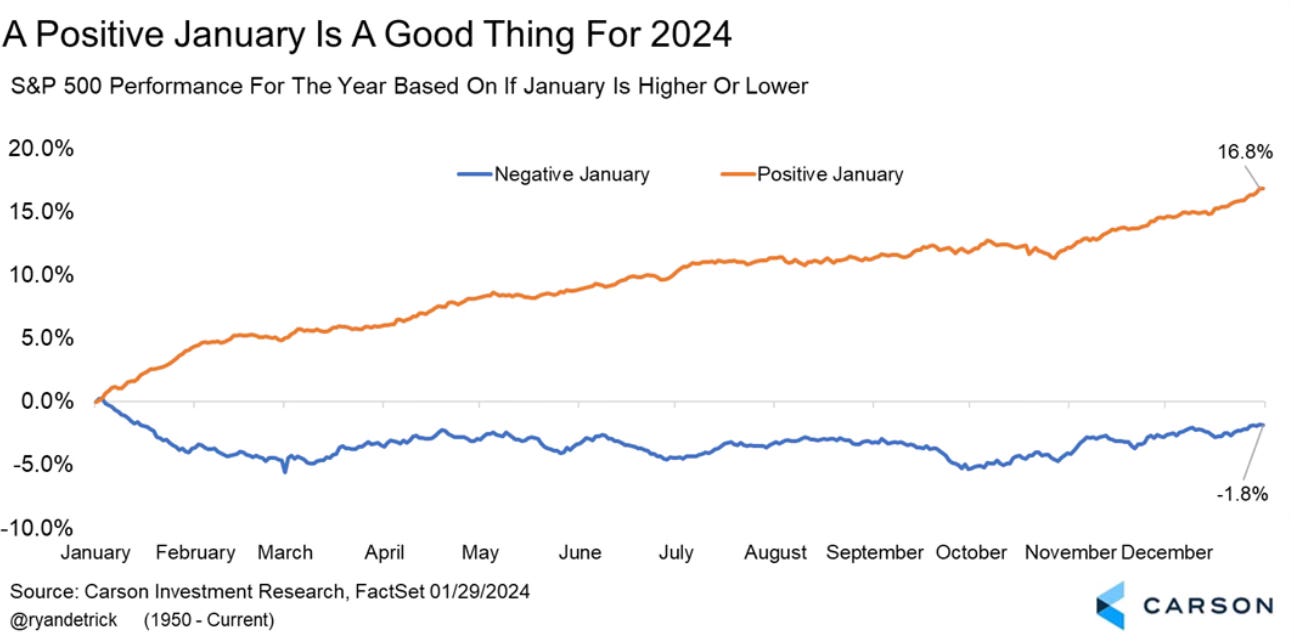
Having a positive January is a good sign for the rest of the year. I liked this chart from Ryan Detrick that shows just how important a positive January is versus a negative January for the trajectory of the year.
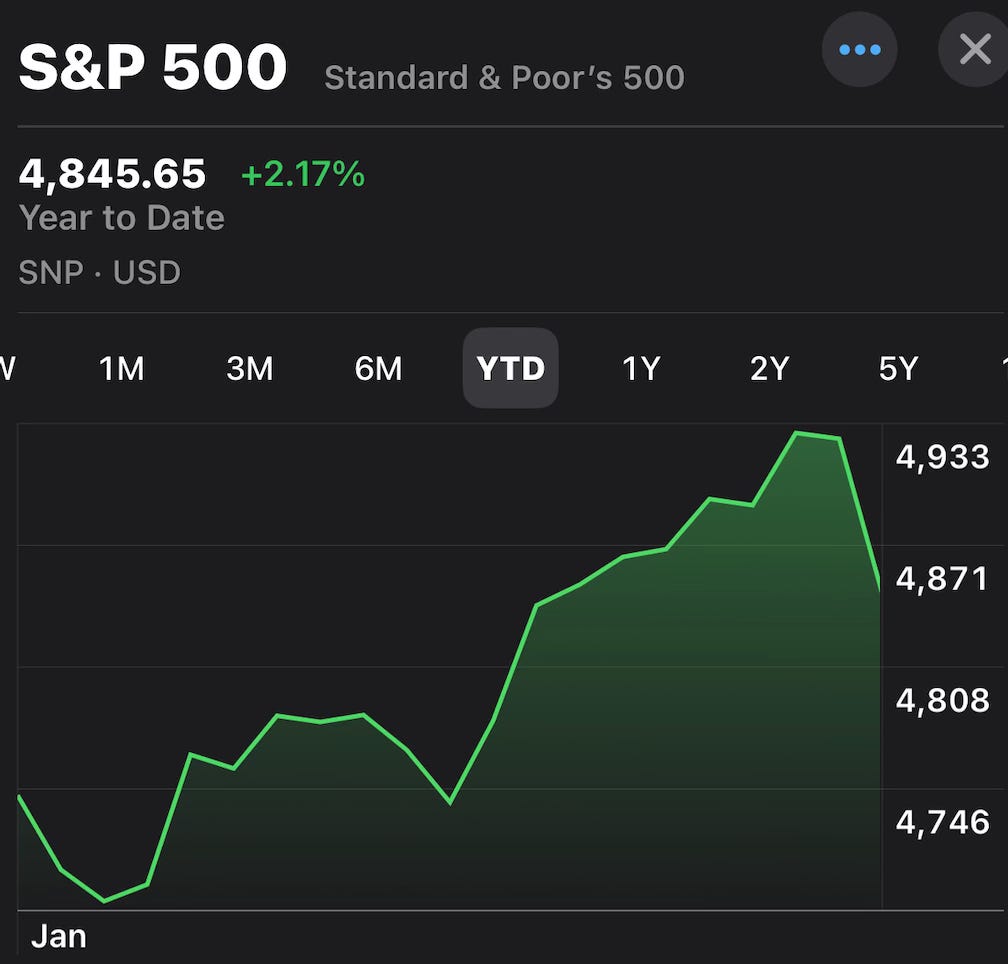
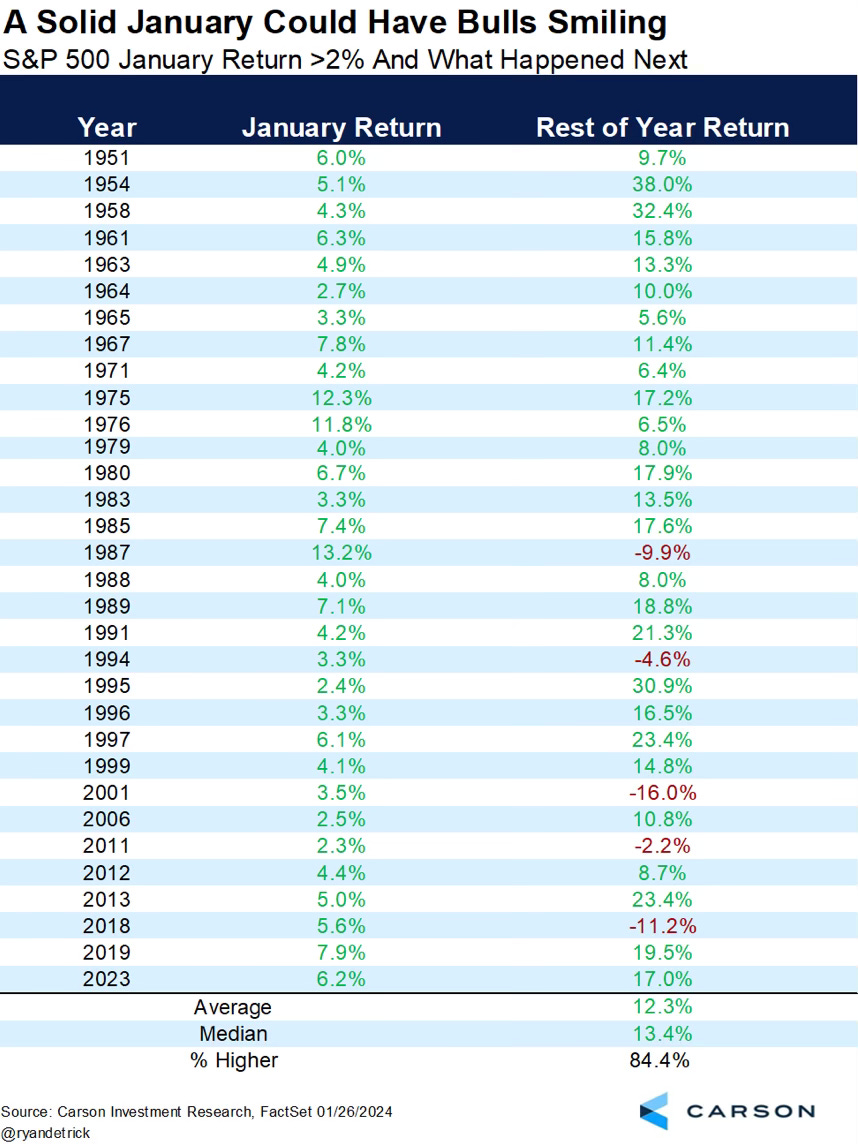
January was up over 2%. What makes that important?
Here is a chart that shows the 31 times that the S&P 500 gained 2% or more in January. The remainder of the year was up 84.4% of the time. Up an average of 12.3%. A good sign historically for a strong remaining 11 months of 2024.
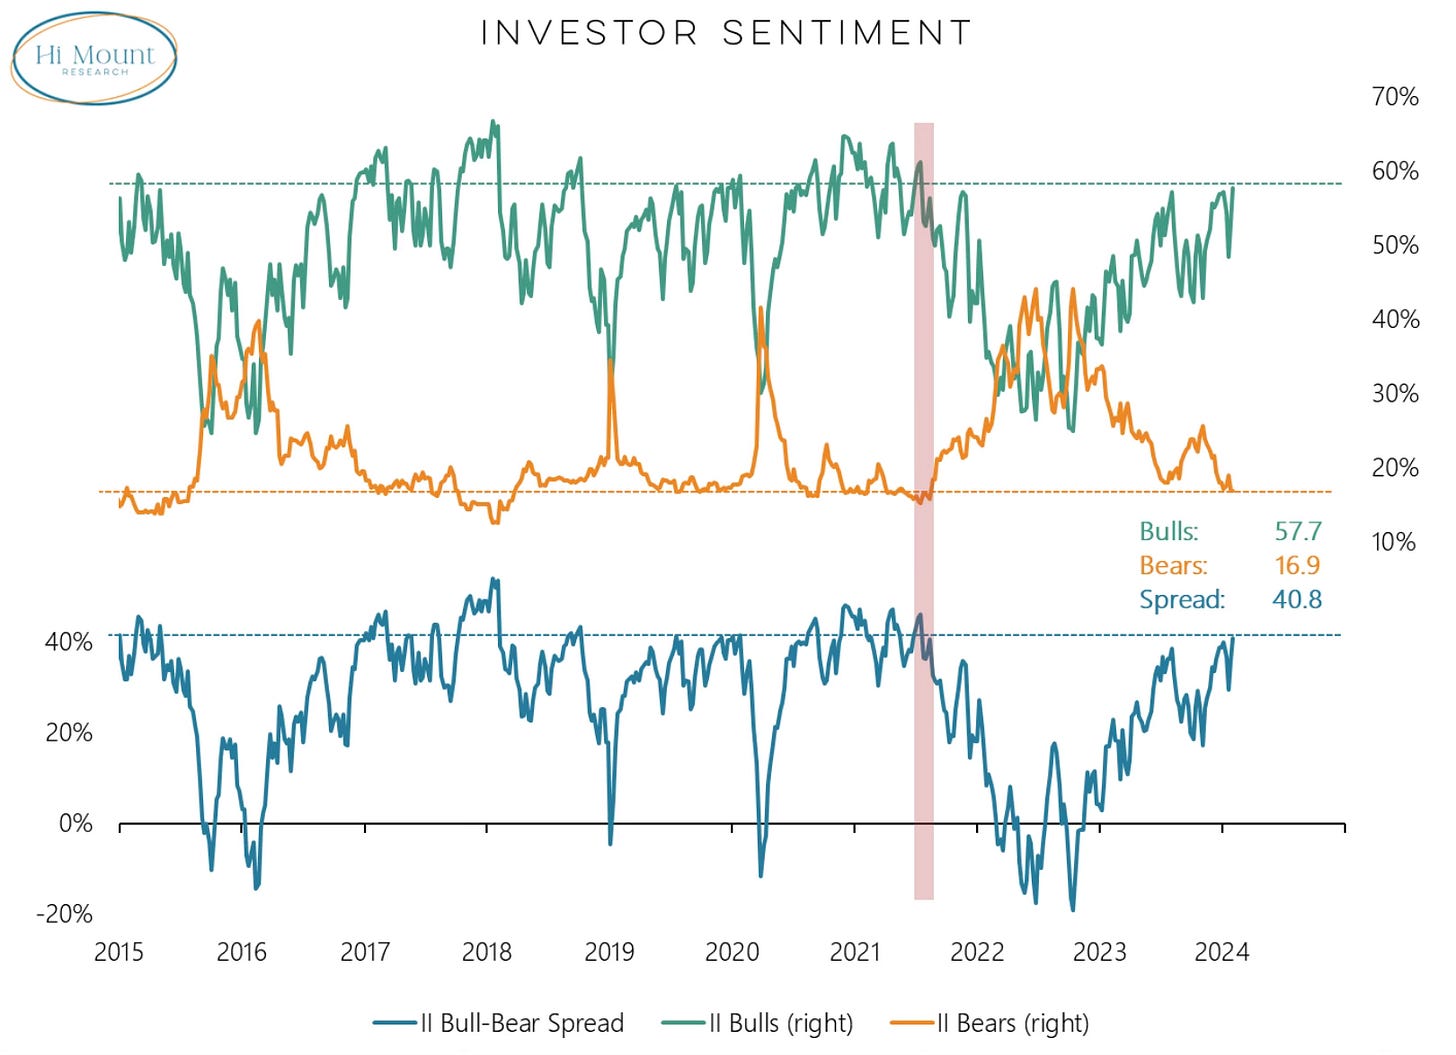
Investor sentiment is showing a similar outlook. The spread between the bulls (positive sentiment) and the bears (negative sentiment) is at the largest spread since summer of 2021. A lot of bullishness out there right now.
History Shows Further Momentum
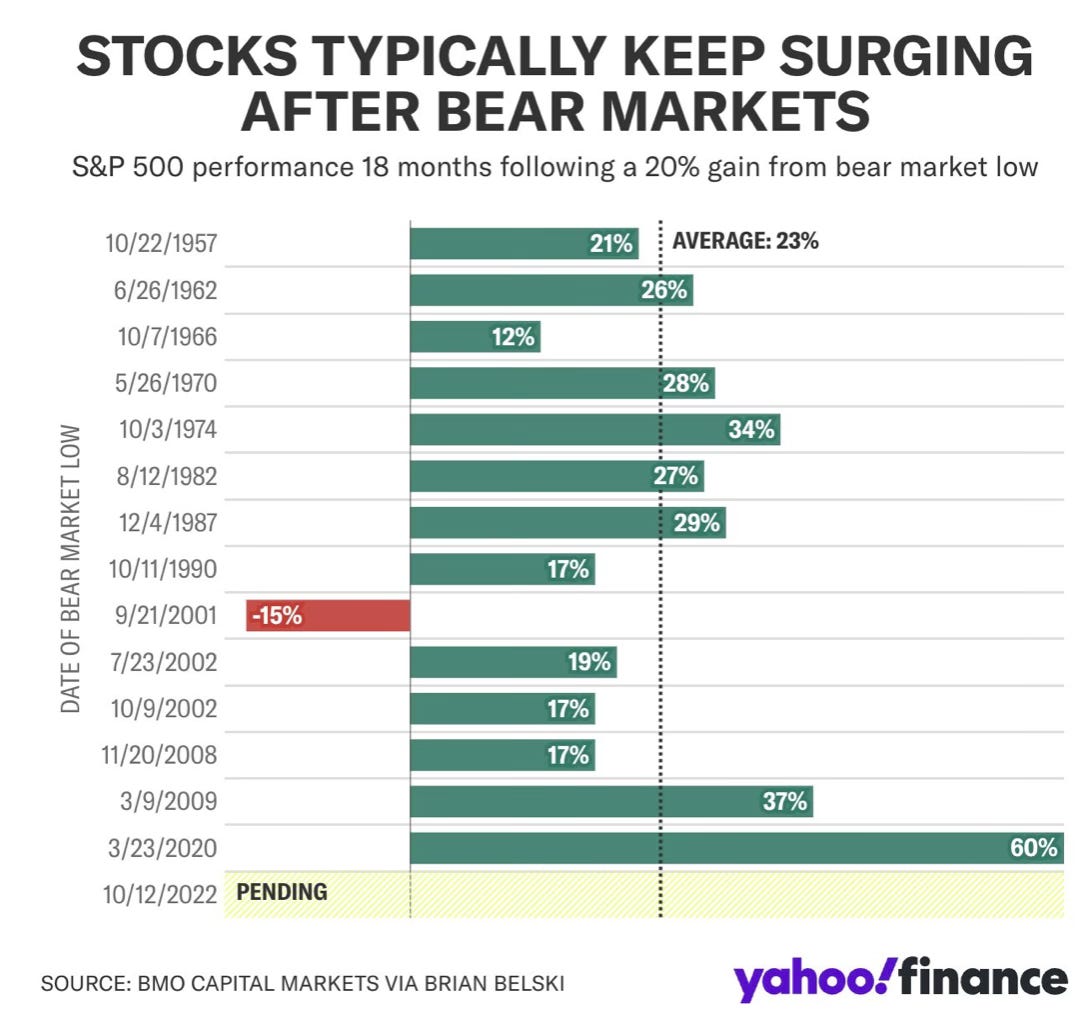
Once bear markets end, stocks will typically continue to surge. This chart shows what the S&P 500 has done 18 months following a 20% gain from the bear market low. The average gain is 24%. We will see how far this one rallies.
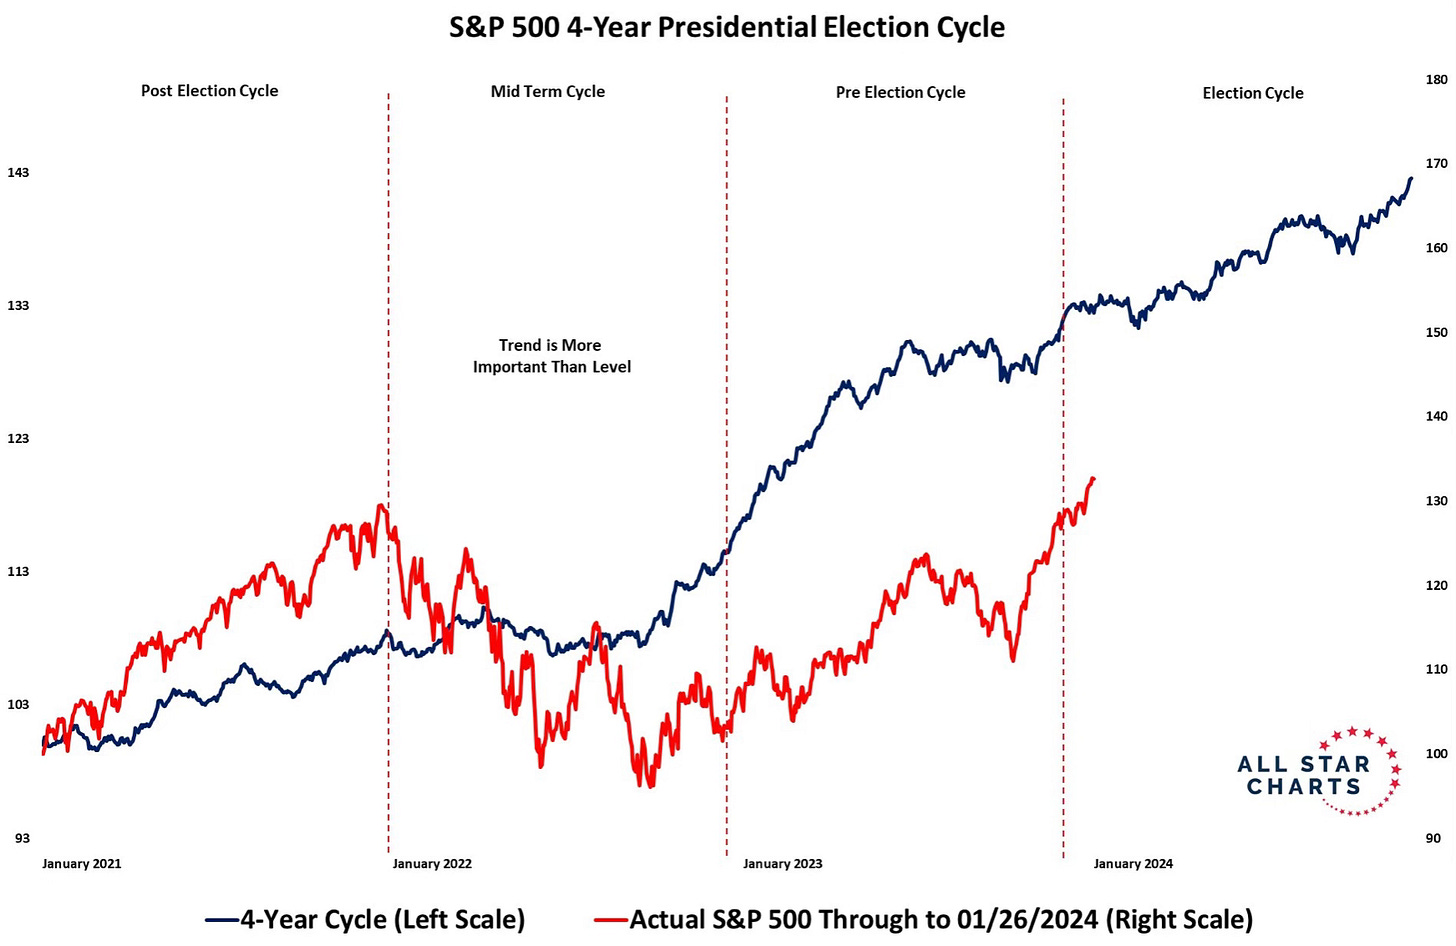
The presidential cycle which I’ve talked about a number of time keeps showing up and on its historical trend. As we enter the election cycle you can see from here on out it is up and to the right. This year is off to a better start than the typical 4-year cycle. This is showing that there is the possibility of a lot of green ahead.
Emerging Markets Attractive?
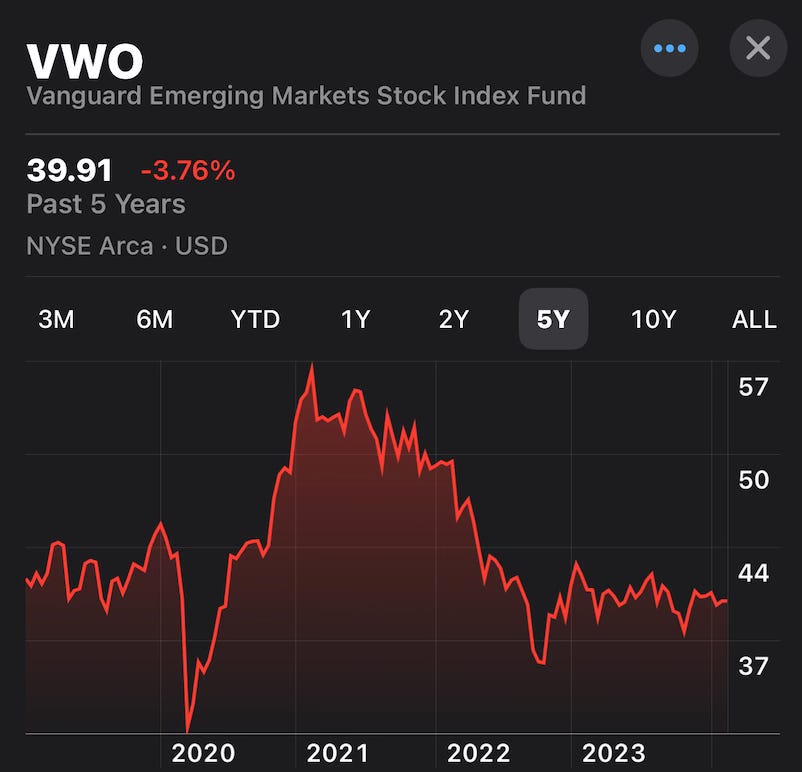
Probably the most surprising chart I came across is what is happening with the inflows into emerging markets. Last week was the largest weekly inflow into emerging markets ever.
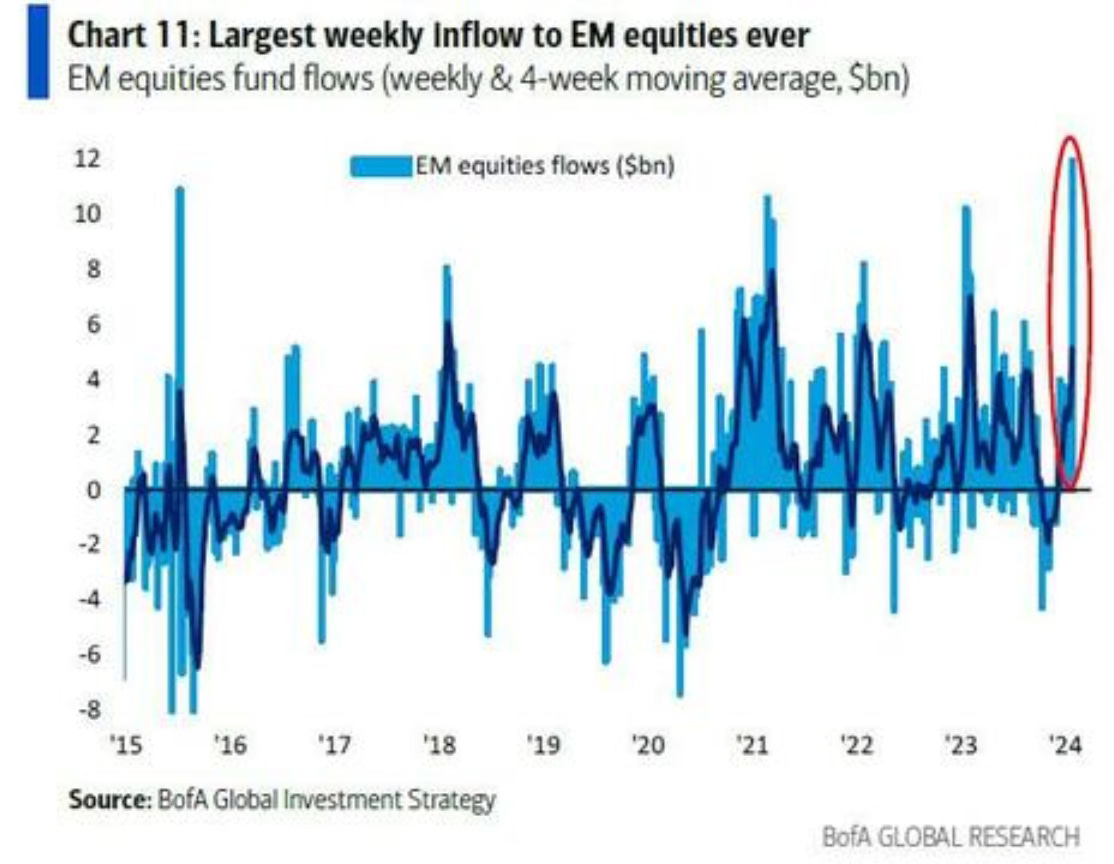
For years emerging markets have underperformed. Looking back 5 years this asset class has been basically dead money down 3.76%. Buying opportunity? Some investors sure think so. I mean at some point you would expect a sustained rally.
Sector Performance
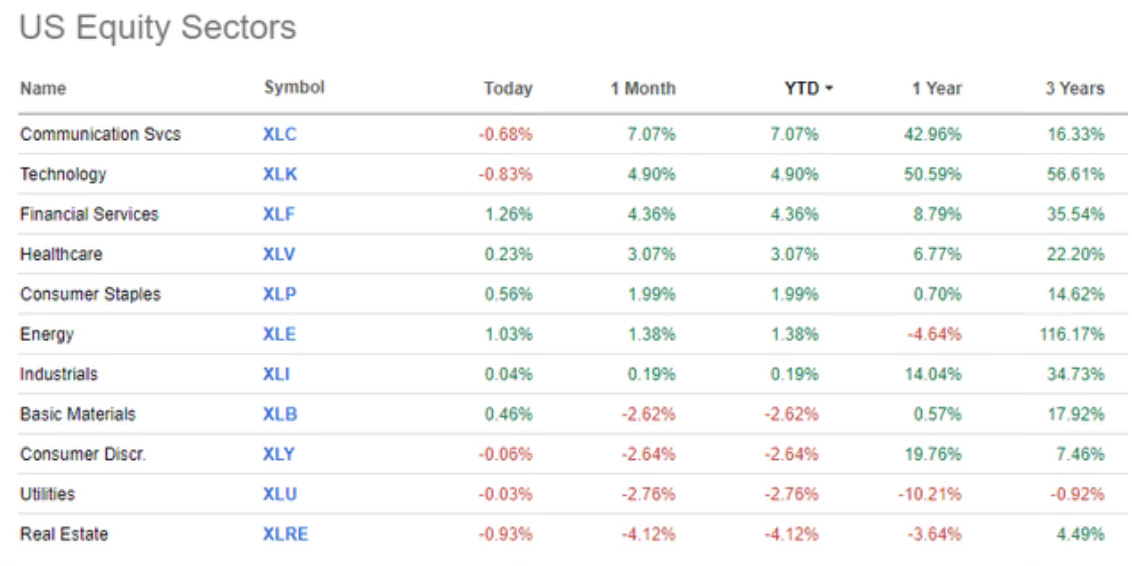
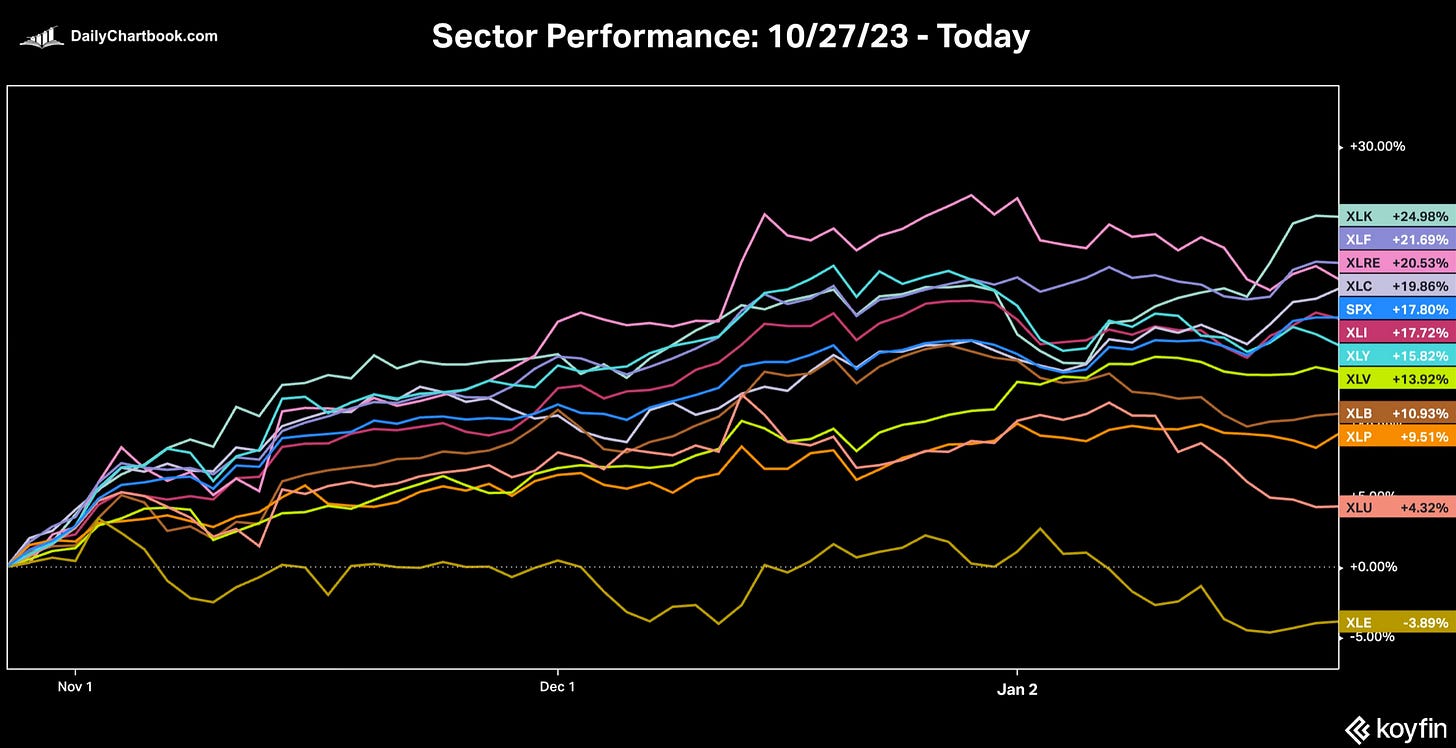
This week I wanted to do some research on sector performance. Sector performance can give a good read on where things are at in a market cycle. Sector rotation can usually signal where many stocks within those sectors could be headed. Here is the sector performance over the past month, YTD, 1 year and 3 years.
This takes a look at how sectors have performed from the October bottom. Technology +24.98%, financial services +21.69%, real estate +20.53% and communication services +19.86% have all outperformed the S&P 500 +17.80% during that time. Only energy -3.89% has been negative.
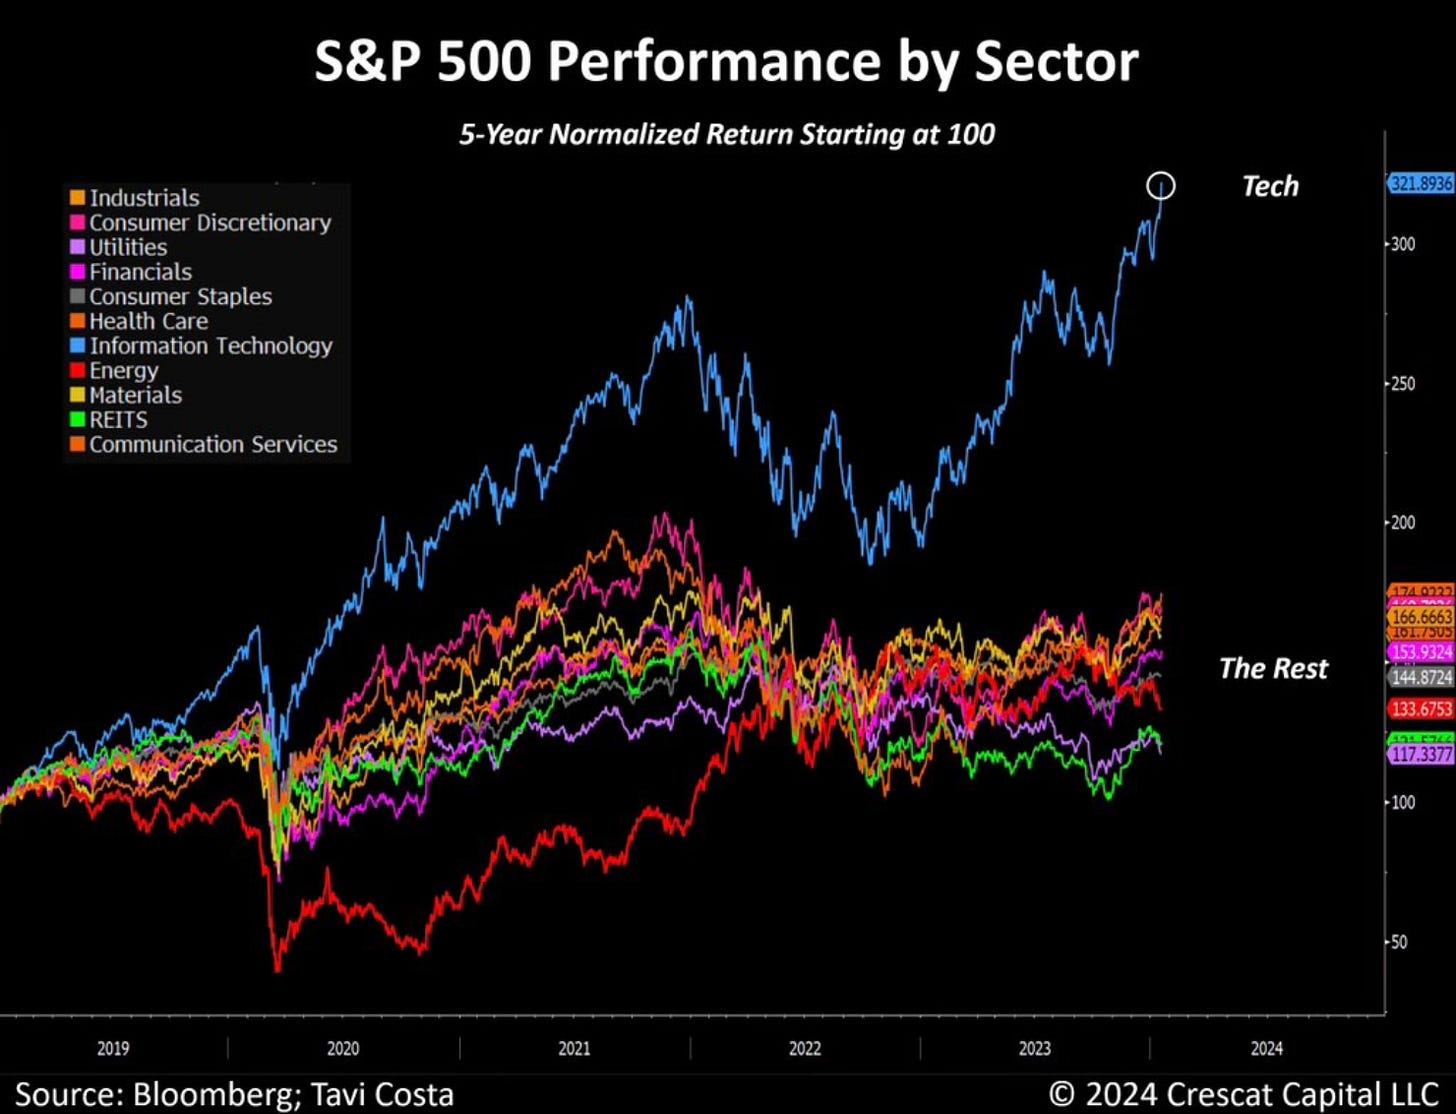
If you zoom out a little farther to see a 5-year performance by sector, you can really start to see the significant outperformance by technology.
Going back to 1999 this chart shows what each sector has returned every year.

Household Debt
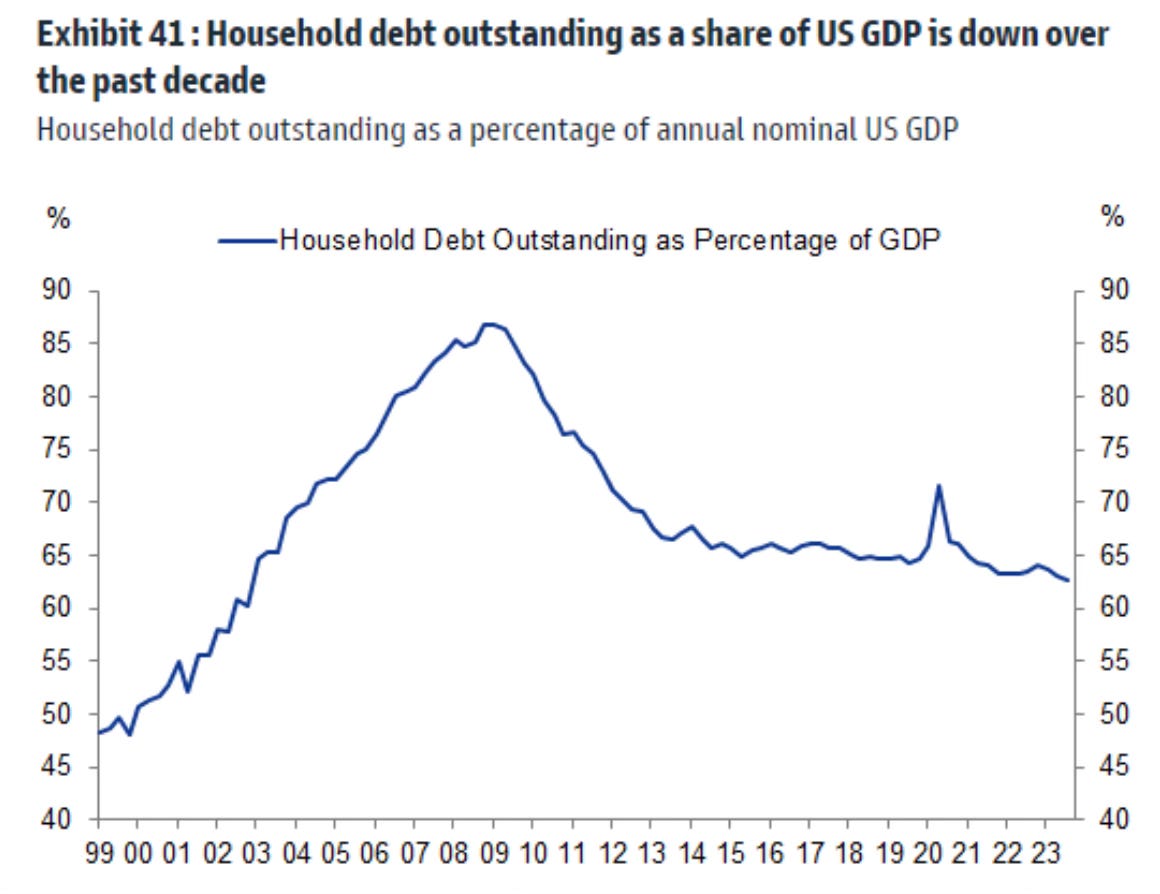
We’ve heard a lot about the amount of debt consumers are carrying. I continue to hear and read that savings are all exhausted and credit card debt is rising. People are said to be living off credit. I think a lot of that is to stoke fear. Here are two charts that show consumers continue to be in a great spot.
Outstanding household debt as a percentage of US GDP has actually fallen over the past decade. It’s now even below pre-pandemic levels.
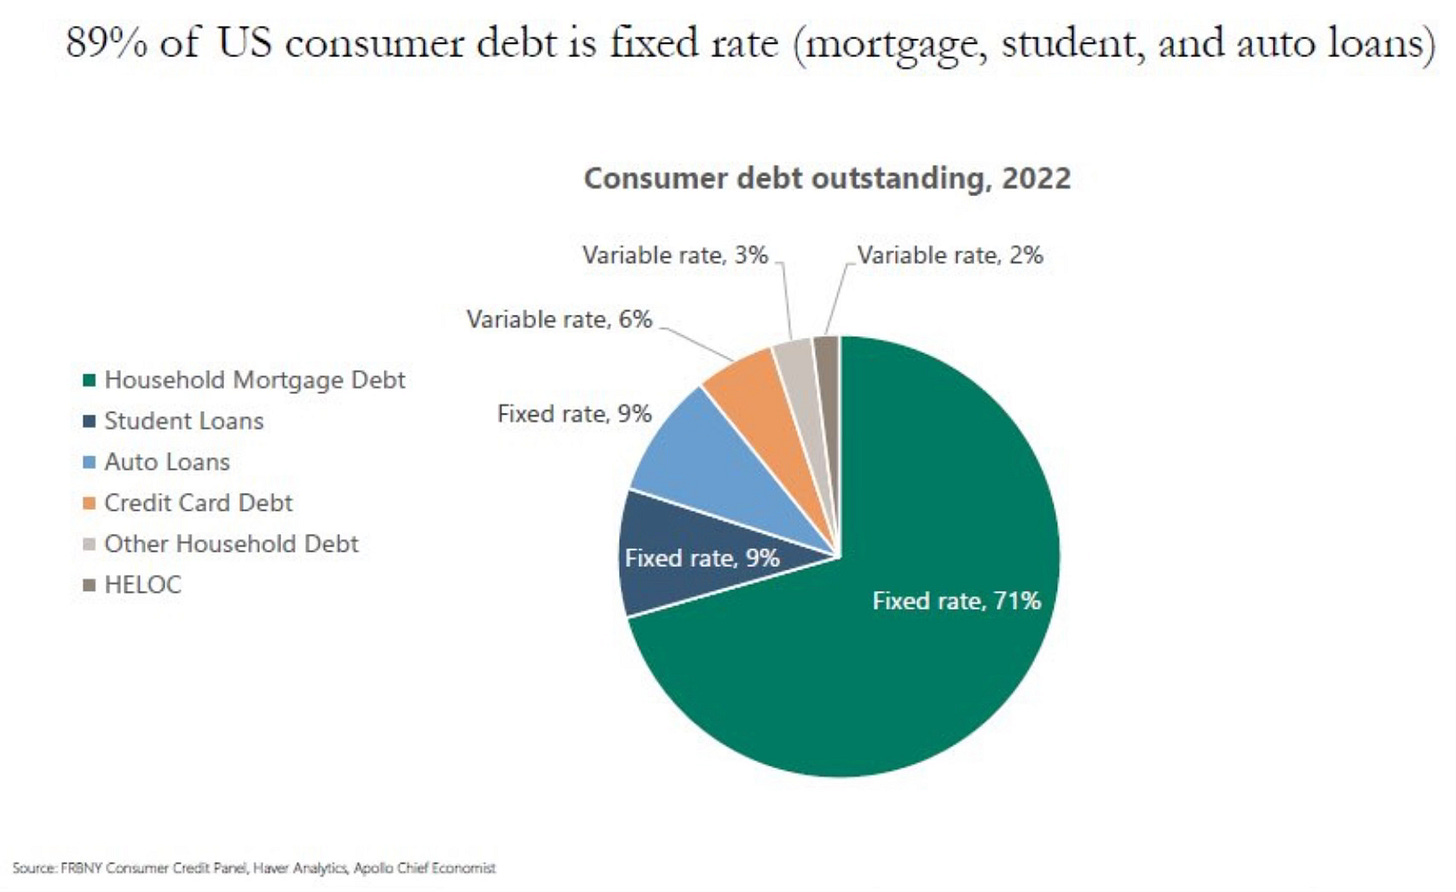
Then of US consumer debt (mortgage, student and auto loans), 89% of that debt is at a fixed rate. Only 11% (credit cards, HELOC and other household debt) have a variable rate. This is why the Fed’s hiking of rates have had very little impact on the majority of consumers. It’s part of why they’ve continued to spend and be so resilient.
Upcoming Earnings
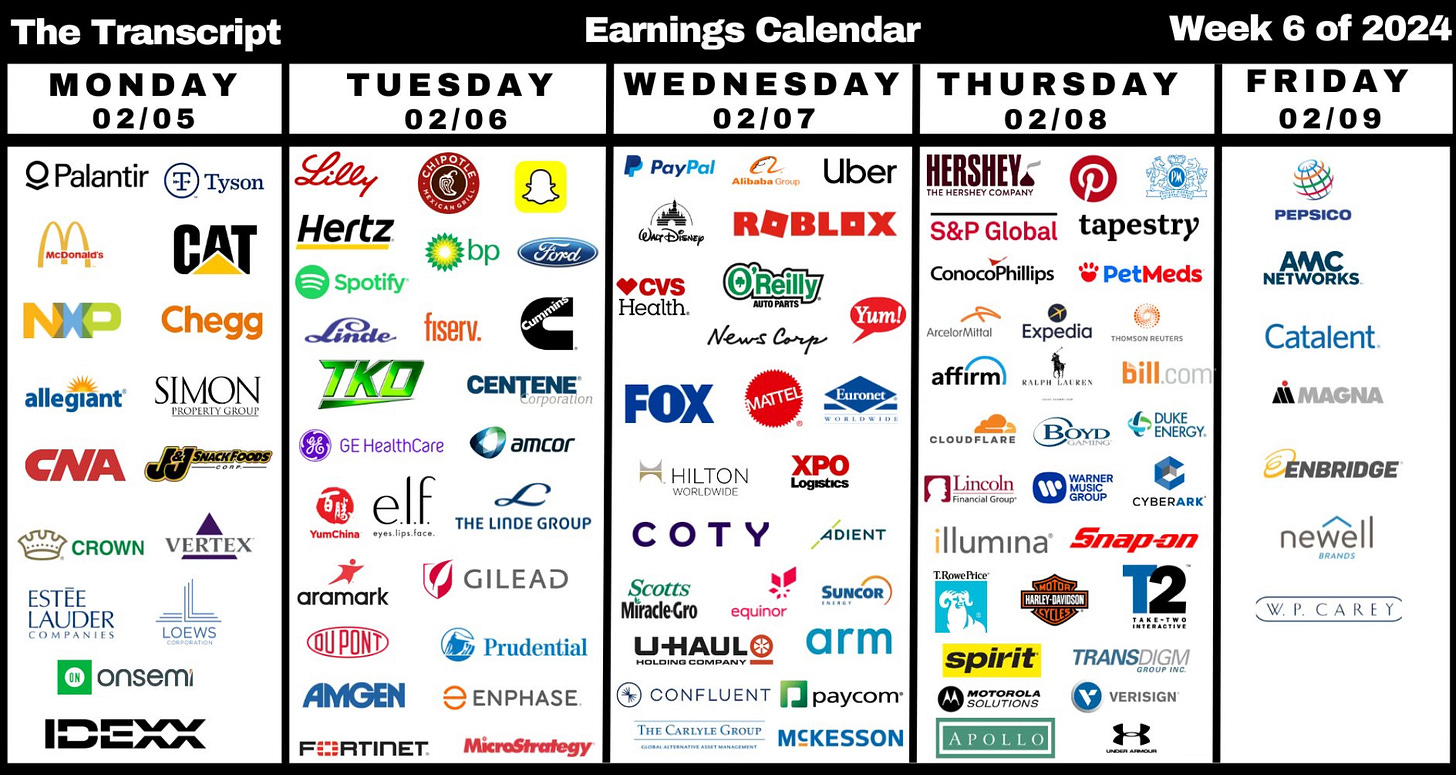
Moves I’ve Made
S&P 500 Index I added to my S&P 500 index holding on Thursday of this week.
Tesla After Tesla’s disappointing earnings and conference call, I decided to add to my position. At first I didn’t plan to add but it fell further than I had expected it to. I added at $189, which is the same price that I had added to my position back in November of 2022. I wrote about it here, Investing Update: I Went On a Buying Spree.
I’m still long term bullish on what Tesla is doing with their technology. Over the years when the news is the worst for Tesla, it has turned out to be times to buy. I think many miss the point that Tesla is continuing to innovate beyond electric and self-driving cars, into robotics and AI. An area of Tesla that I still think is undercovered is the Optimus robot advancements. Now it’s folding shirts! See the video here.

This may have been missed over the holidays but I just feel this is rather big news from what Morgan Stanley said regarding what the potential of Optimus is.
You can read more about the Morgan Stanley research report from Jon Markman in Forbes, Tesla's AI Revolution: Morgan Stanley Predicts Explosive Growth.
The Coffee Table ☕
Michael Batnick wrote one of those posts that we read and then the next time it happens we need to remember it. He wrote Lessons From the Bear Market. All of these are things that investors should always remember but forget about when we’re in a bear market. When we’re in the next bear market, this is one of the things we should read.
JC Parets wrote a piece on one of the topics I was going to cover in this Investing Update about how so many are still saying that this is a market rally only about tech. That isn’t the case at all. When I read what he wrote, I said to myself he just covered it perfectly with the data and charts to show why. Nothing else for me to say. “Only Tech Driving This Market”.
Something I had not thought about until I saw the title of this post by Ben Carlson is that things really are as good as the early 1990s. This is the Best U.S. Economy Since the 1990s. It’s perfectly timed and Ben has some great points and charts to show just how good things are right now. Things seem almost too good.
I enjoyed Callie Cox’s post Mythbusting record highs. How many times have these six myths ran through our minds about investing at all-time highs. I’ll bet these come up for you every time the stock market hits all-time highs.
Thank you for reading! If you enjoyed Spilled Coffee, please subscribe.
Spilled Coffee grows through word of mouth. Please consider sharing this post with someone who might appreciate it.
Order my book, Two-Way Street below.

