Investing Update: Stocks On The Radar
What I'm buying, selling & watching
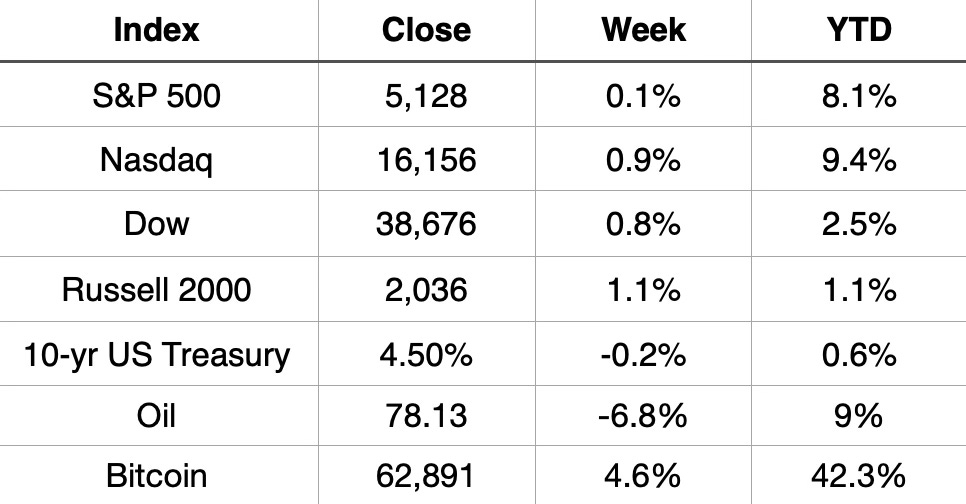
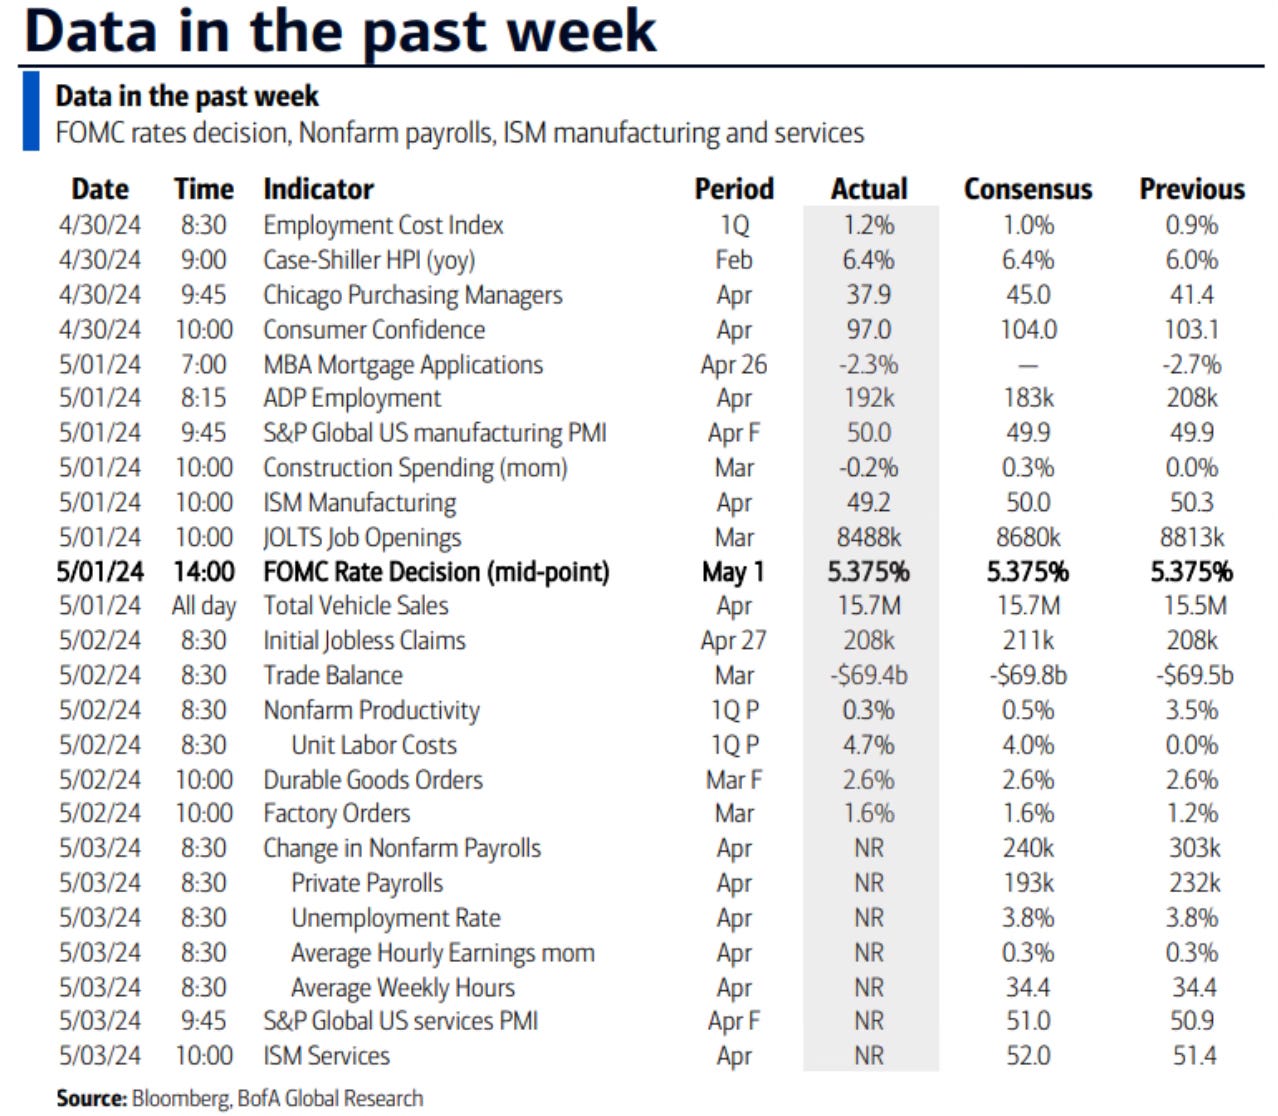
The week ended on a high note for the stock market after a weaker than expected employment report. That increased the chances of rate cuts from the Fed.
It sent the Nasdaq up 2% on Friday and the S&P 500 up 1.26% on the day.
This also comes after what Fed chair Powell said on Wednesday.
"It's unlikely that the next policy move will be a hike... We don't see evidence that policy isn't restrictive."
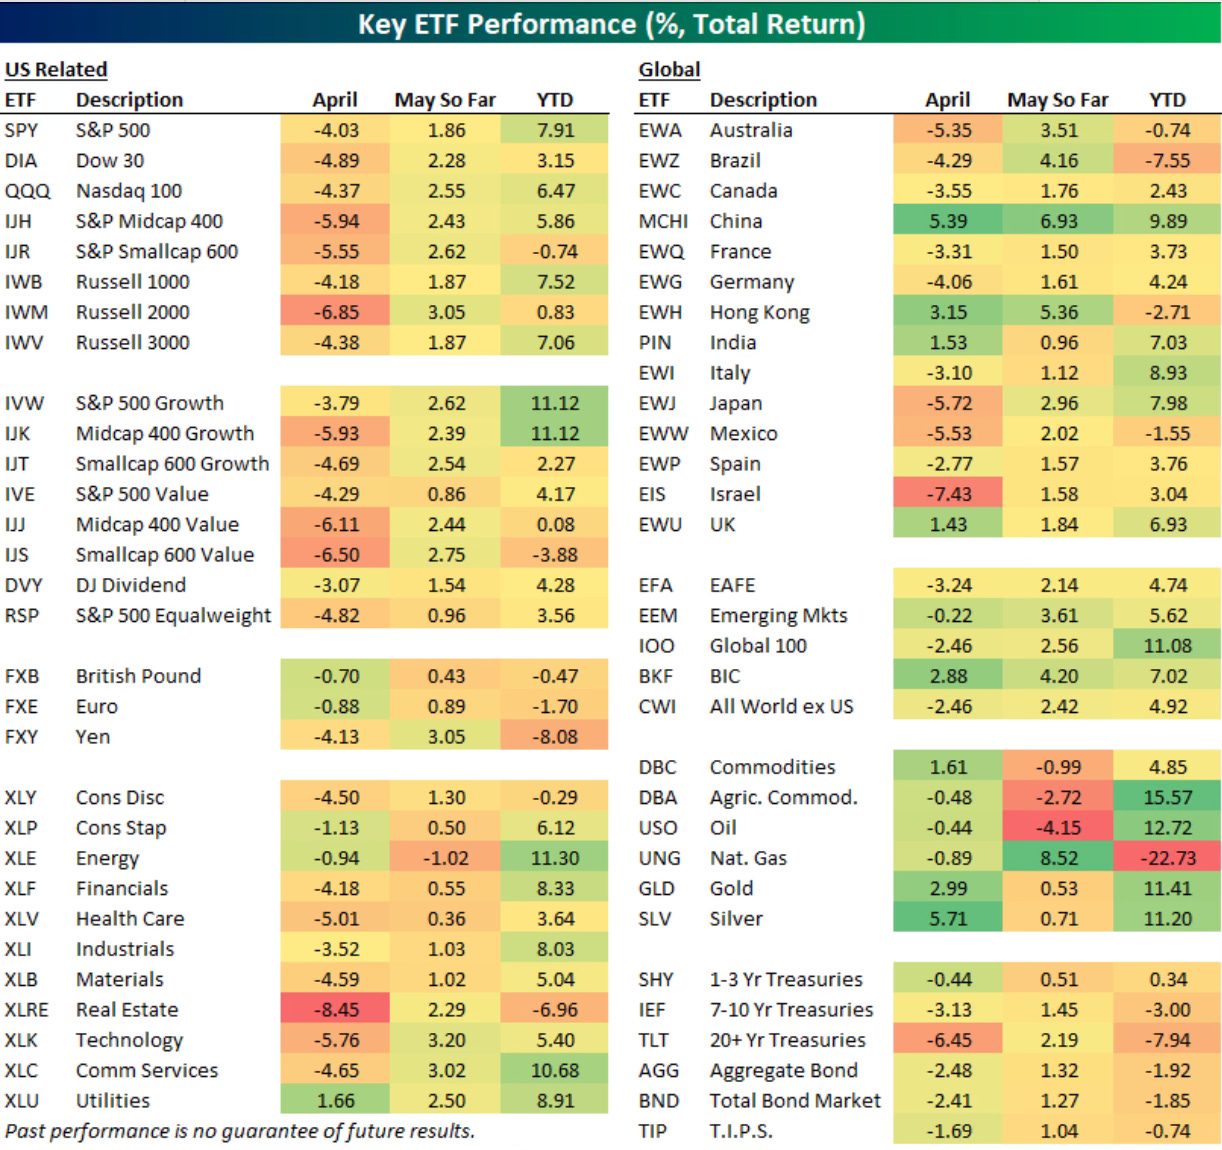
This is welcomed following April which had the first pullback of the year and broke the streak of 5 straight positive months. It was the worst month since September 2023. It was the Dow’s worth month since September 2022.
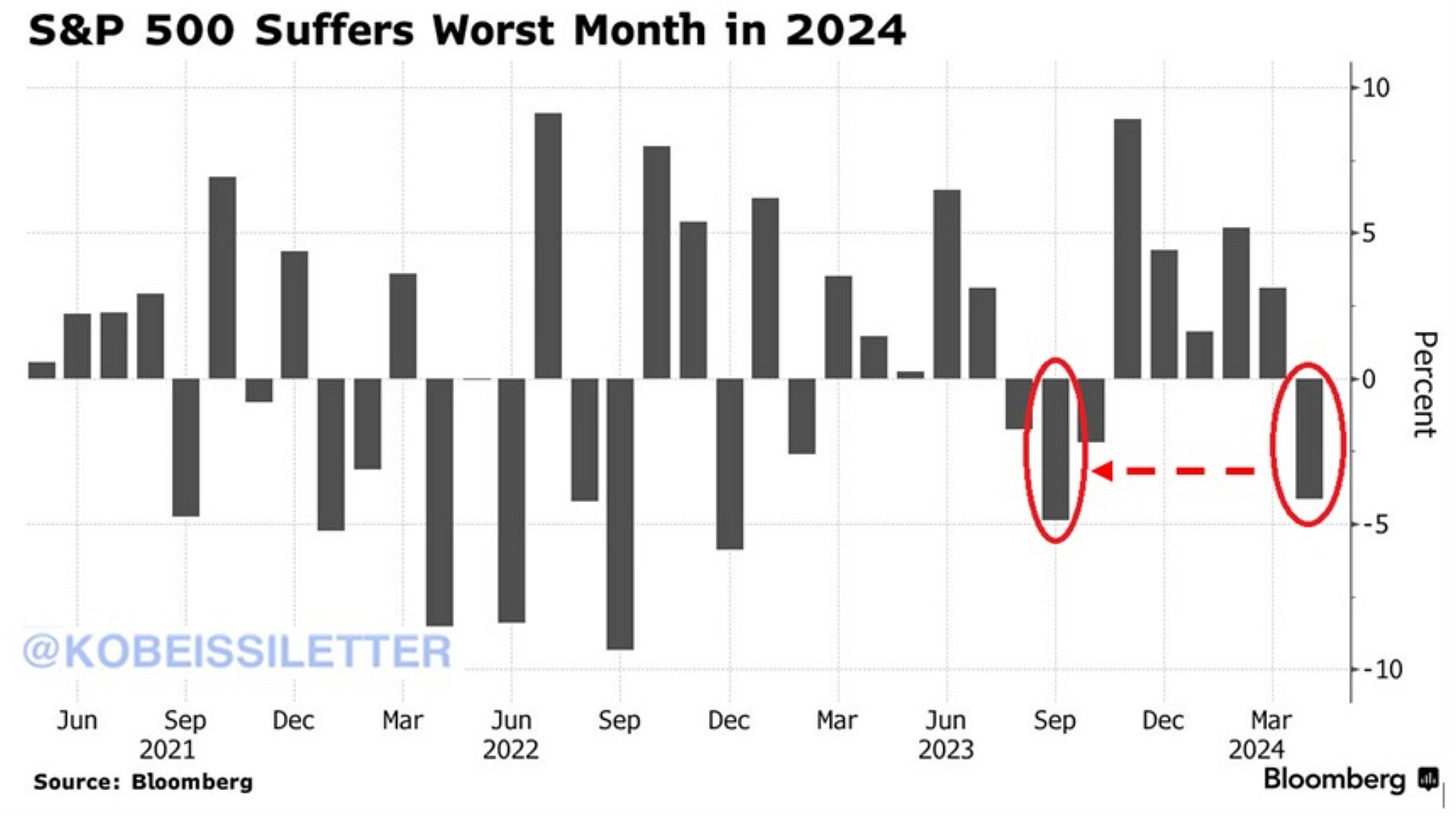
Here is an updated chart showing where returns were in various investment classes and sectors in April as well as YTD.
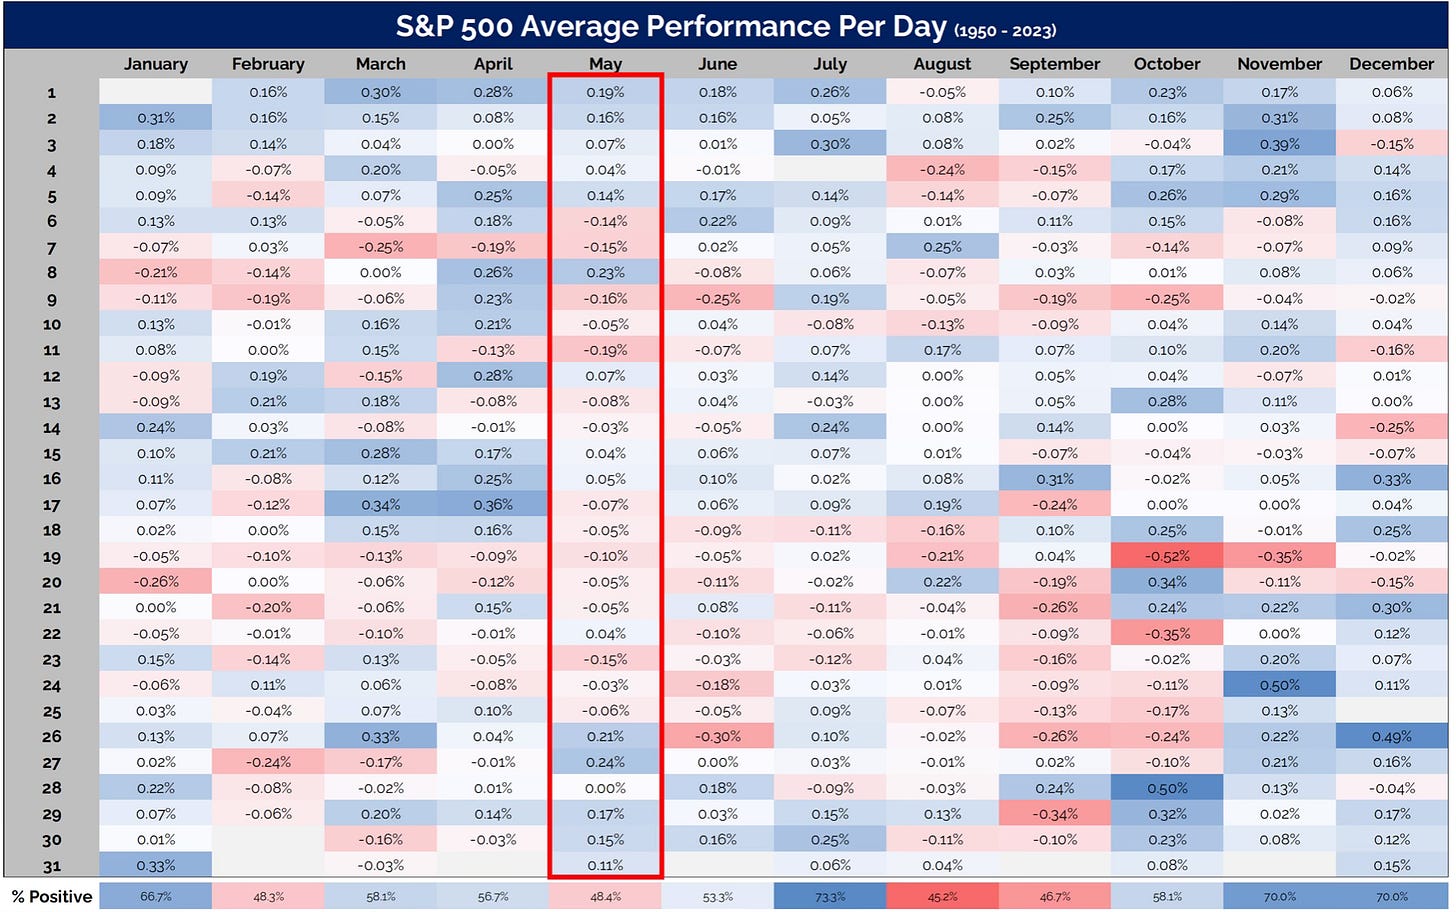
As the calendar now turns to May, we look at where the per day performance for the month has done going back to 1950. There have been more down days than up days in May.
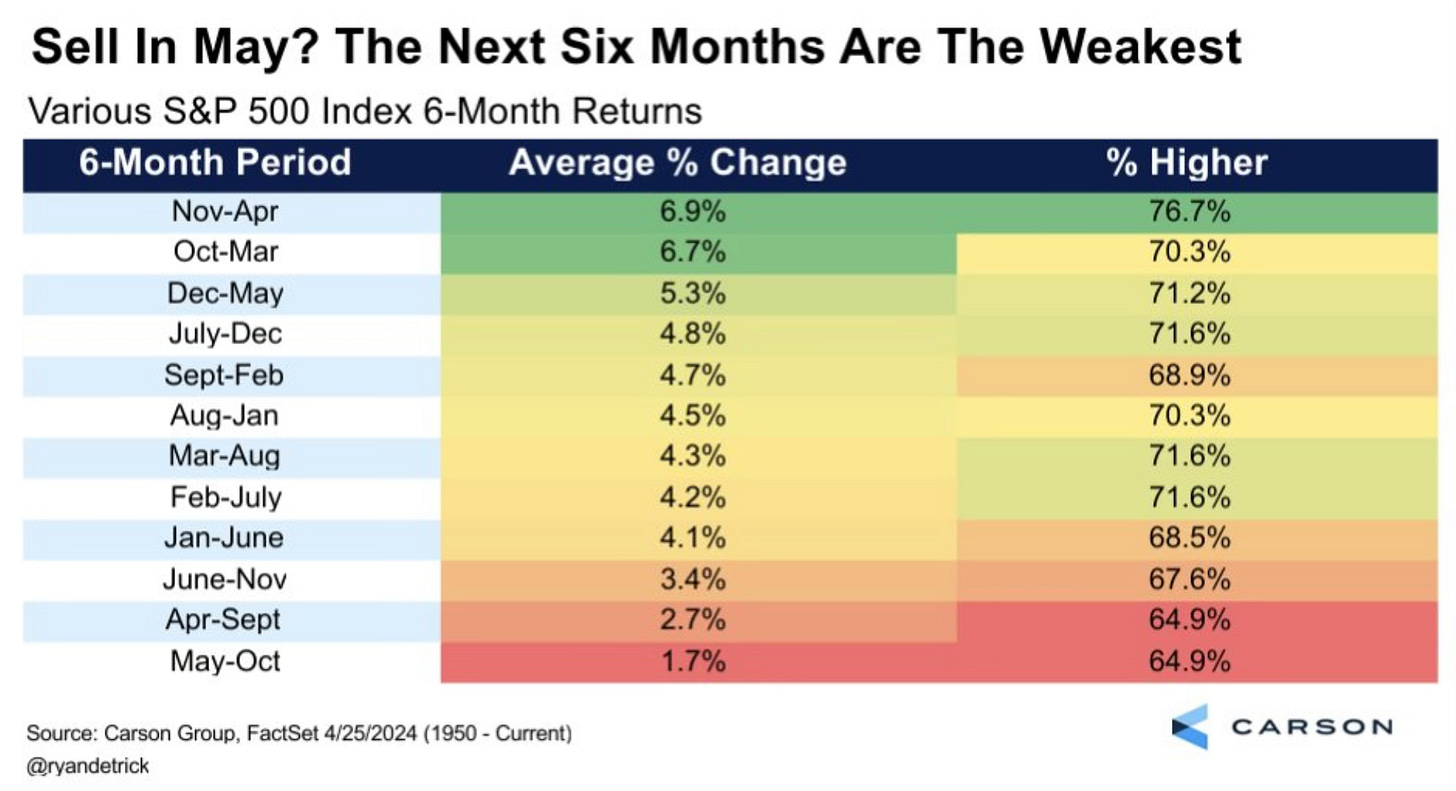
We do enter one of the roughest 6 month periods for returns. Even though May has been positive in 9 of the past 10 years, we enter the historically worst 6 consecutive months stretch. The S&P 500 has only averaged 1.7% from May through October dating back to 1950. Higher only 64.9% of the time.
What Happened To Construction Jobs?
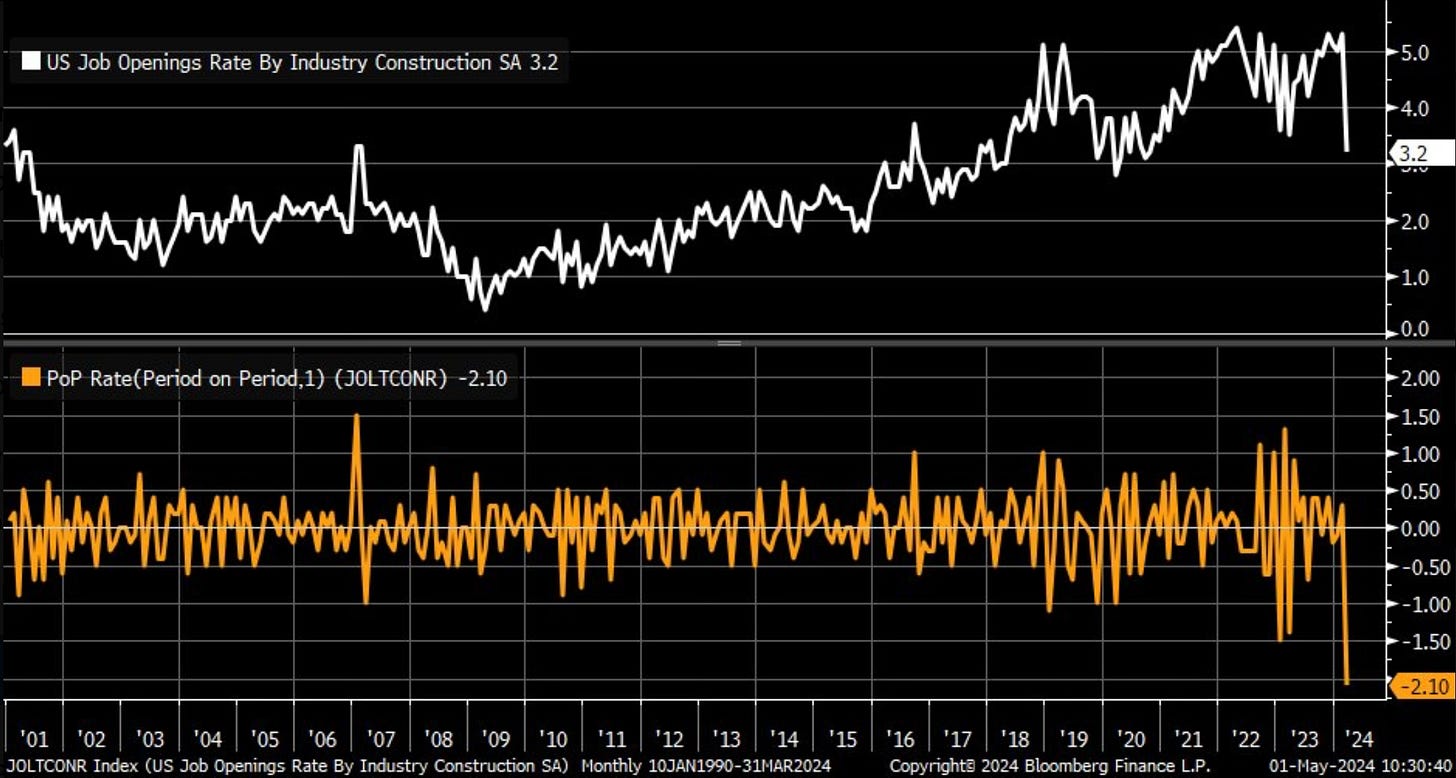
Construction job openings just fell off a cliff. From 456,000 to 274,000. A loss of 182,000.
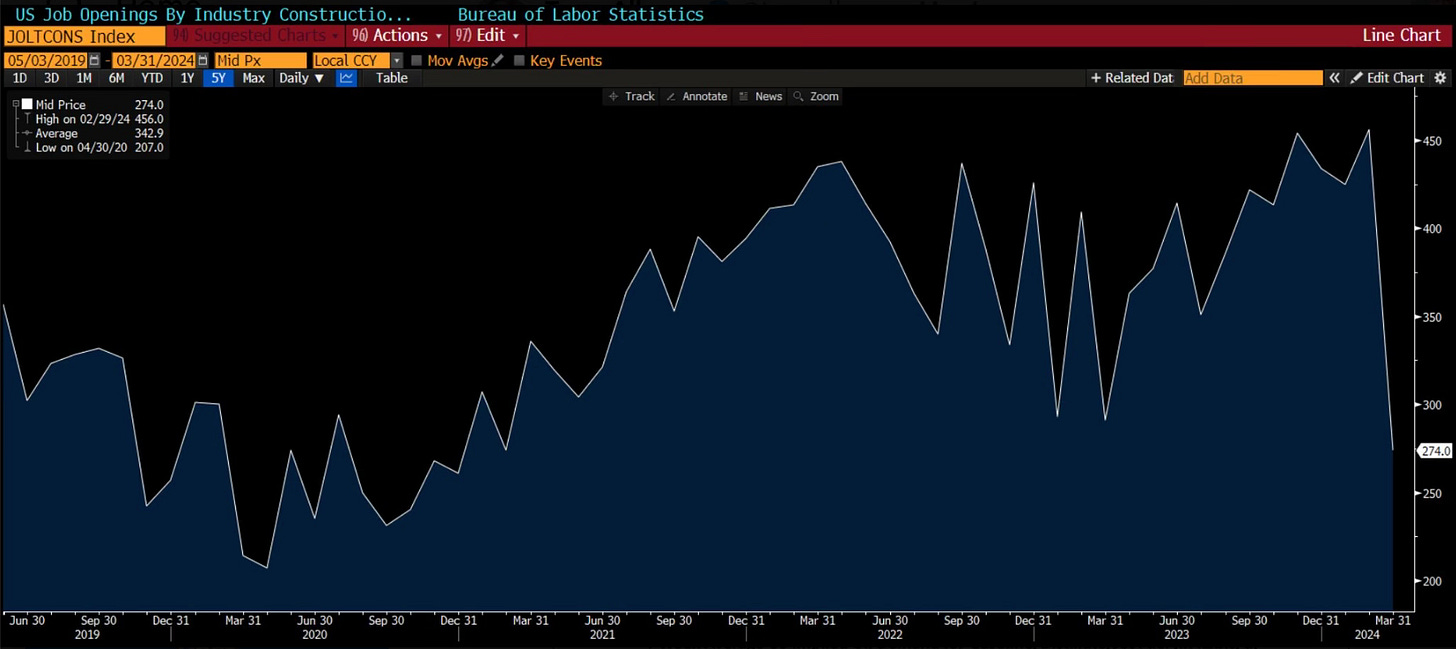
That’s actually the largest monthly drop on record. This definitely raises many questions.
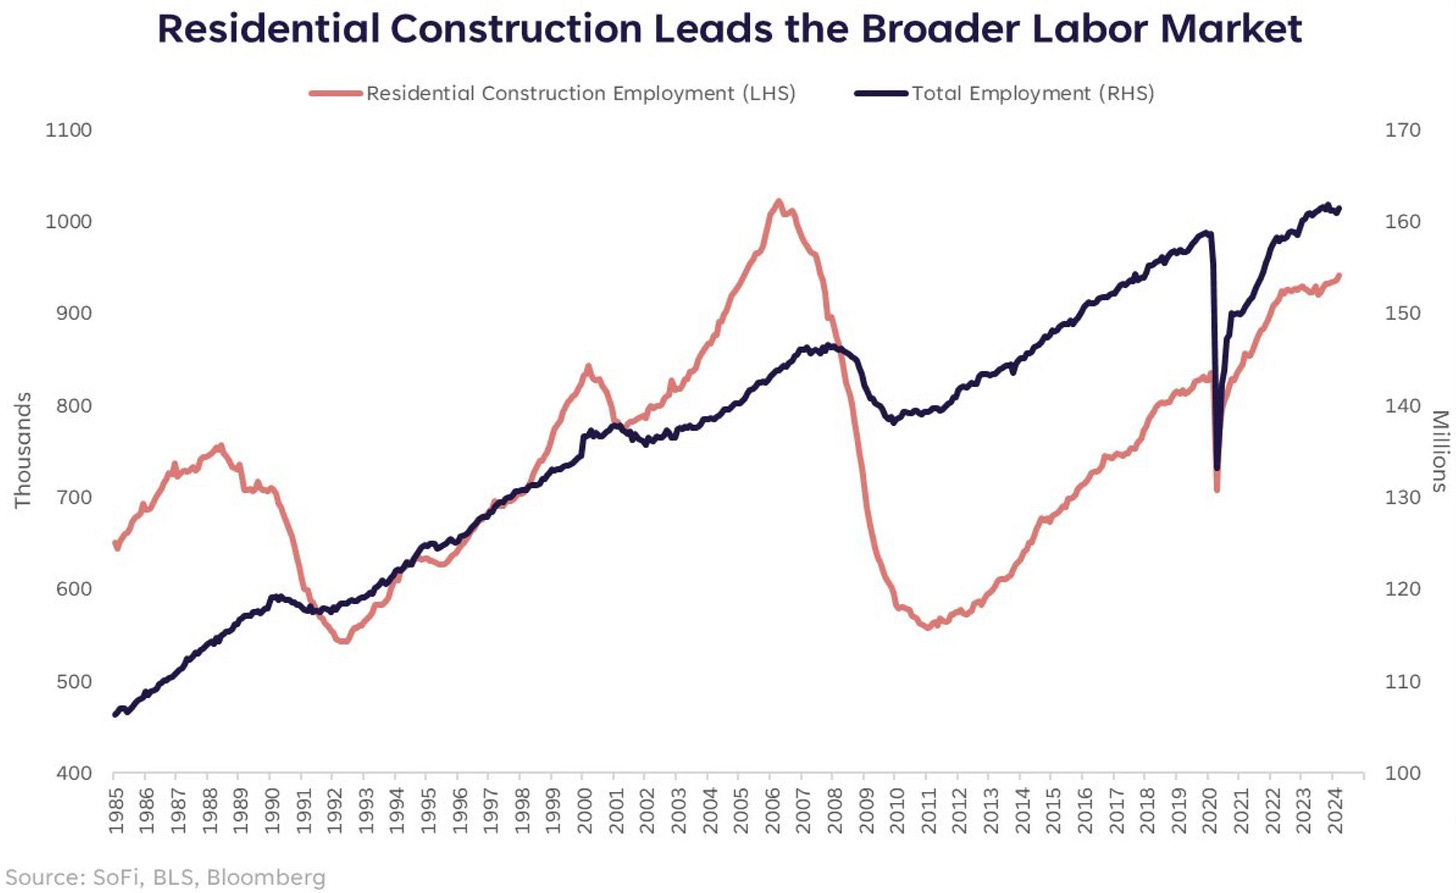
I don’t think everyone is aware of just how important construction jobs are to the broader labor market and economy. This chart by Liz Young illustrates perfectly how residential construction employment leads total employment.
4 Charts That Stick Out
This week there were four charts that stuck out and caught my attention.
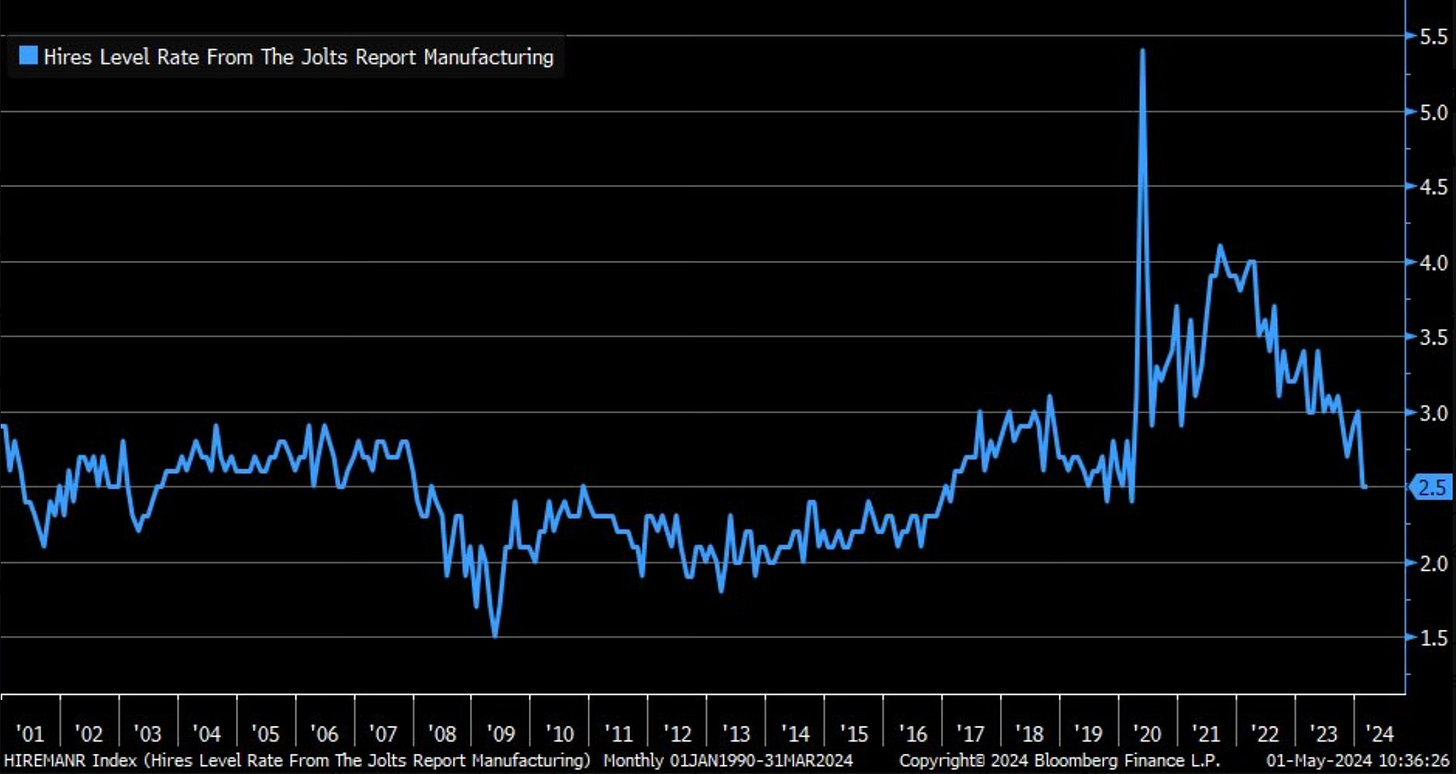
The first is how much the demand for manufacturing labor has declined. The hiring rate for the sector has fallen back to the lowest levels since the pandemic.
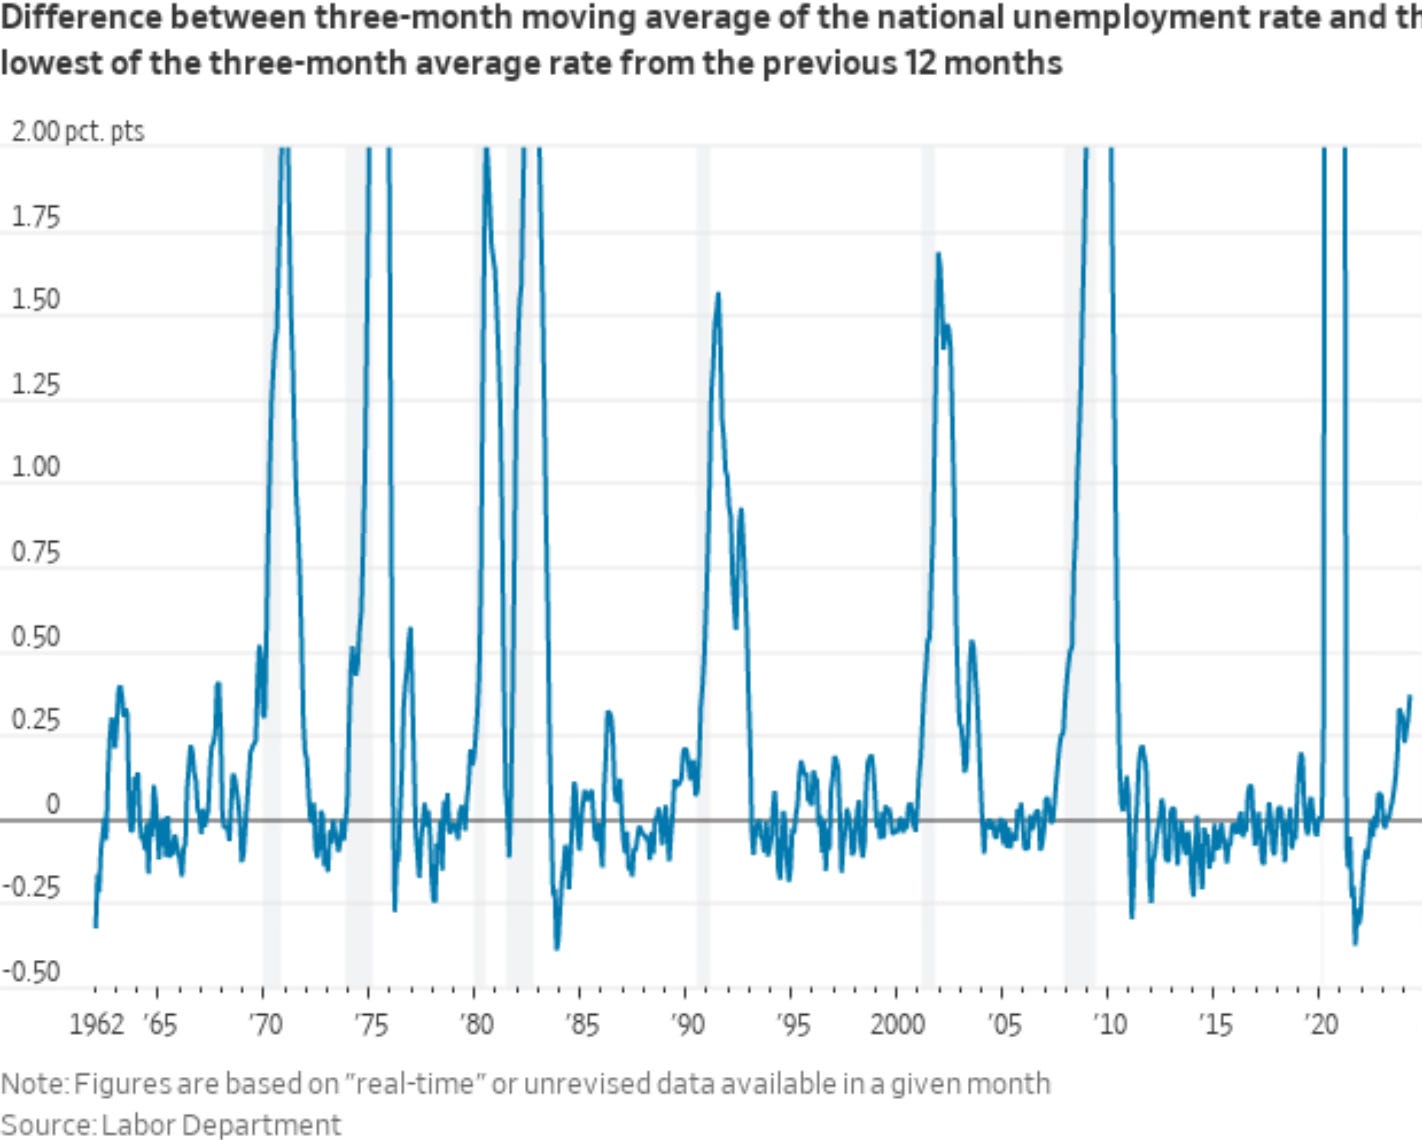
Readers of Spilled Coffee know how I have talked about the importance of the Sahm Rule recession indicator. It just took another tick higher and it’s now at the highest level of this cycle.
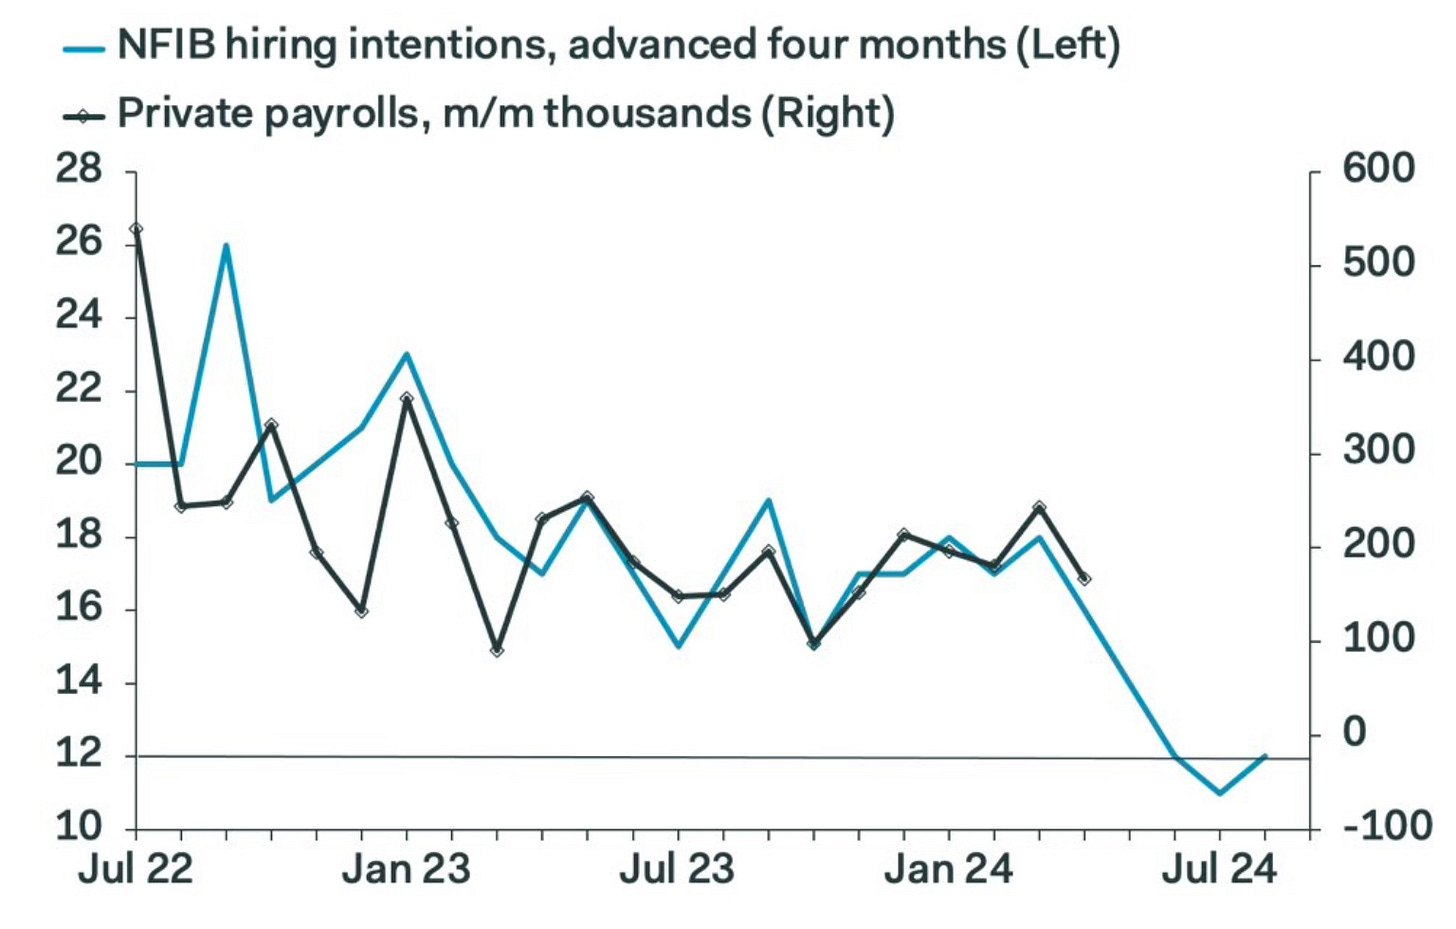
With Friday’s tick down in the jobs growth number, you have to go back to what I’ve highlighted recently (4/20- Investing Update: Buy The Dip?) in the NFIB Small Business Survey readings and what they said about their hiring intentions. This chart does a great job of showing just how important what small businesses are doing is for the economy.
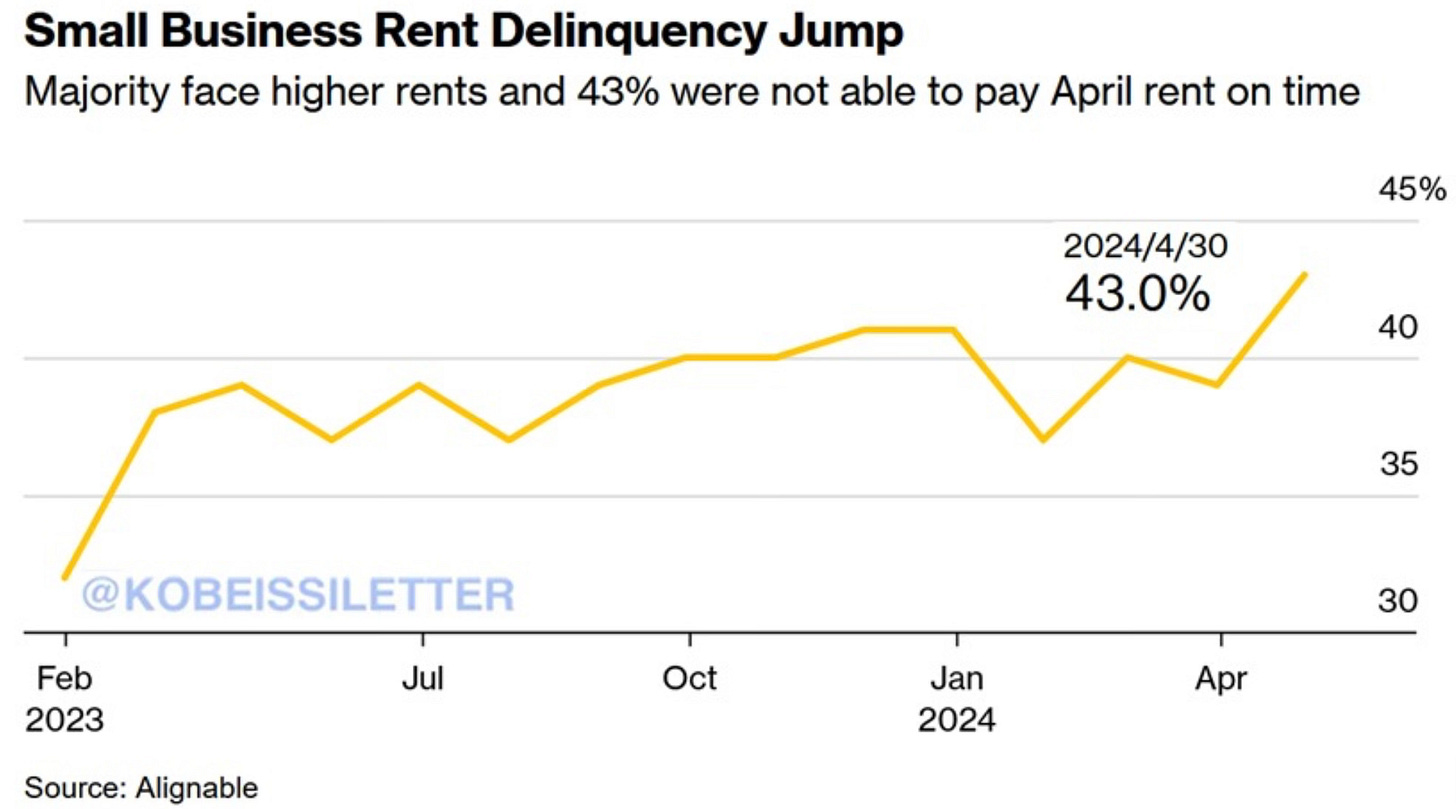
Staying on the small business side is this chart that I don’t like to see. Rent delinquencies jumped in April as 43% of small businesses weren’t able to pay rent on time. The worst part is it was highest for restaurants at 52%. Support your local small businesses and restaurants!
Stagflation Talk
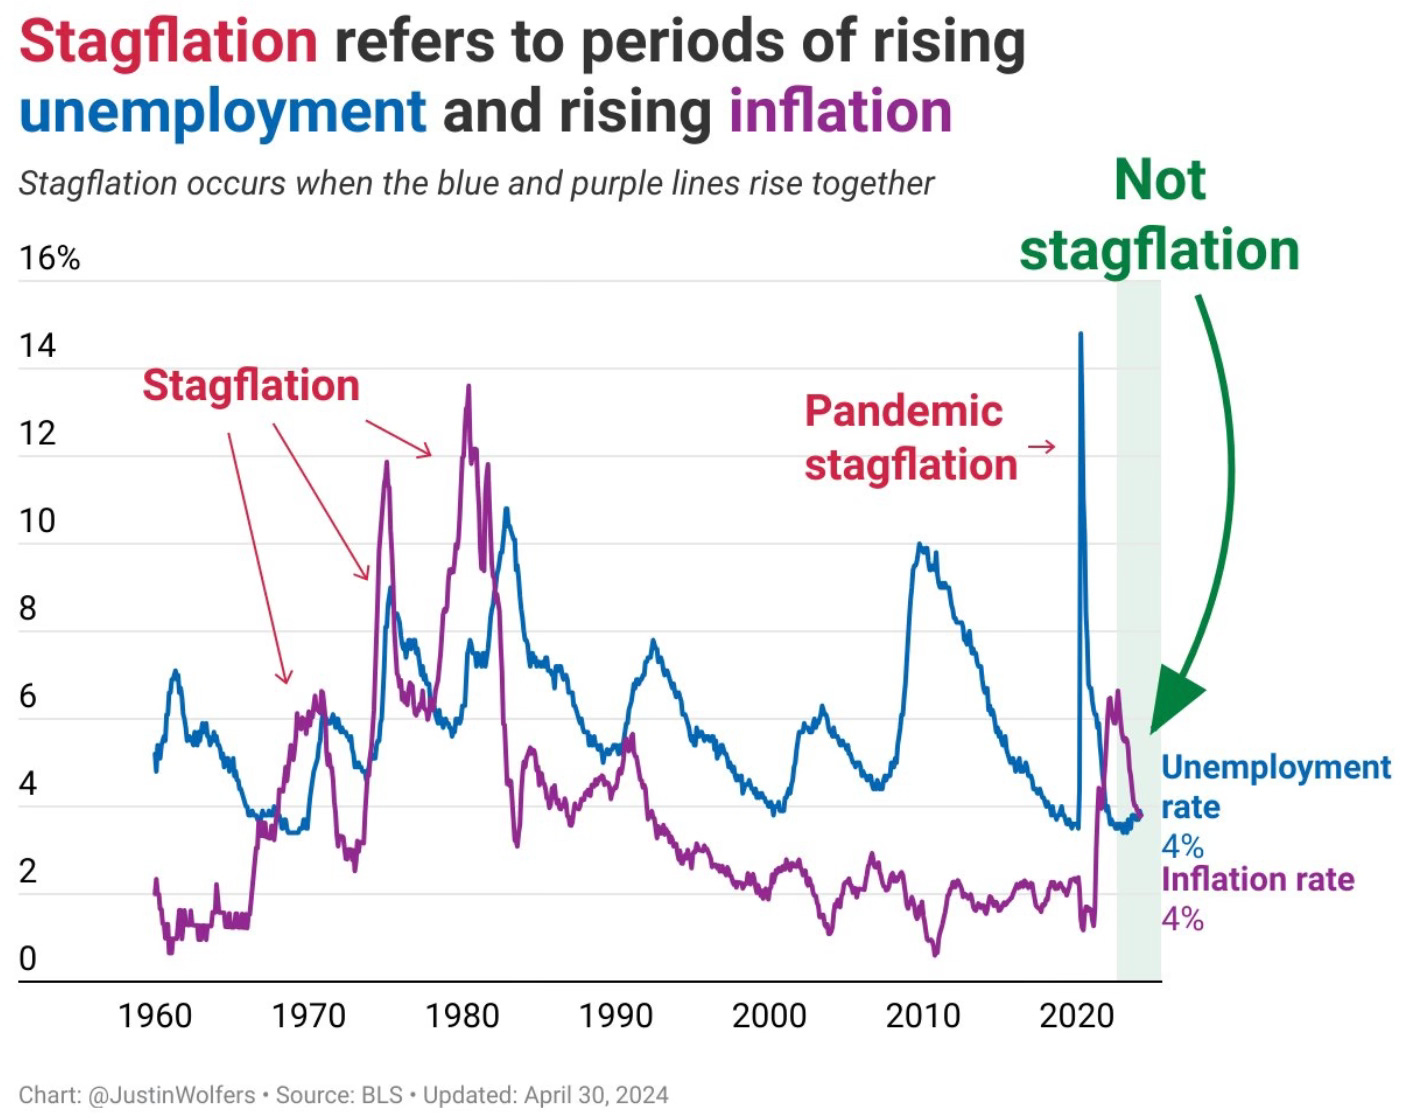
I think the word I have heard the most over the past week has been stagflation. What is it? Stagflation is the combination of high consumer price inflation (CPI) and stagnant economic growth, usually accompanied by rising unemployment.
I don’t quite understand where all the hoopla surrounding stagflation has come from. Inflation already peaked, has come down and looks to be moving even lower. It isn’t out of control. The economy isn’t shrinking. Plus we still have record low unemployment.
This excellent chart from Justin Wolfers sort of debunks the whole stagflation narrative.
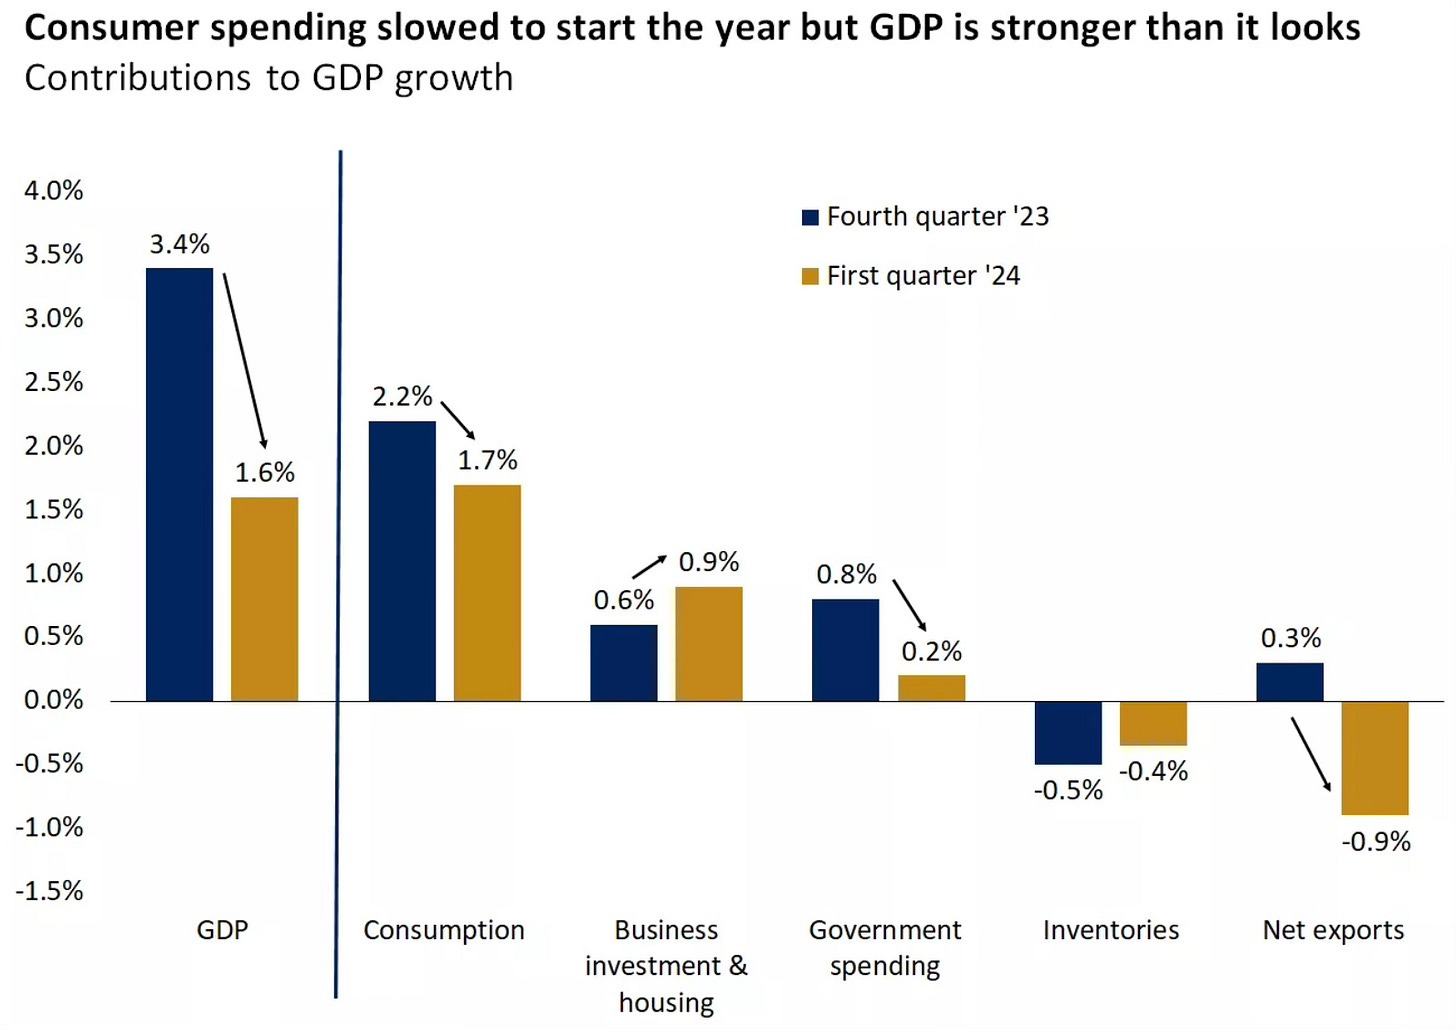
The weakening economy narrative came from the recent GDP report where growth slowed from a 3.4% annualized pace to 1.6%. I believe though that there was one area that many missed or overlooked and that was foreign trade. This was an excellent recap of it from Mosaic Asset Company. You can read the post here.
The most recent GDP report was slowed by a jump in imports, which took off nearly one percent from the headline figure since imports are subtracted from GDP. But higher imports could actually be another sign of strong consumer spending.
On that front, consumer spending grew by 2.5% last quarter according to the GDP report, and the early evidence suggests this could accelerate further in the second quarter and drive GDP back higher as well.
This is a great chart that shows where the changes occurred from the Q4 2023 to Q1 2024.
Could stagflation still happen? Sure. But right now it isn’t. There is no data to suggest otherwise. The talk of stagflation is putting the cart before the horse. It’s based on assumptions.
Stocks On The Radar
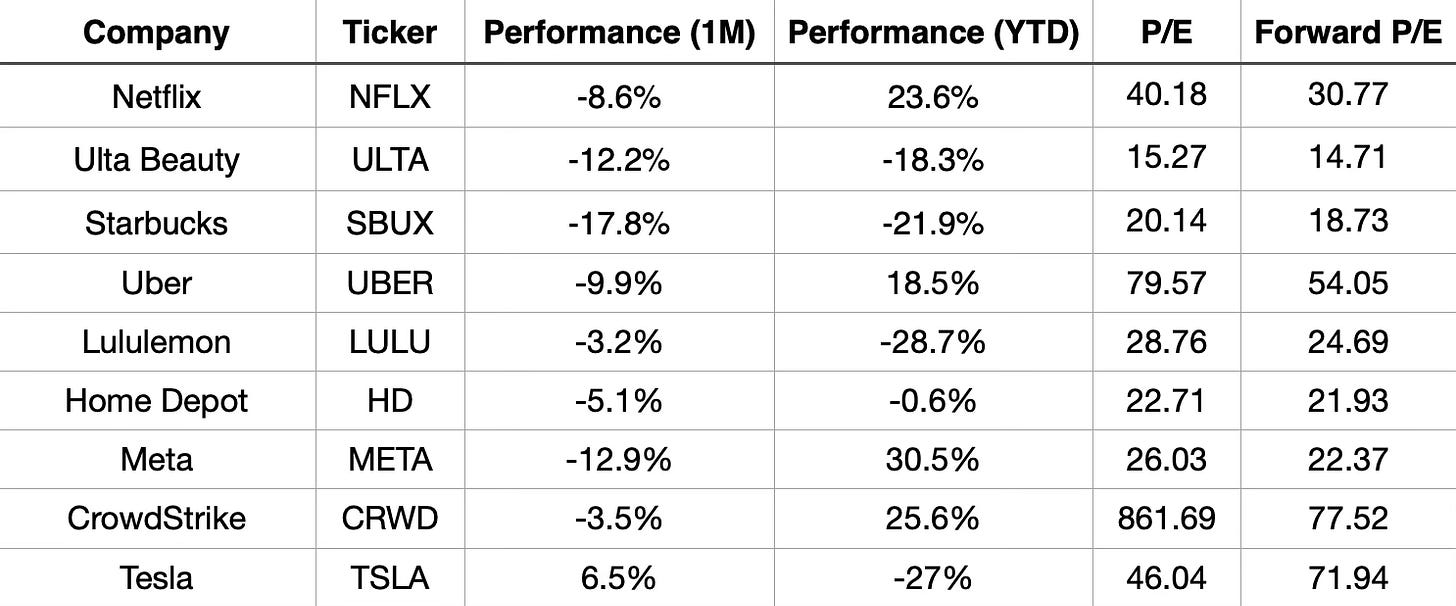
This week I updated my watchlist of stocks. After the recent pullback and the onslaught of earnings being reported, I wanted to see what names were popping the most in my data and research.
Here are the top 9 stocks that have moved to the top of my watch list to start May.
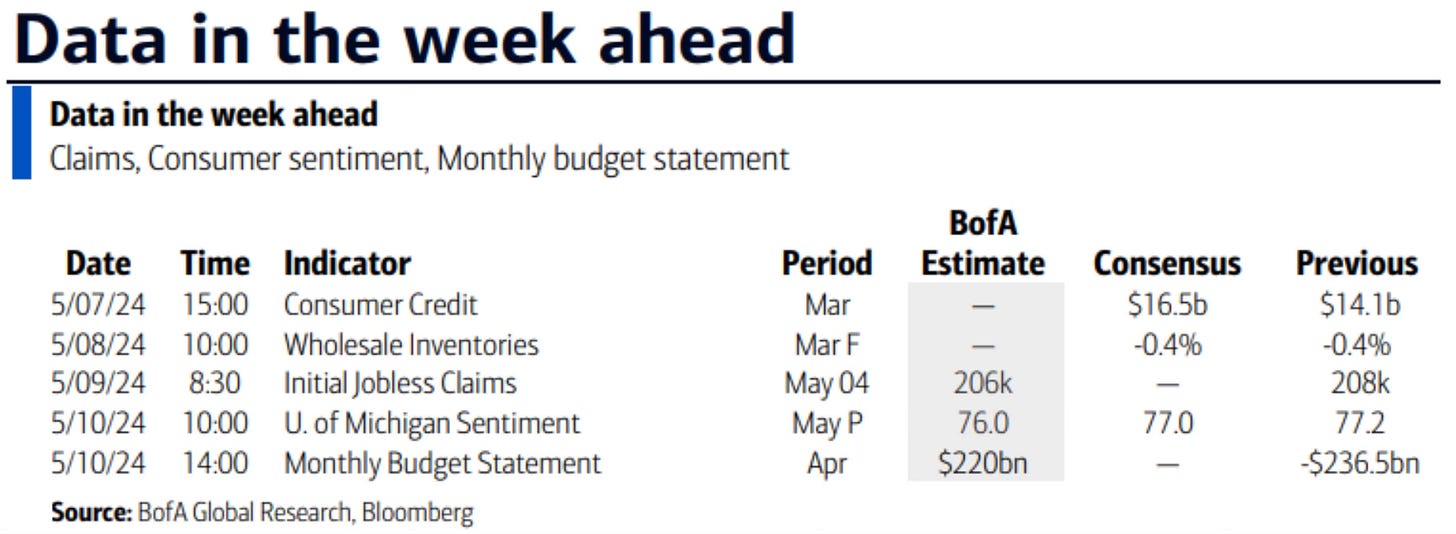
Upcoming Earnings & Data
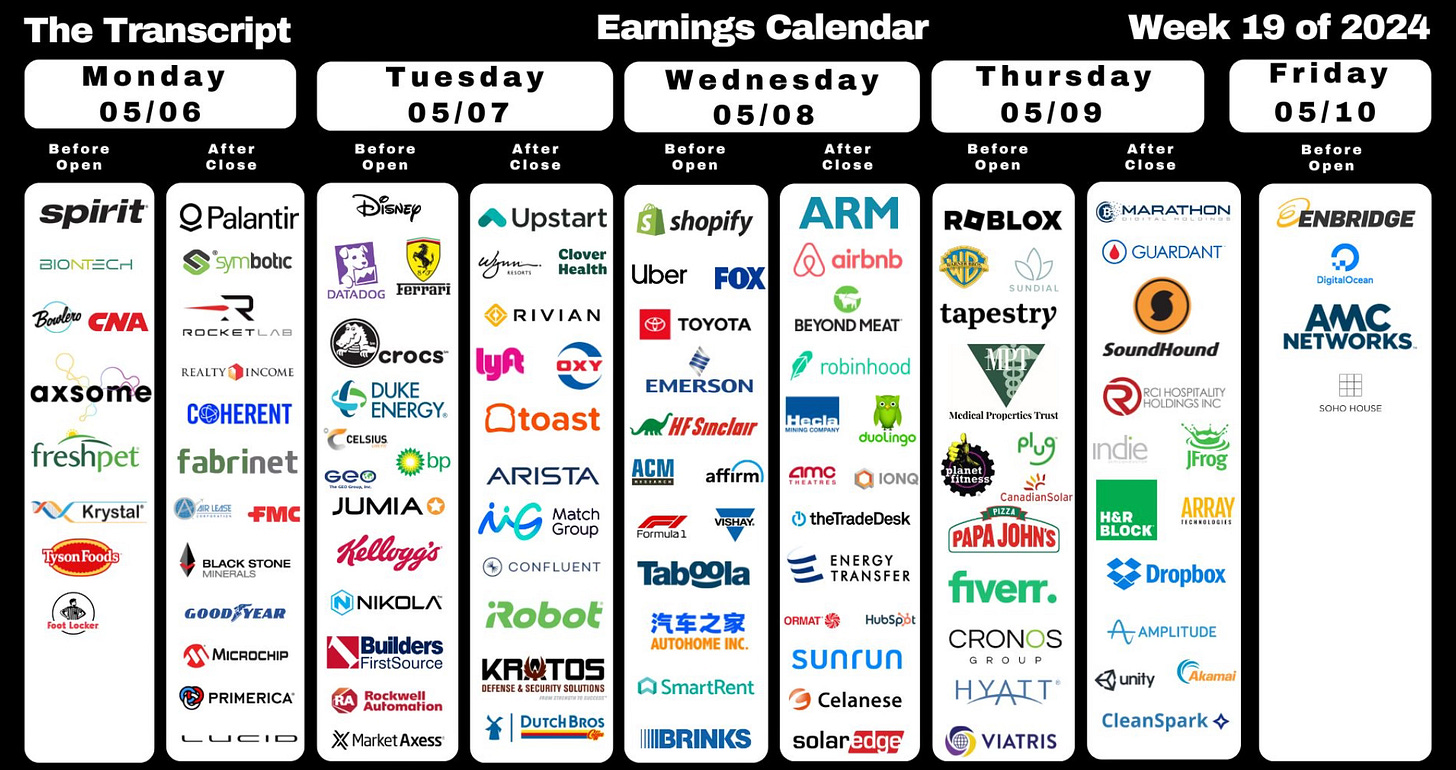
Next week will be another big week of earnings as 81 S&P 500 companies report.
The Coffee Table ☕
Sam Ro of TKer by Sam Ro had a great post on the reminder of why stocks are and have always been an inflation hedge in Why they say stocks are an inflation hedge. I think this paragraph he wrote hits the nail on the head and describes it perfectly. “It’s intuitive. When costs go up, companies raise prices to protect their profit margins. In turn, earnings go up with prices, and stocks go up with earnings.”
If you want to understand what COVID did to inflation and how it’s still having effects on it, then you have to read this piece It's the pandemic, stupid by Claudia Sahm in Stay-At-Home Macro (SAHM). Such a detailed and informative recap of inflation and the effects the pandemic is still having.
Barry Ritholtz had a very good piece called, Why the FED Should Be Already Cutting. It was very thought provoking. When I saw the title I didn’t quite agree with it. After reading it, Barry made some good points and it opened my views on what the Fed’s next move should be. I really liked this chart he included.
Thank you for reading! If you enjoyed Spilled Coffee, please subscribe.
Spilled Coffee grows through word of mouth. Please consider sharing this post with someone who might appreciate it.
Order my book, Two-Way Street below.

