
Investing Update: Some Cracks Starting To Show
What I'm buying, selling & watching
It was a busy week for the stock market. The Fed kicked things off by cutting interest rates early in the week, and then five of the Magnificent Seven reported earnings to close it out. That one-two combo helped push all three major indexes to finish the month in the green.
The Nasdaq gained more than 4% for the second month in a row, marking its seventh straight monthly win. The S&P 500 and Dow each extended their streaks to six consecutive months of gains, with the Dow pulling off its first six-month winning stretch since 2018.
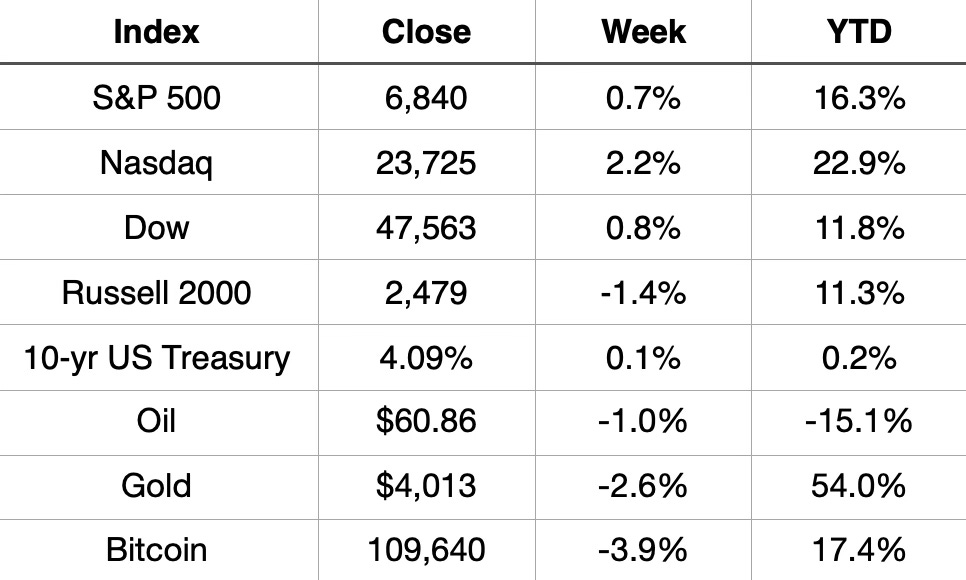
Market Recap
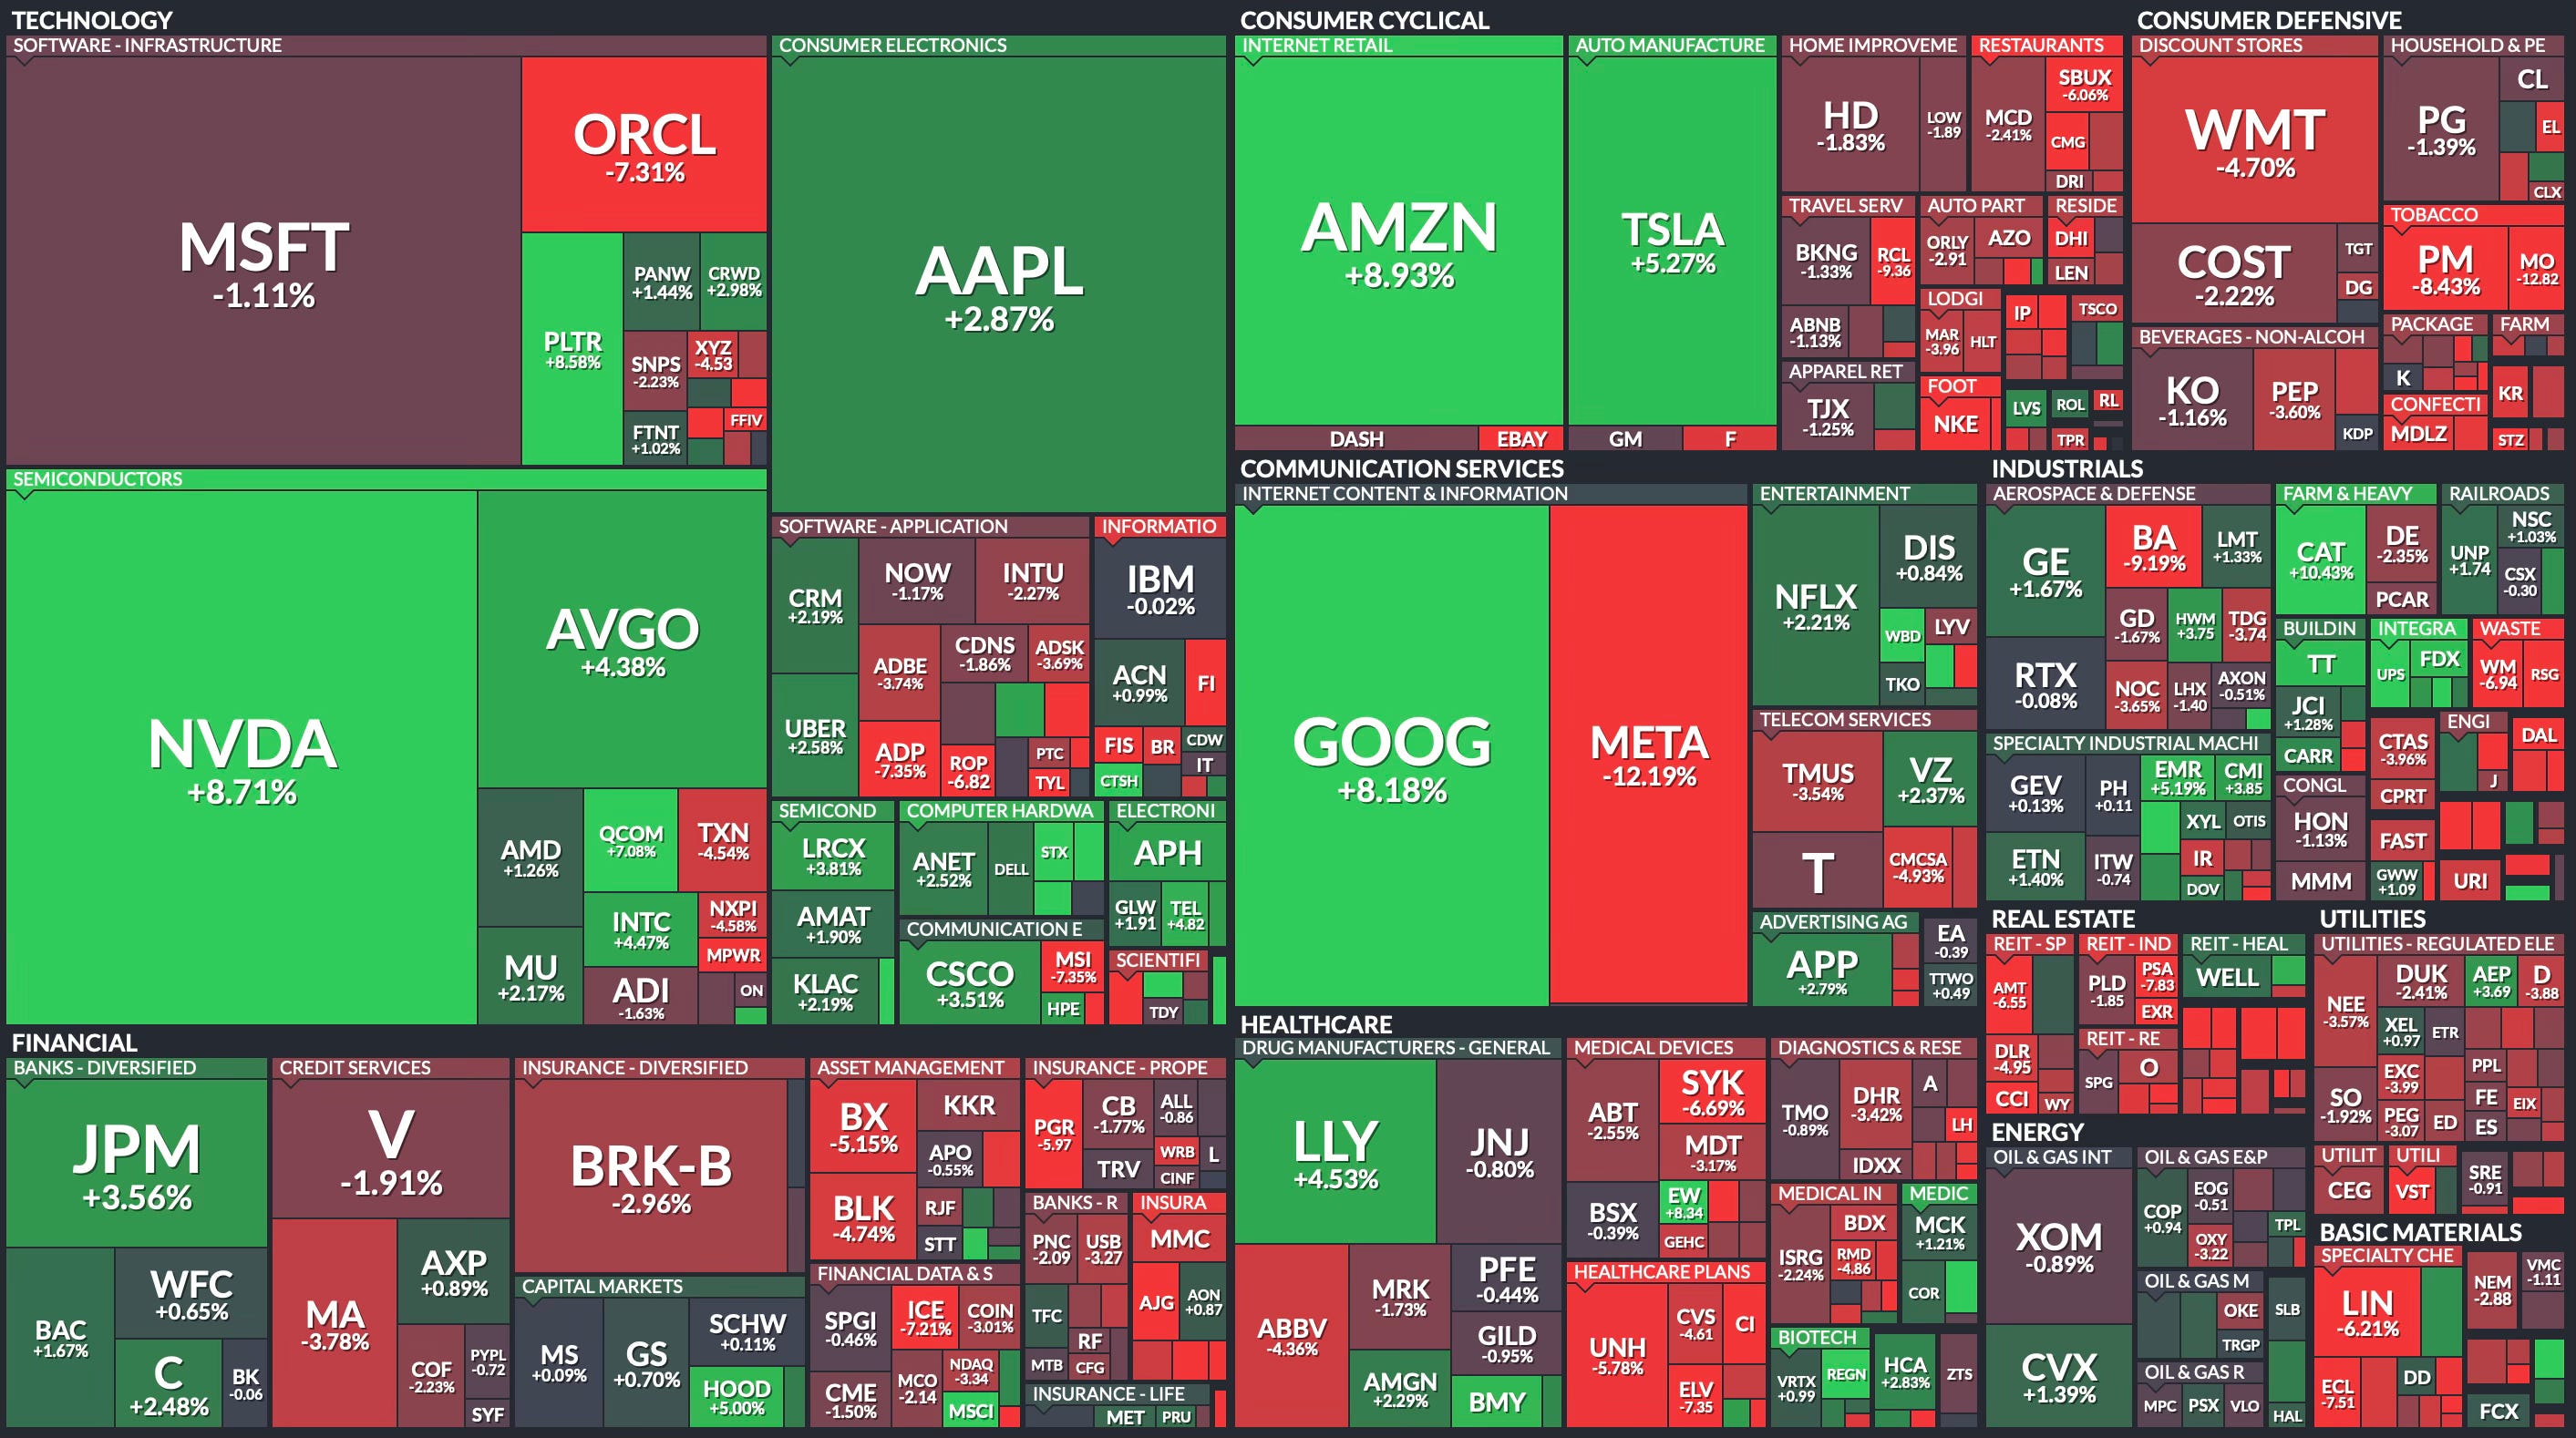
Weekly Heat Map Of Stocks
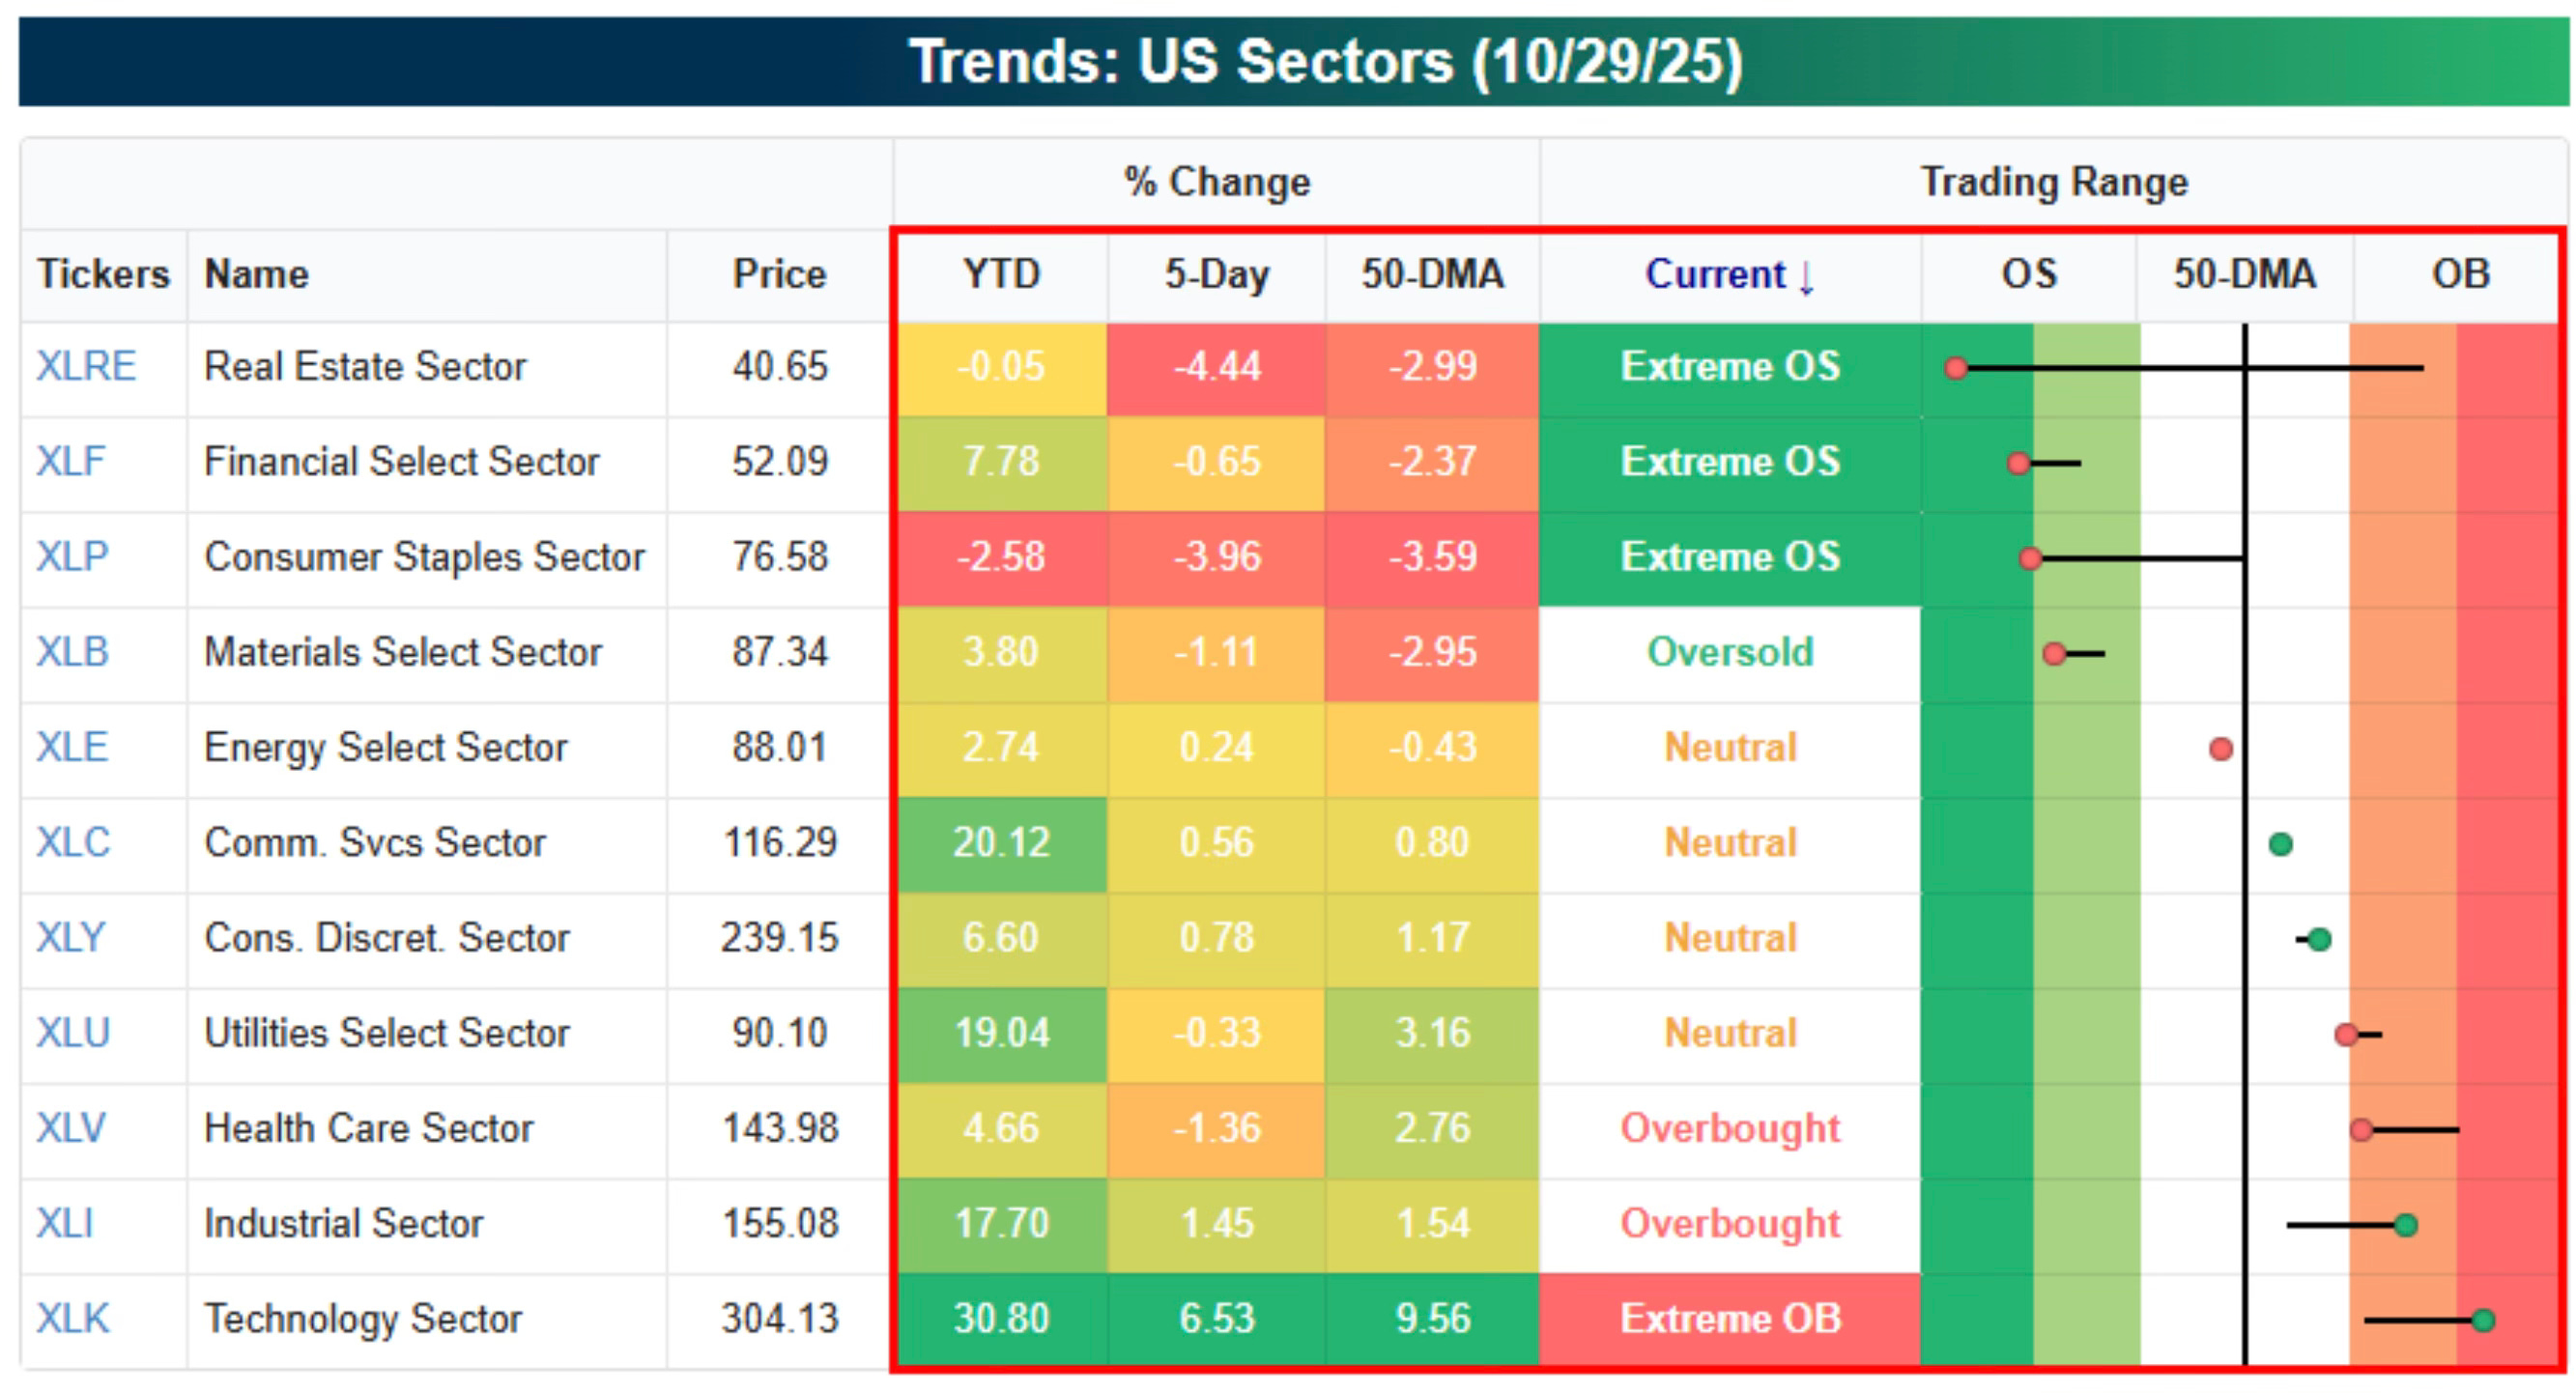
U.S. Sector Trends
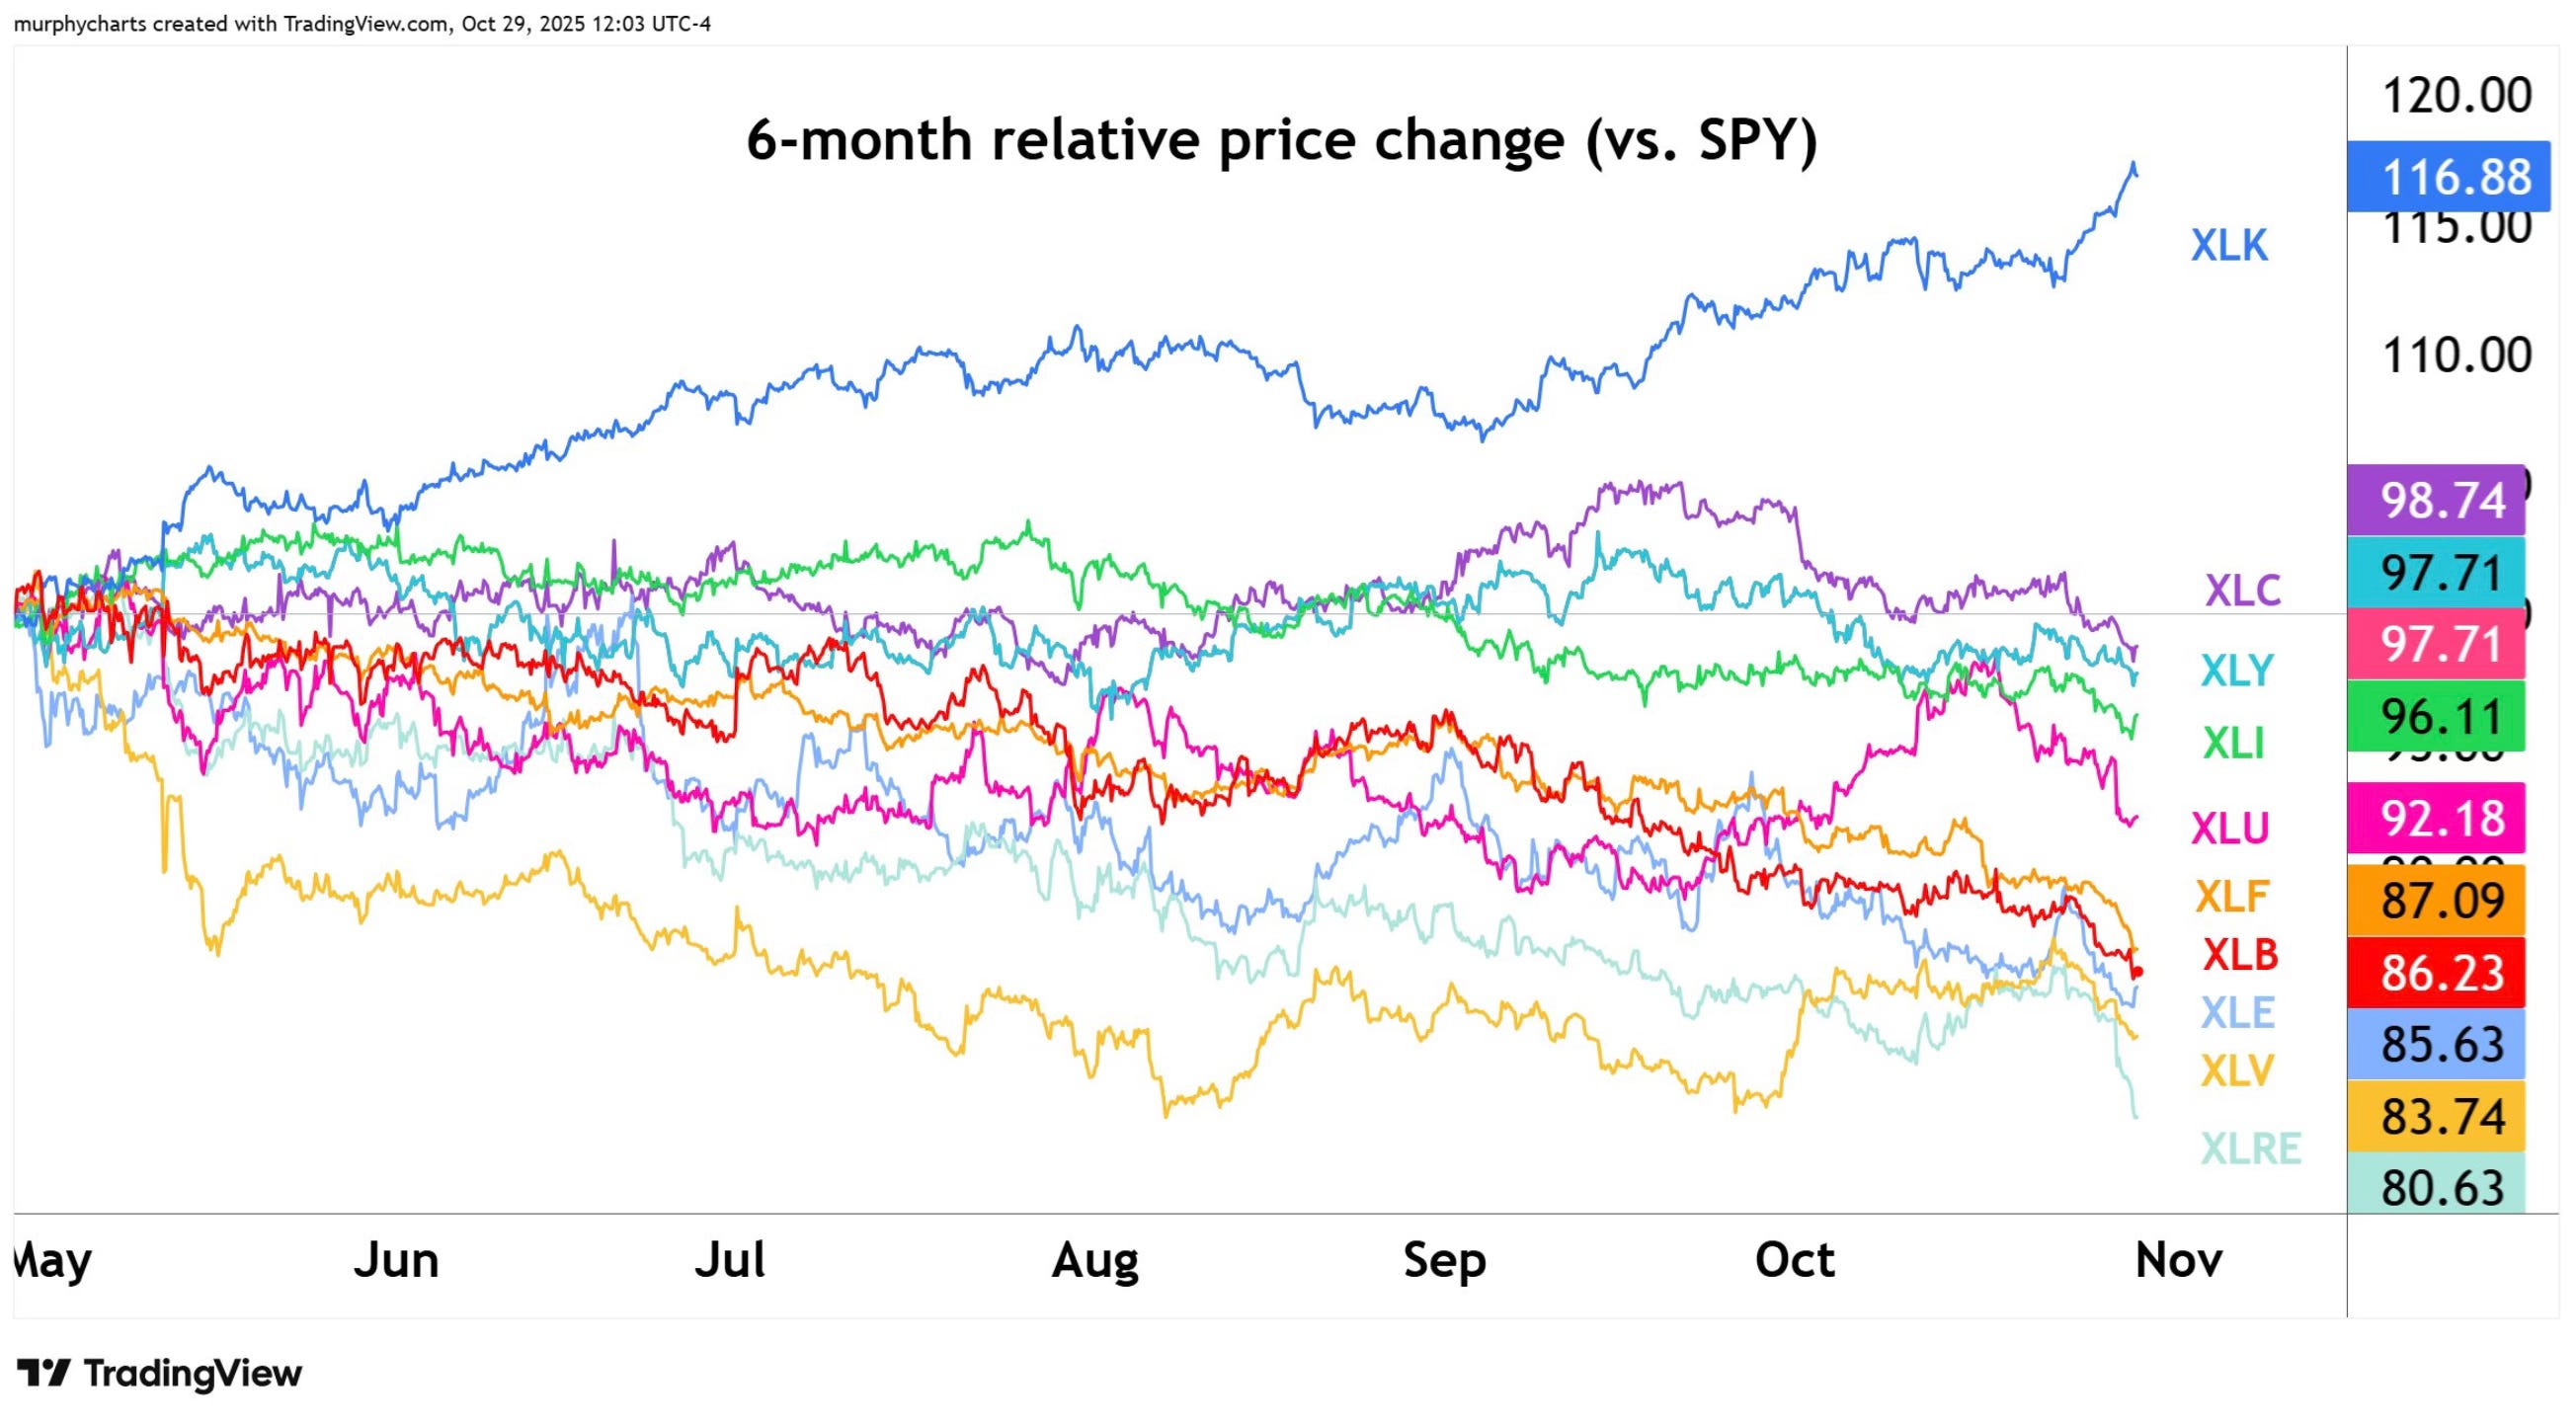
Surprise Chart of The Week
Did you know that there is only one sector that is outperforming the S&P 500 over the past six months? It’s technology and it’s outperforming all other sectors by a big margin.
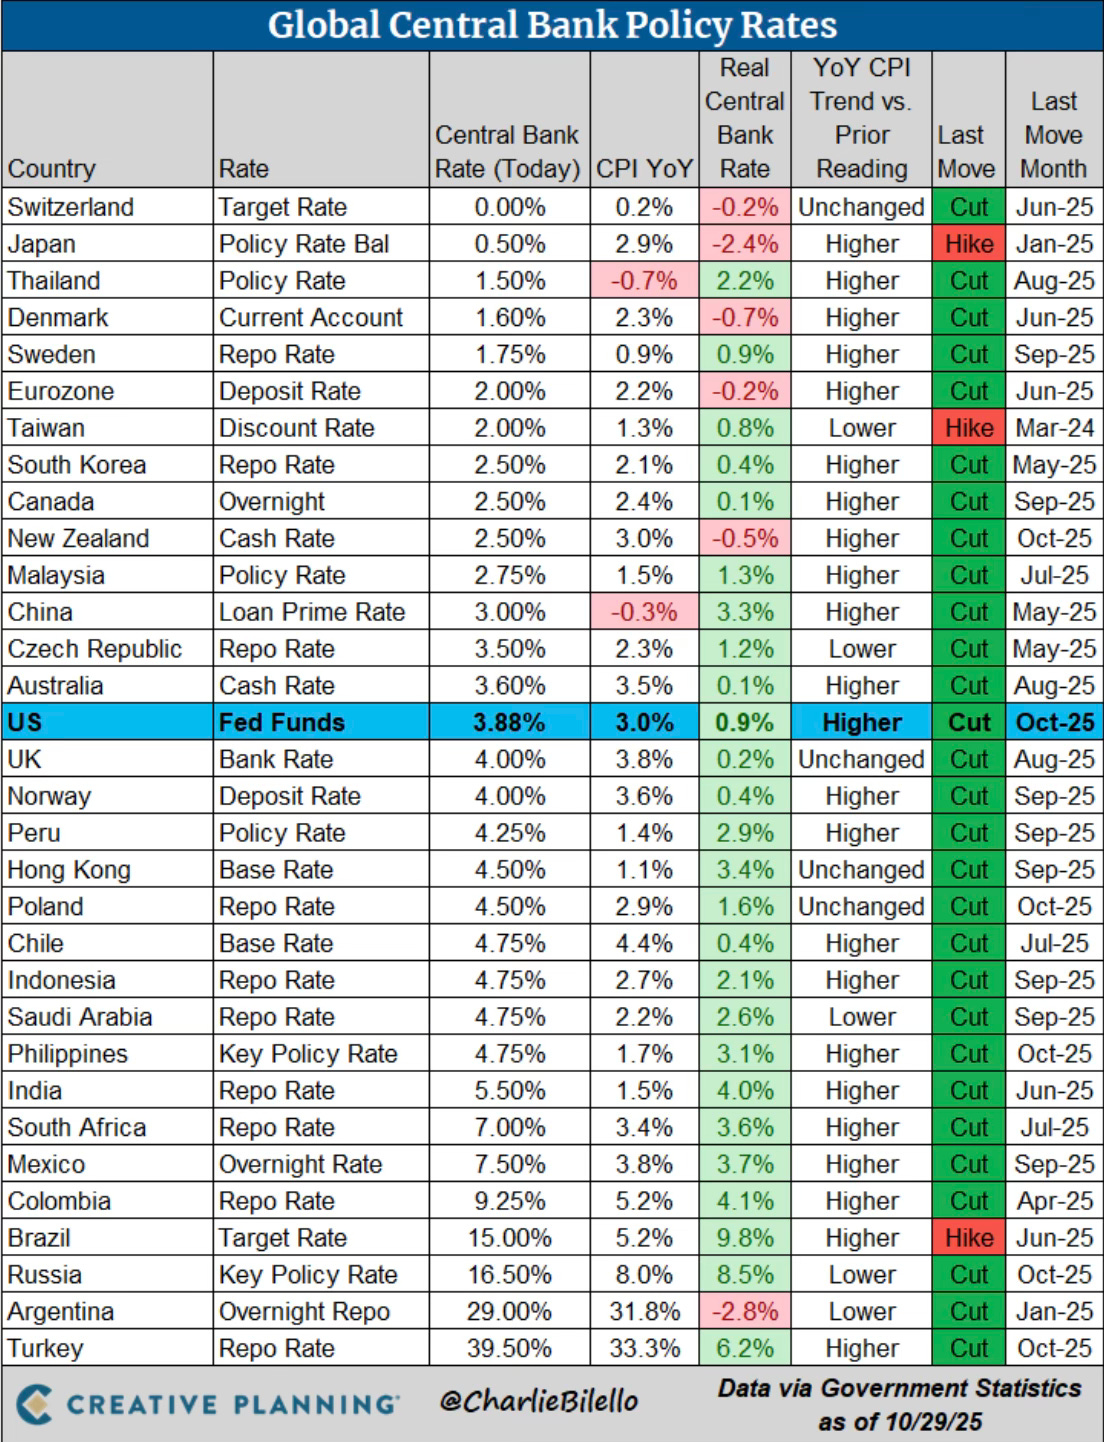
Global Central Bank Rates
Now the calendar flips to November, the best month of the year for the S&P 500. Historically, it has been positive 67% of the time. Not a bad setup heading into year-end.
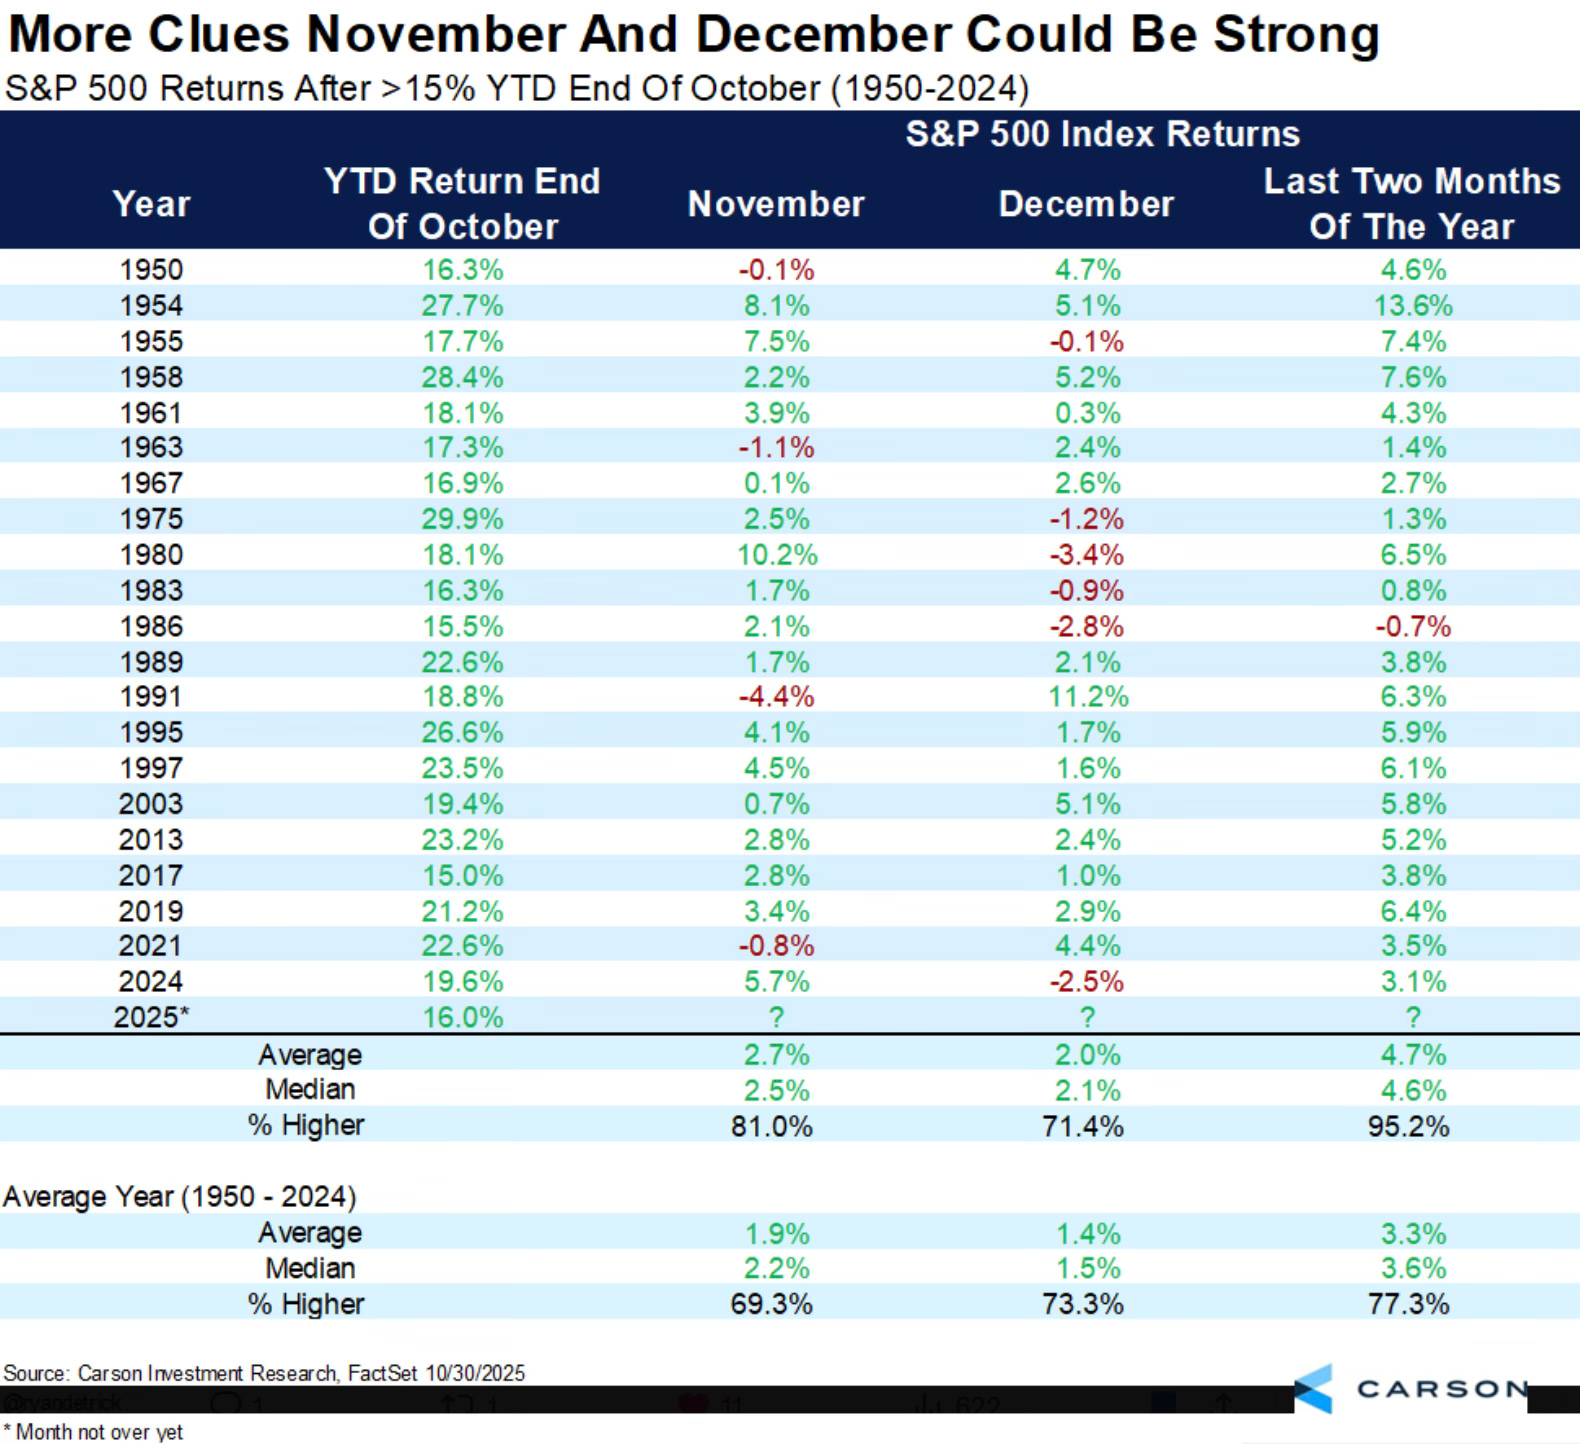
As Ryan Detrick points out, it could be an even better than normal November.
When the S&P 500 is up more than 15% YTD heading into November, it turns out November does even better than normal (2.7% vs 1.9%). But the real impressive feat is the Nov/Dec period has been higher 20 out of 21 times. Strength = strength.
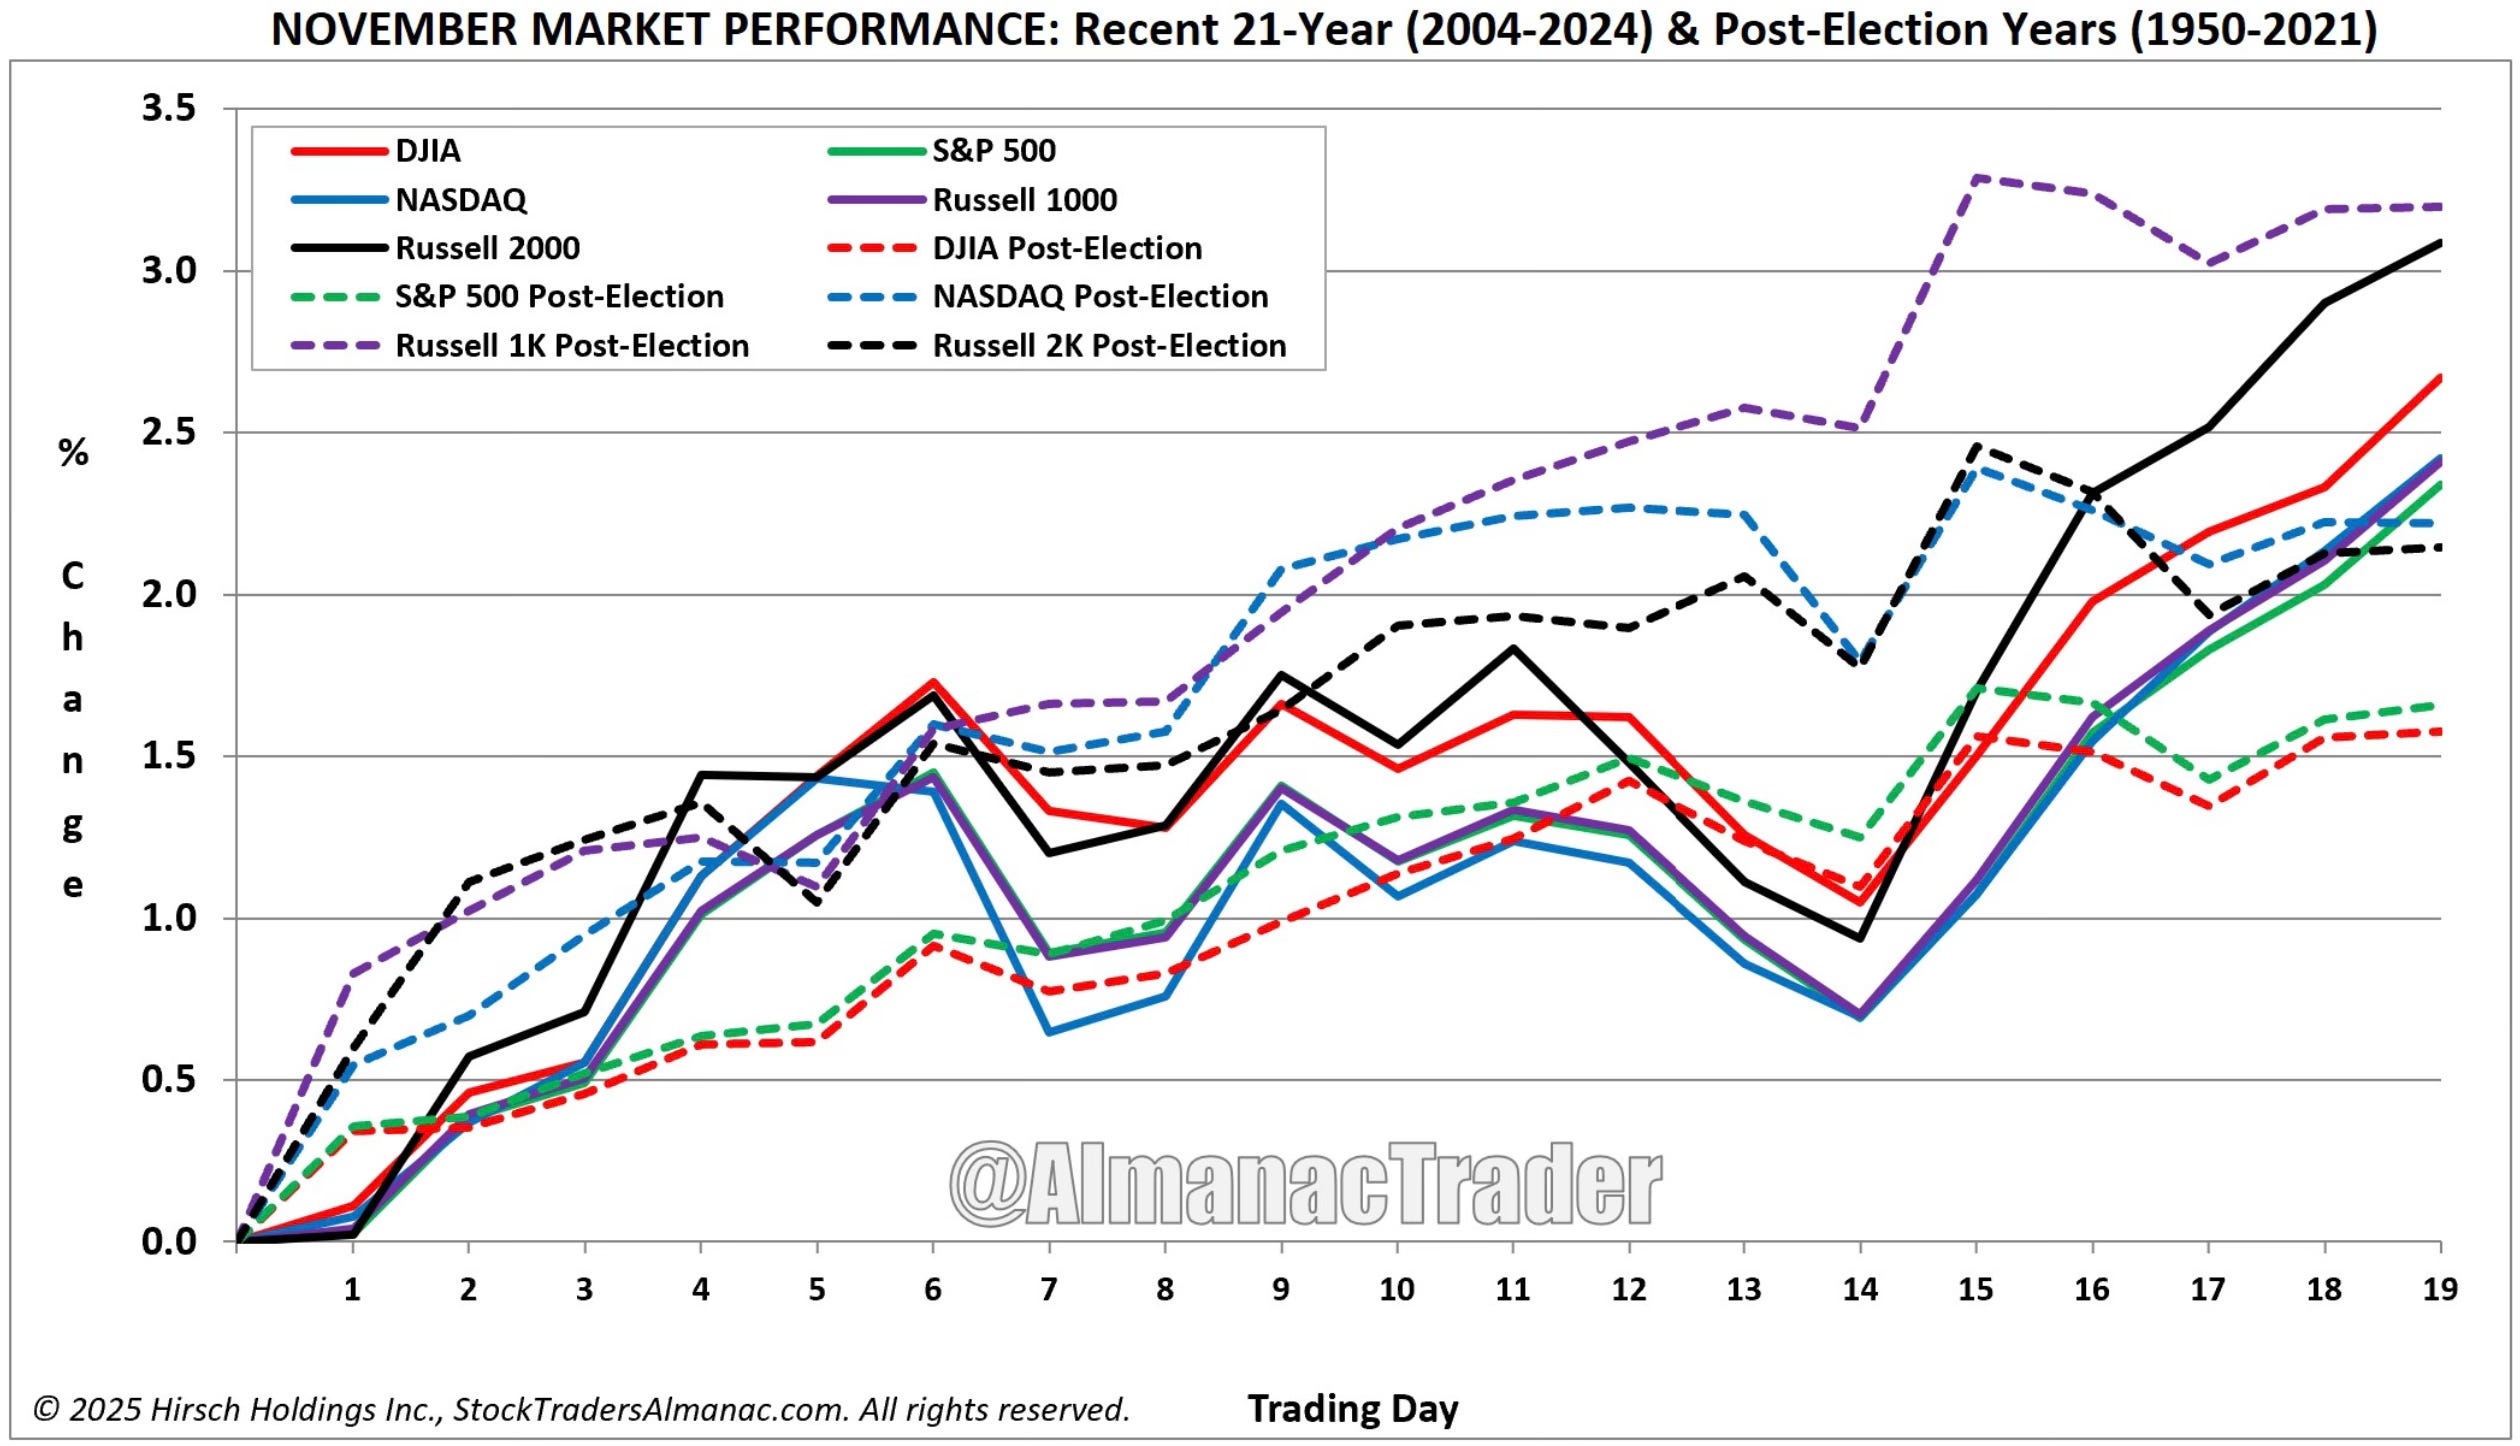
We’re also entering what is historically the strongest six month stretch of the year (November through April). This comes after what has historically been the weakest six month stretch of the year (May through October).
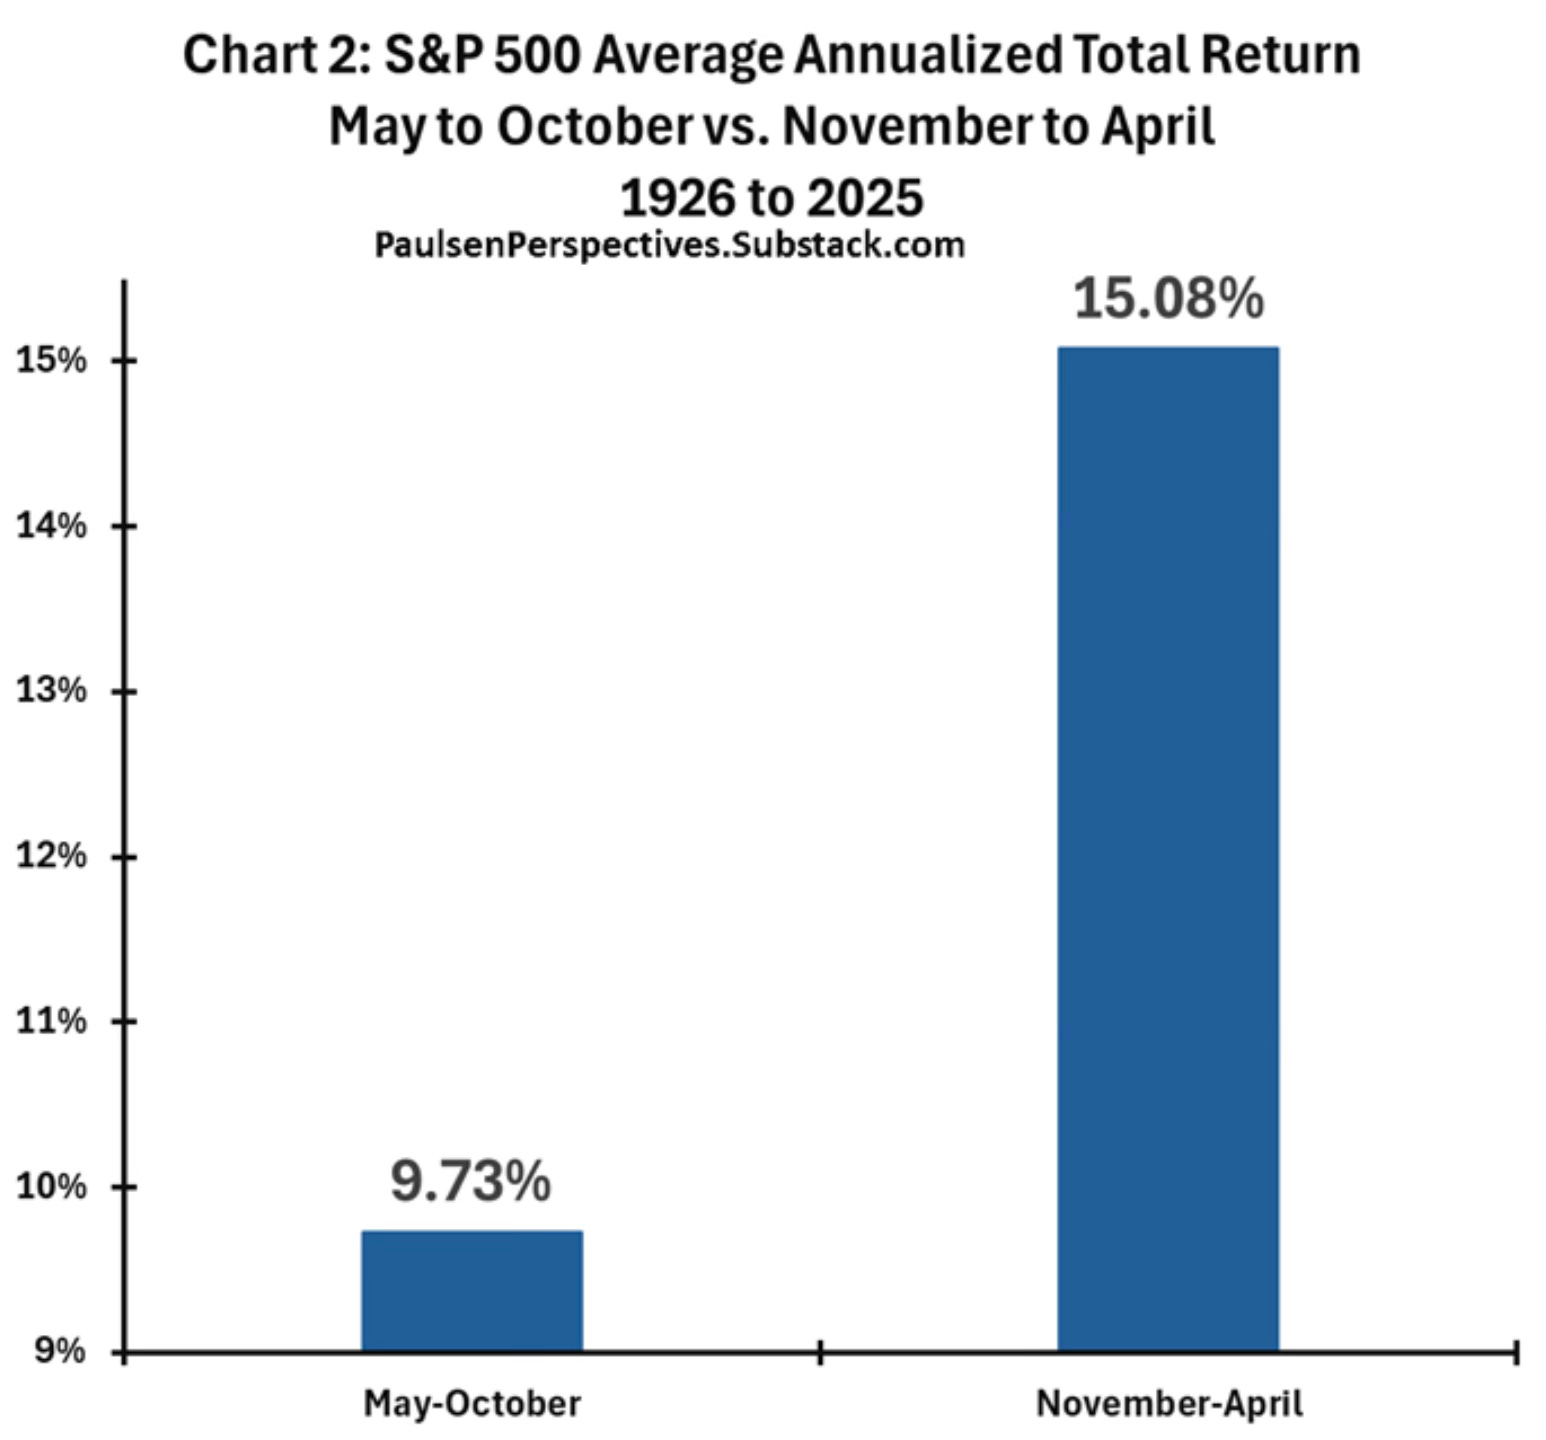
Seasonality trends say the year-end rally still has gas in the tank. It’s hard not to be long.
Some Cracks Starting To Show
Spilled Coffee readers know I try to call out anything that catches my eye — bullish or bearish. Whether it fits my outlook or not, if it stands out, I’ll point it out.
That’s where I find myself today. I still believe this market can move higher, but a few underlying data points are starting to tell a different story.