
Hi friends! 👋
What a week. Here’s what’s on my radar.
Seven Red Days. Now What?
Has the AI Bubble Popped?
What Did I Say About Staples?
My Plan for Next Week
Hedge Fund Buys & Holdings
Let’s get into it.
Eric
Market Recap
Well. That escalated quickly.
The S&P 500 was already down six straight sessions heading into Friday. Then the floor fell out of the market.
On Friday the S&P dropped 3.7% and the Nasdaq dropped 5.3%. Nvidia fell 14% in a single day. Chip stocks got crushed. Even Anthropic, the biggest IPO ever, couldn’t escape. It opened at $111.50 on Thursday and closed Friday at $88.62.
That made seven straight losses for the S&P 500, its longest losing streak since 2020.
By the close
The S&P 500 and the Dow entered correction territory, both more than 10% off their highs.
The Nasdaq turned negative for 2026.
The Nasdaq 100 briefly hit bear market territory during Friday’s session, down 20% from its high.
For the week, the S&P 500 fell 8.6%, its worst week since April 2025. The Dow lost 8% and the Nasdaq lost 10%. For both, it was the worst week since March 2020. The Covid crash.
Here’s where everything finished the week.
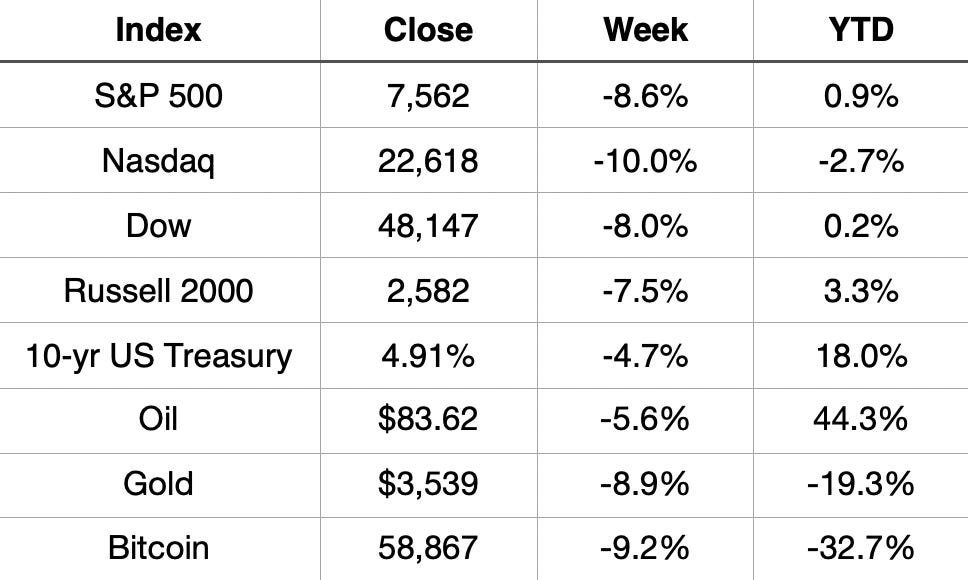
All those 2026 gains? Mostly gone. The S&P 500 is up less than 1% for the year. The Dow is up 0.2%. The Nasdaq is down 2.7%.
And there was almost nowhere to hide. Gold fell 8.9%. Bitcoin fell 9.2%. The one place investors sought safety was bonds. The buying pushed the 10-year Treasury yield down to 4.91%.
Just how bad was this week? Bespoke put it in perspective.
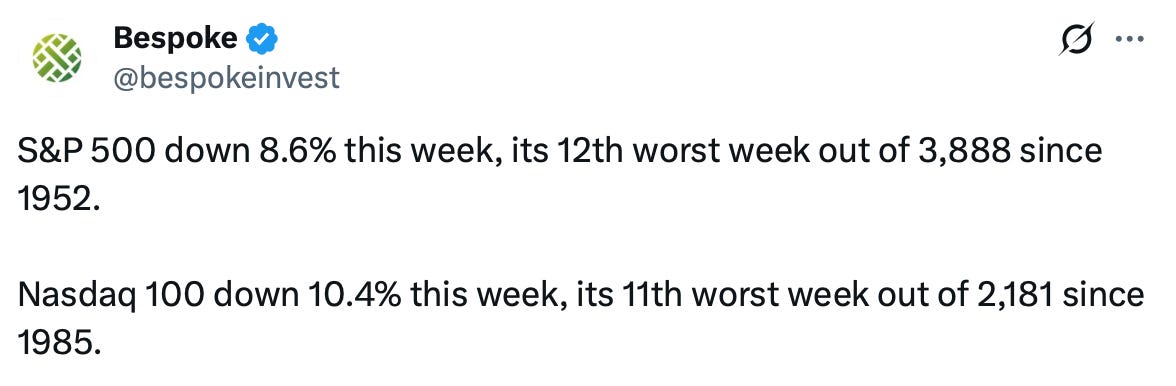
The 12th worst week for the S&P 500 in more than 70 years. This wasn’t a normal dip. This was one for the history books.
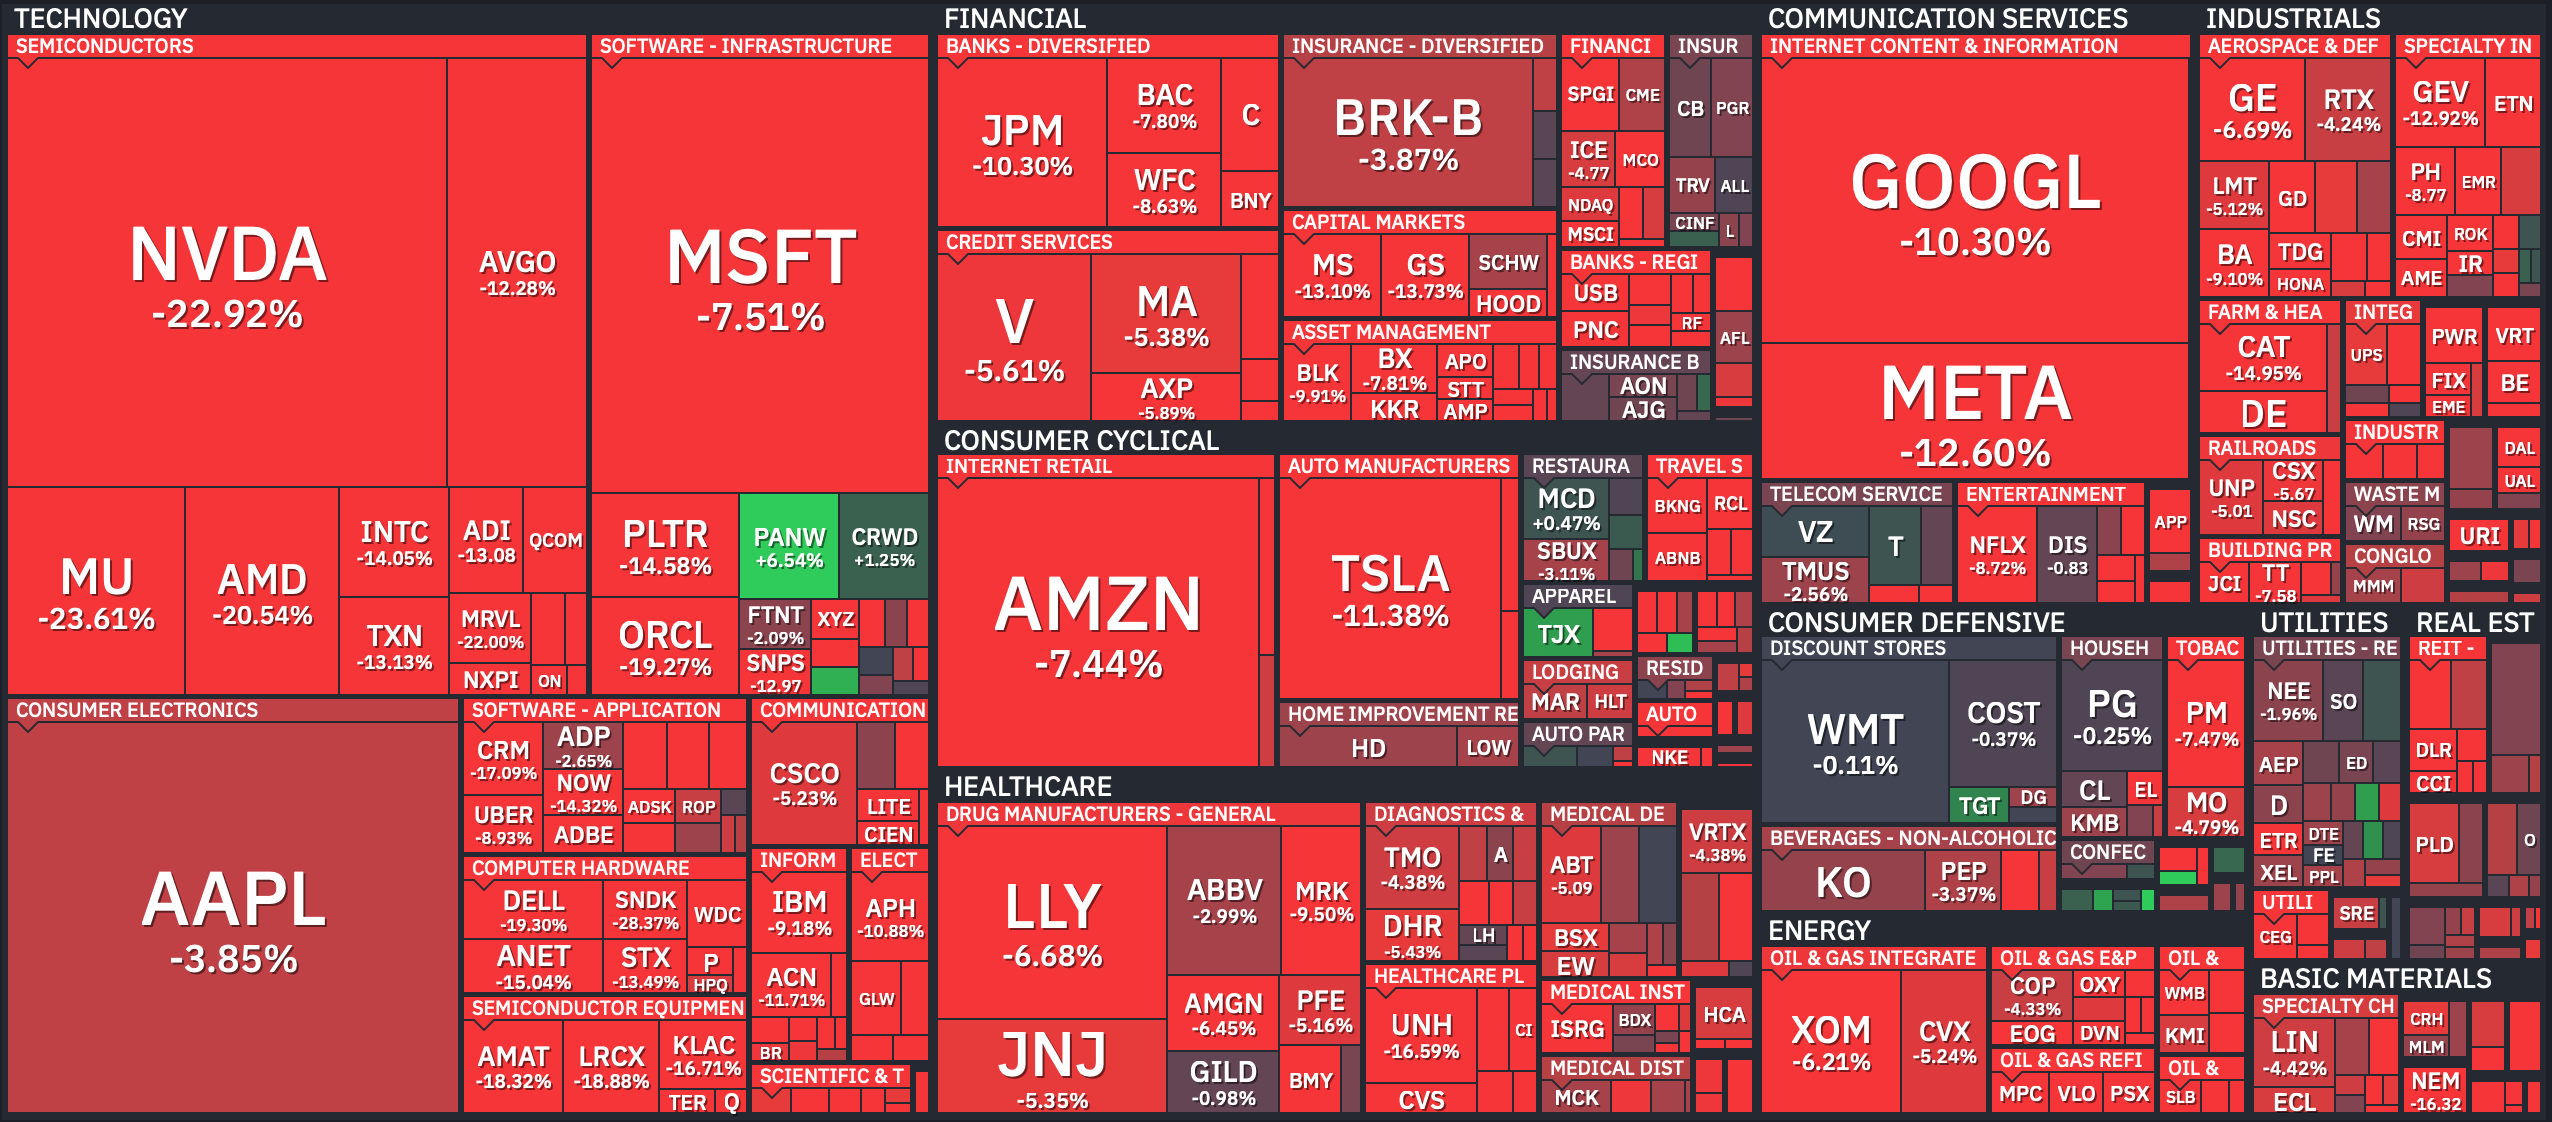
Weekly Heat Map of Stocks
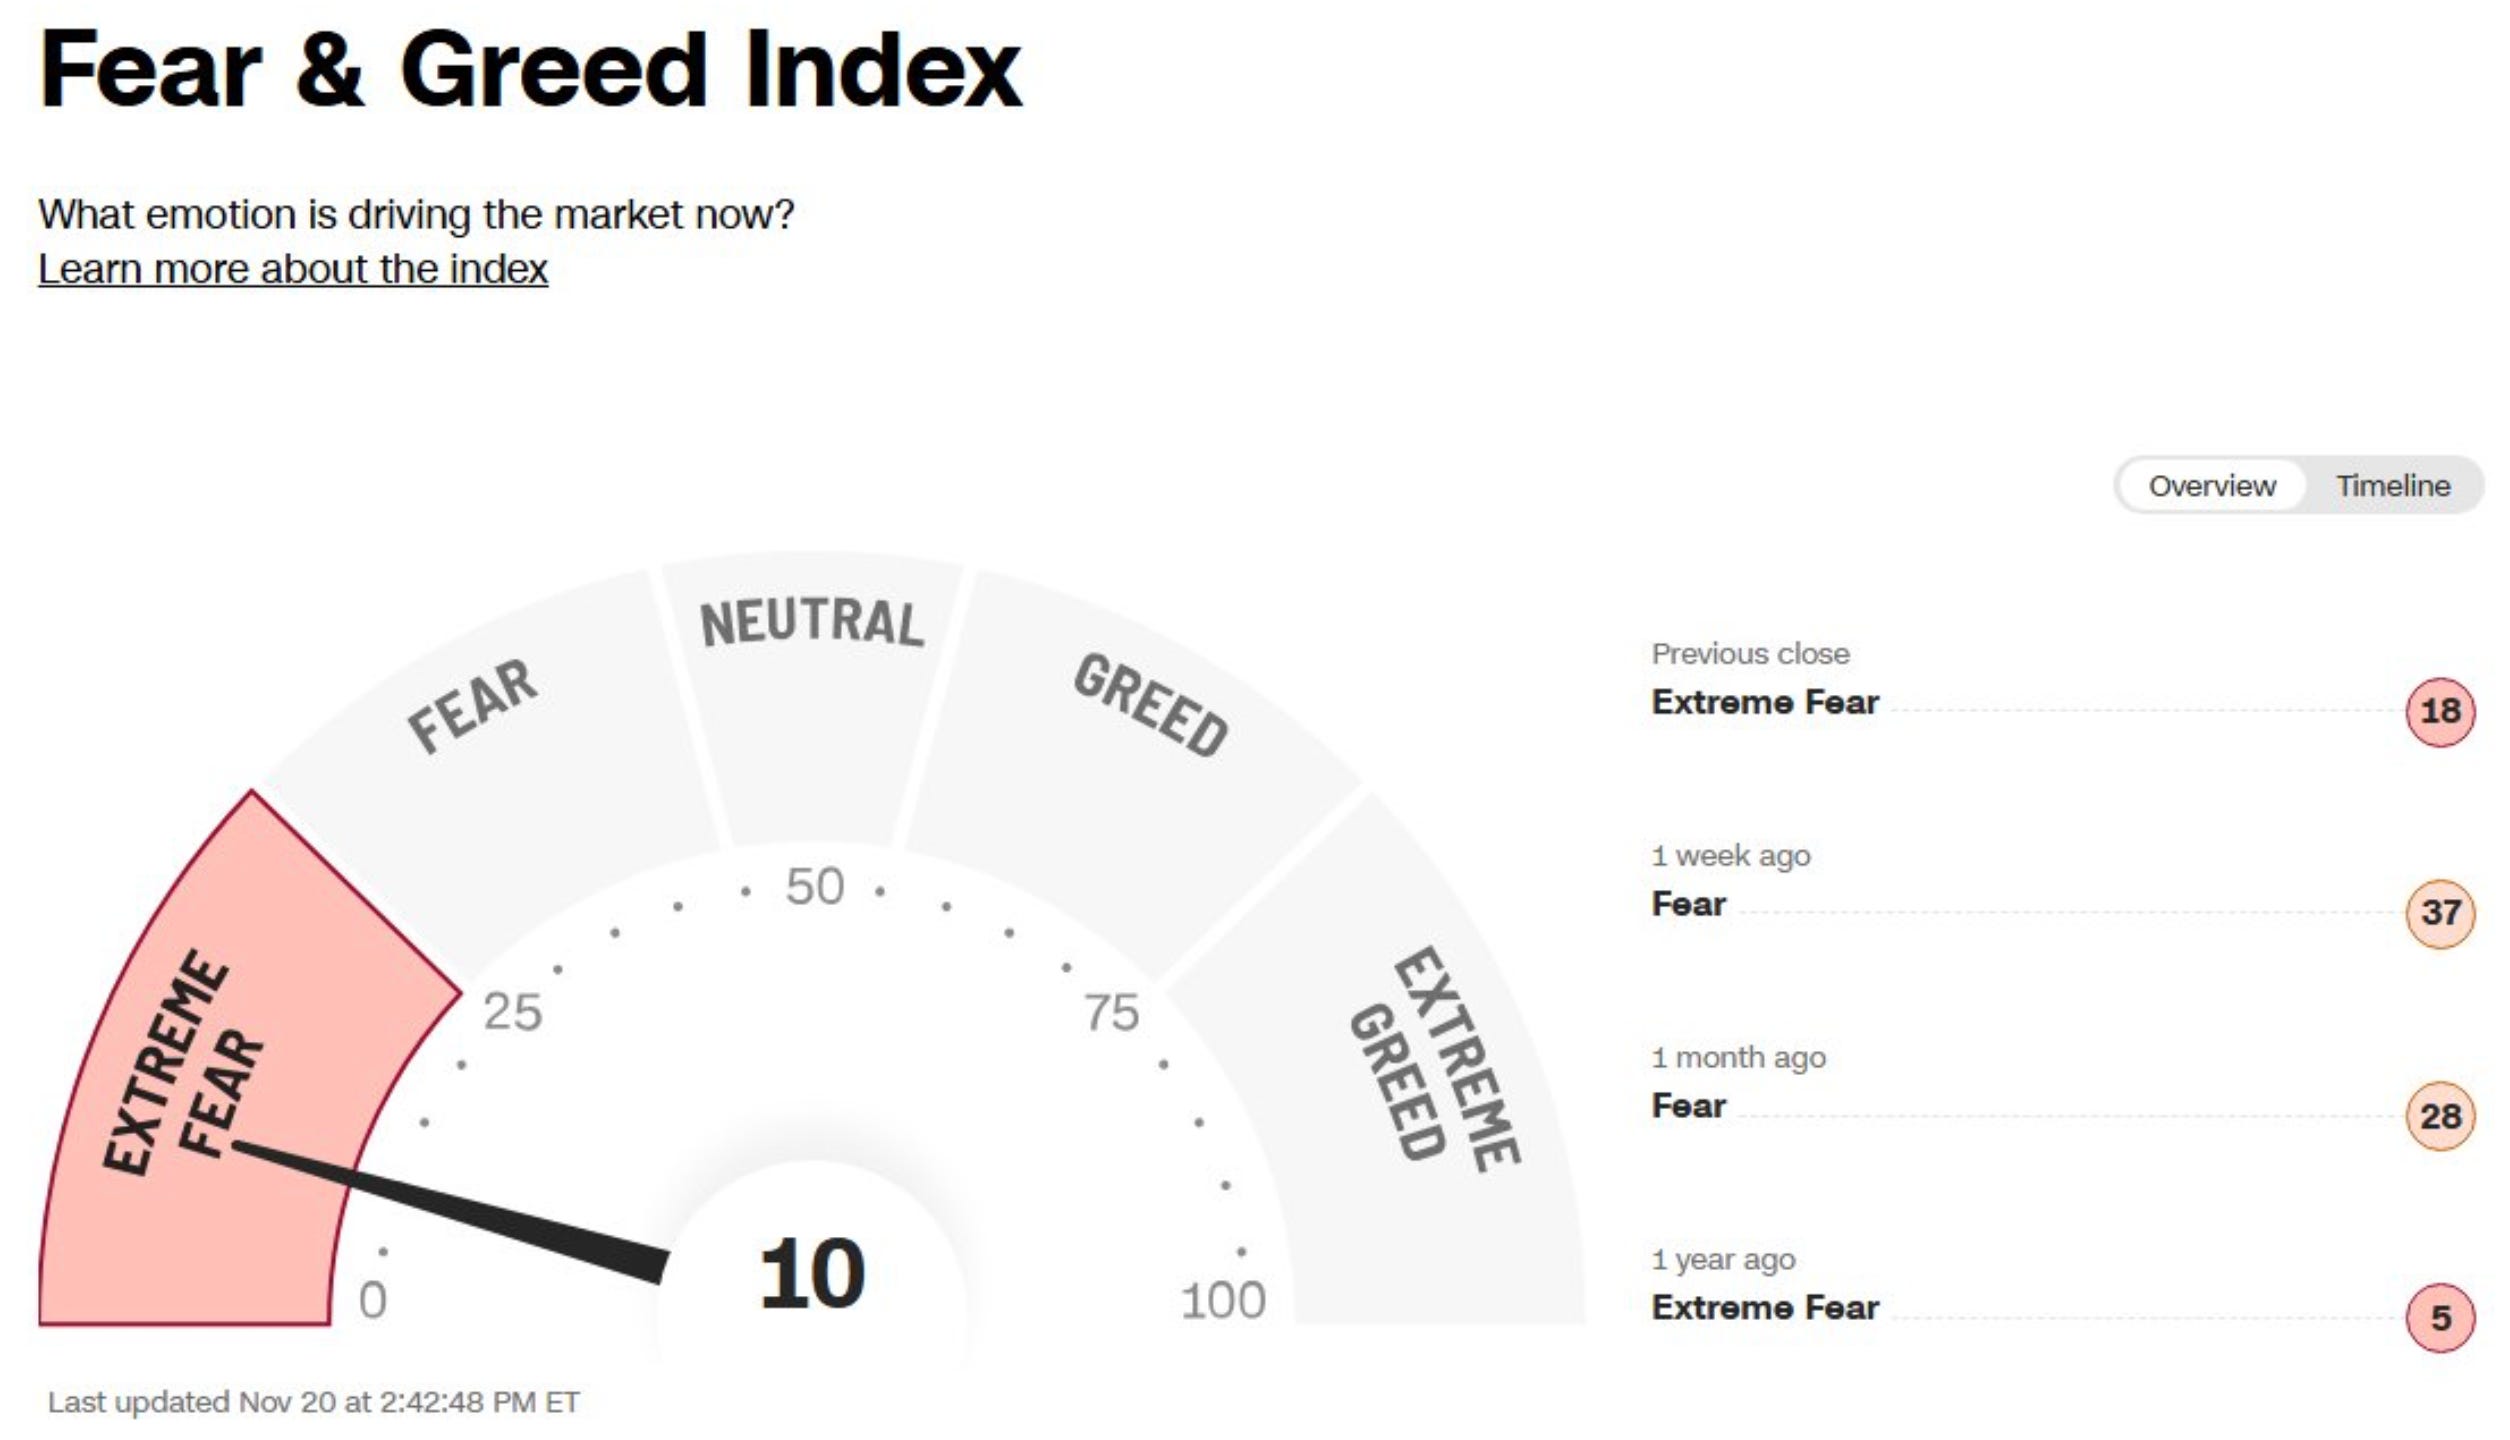
Sentiment Check
Fear is back. The Fear & Greed Index tells you just how quickly the mood changed.
Nowhere to Hide
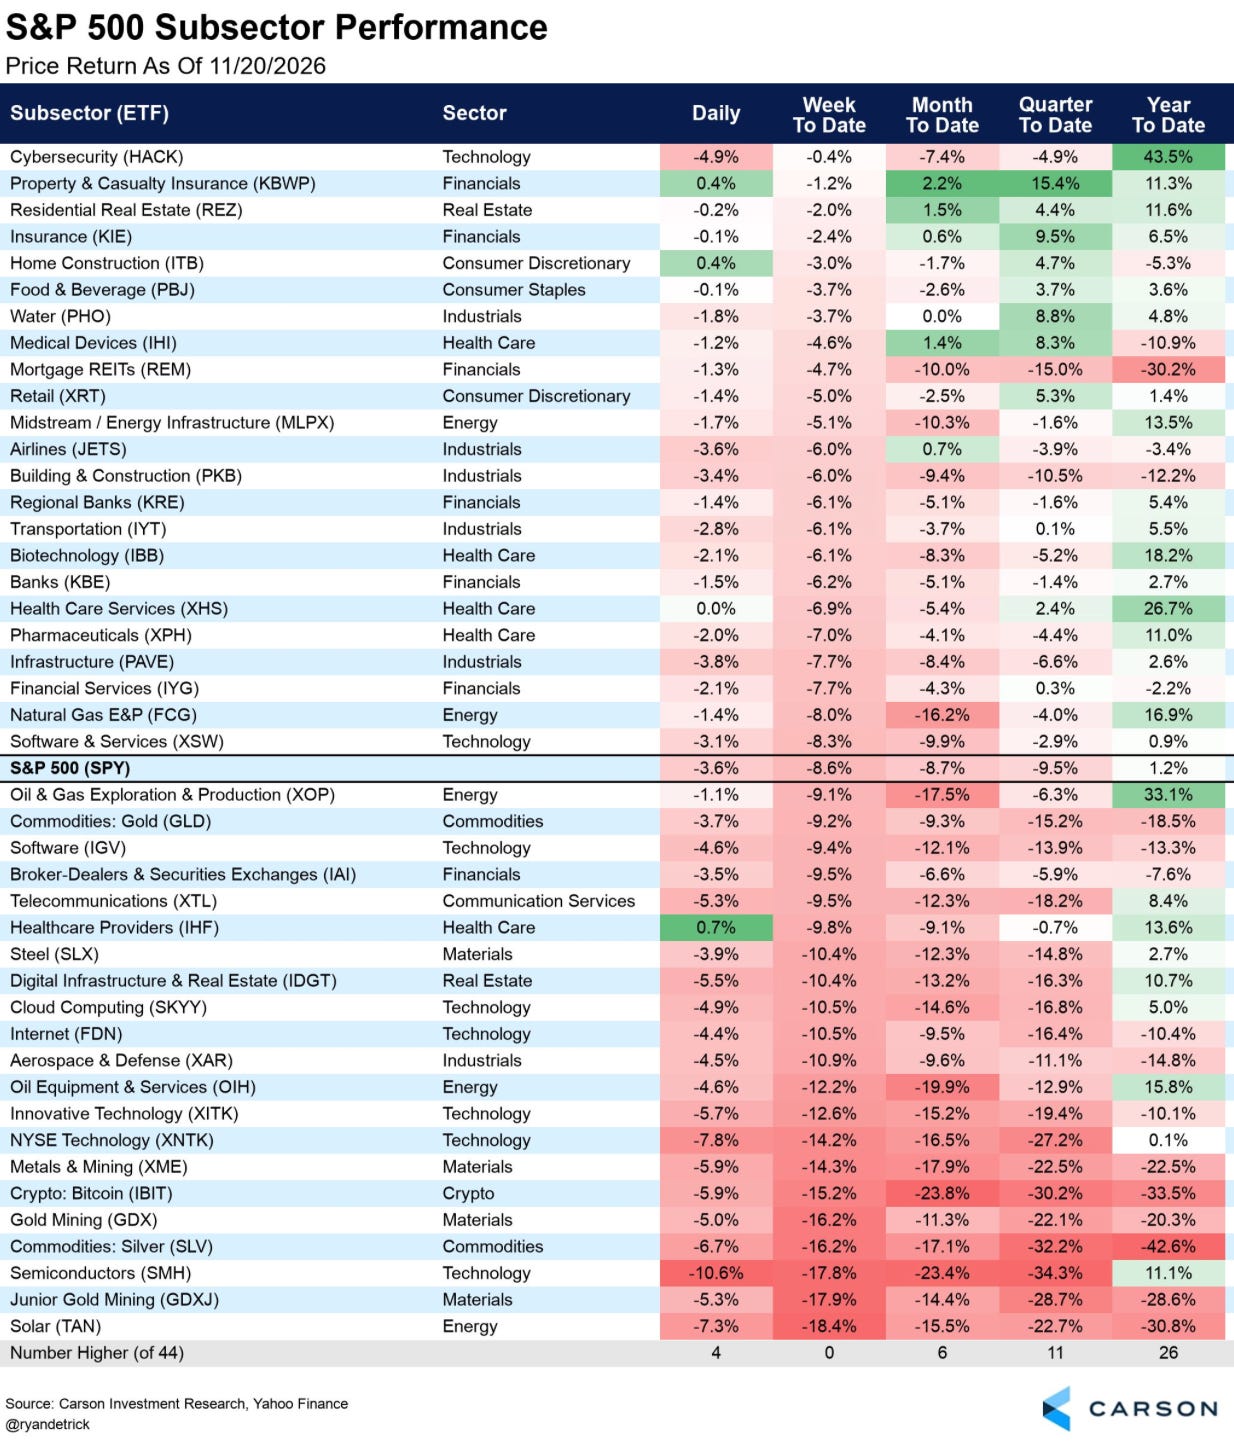
Not one of the 44 subsectors in the S&P 500 finished the week higher.
Seven Red Days. Now What?
Everything hit at once this week. An AI trade still reeling from losing its leader. Questions over how all these data centers get financed. Fed hike fears. The Iran war. Hedge funds running for the exits. Nvidia under an SEC microscope, with growing scrutiny of its China ties. And a Friday that ended about as badly as a Friday can.
For weeks I’ve been sharing the data and charts on what was going on under the hood. The internals were weakening. A pullback was not out of the question at all. But this fast? This sharp? I couldn’t have imagined it. Nobody saw that coming.
Here’s how fast. Charlie Bilello tracks every 5%+ correction in the S&P 500 since the March 2009 low. This one has taken the S&P down 12.3% from its high to Friday’s low in just 45 days. The median correction since 2009? 7.6%.
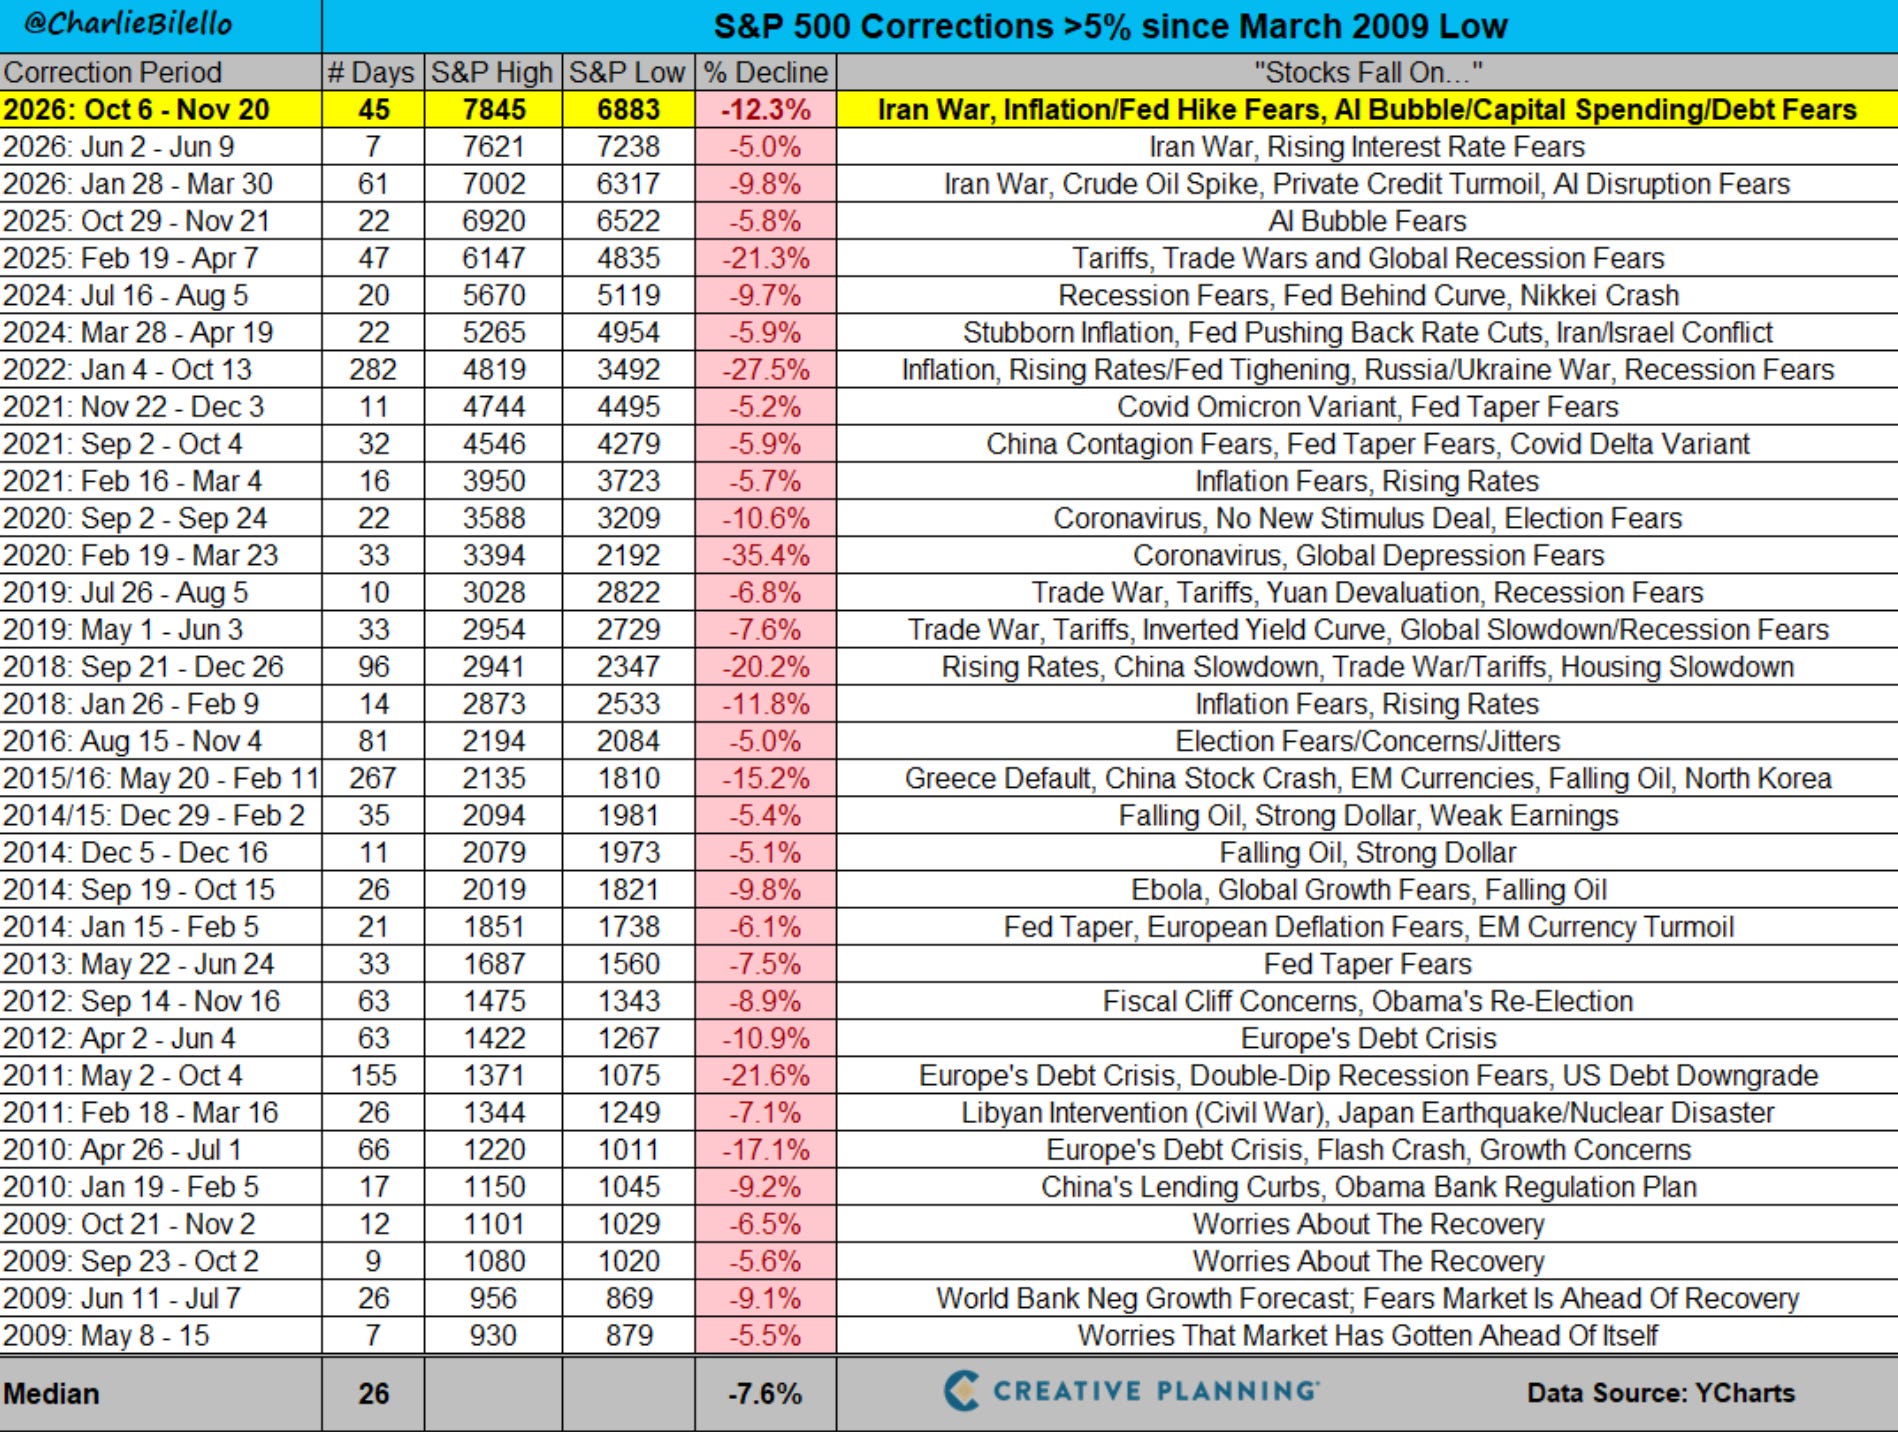
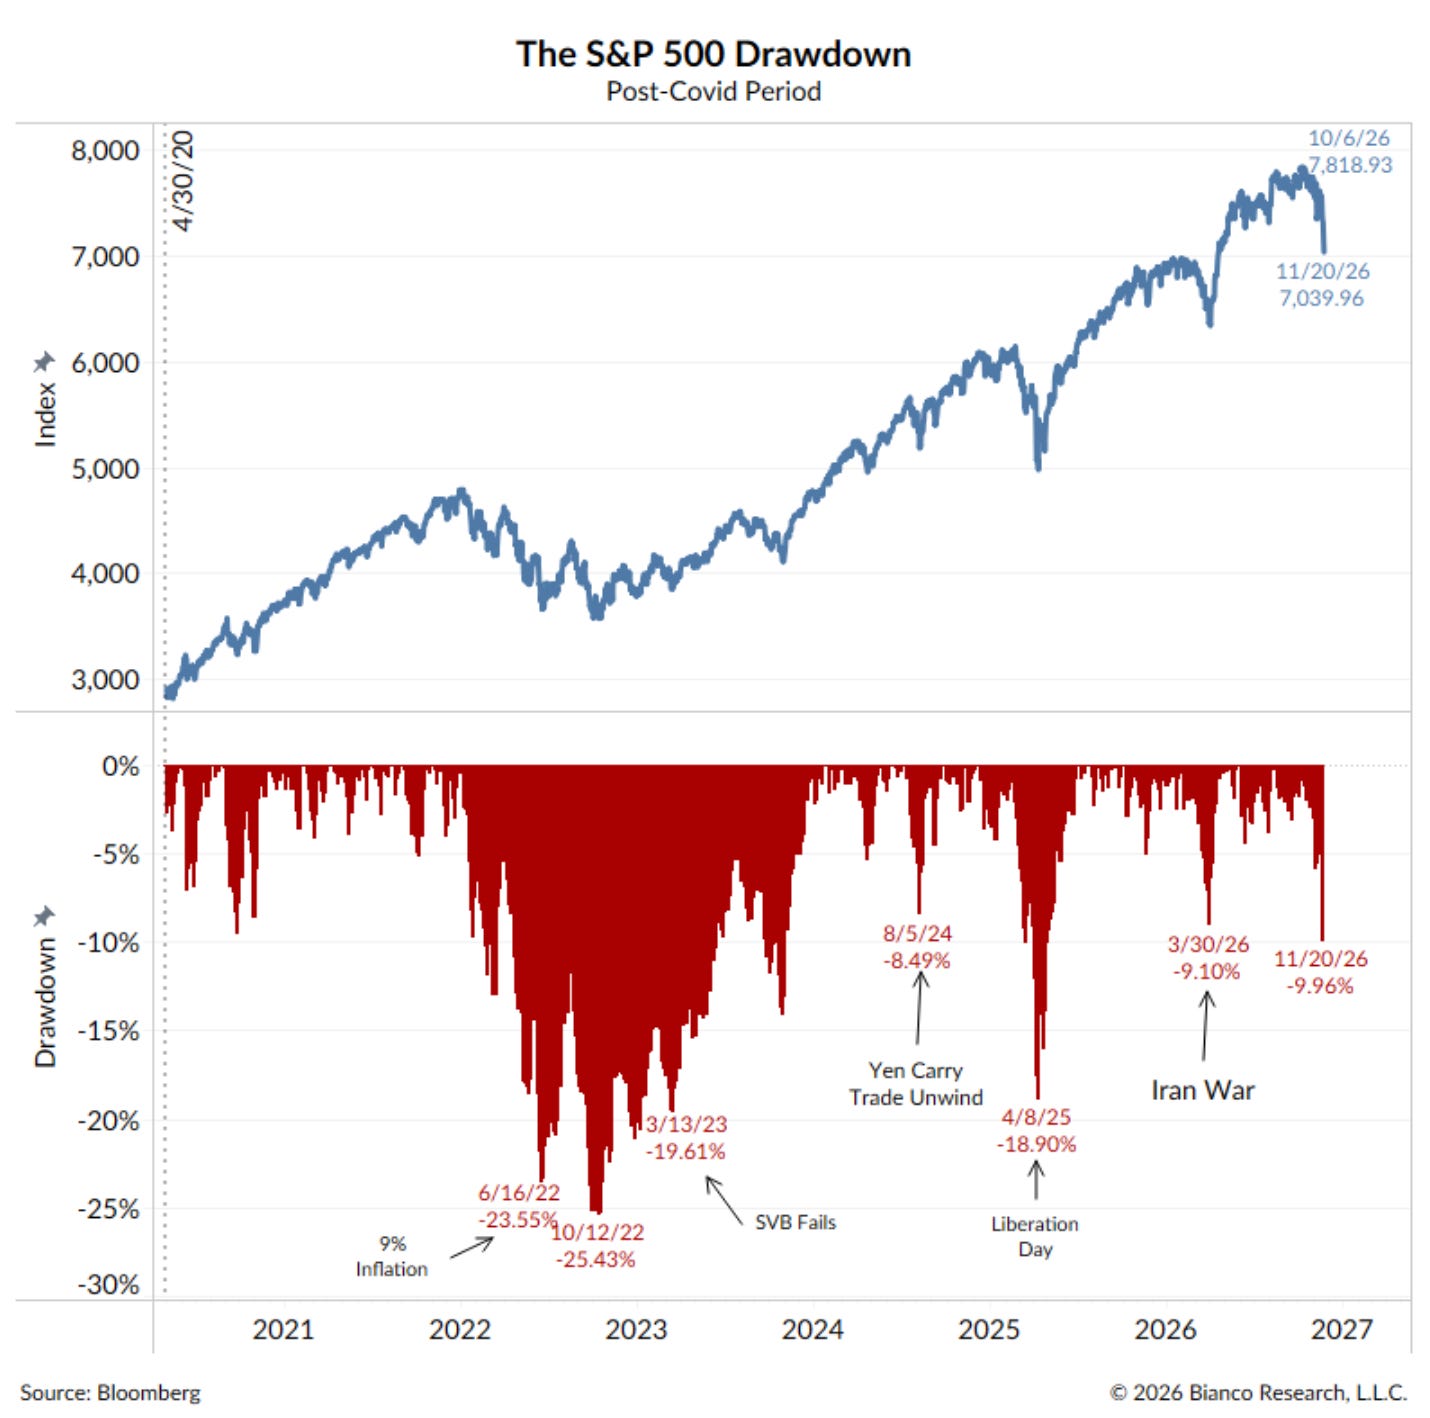
It’s the 2nd worst decline of the past two years, both in the number of days and the % decline. It’s also the biggest correction since the tariff bear market that ended in April 2025. Look at the post-Covid drawdowns and you can see how quickly this one showed up. And this chart was captured before Friday’s close. The final hour made it even worse.
So now what? After seven straight red days, what does next week hold? Is the selling over? Is this where we finally get the bounce?
I started writing this midday Friday feeling pretty bullish. Then came the last hour of trading. It left me with more questions heading into the weekend.
Here’s where I stand.