
Investing Update: Q3 Recap & Q4 Outlook
What I'm buying, selling & watching
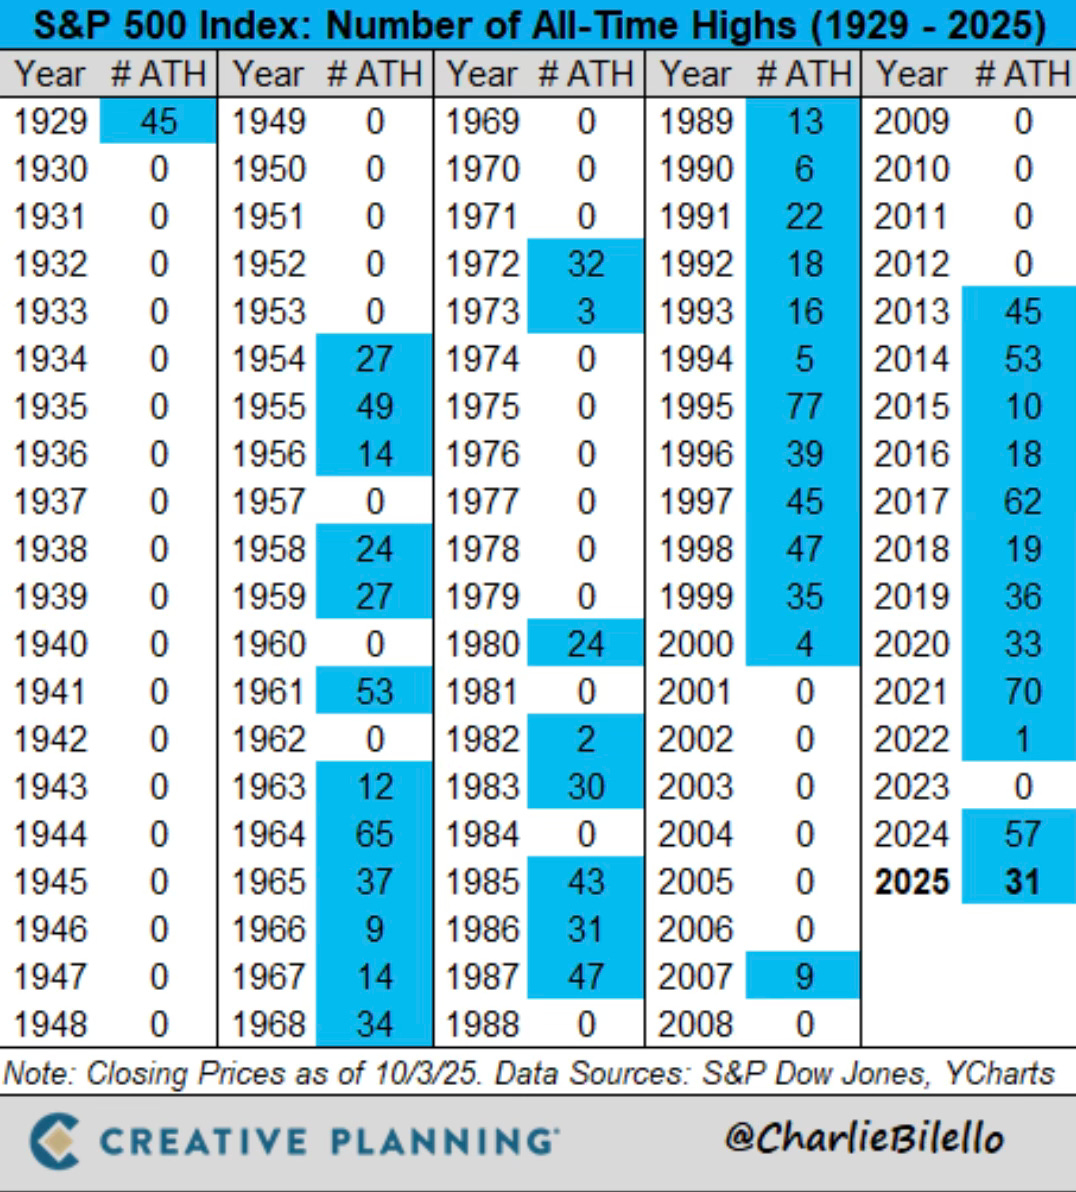
The S&P 500 just inched out another new all-time closing high for 2025 to end the week.
Friday saw the 31st new all-time high in the S&P 500. That makes 7 out of 10 months that we’ve had new all-time highs. March, April and May were the only months not to see a new all-time high.
This now marks the 4th positive week of the past five.
The S&P 500 closed September on a 5-month winning steak. I was the 2nd best September in 27 years. The best in the past15 years.
It was the 6th positive month in a row for the Nasdaq and the best September since 2010.
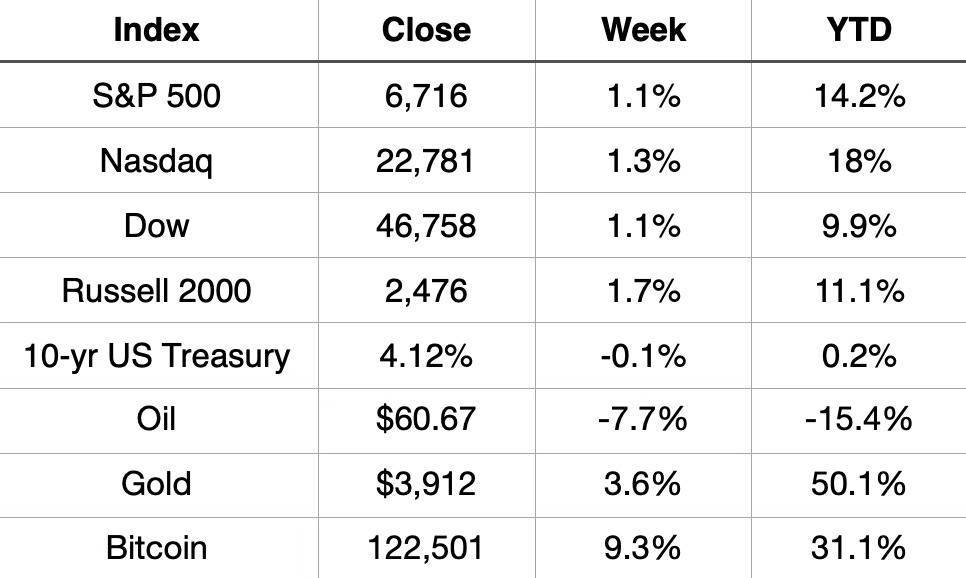
Market Recap
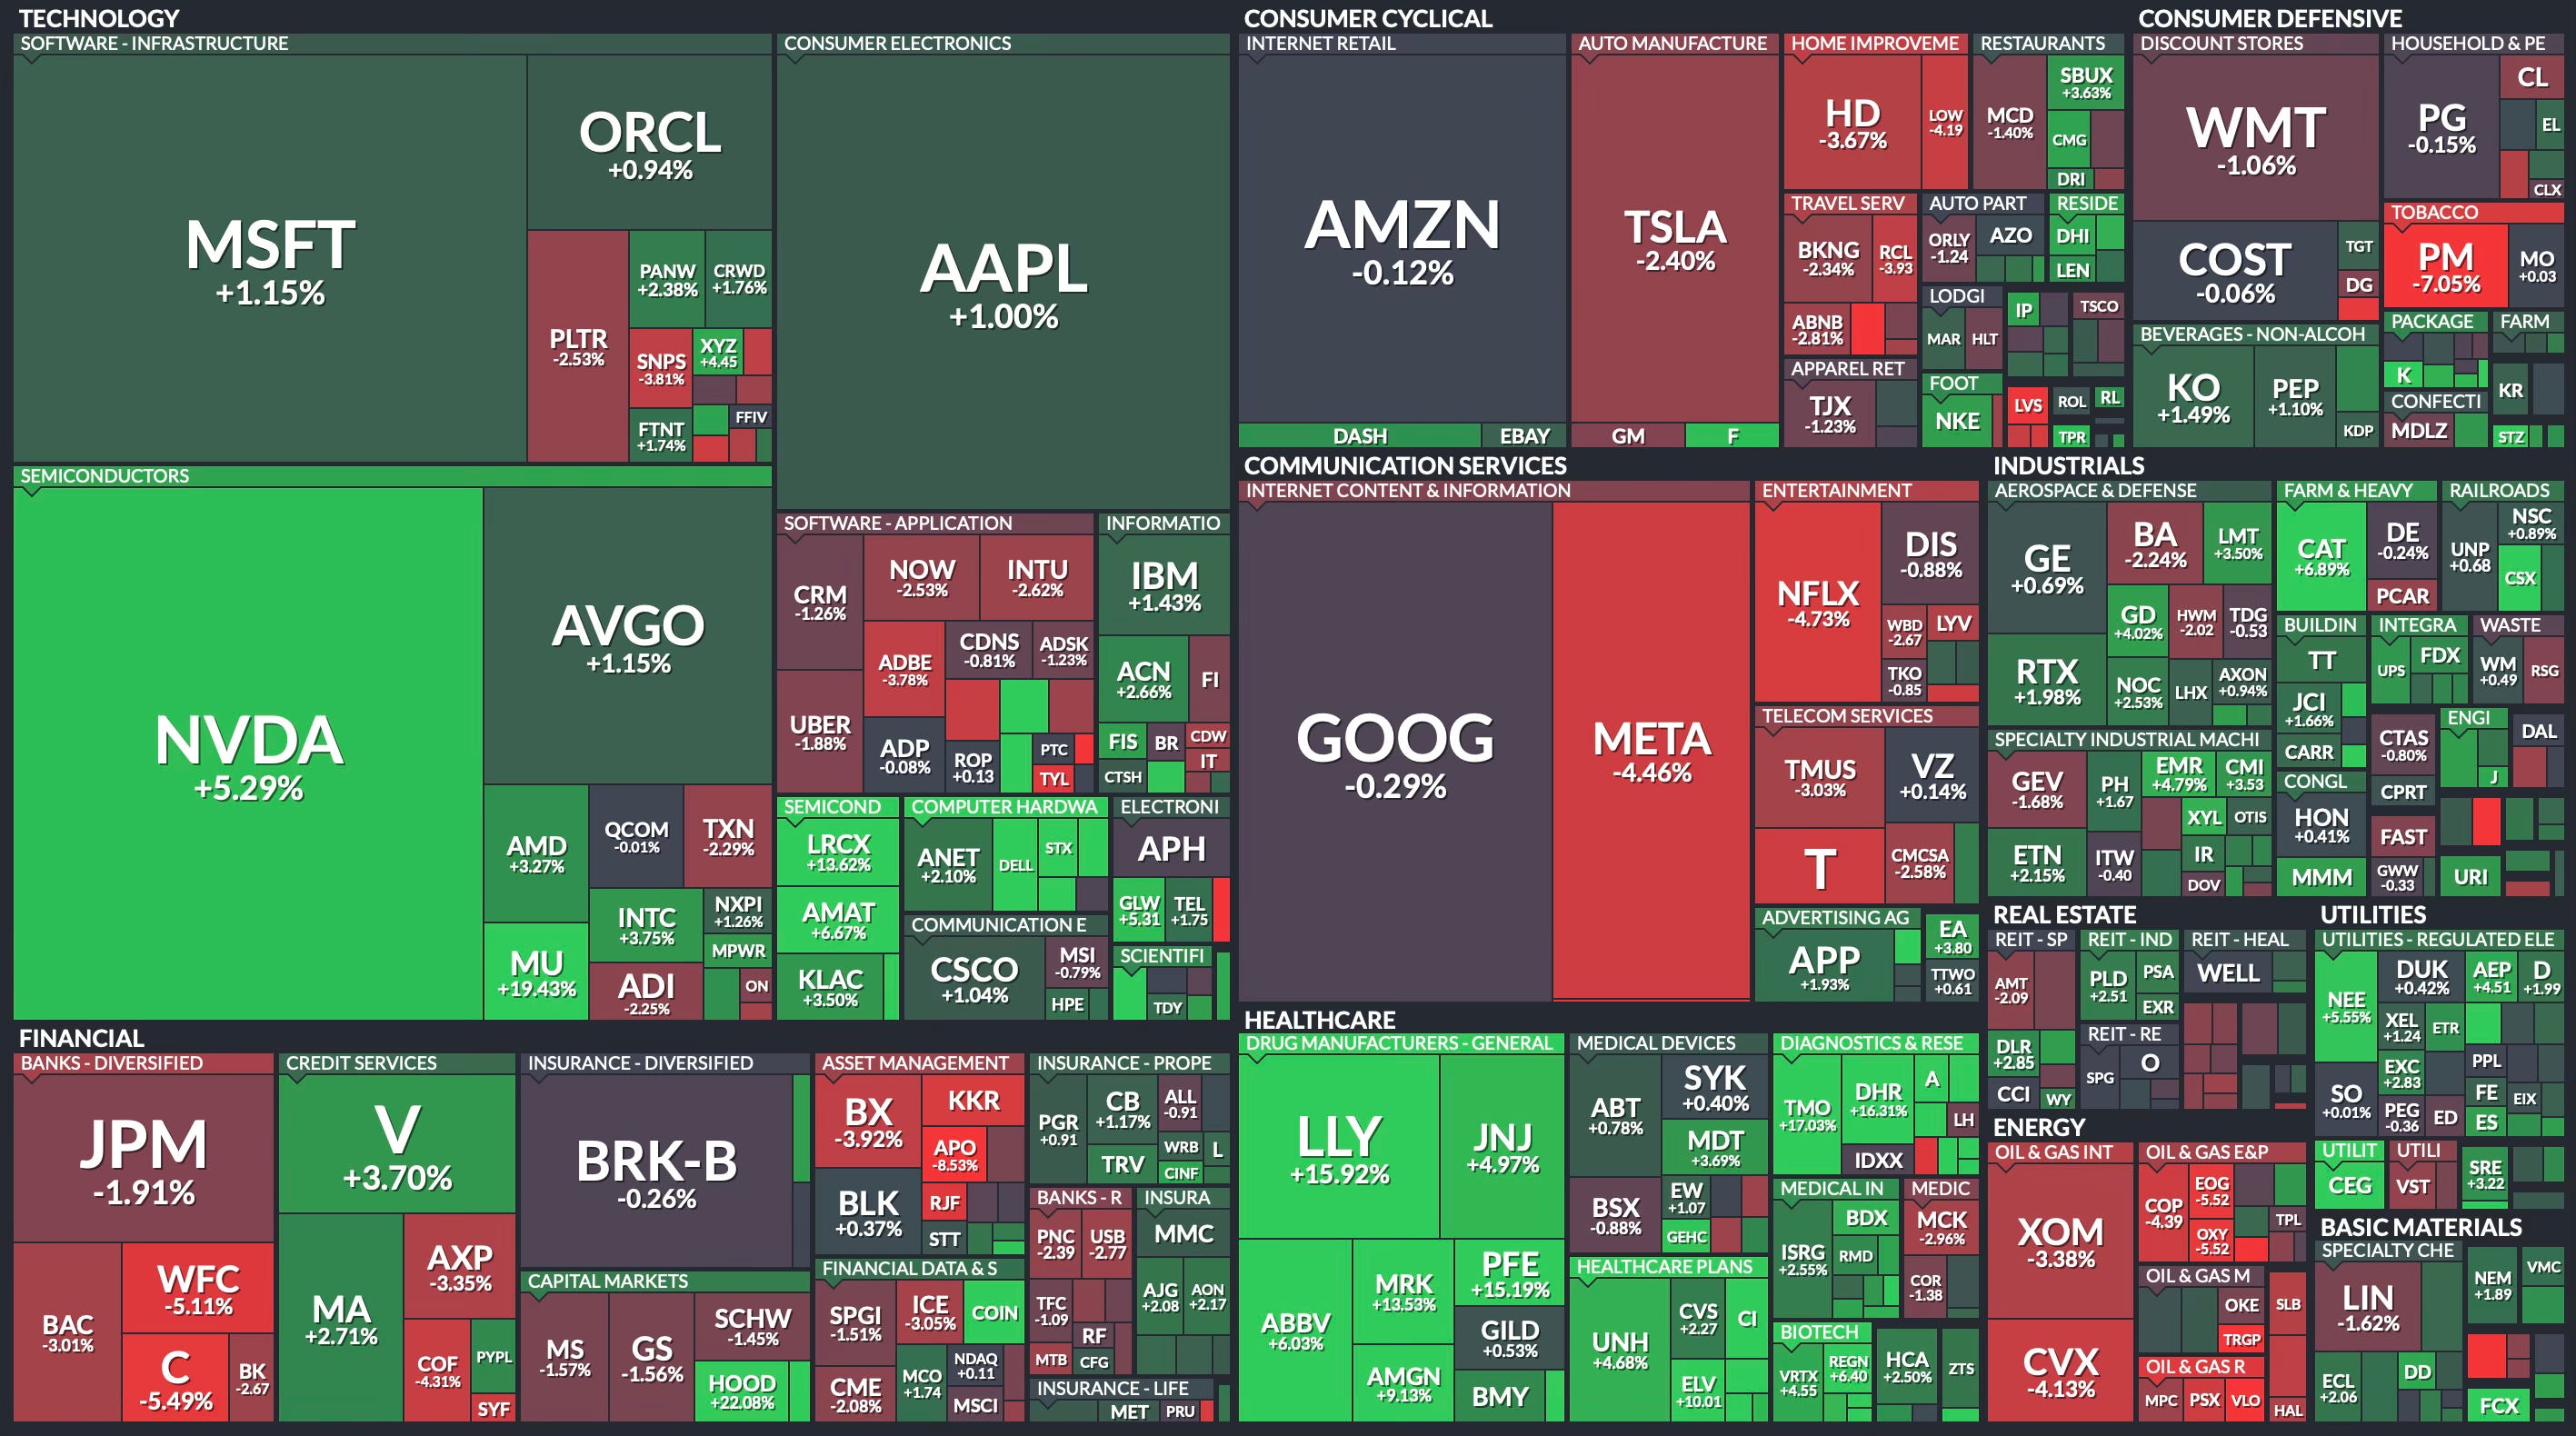
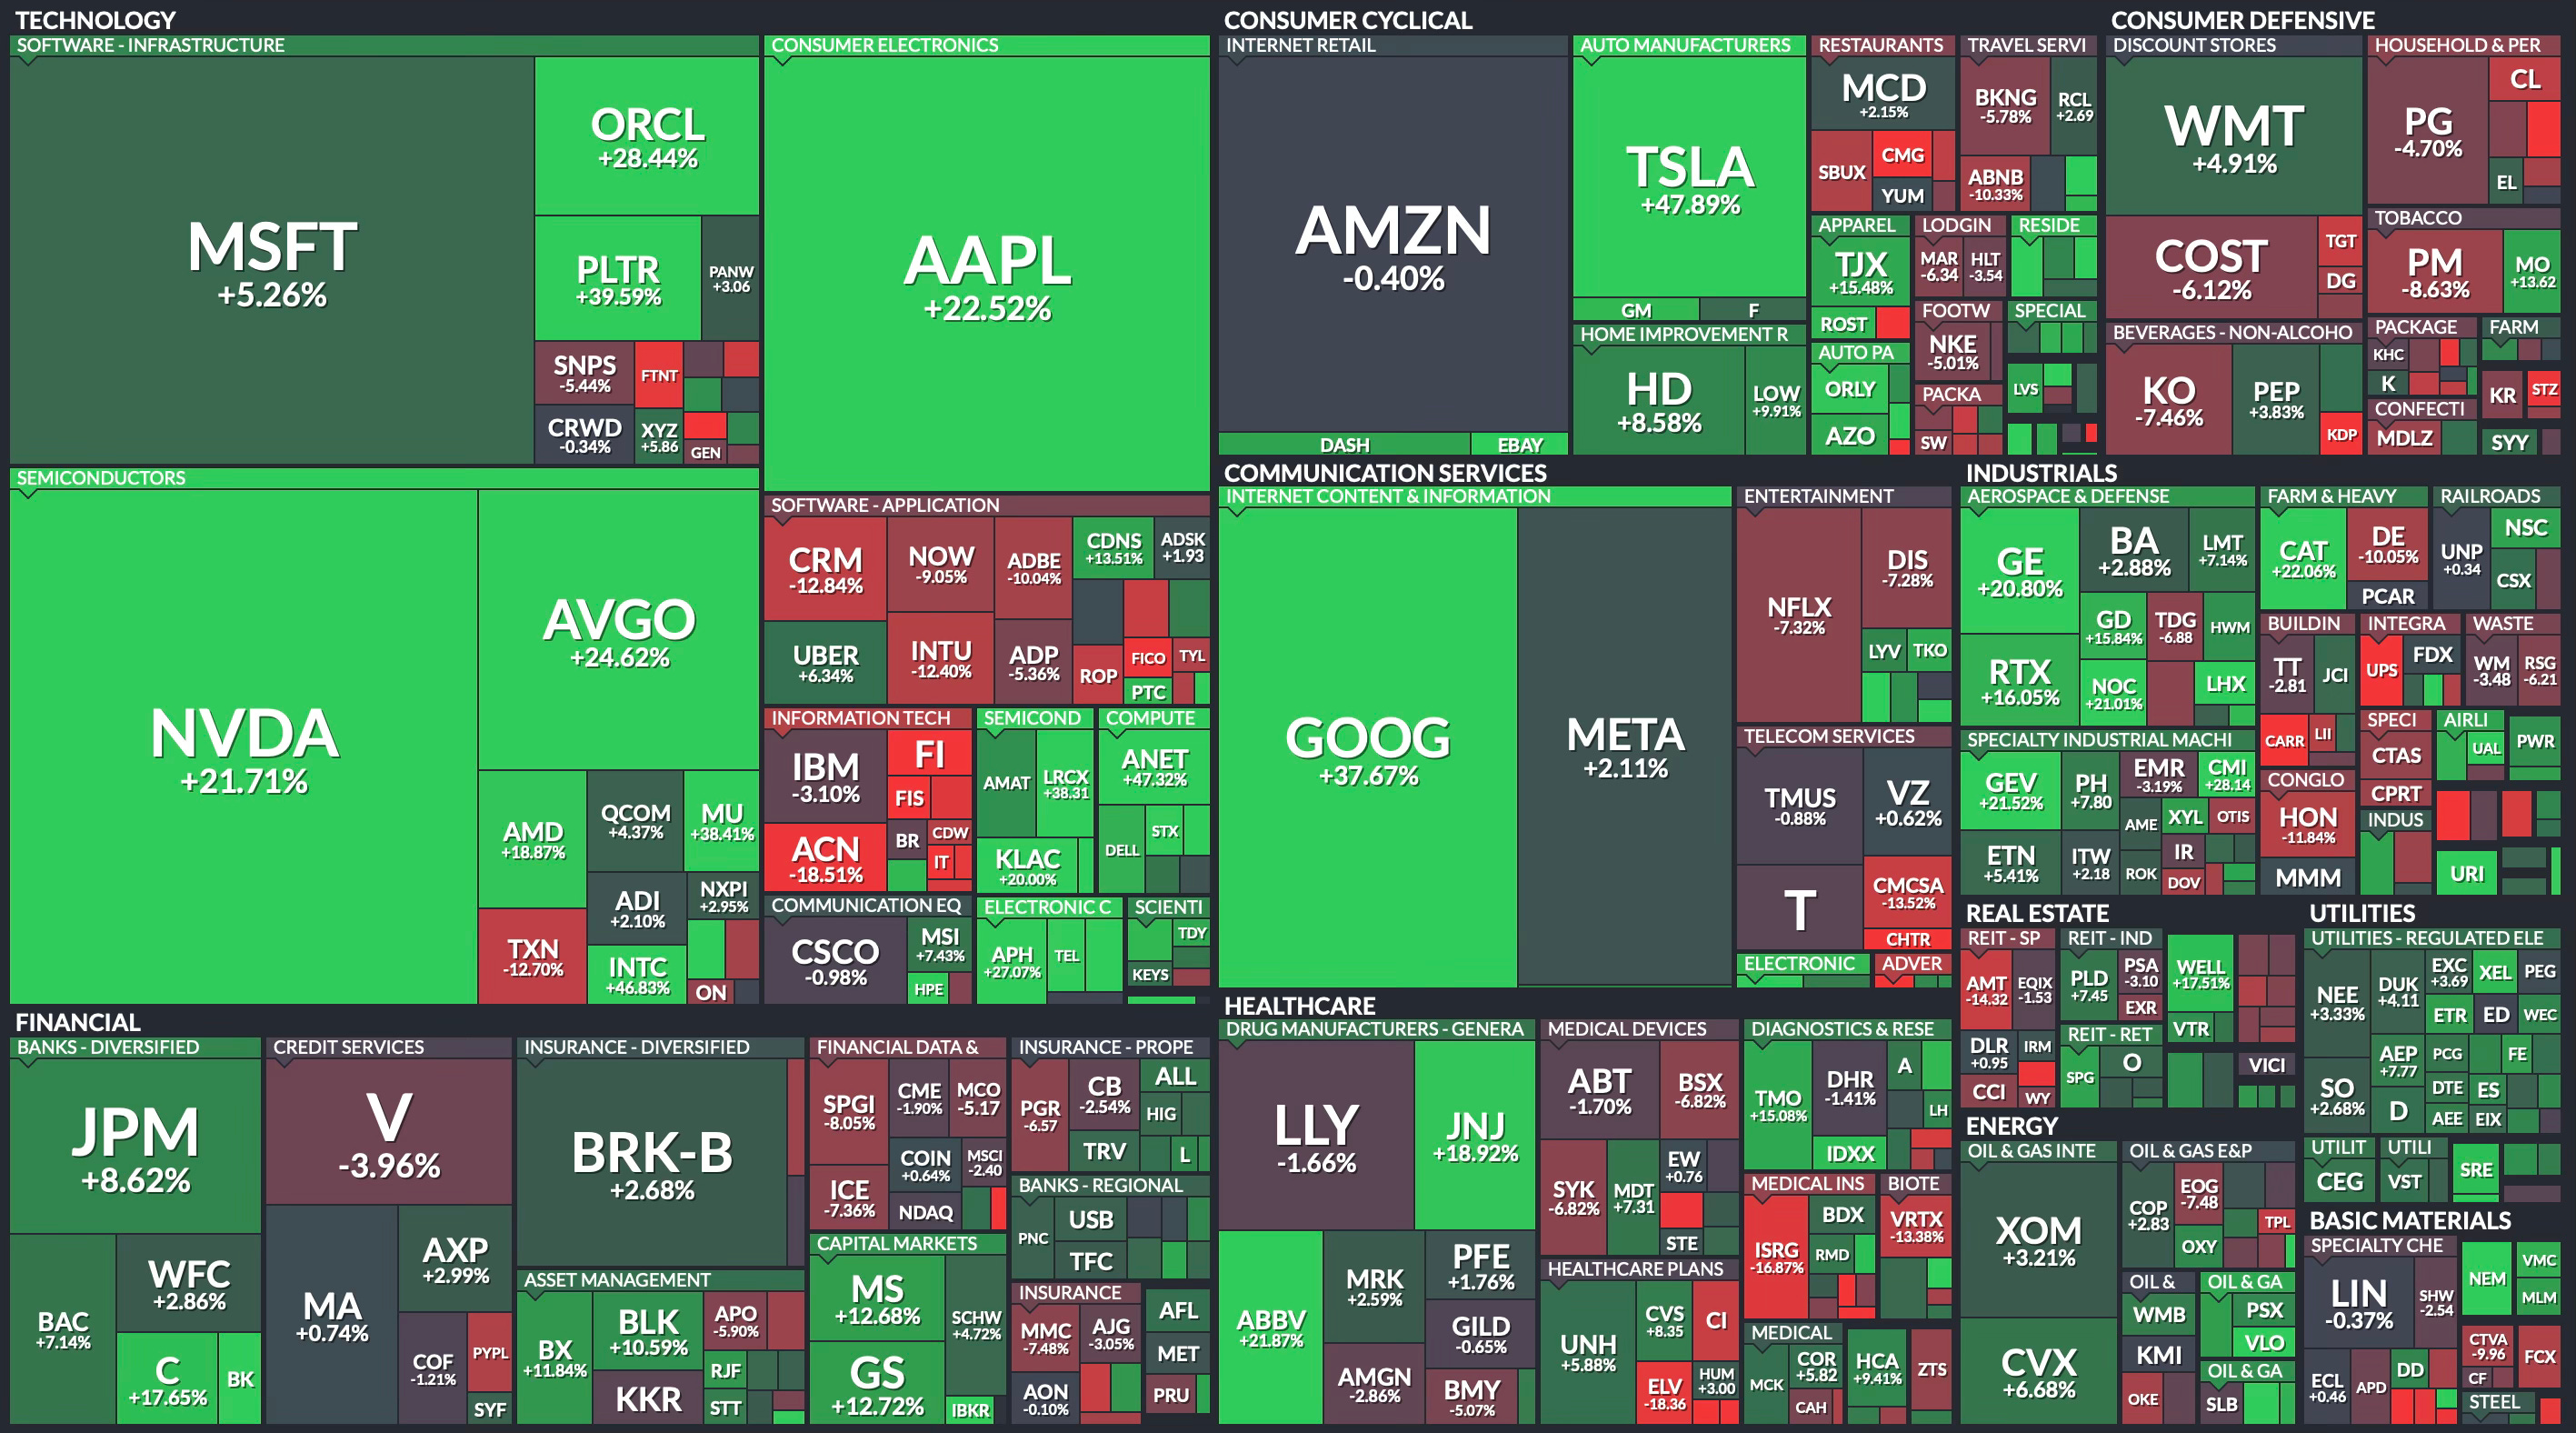
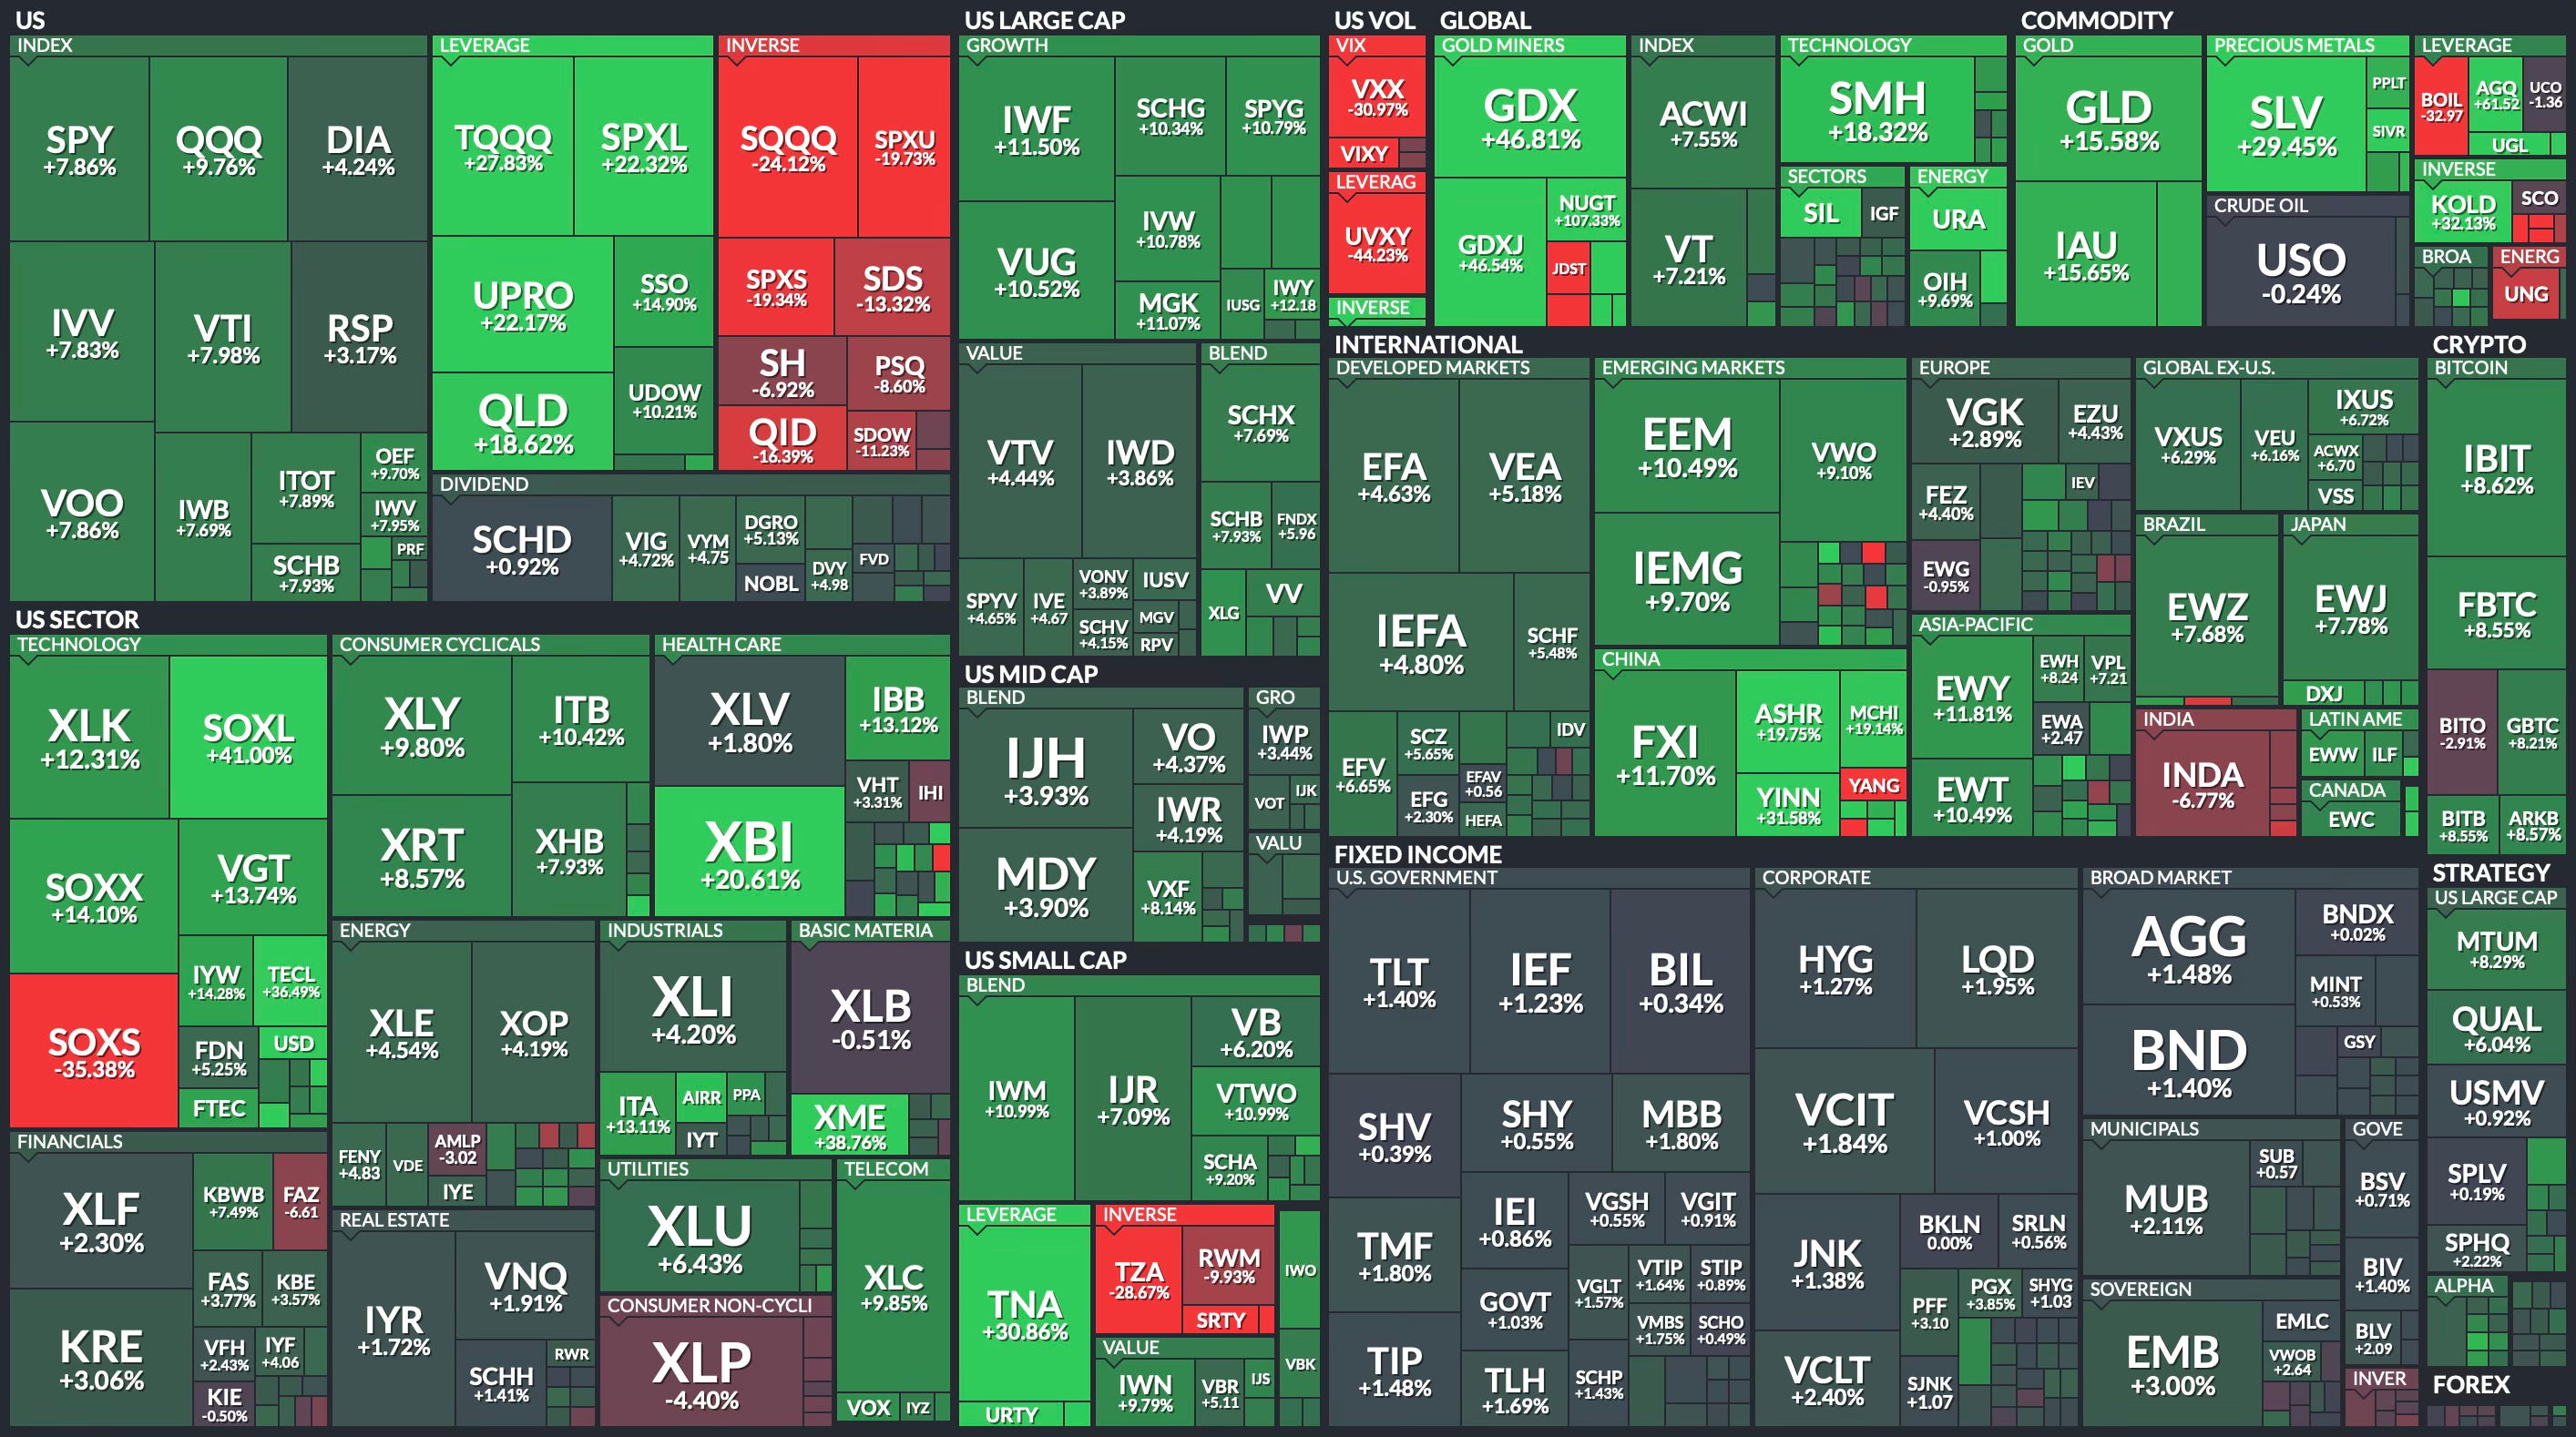
Weekly Heat Map Of Stocks
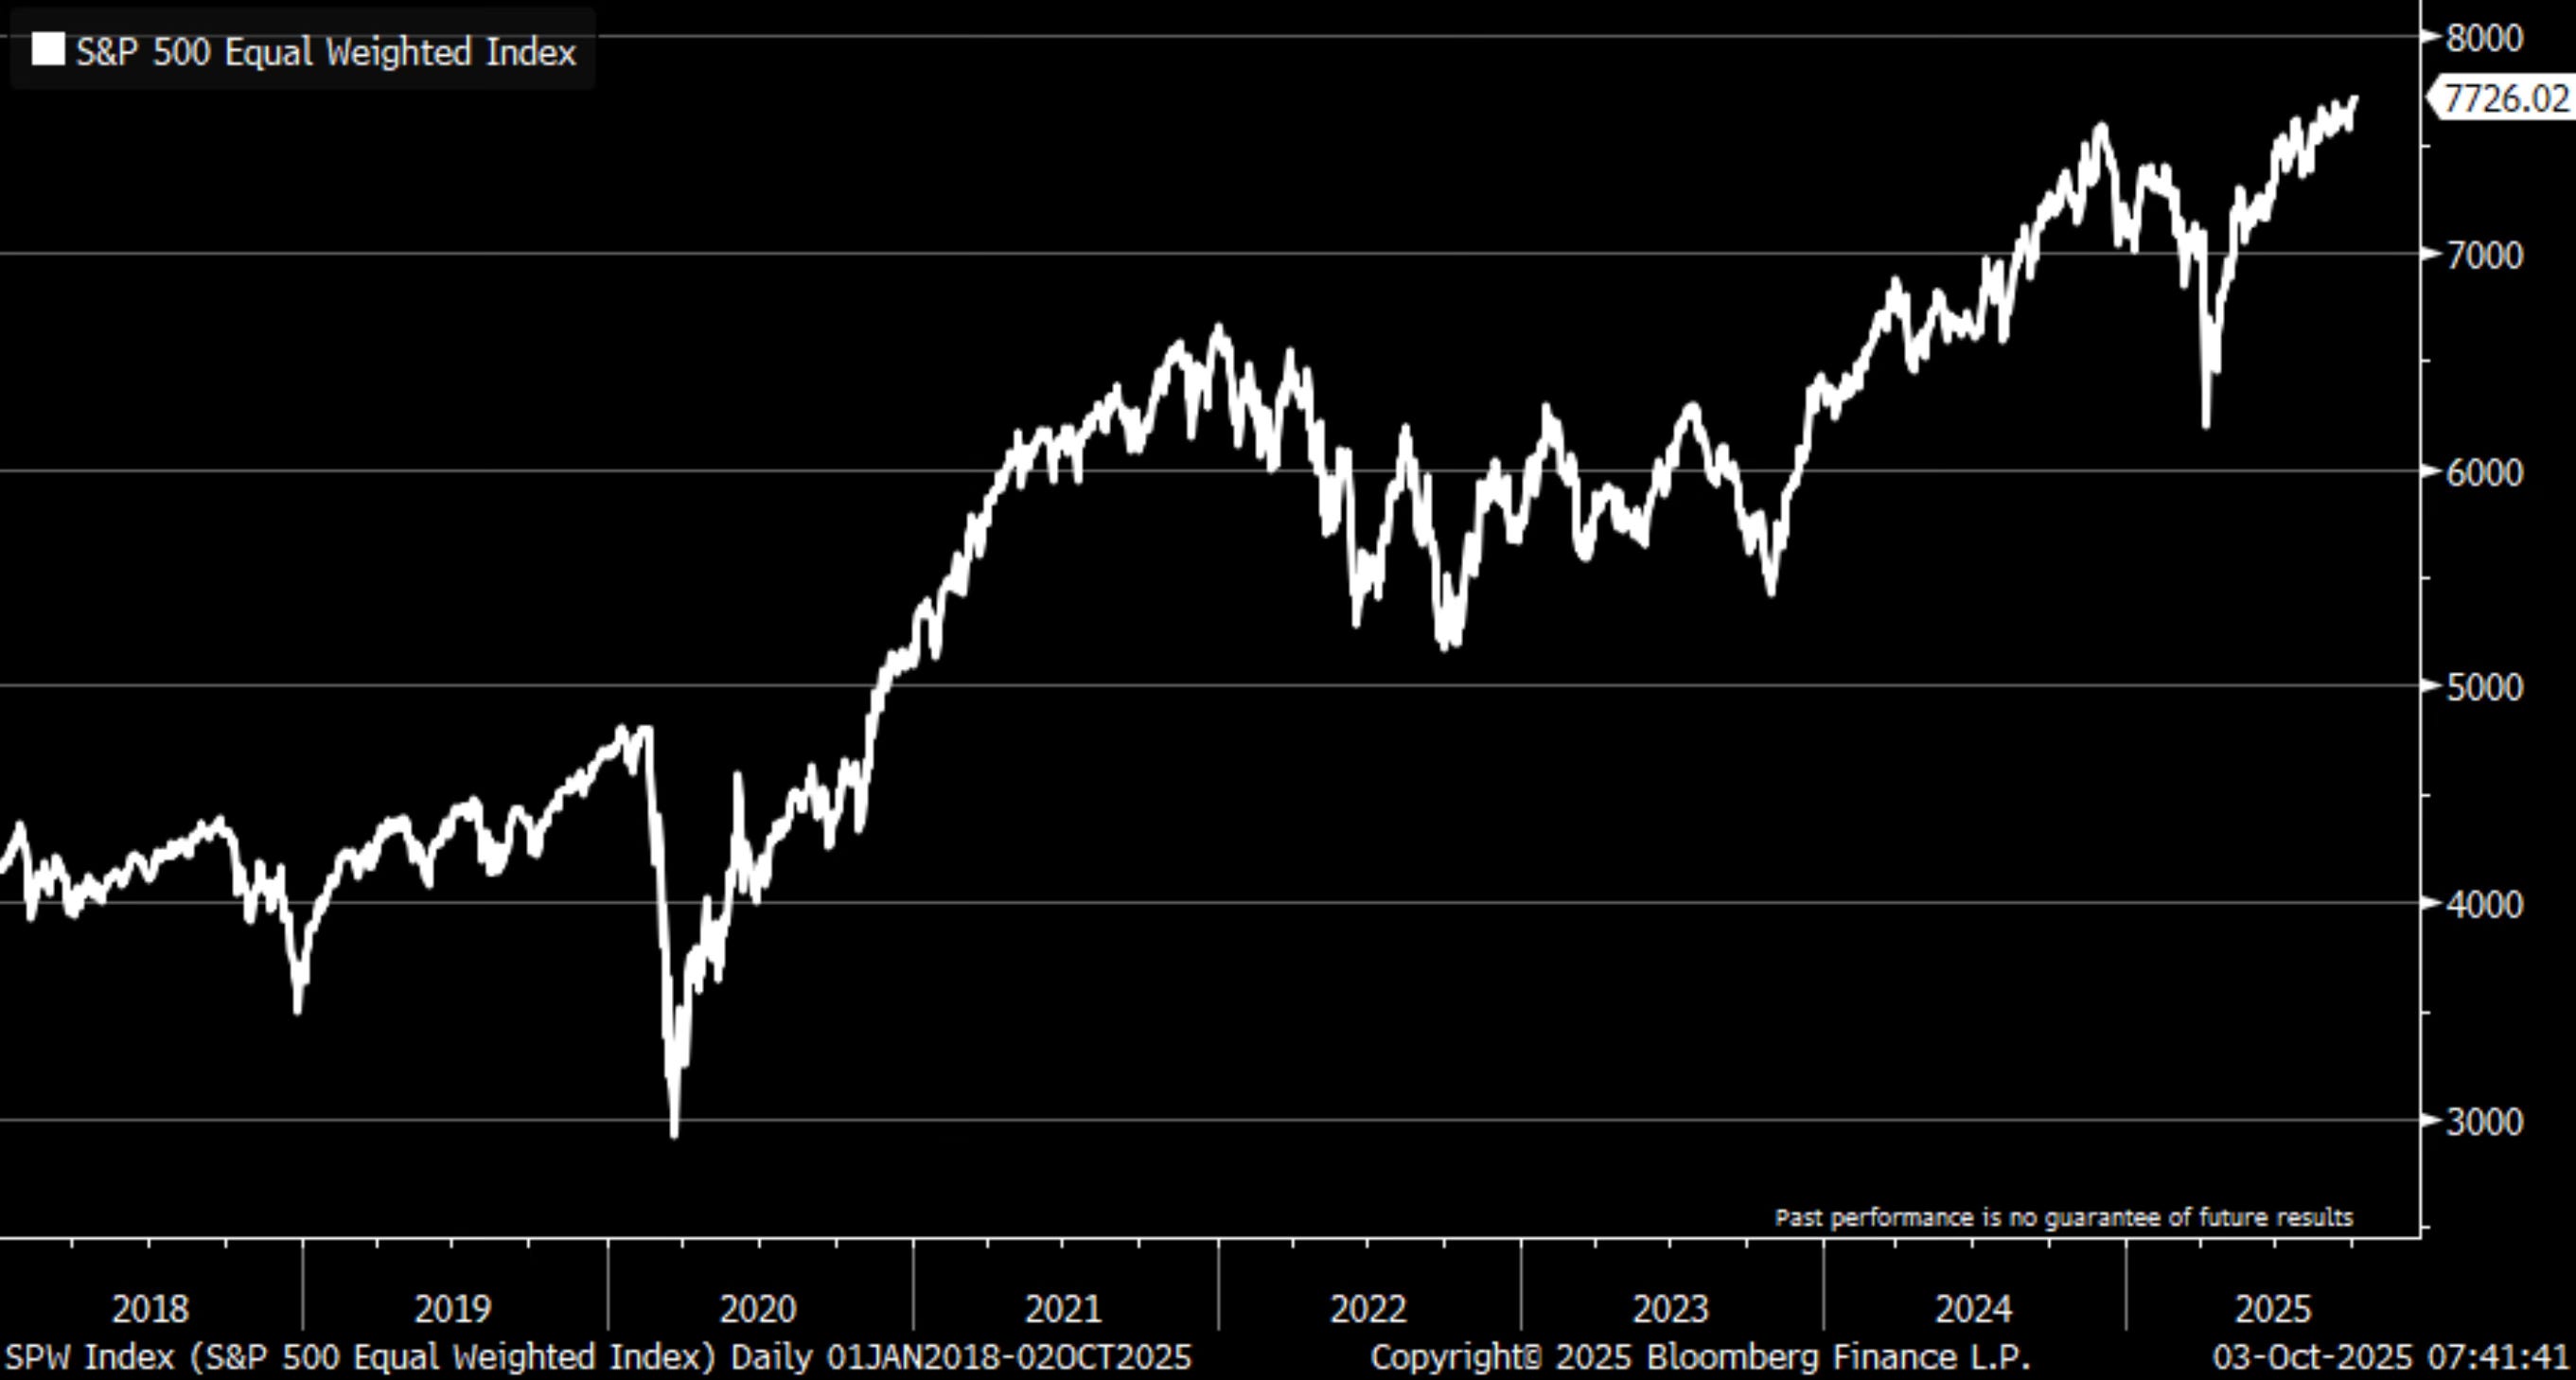
An important thing of note from this week is that the equal-weighted S&P 500 closed at a new all-time high as well. Don’t fall for the it’s only a few stocks that are up and leading this market. It’s not only the Mag 7 or AI only stocks that are up.
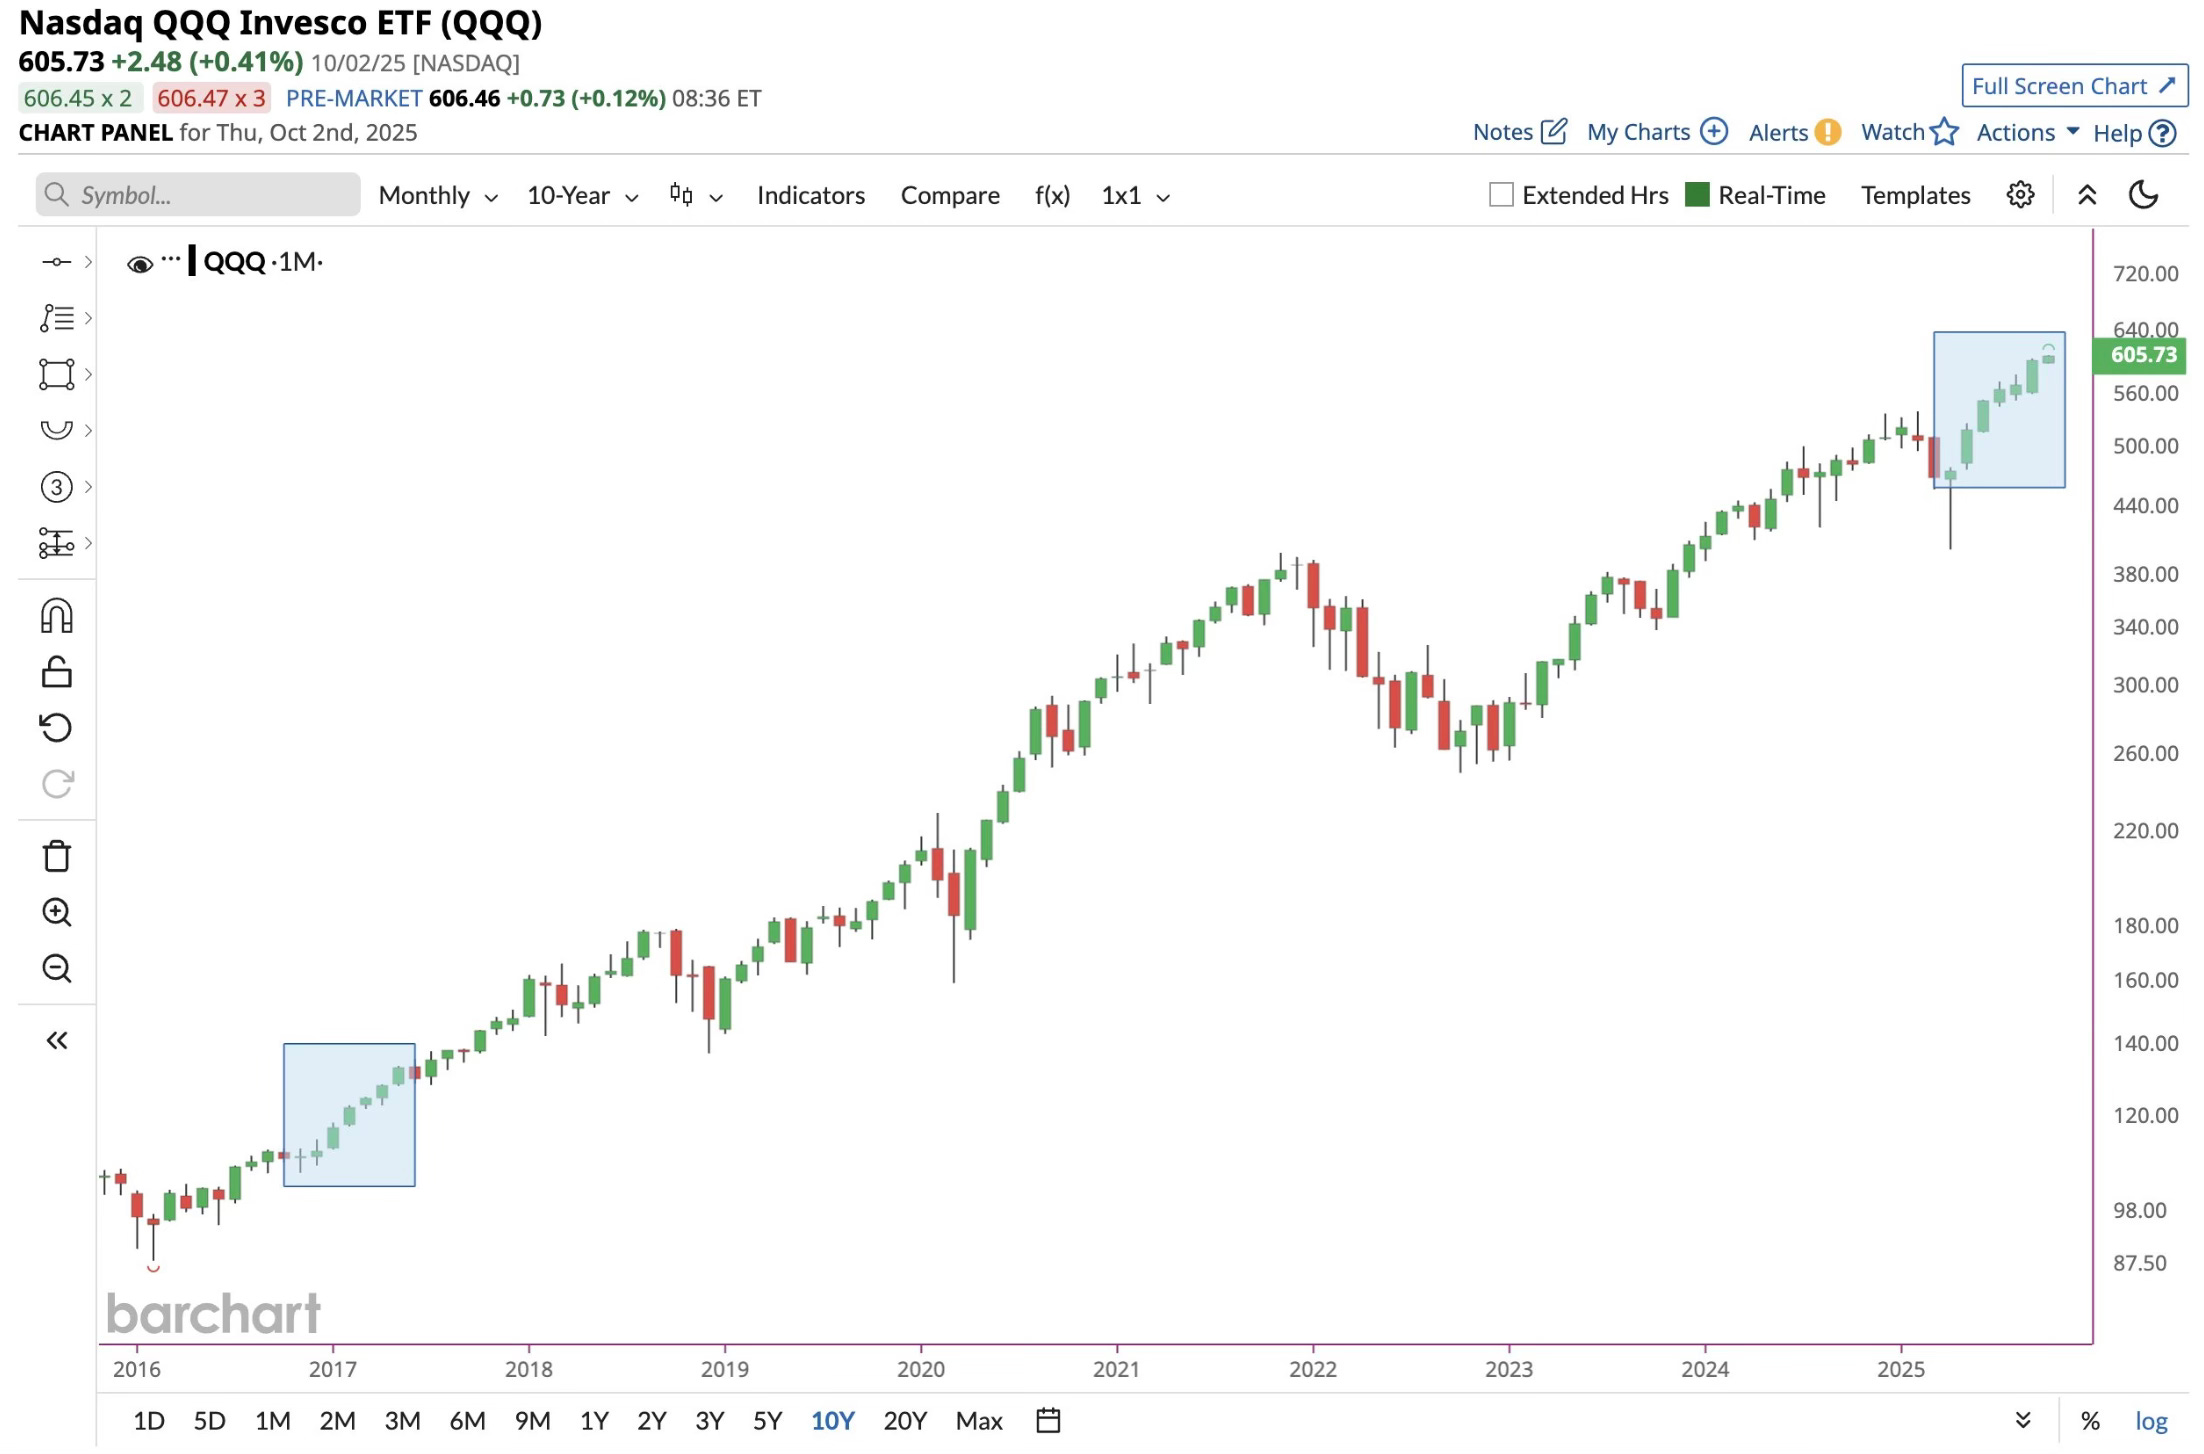
Take a look at the Nasdaq over the last 7 months. It’s a thing of beauty. It has been up 7 months in a row. The best streak since 2016-2017.
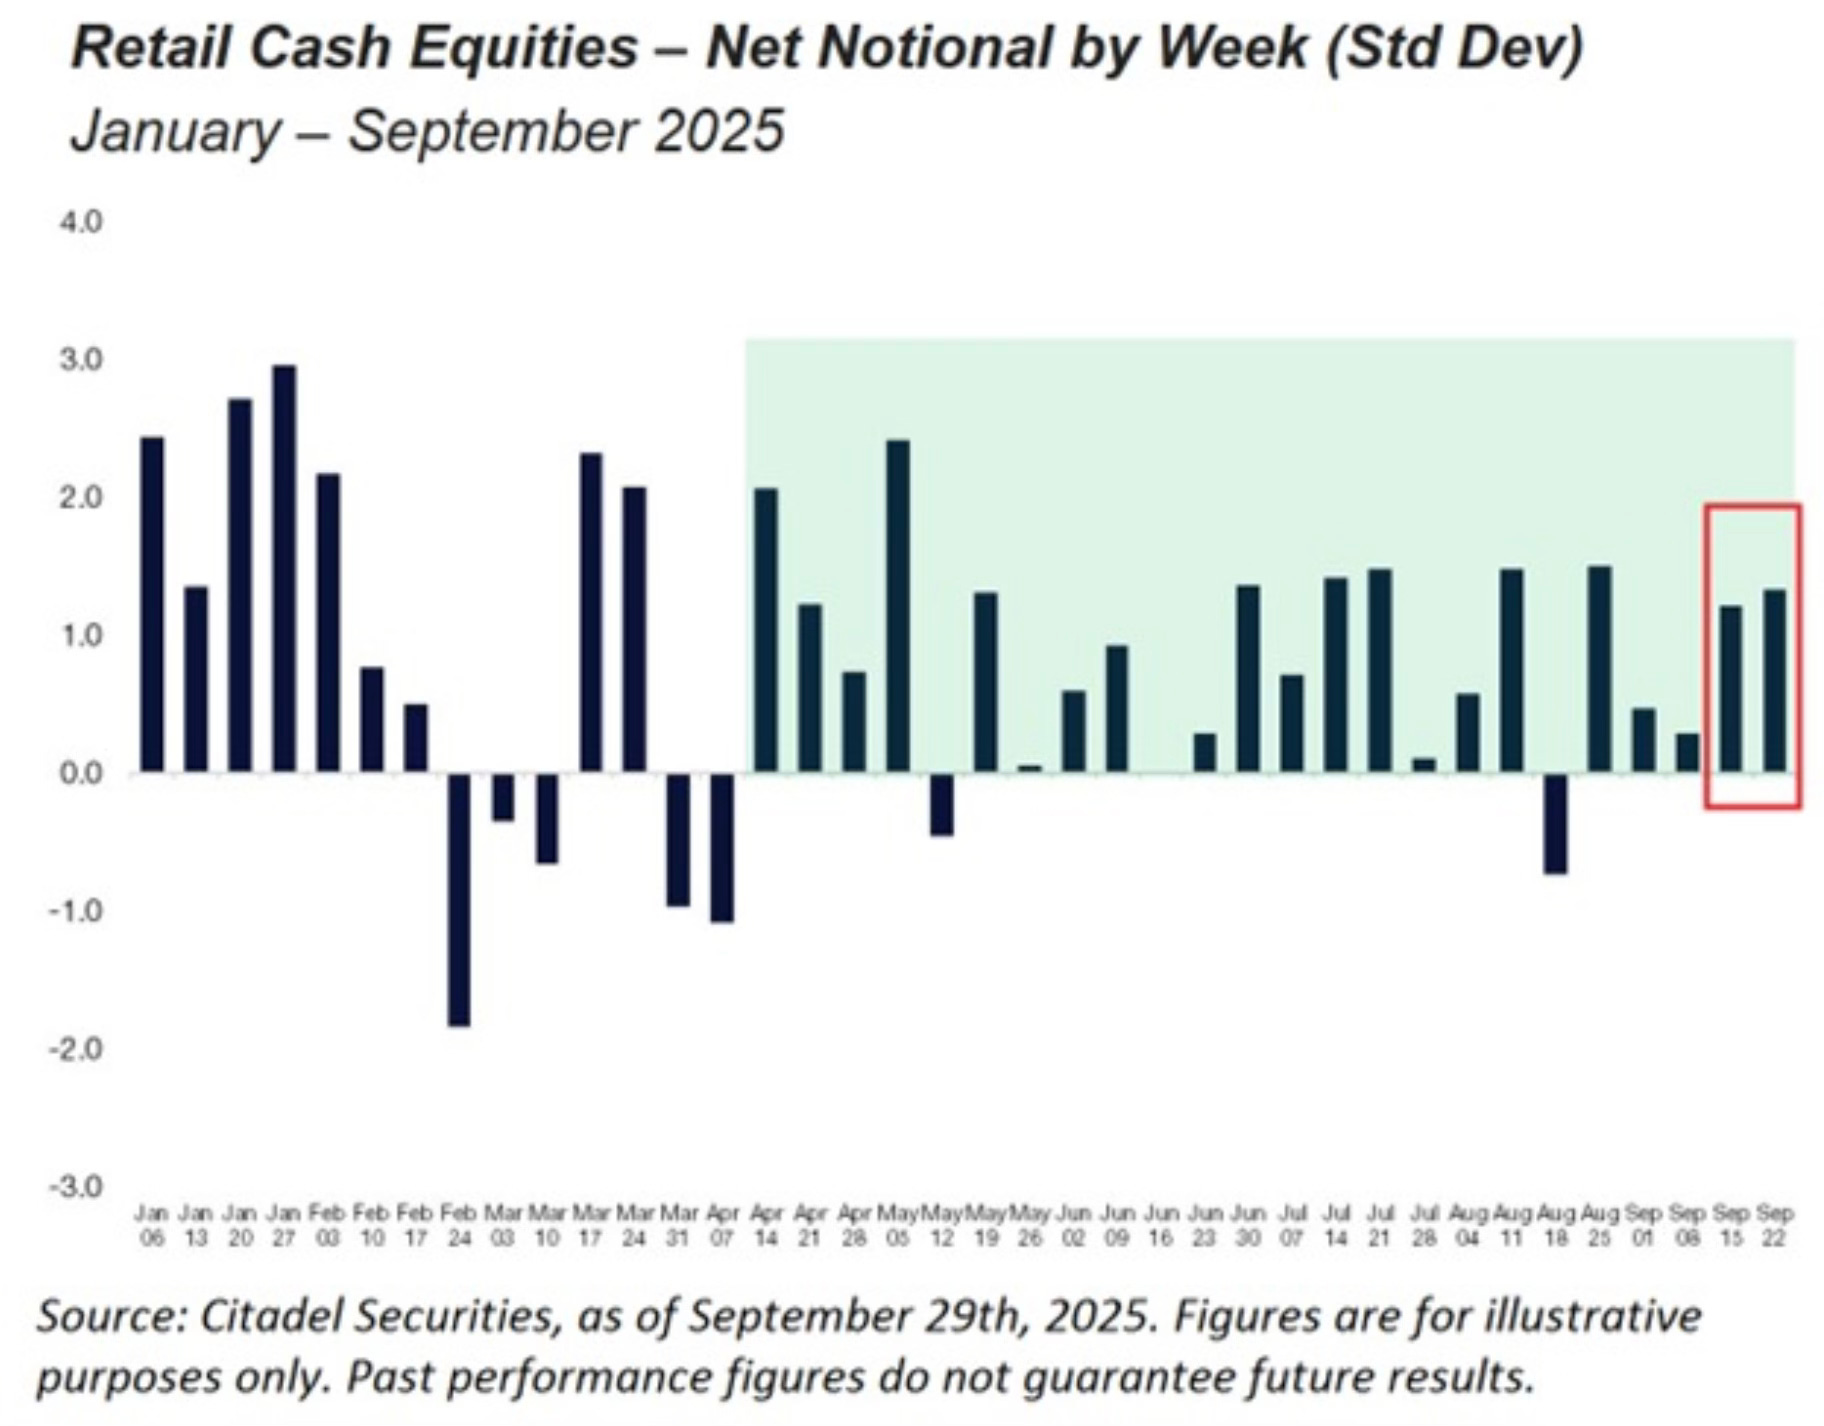
Retail is still buying. I make note of this because I’m referring to that as the smart money now.
Individual investors have been net buyers of equities in 21 of the last 24 weeks. In 2025, retail traders have only been net sellers in 7 of the 38 weeks.
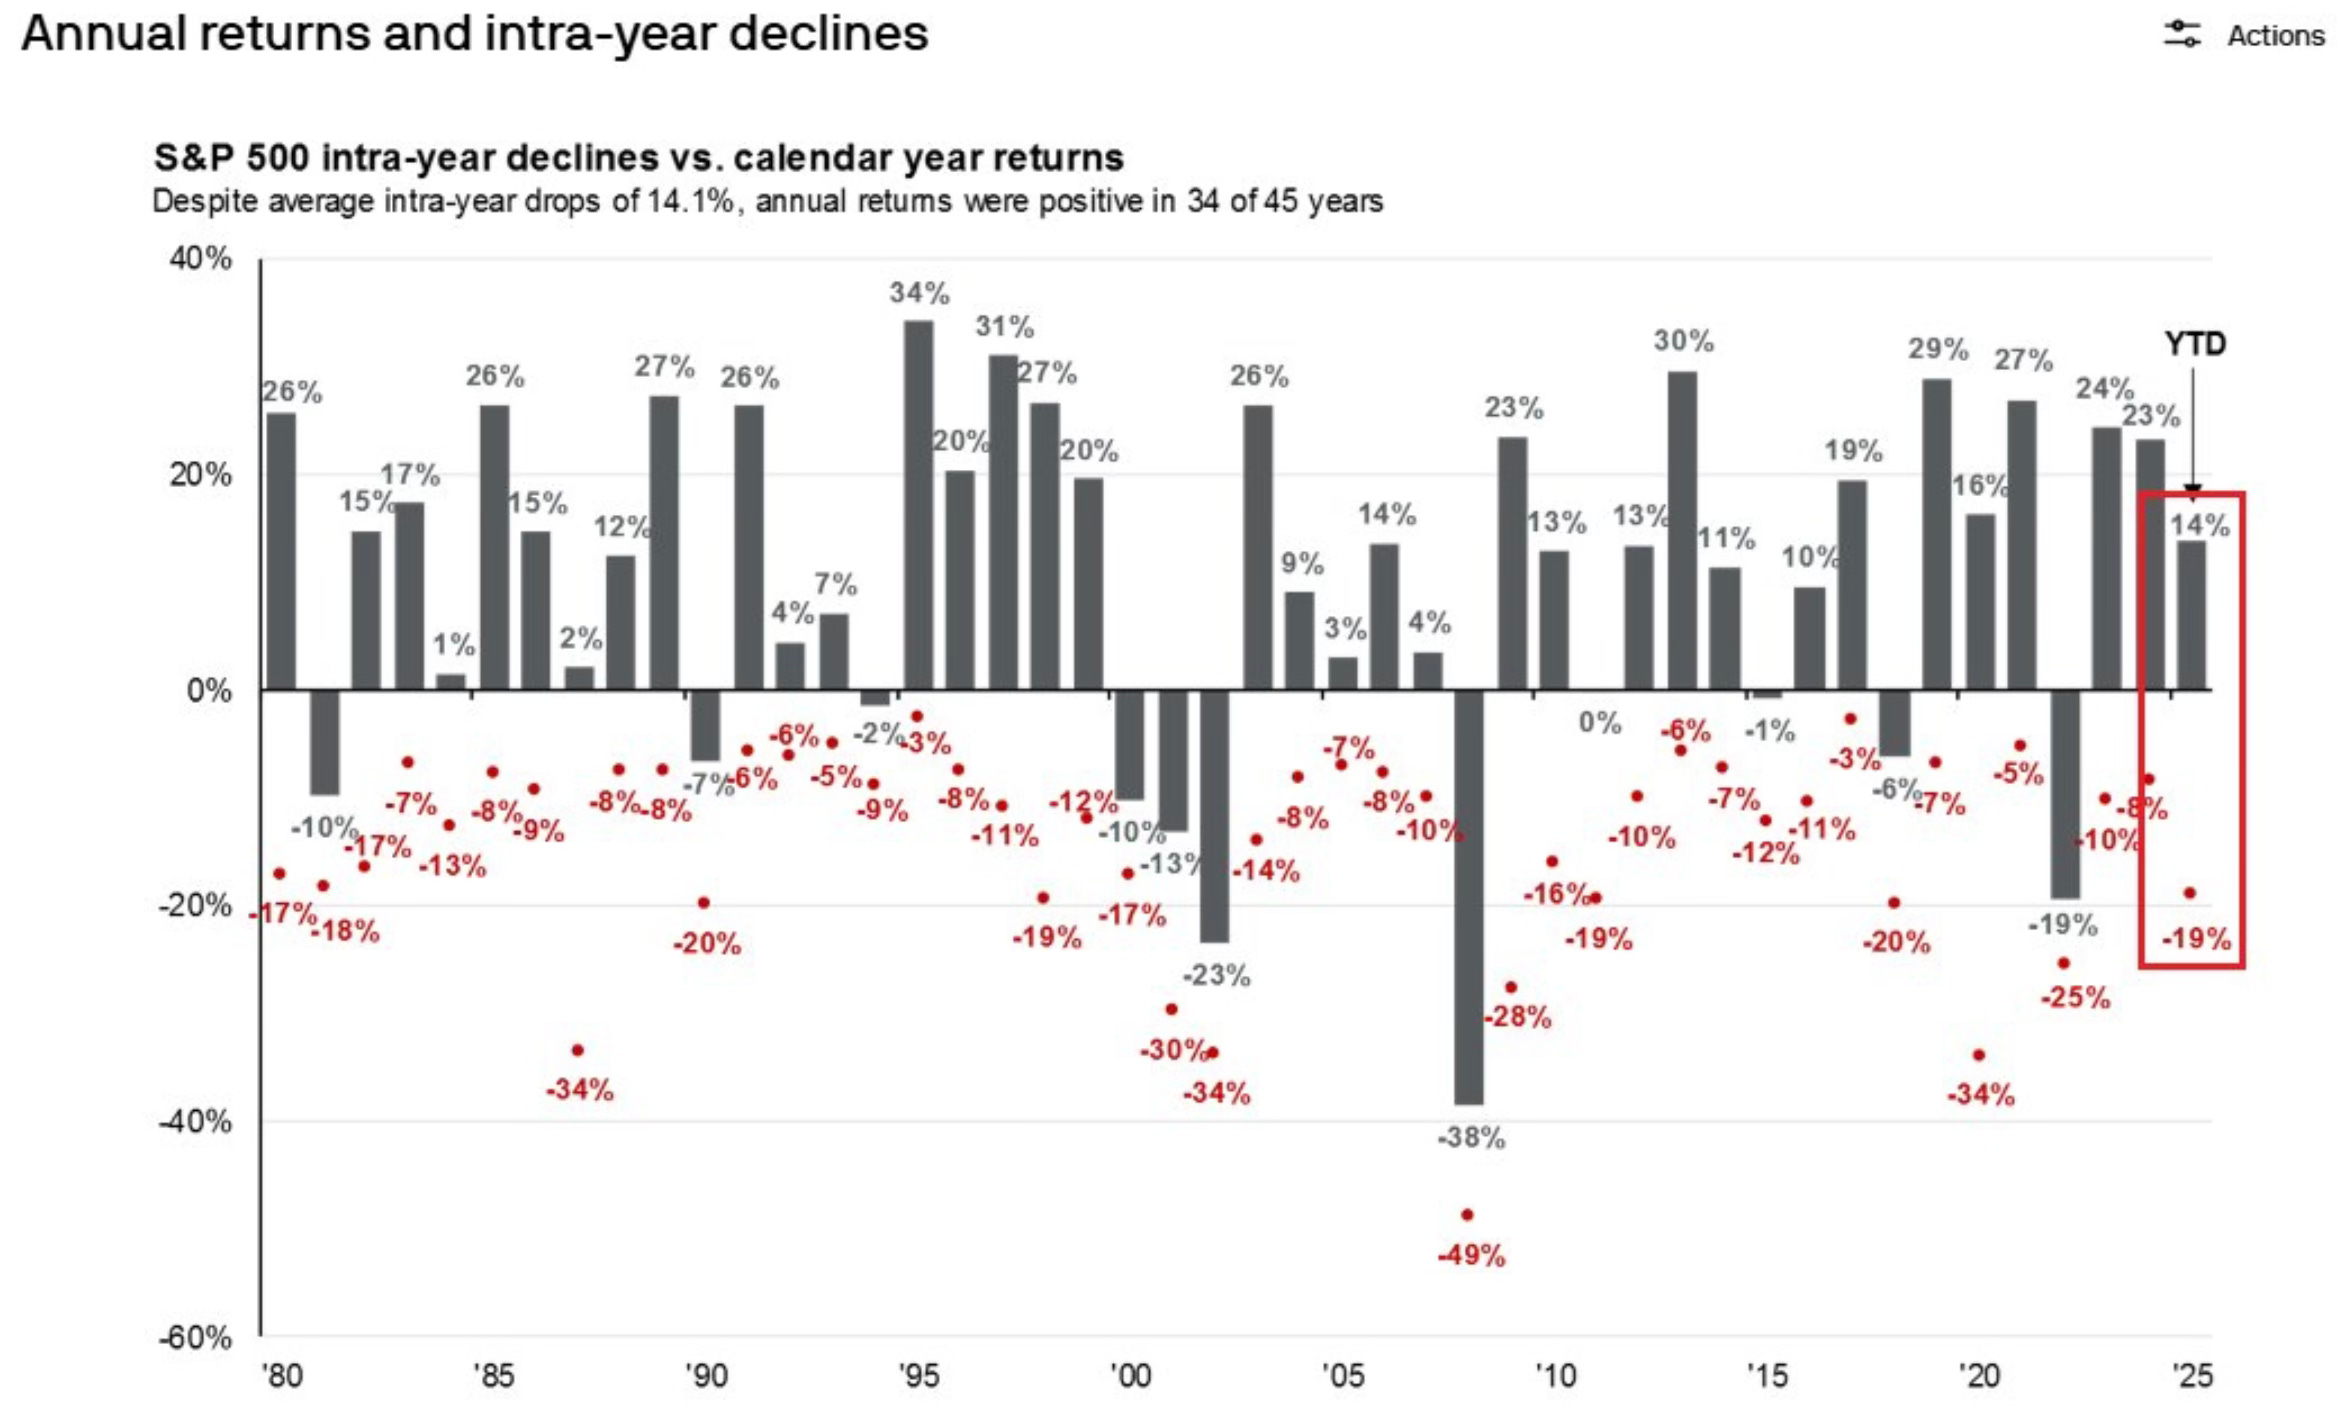
If we zoom out, you can see that 2025 has really been like any other year. The intra-year high has been up 14% and the low was down 19%. Historically that’s a normal year for the S&P 500.
Q3 Recap
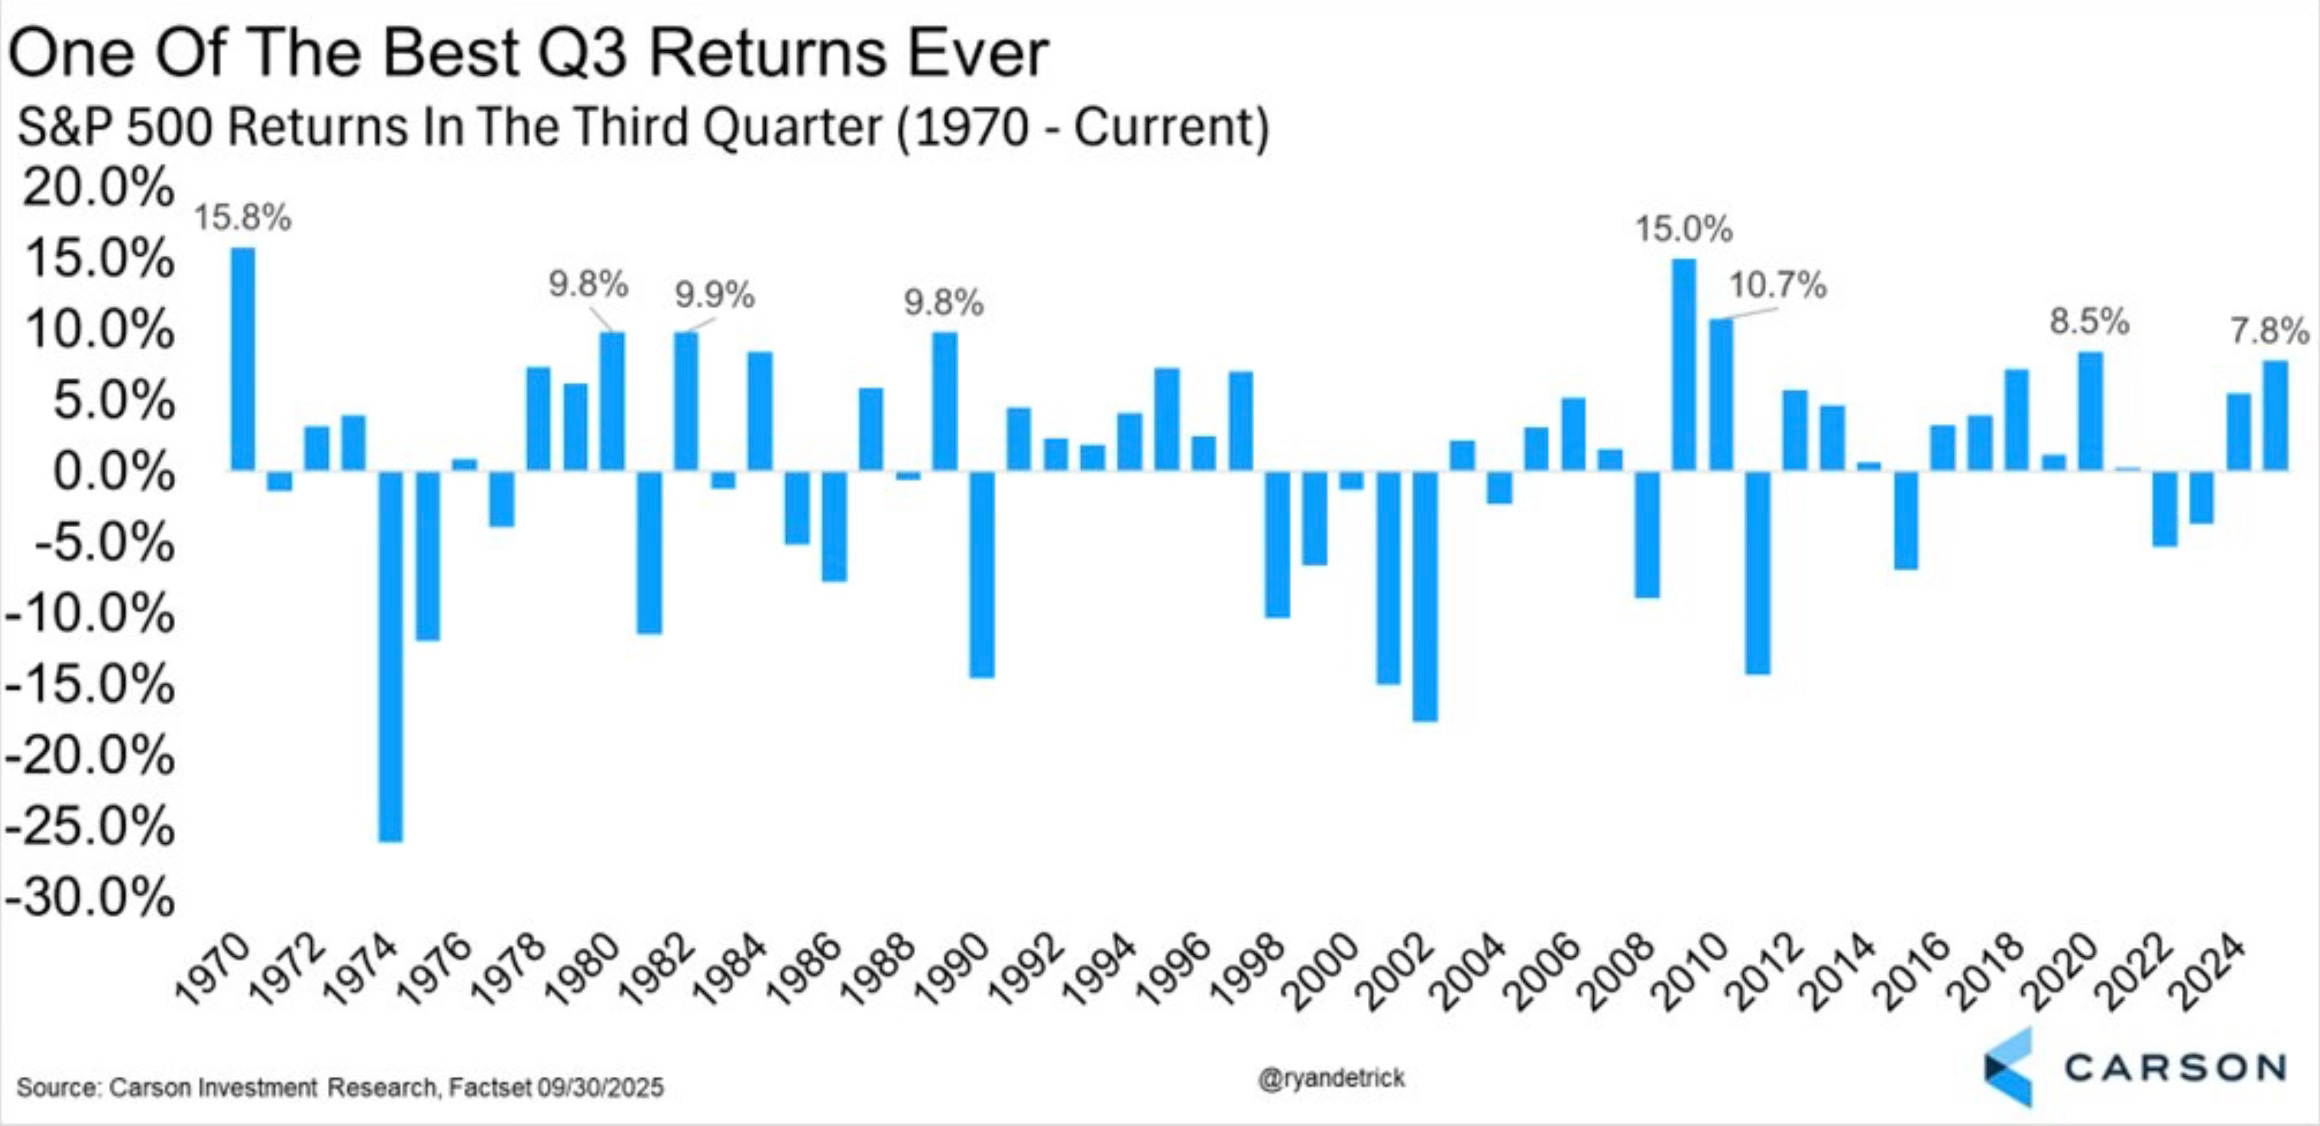
Q3 turned out to be one of the best quarters in history.
There were 23 all-time highs for the S&P 500 in Q3. That’s the most of any quarter since 1998.
Both the Nasdaq and S&P 500 notched their best third quarter since 2020.
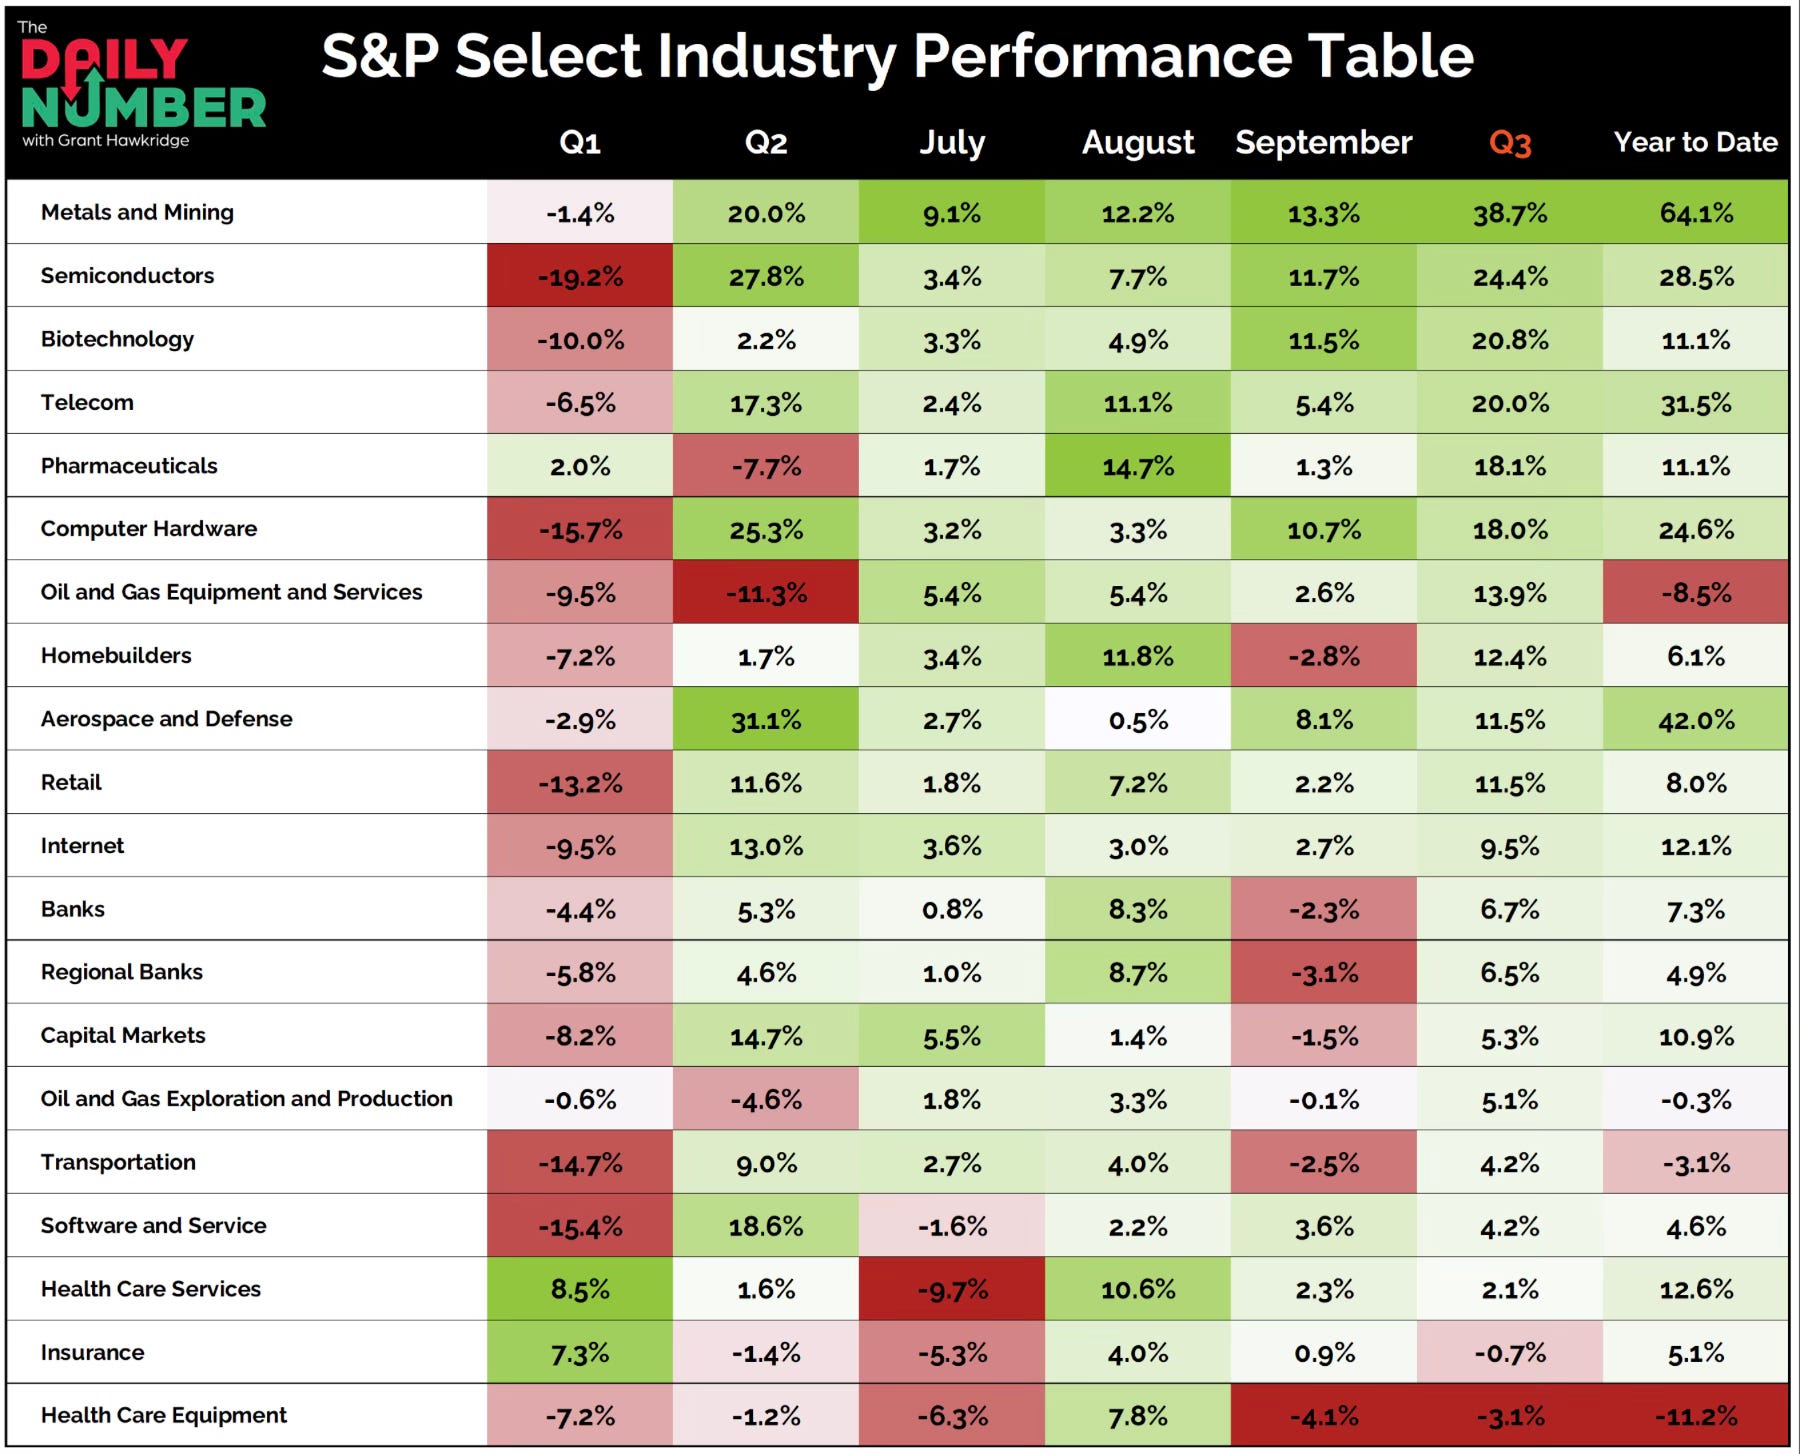
Q3 Performance Heat Map By Stock
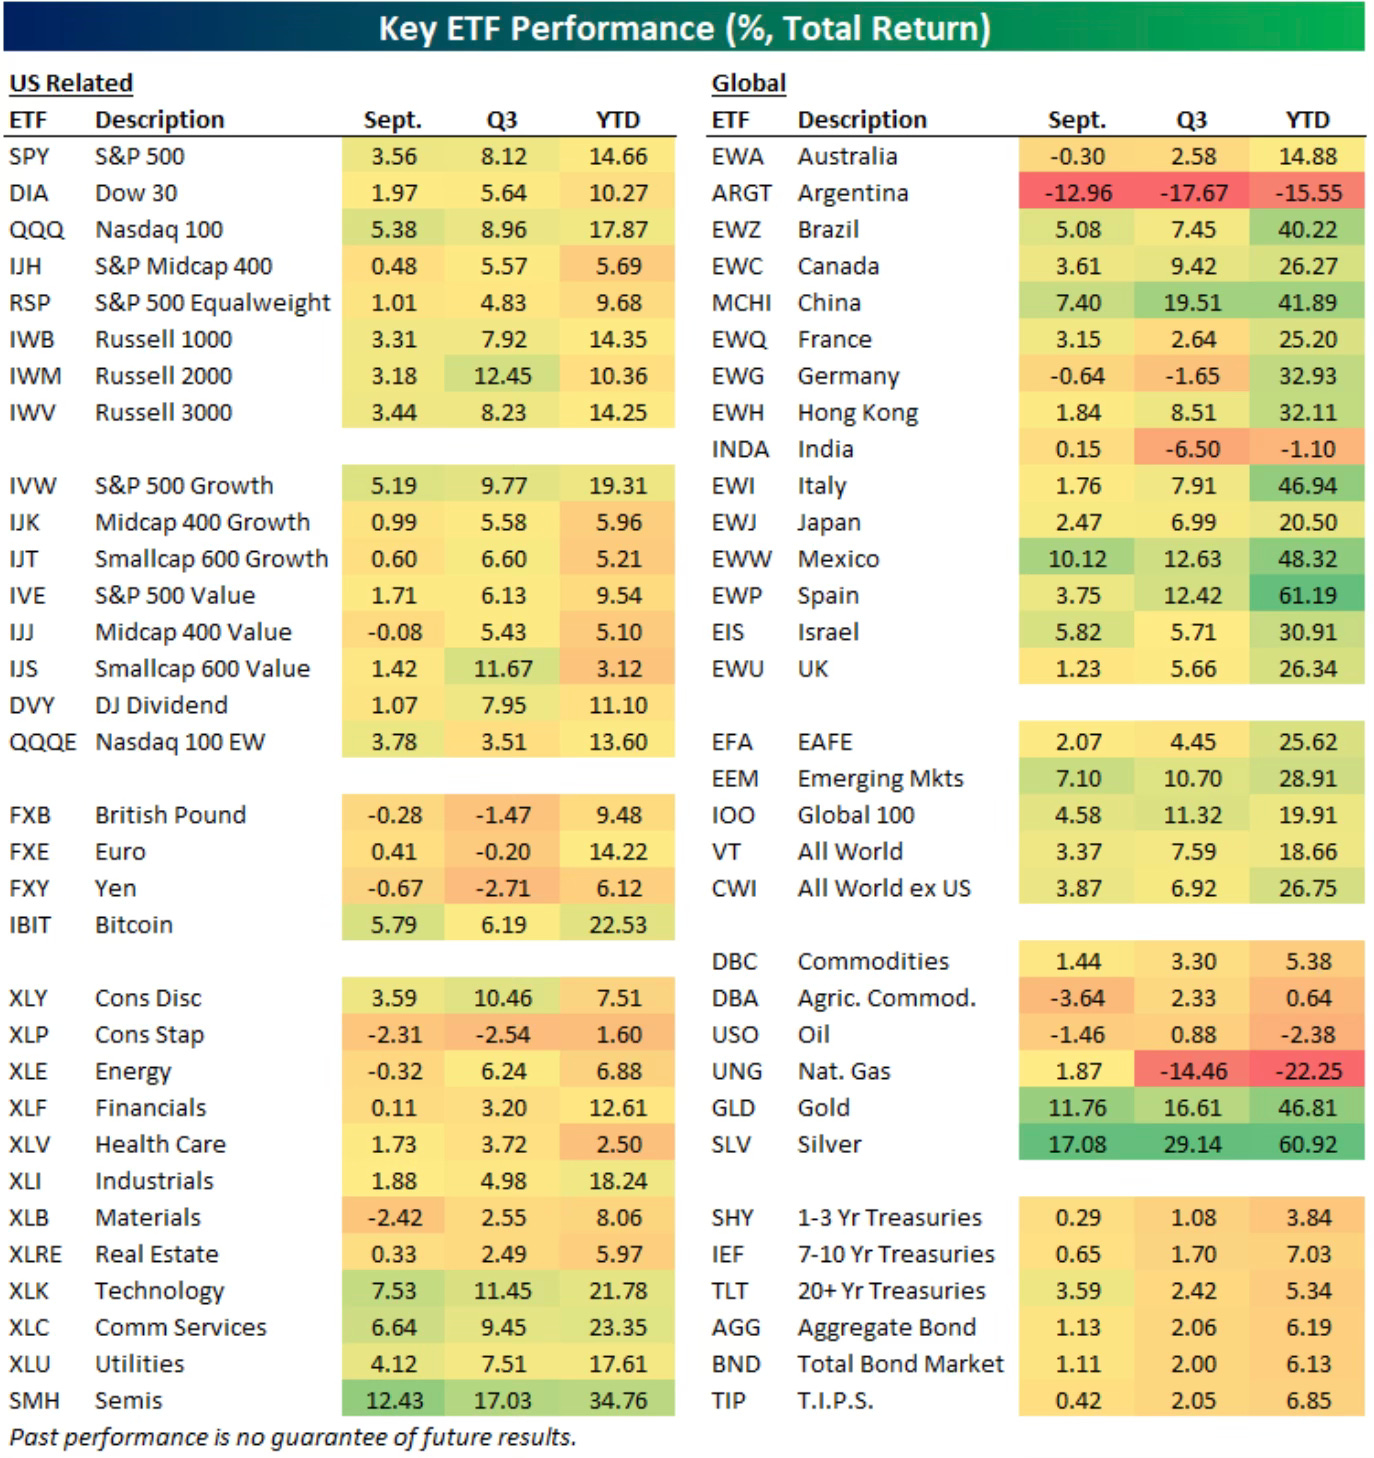
Q3 Performance Heat Map By ETFs
90% of S&P 500 industry groups finished Q3 in the green.
Here is an expanded look at all the key ETF performances in September, in Q3 and year to date.
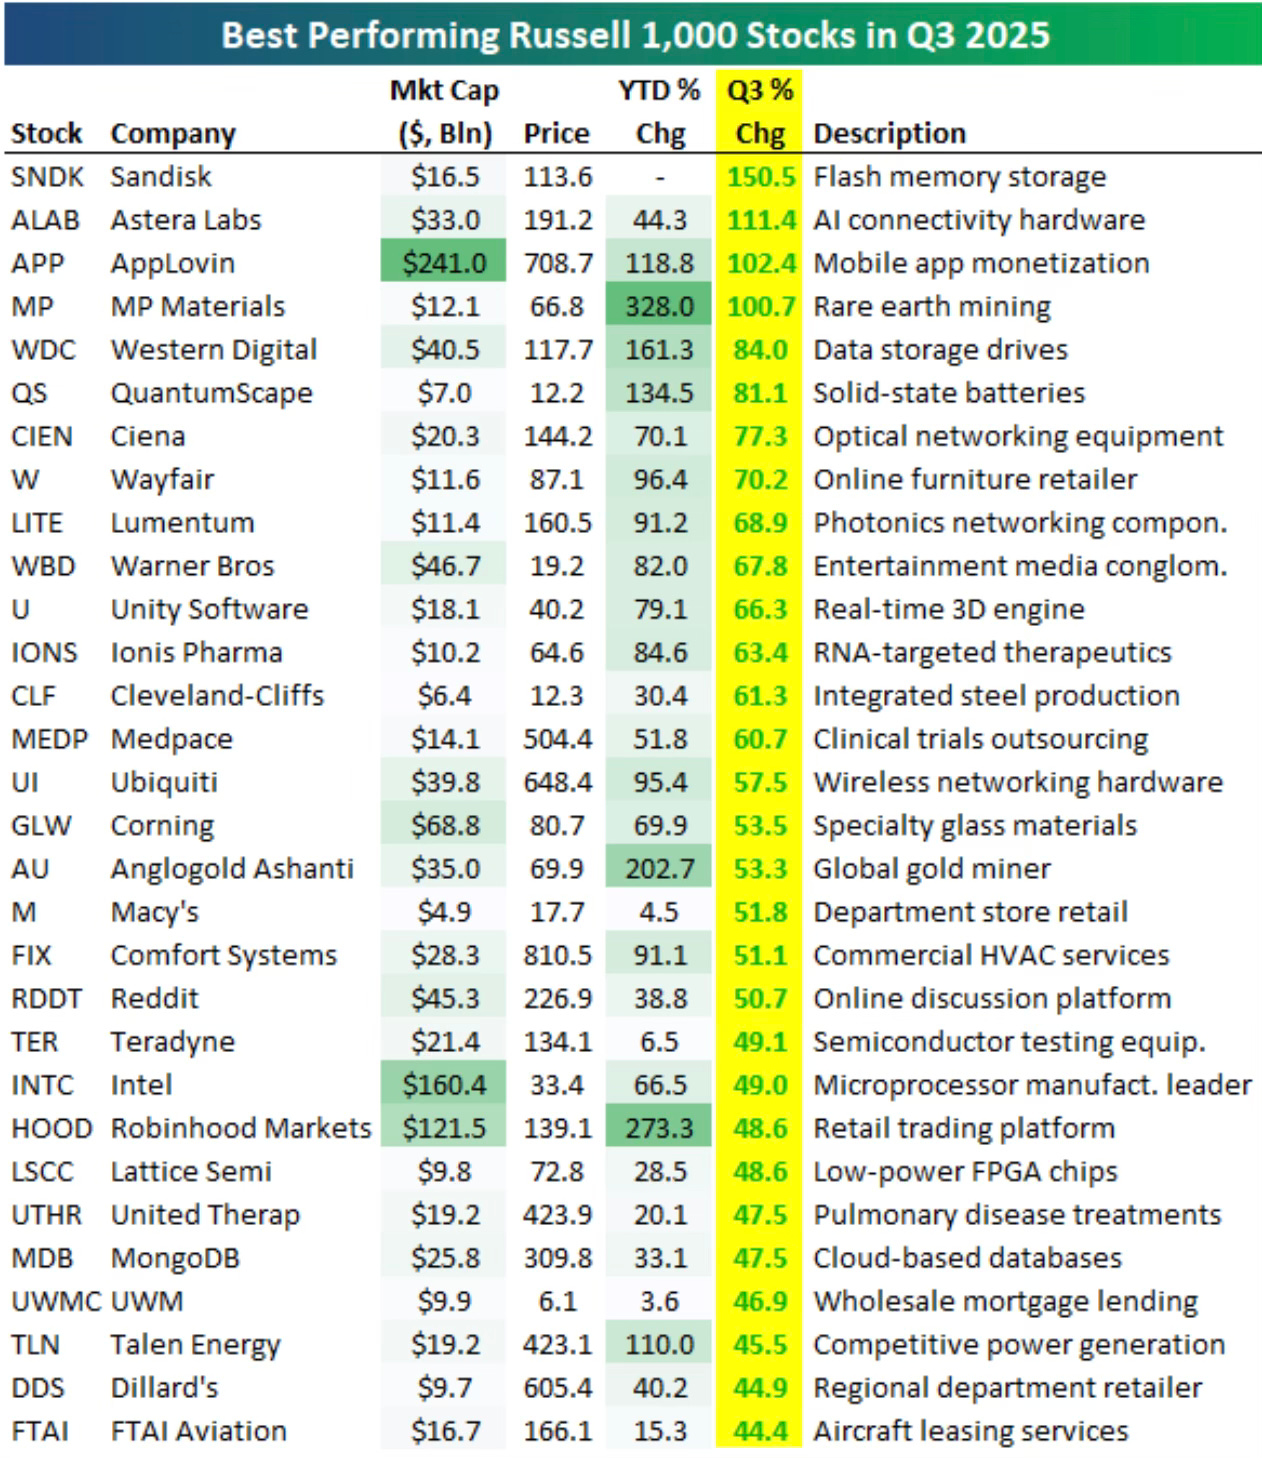
Here were the best performing stocks of the Russell 1,000 stocks in Q3.
Look at the precious metals go.
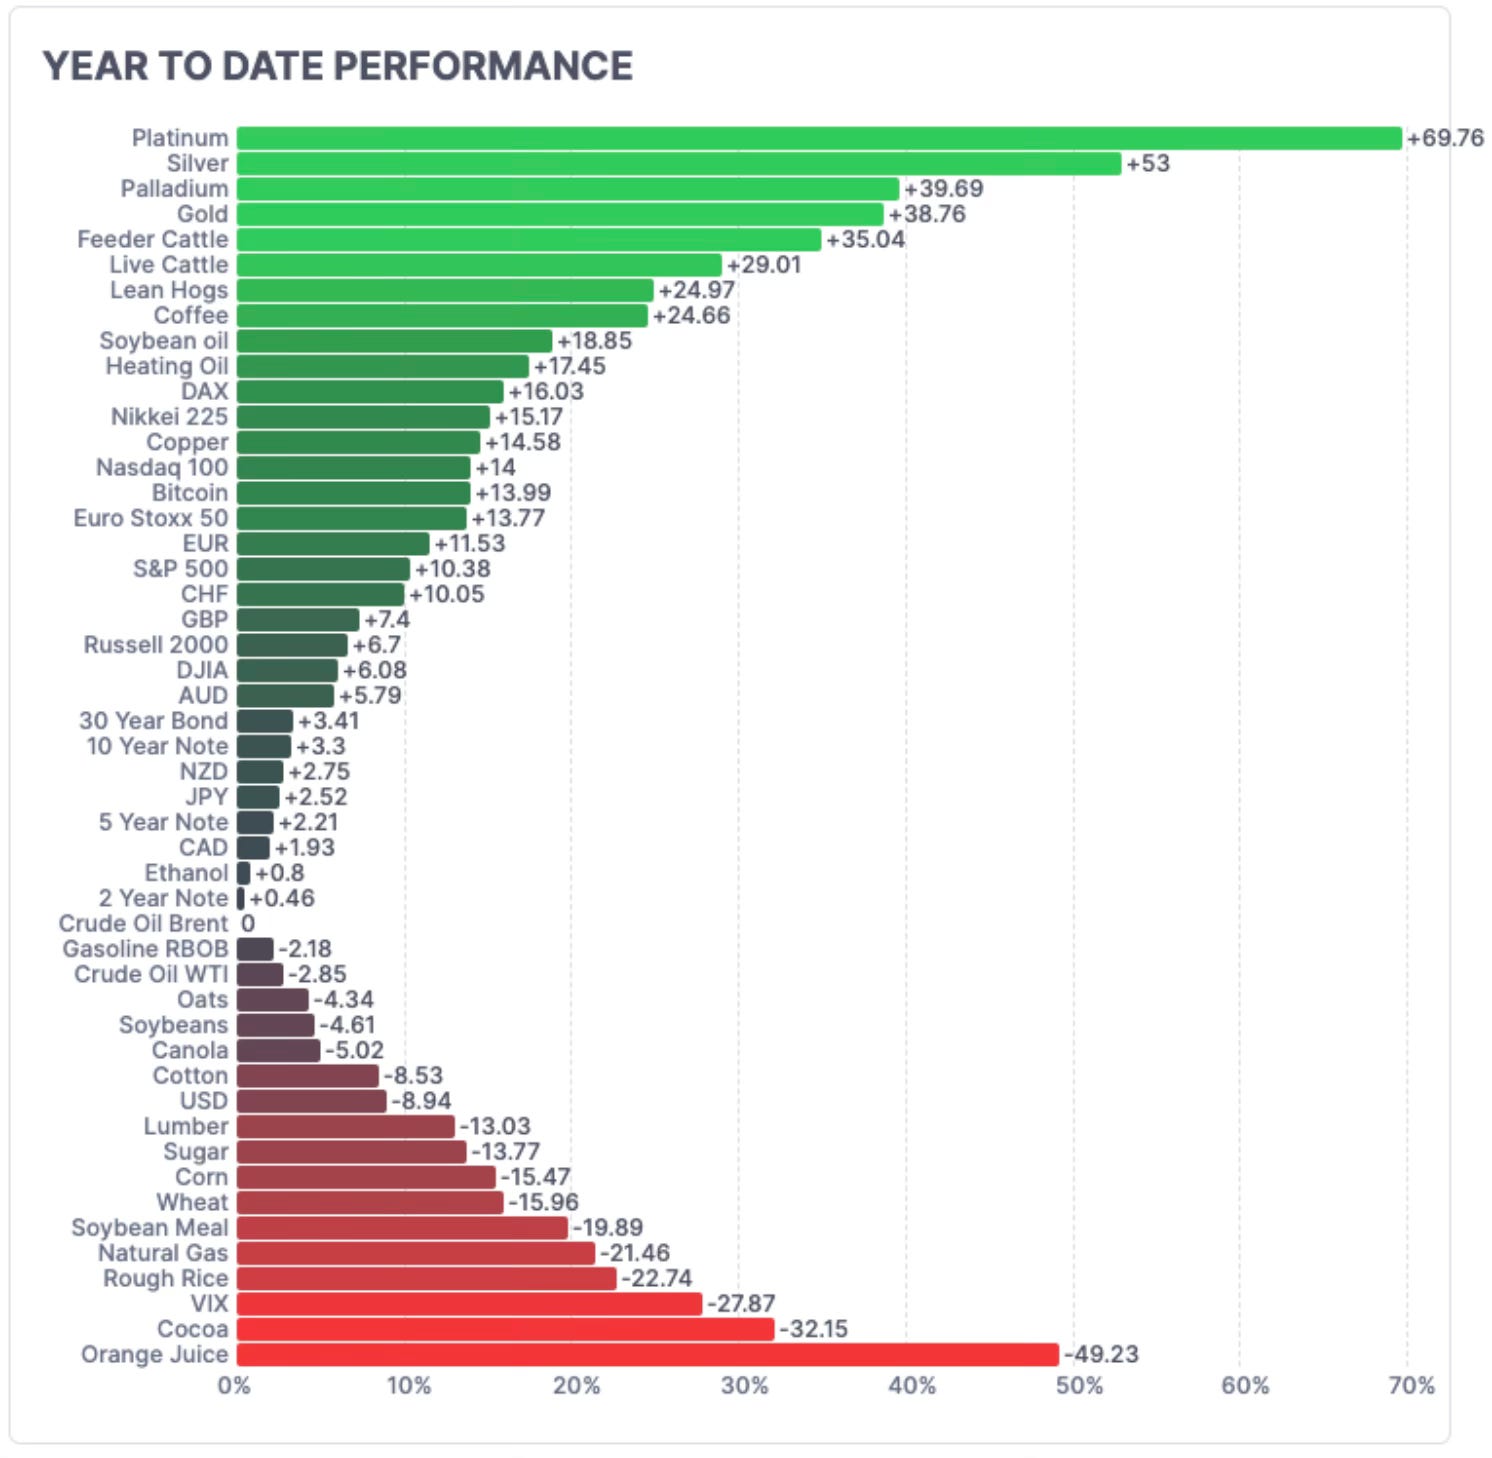
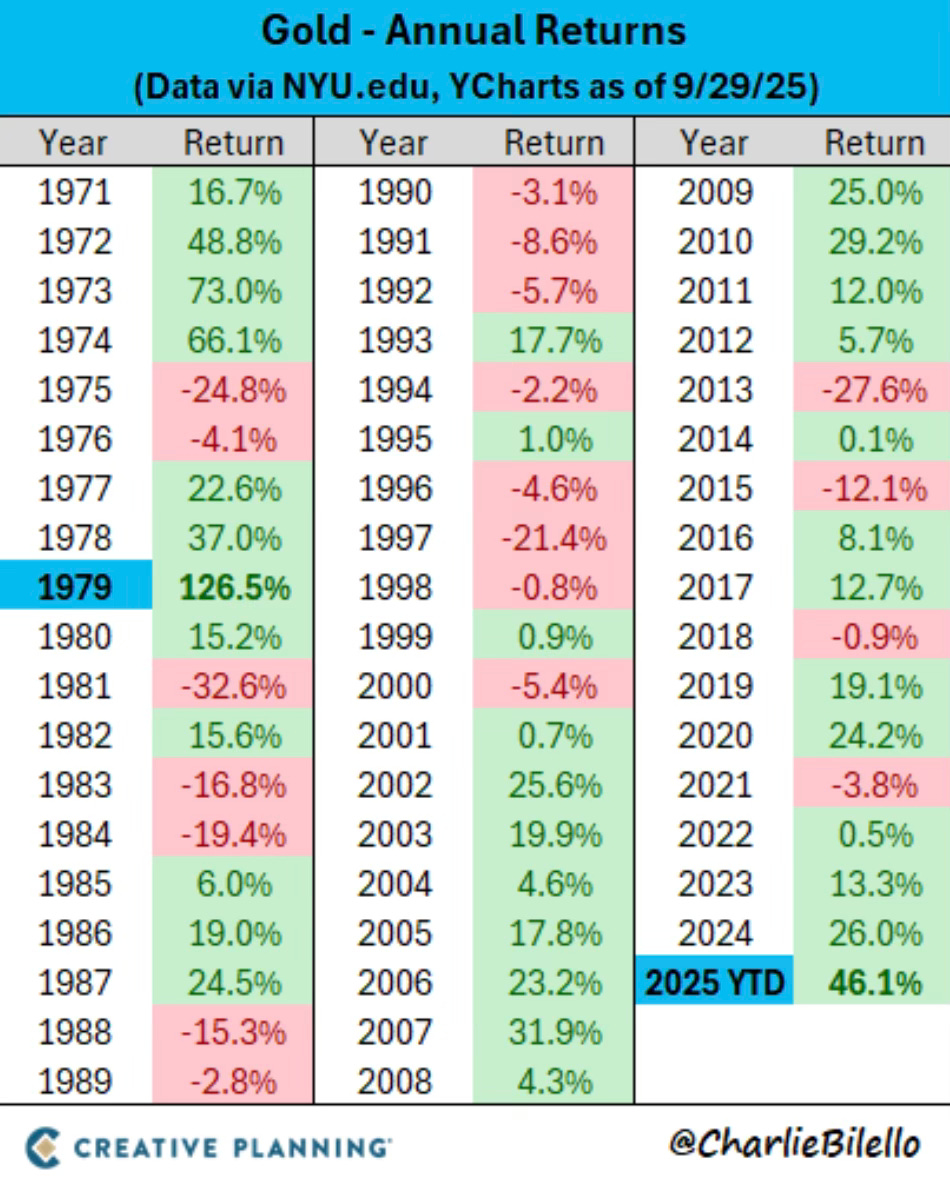
Gold is on a tear. Up over 46% YTD. That’s on pace for the best return for gold since 1979.
Just about everything seemed to be in the green in Q3. It should’t be a shock that it was one of the best quarters in the past decade.
Does this tell us anything about how Q4 will go? It does and we will discuss that shortly in my Q4 Outlook.
A Historical Chart Showing A Sell Signal?
I’ve said that when I start to notice any bearish or sell signals, that I would let you know.