
Hi friends! 👋
Here’s what I’m looking at today.
The Sector Quietly Running This Market
Not Worried Until This Changes
Not All Rate Hikes Are Created Equal
The Consumer Isn’t Slowing Down
Money Talks. Data Centers Are Shouting.
The Mag 7 Are Waking Up
Thanks for reading Spilled Coffee. Let’s get into it.
Eric
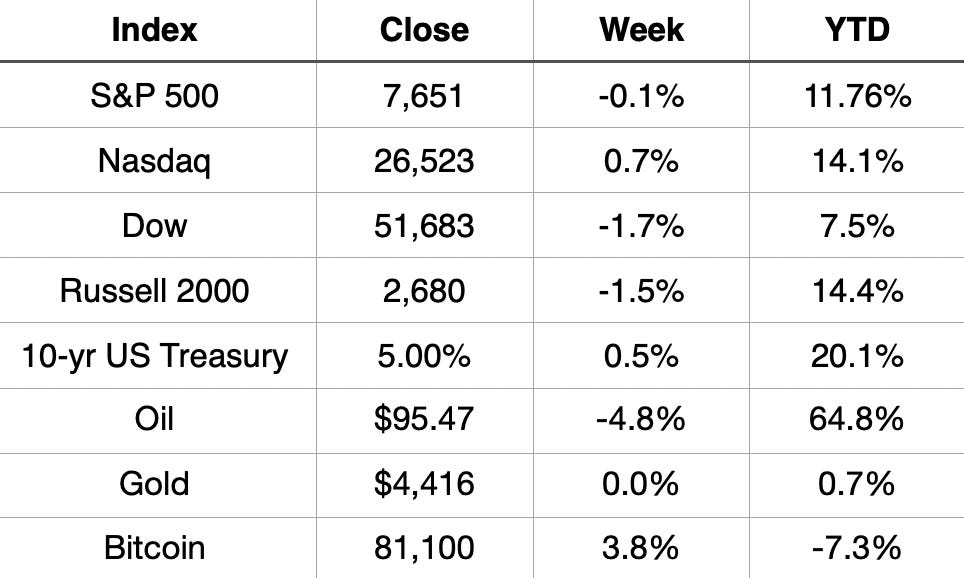
A rough week for most of the market. The Dow had its worst week since March, and it's now down three straight weeks. The S&P 500 was negative for the second week in a row.
The Nasdaq was the lone bright spot among the major indexes, closing the week higher while everything else slipped. Small caps took it on the chin, with the Russell 2000 down 1.5%.
The bigger story might be rates. The 10-year crossed 5% this week. That’s the level that tends to get everyone’s attention, and it’s worth watching closely heading into next week.
Oil dropped nearly 5% on the week but is still up a massive 64.8% year to date. Bitcoin bounced 3.8% but remains negative for the year.
Market Recap
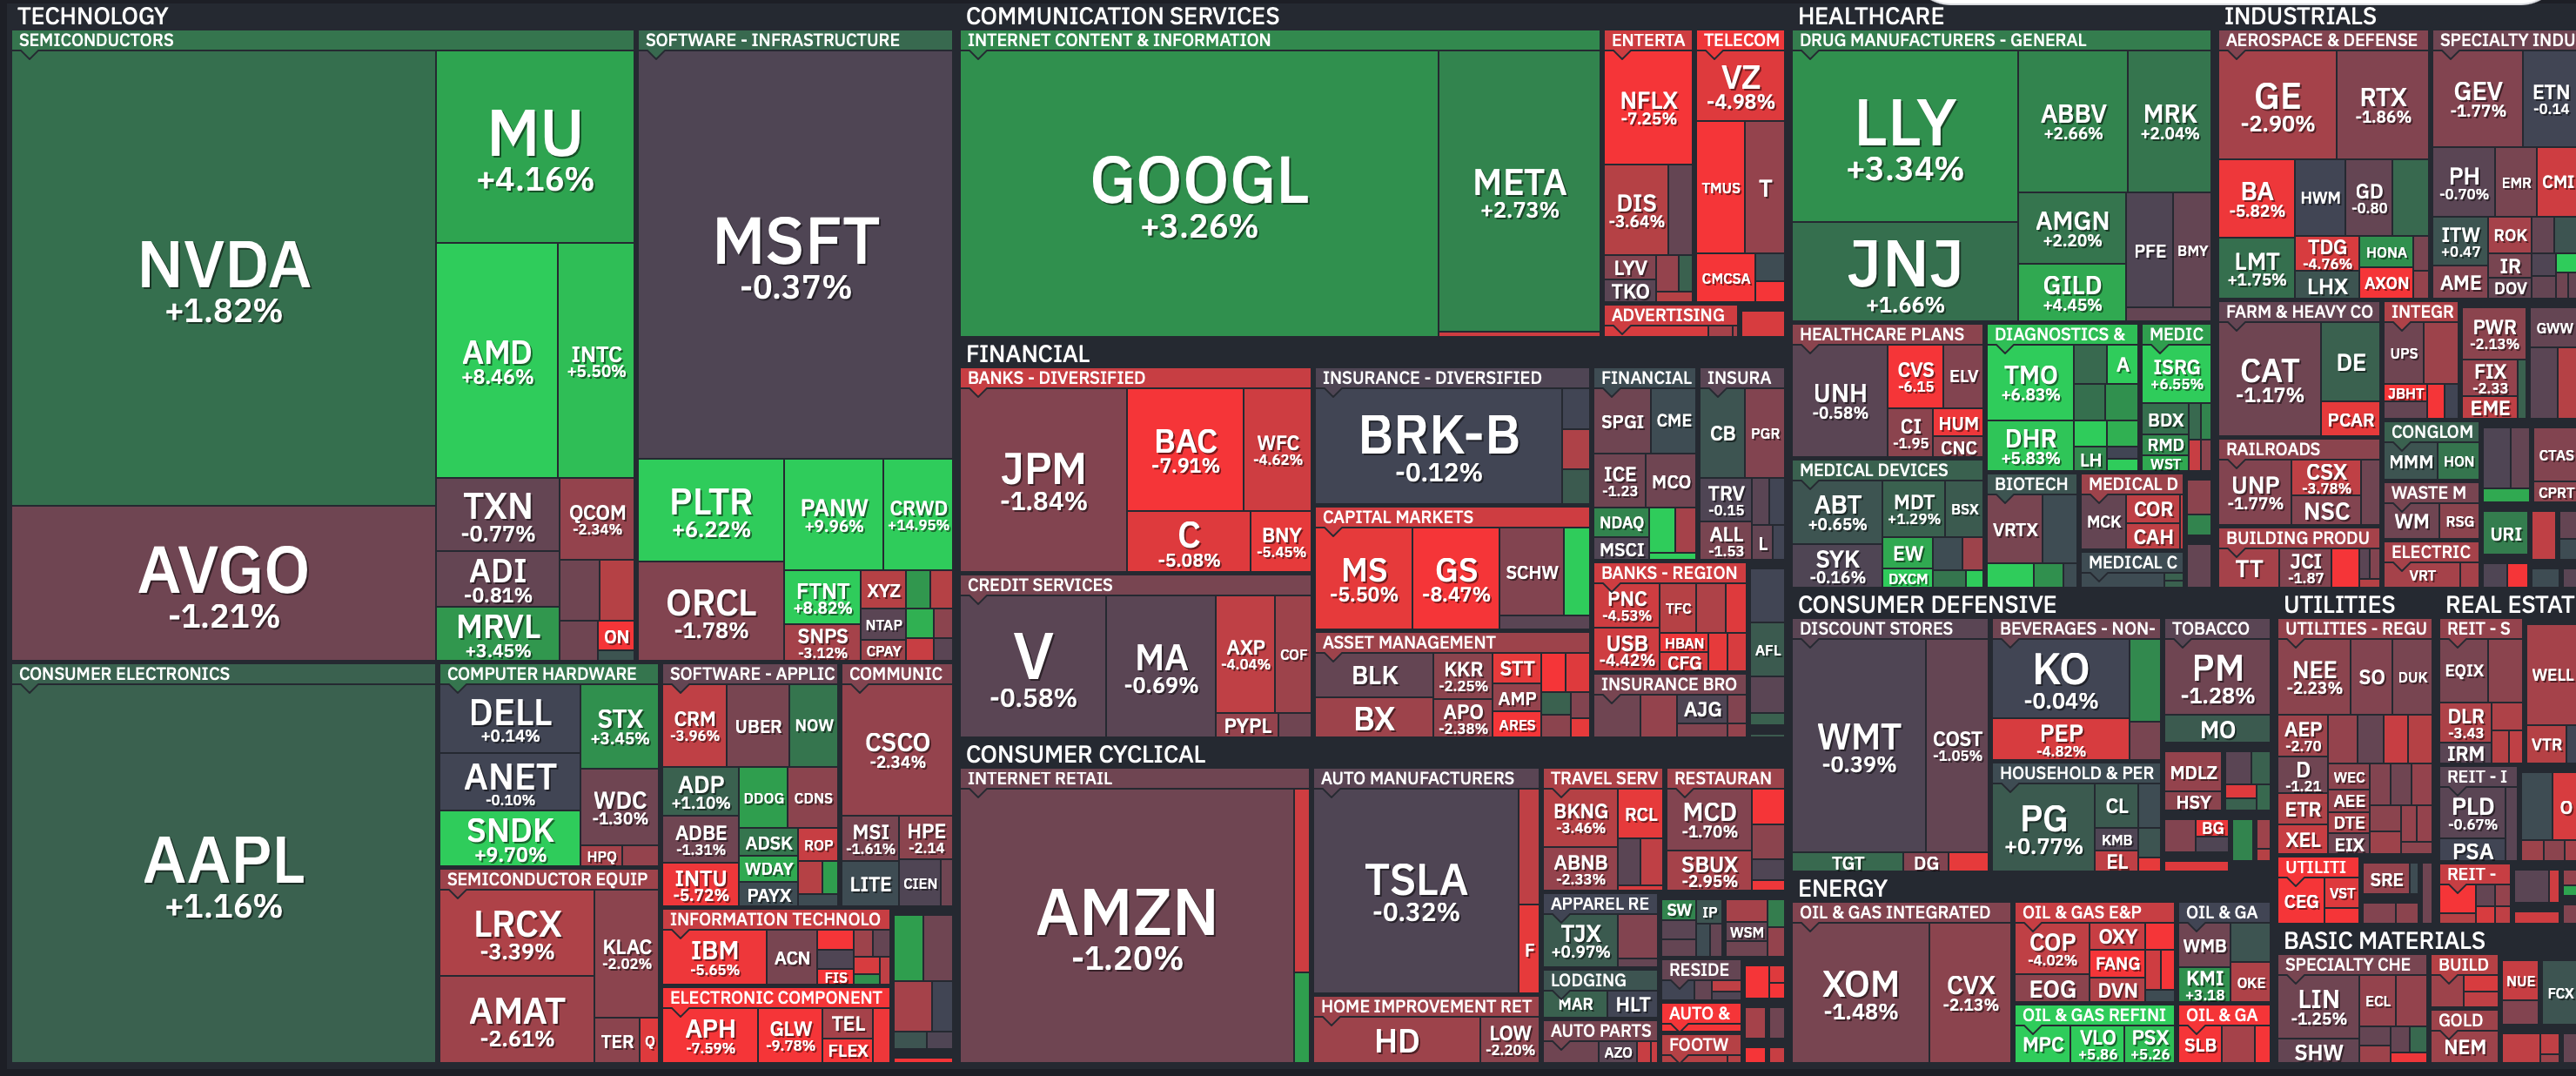
Weekly Heat Map of Stocks
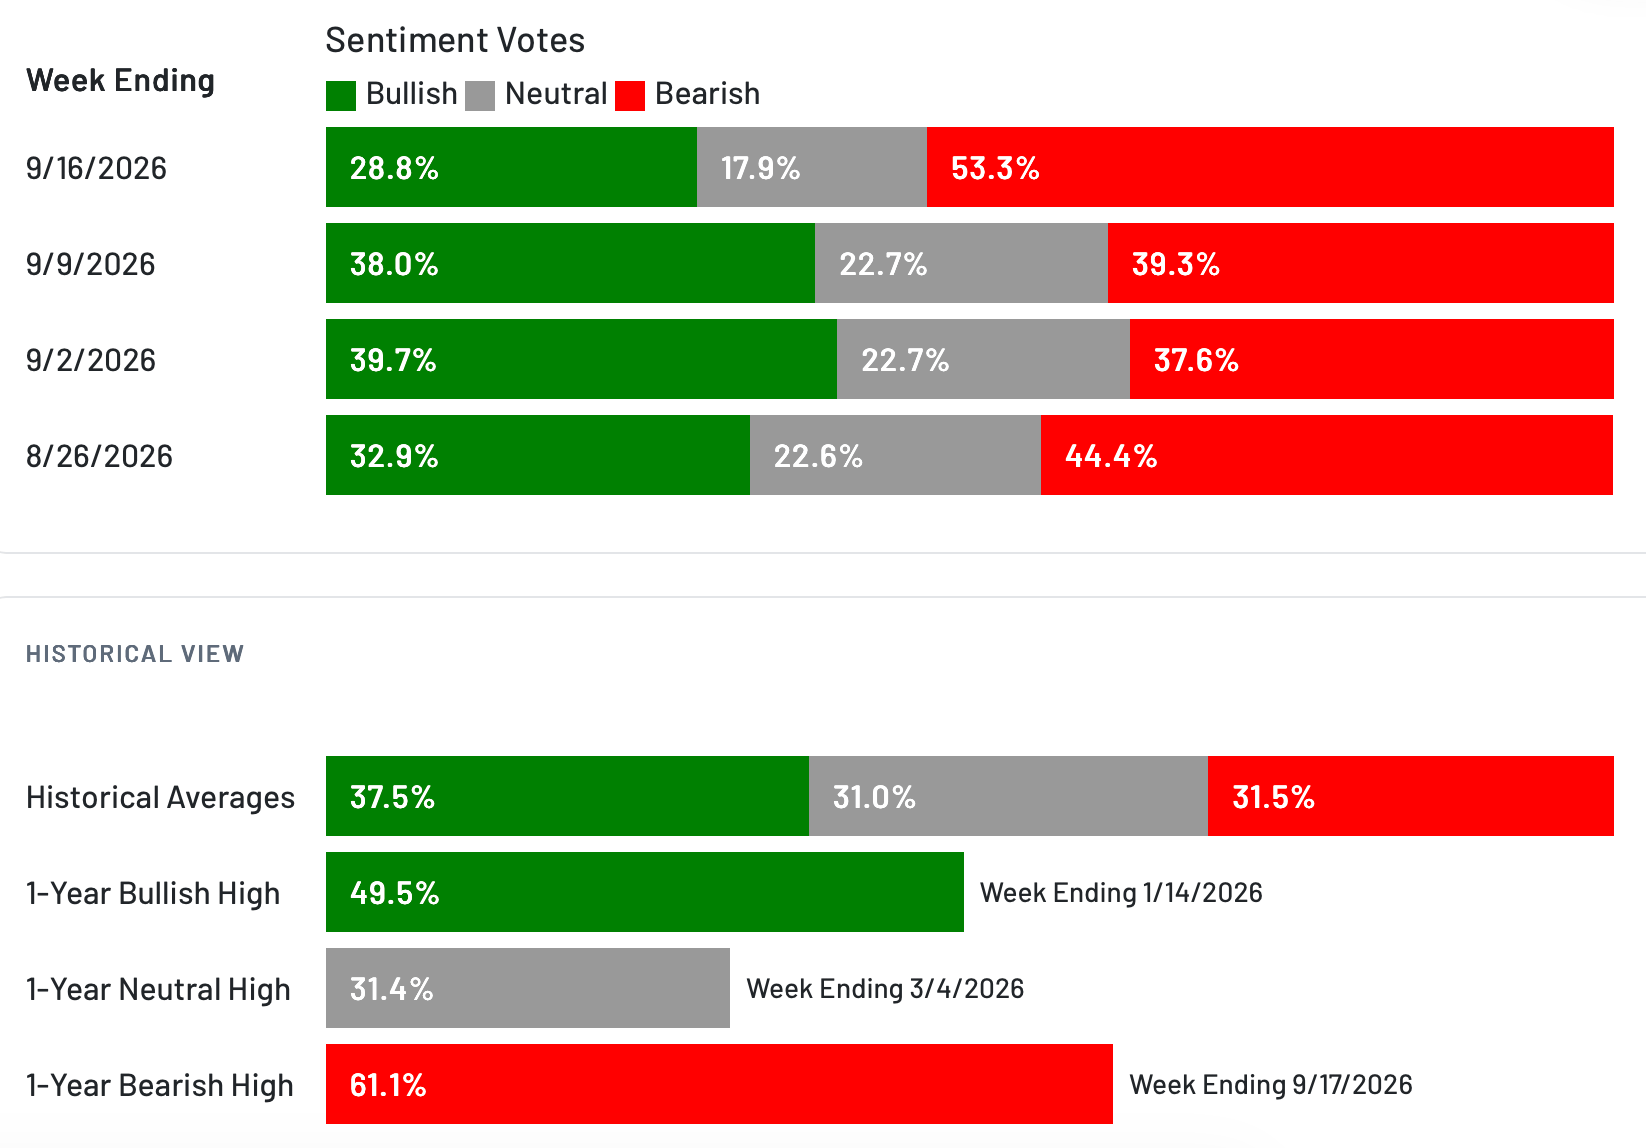
Sentiment Check
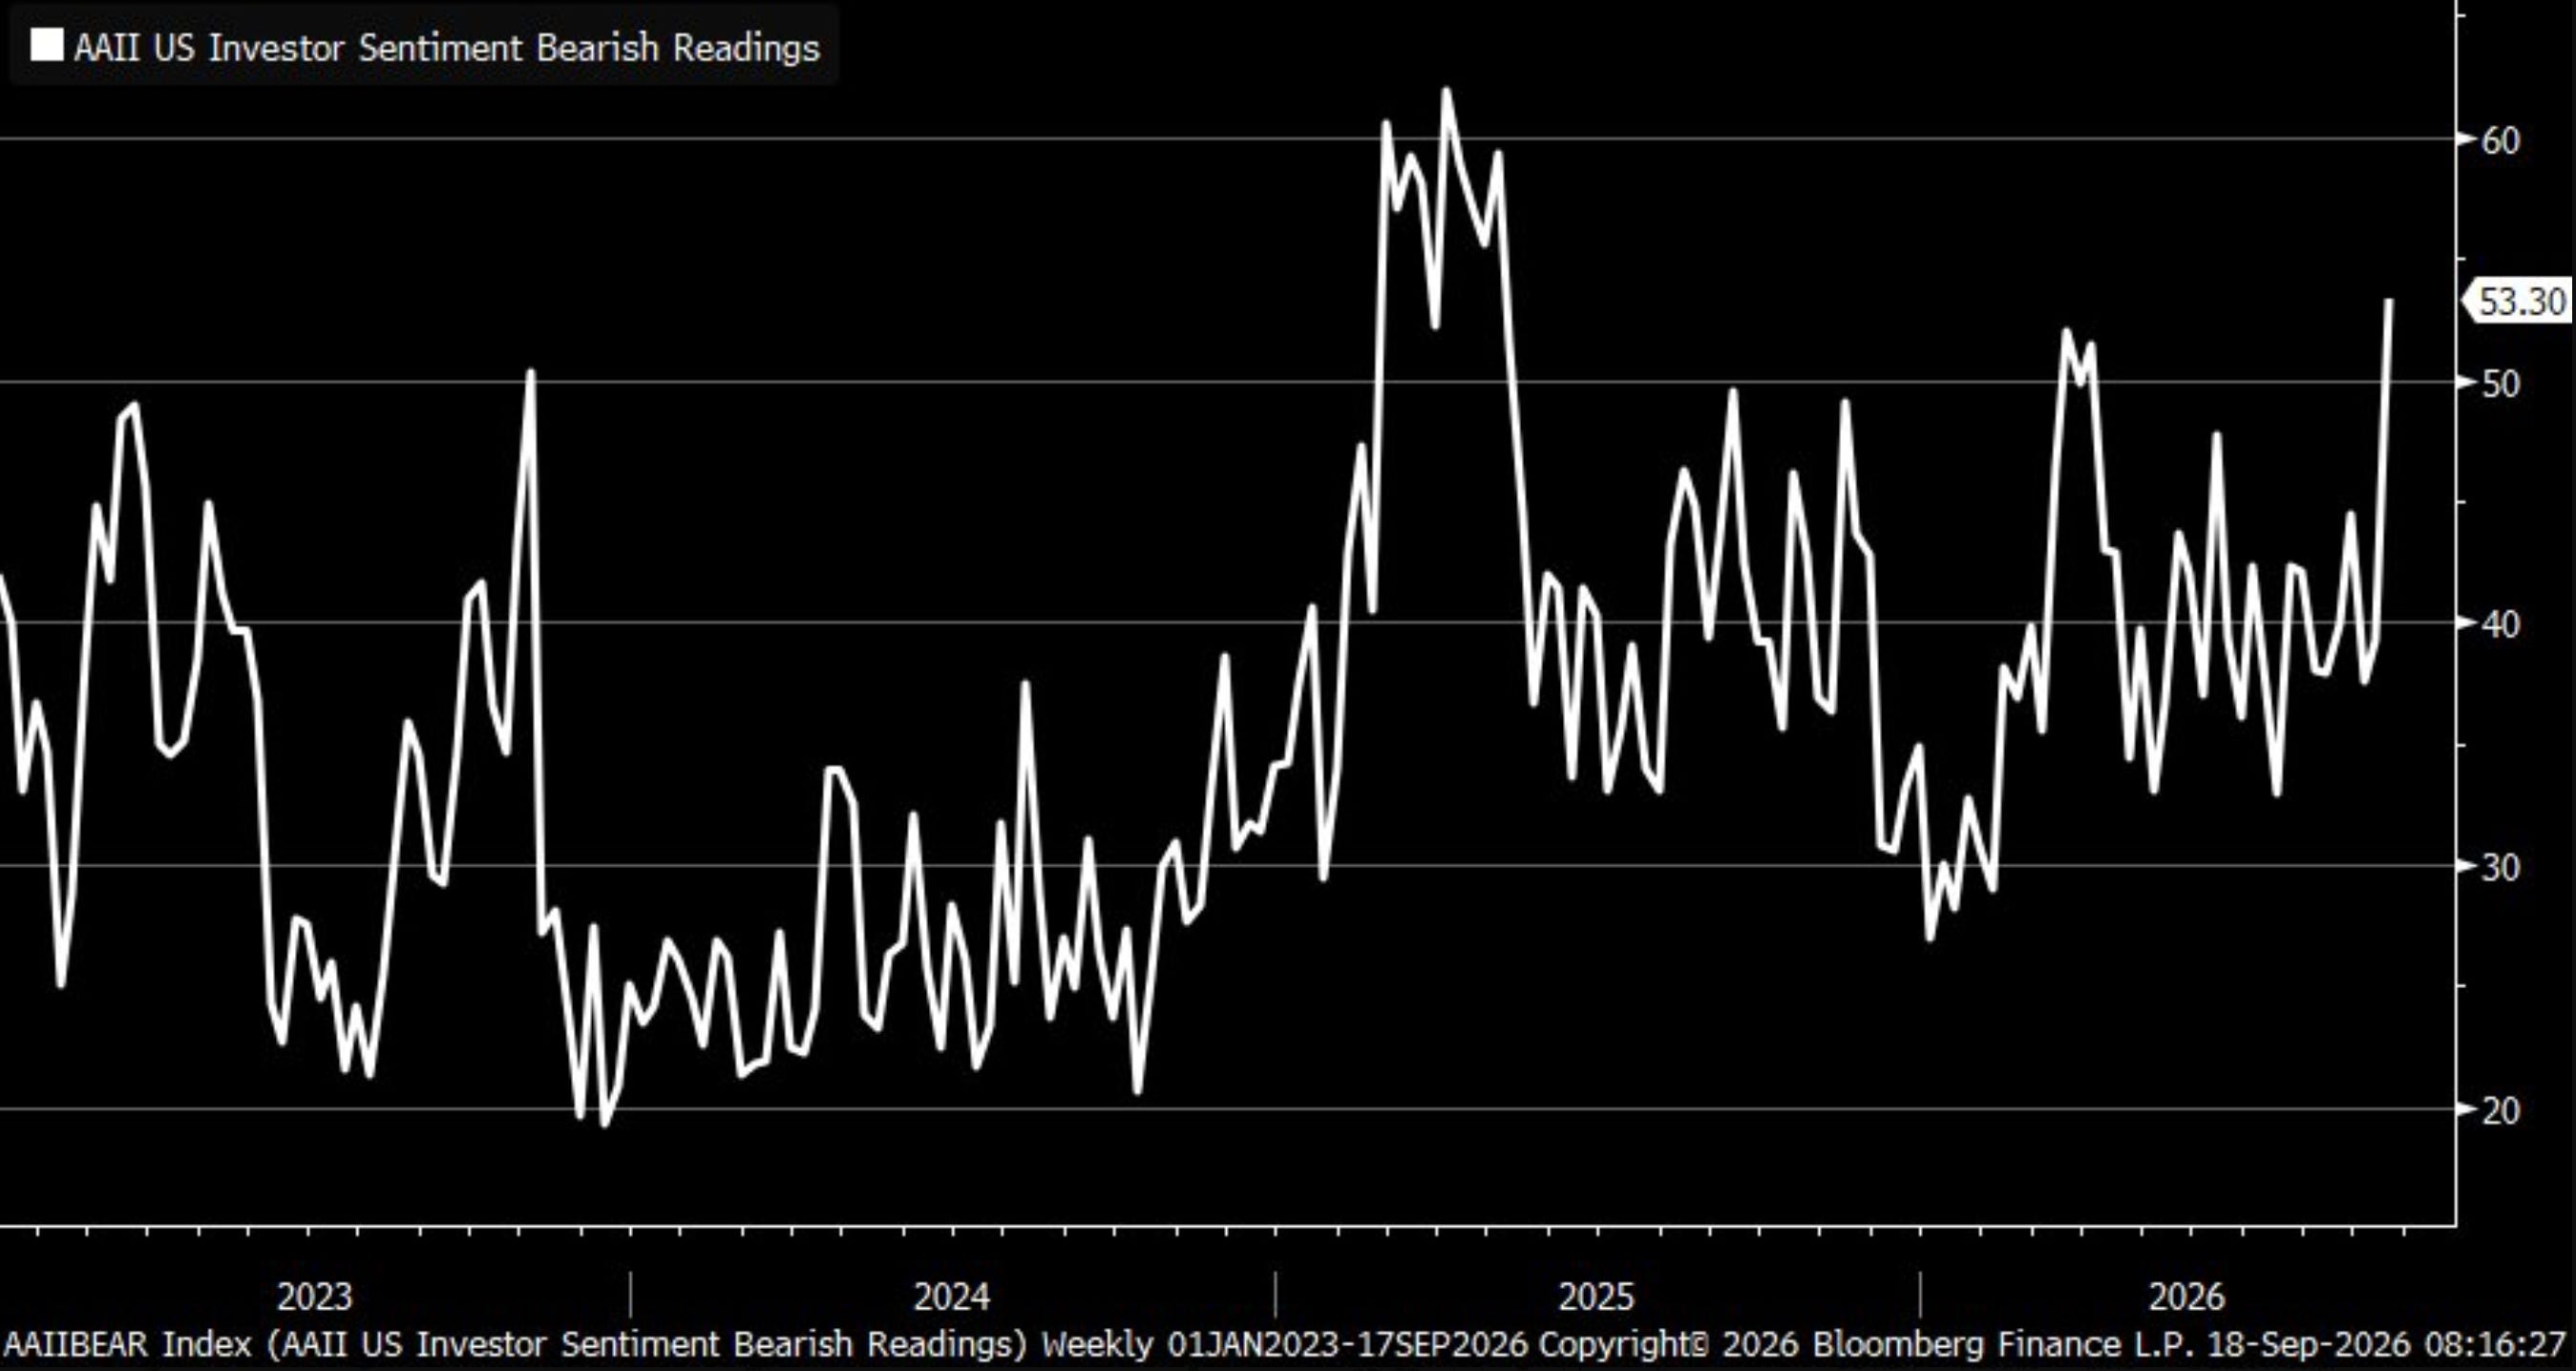
This is the most bears we’ve seen in more than a year. The fewest bulls in a year. The bulls are at a 52-week low.
Bears are at their highest level since May 2025.
Where the Market Stands Right Now
Let’s build on that. Here’s what I’m actually seeing under the hood.
None of this is a full-blown warning sign. But there are some things I’m watching closely.
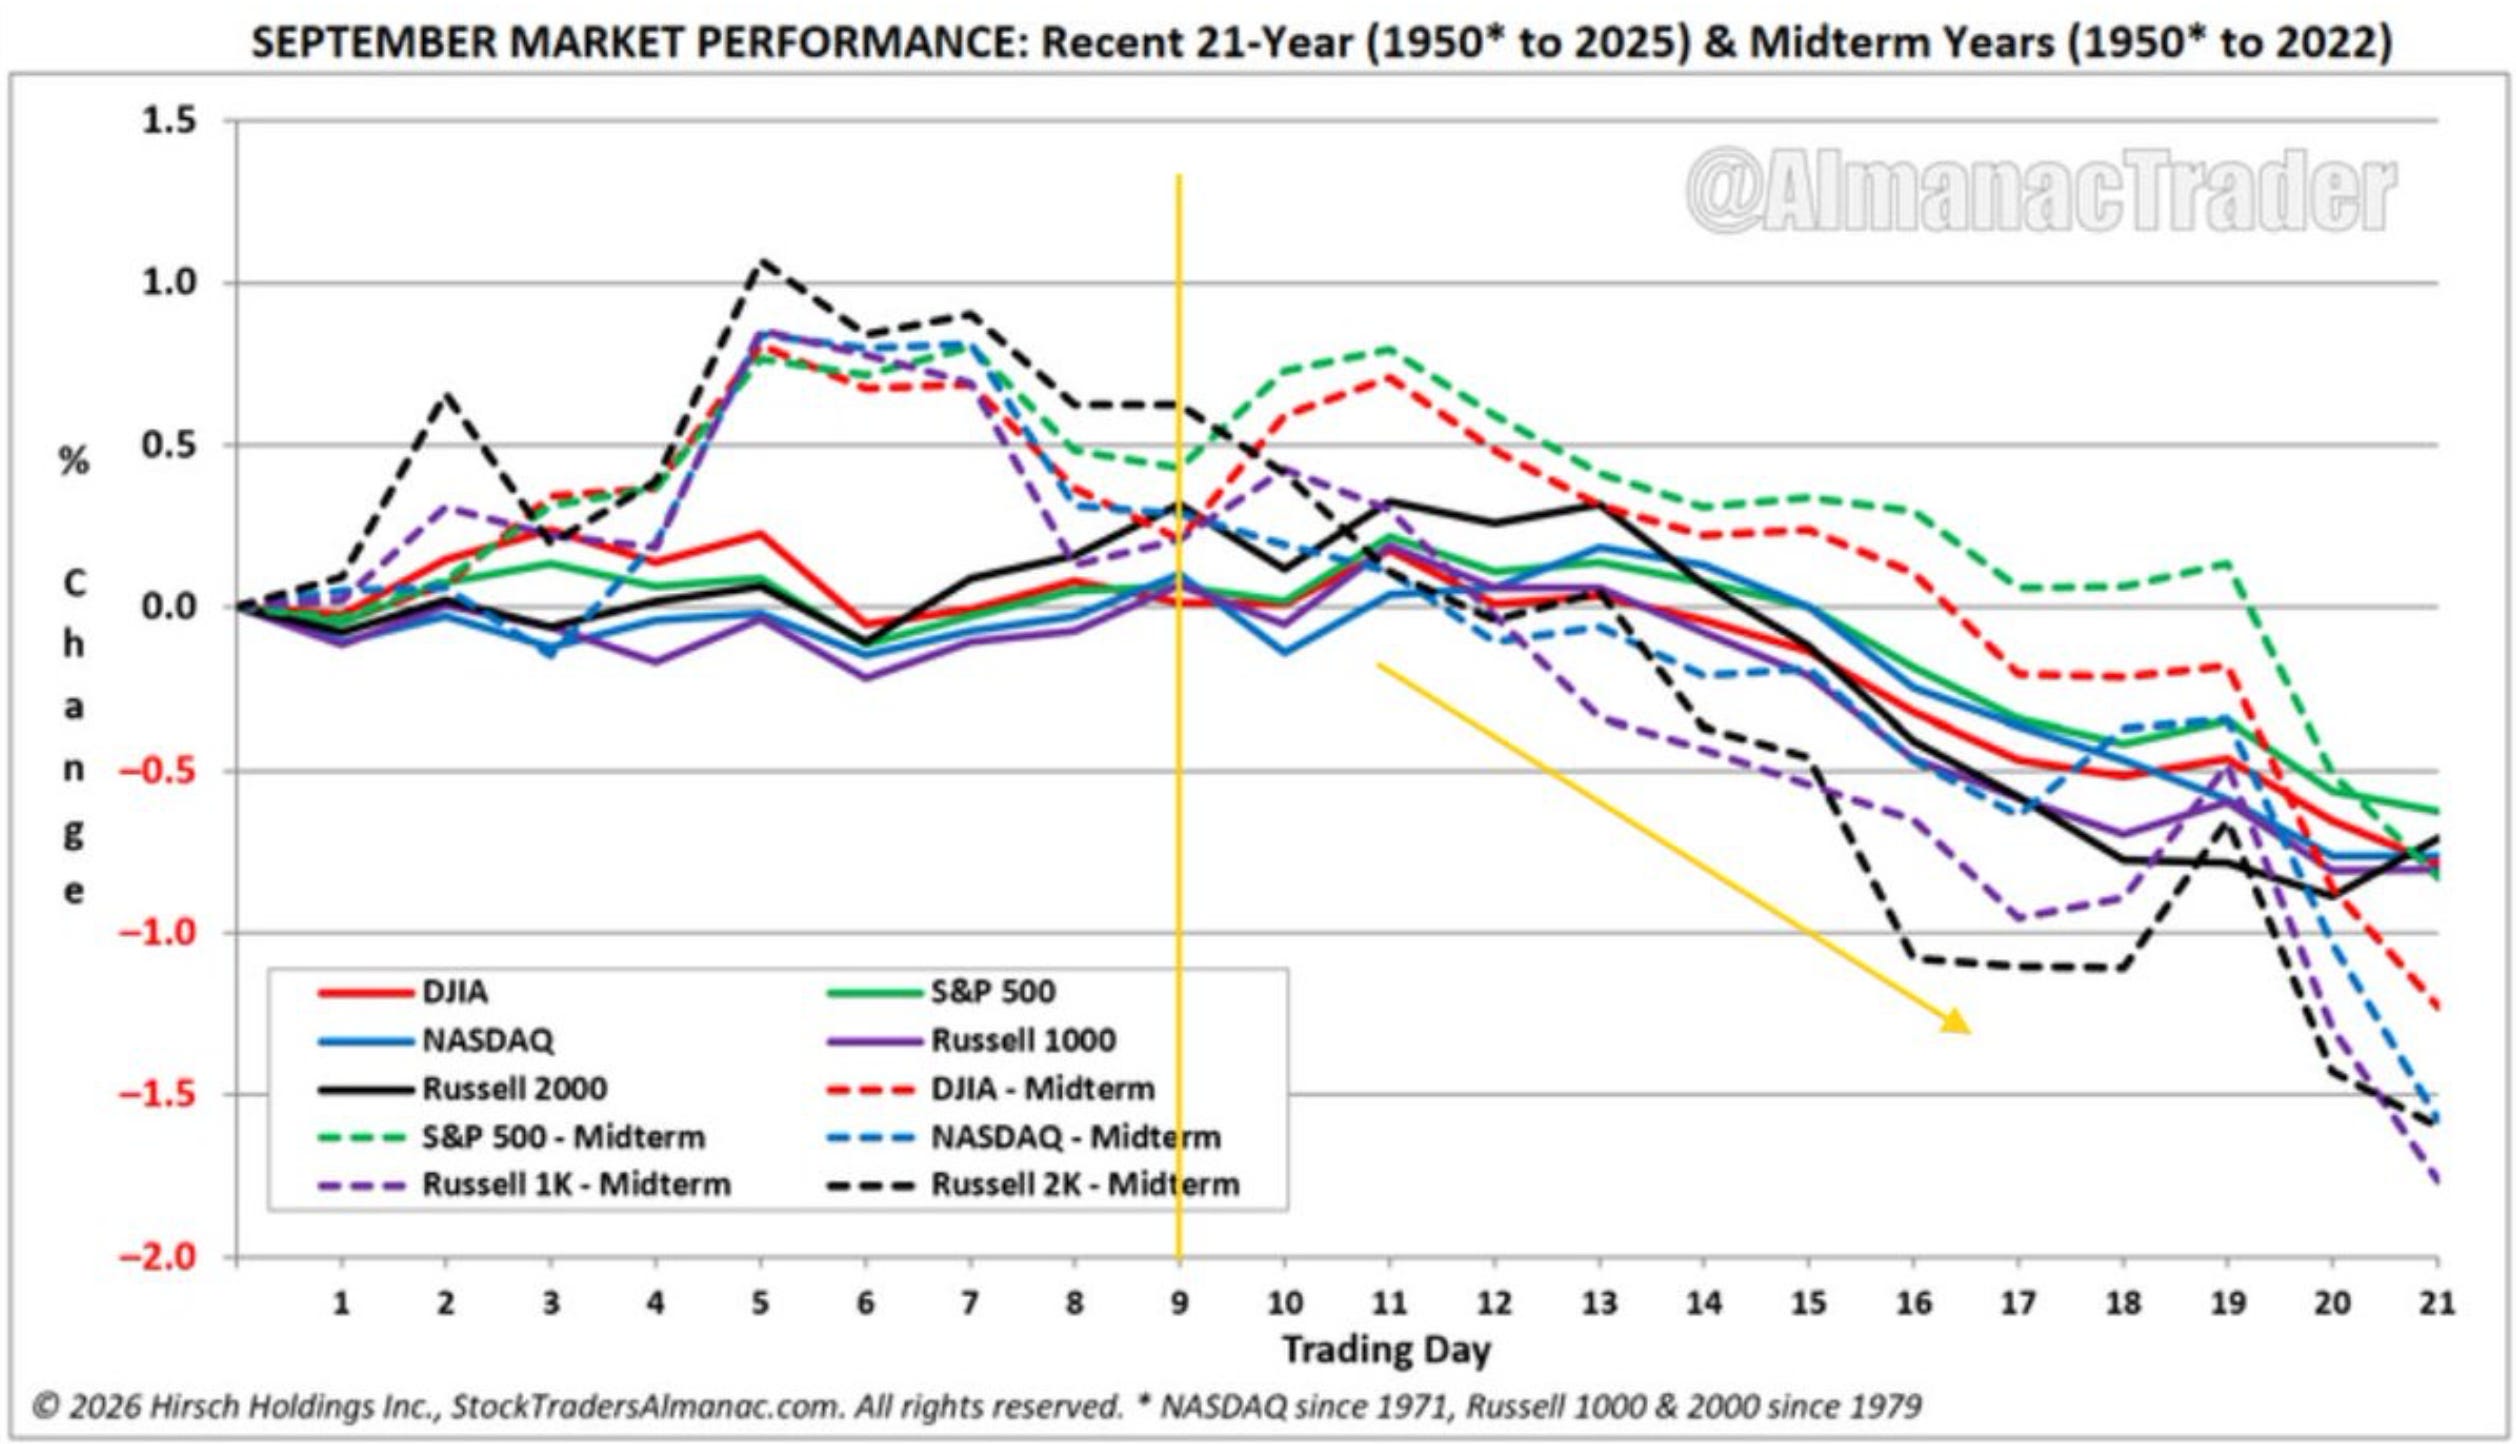
Start with seasonality. Jeff Hirsch has pointed out that September tends to get worse as the month goes on, and midterm years have historically been the roughest stretch.
The historical message is clear: September weakness tends to build as the month progresses, and midterm years have often delivered an especially difficult finish.
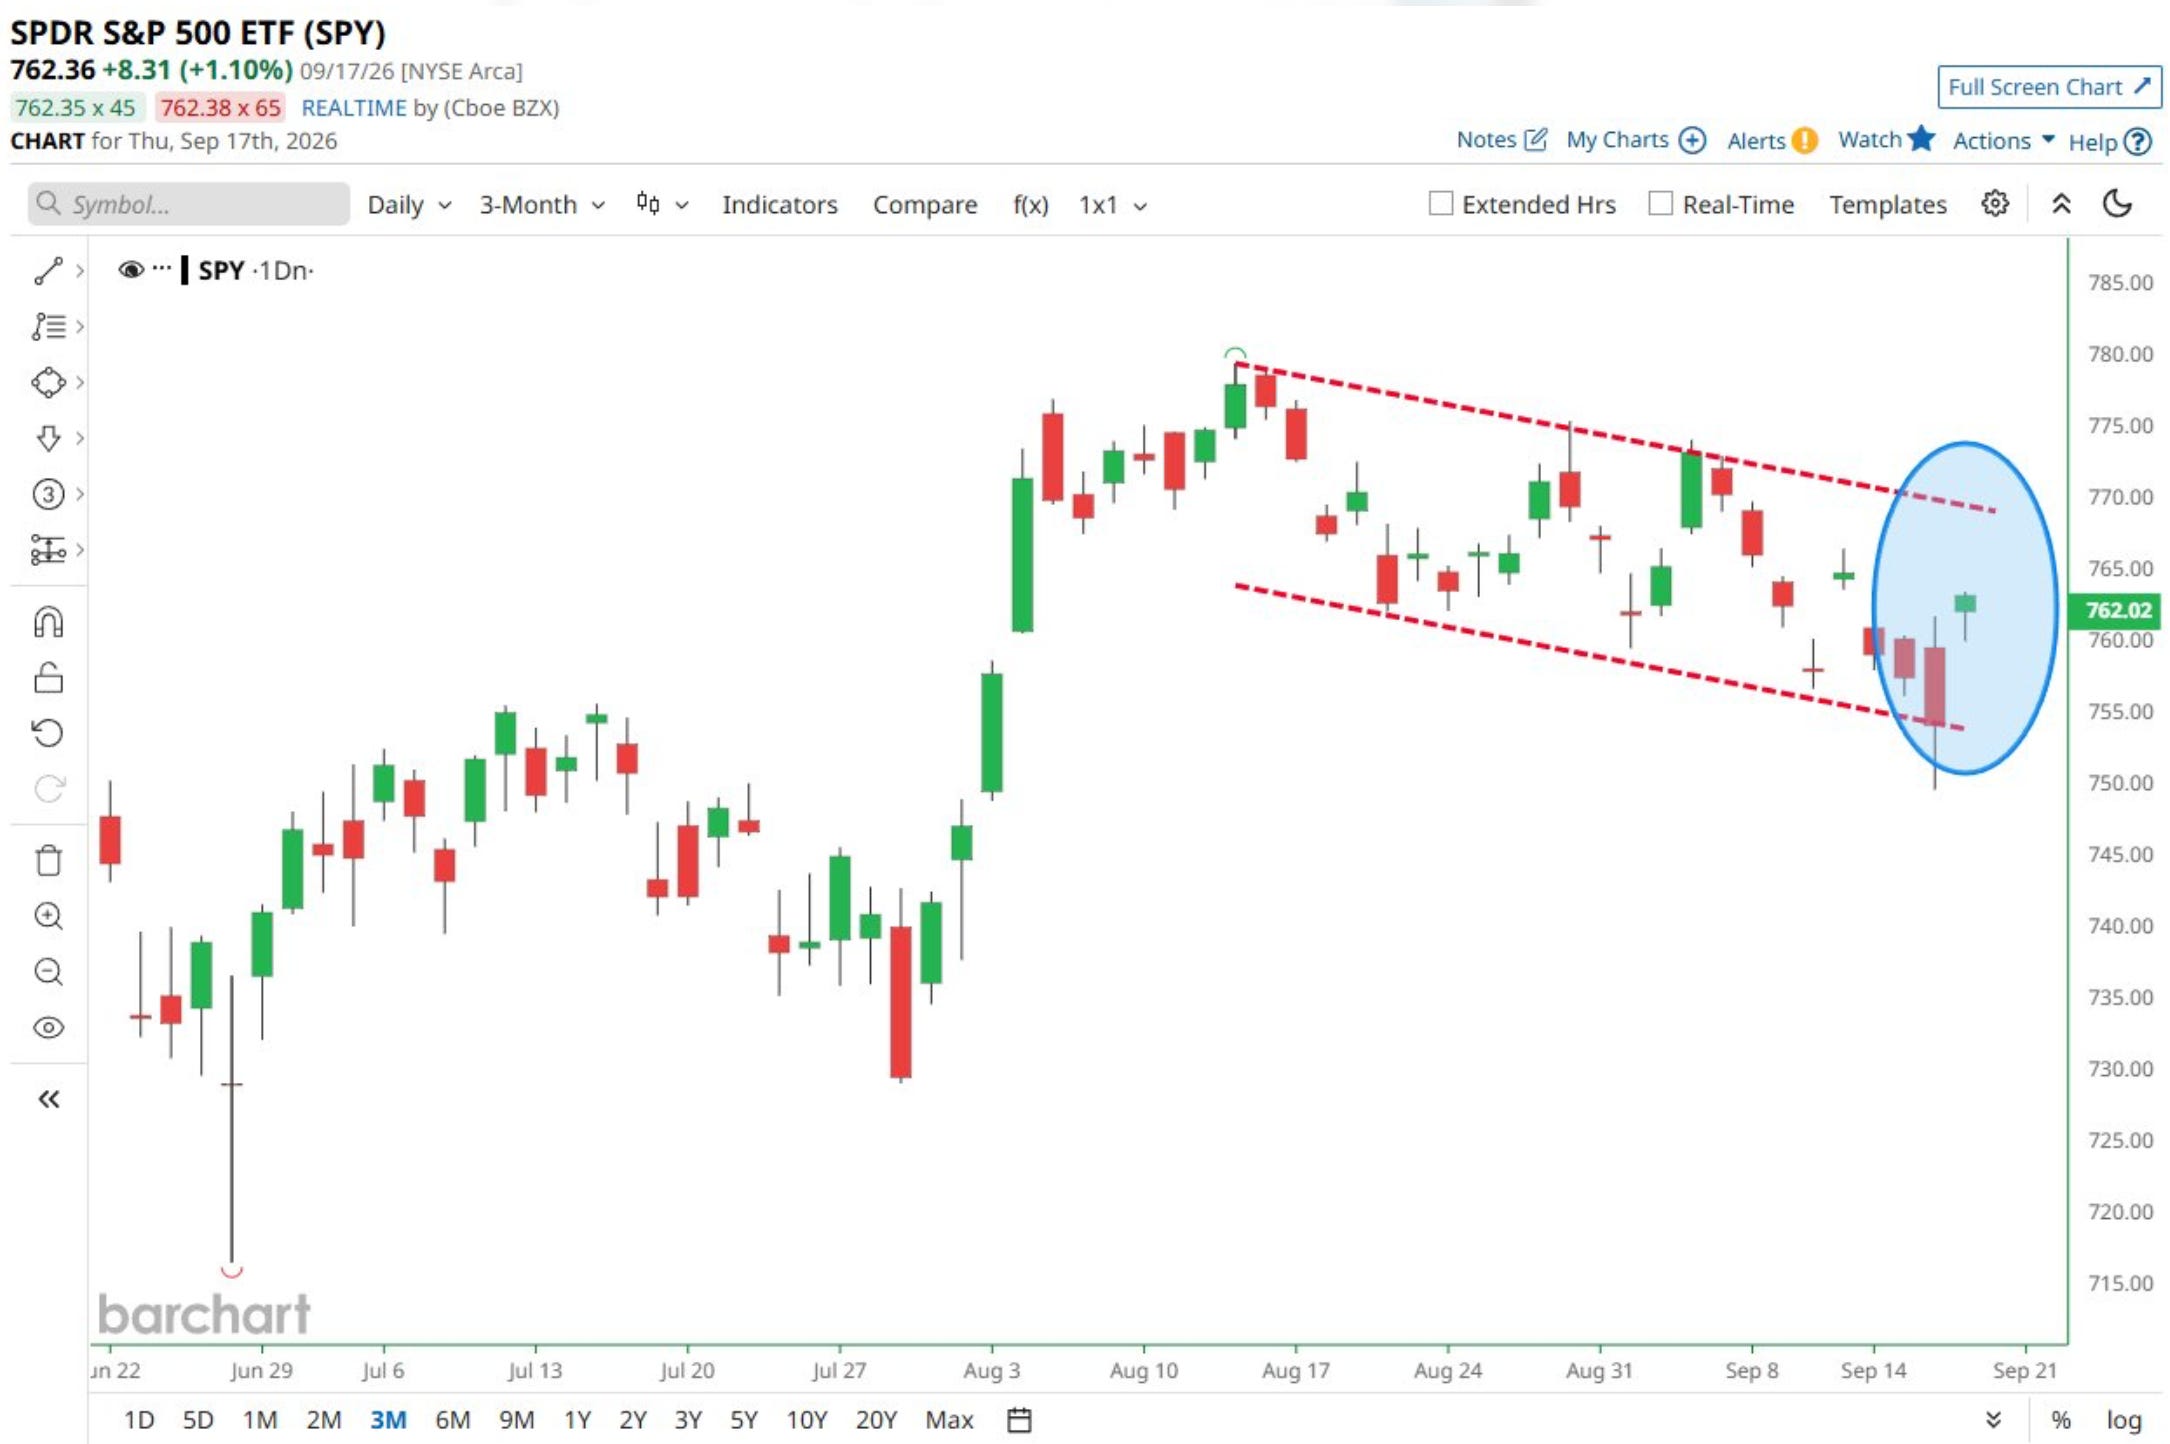
The chart lines up with the calendar. The S&P 500 has been stuck in a downtrend channel since its August all-time high. Lower highs, lower lows.
Then Wednesday happened. The Fed hiked rates for the first time in three years, a quarter point move to 3.75 to 4%. That’s the highest rate since late 2025. The vote was unanimous, 12 to 0.
The bigger news might be what comes next. Officials signaled at least one more hike before year end. 16 of 18 participants penciled in another increase in 2026. Beyond that, the dot plot gets murky. Nobody has much conviction on 2027 yet.
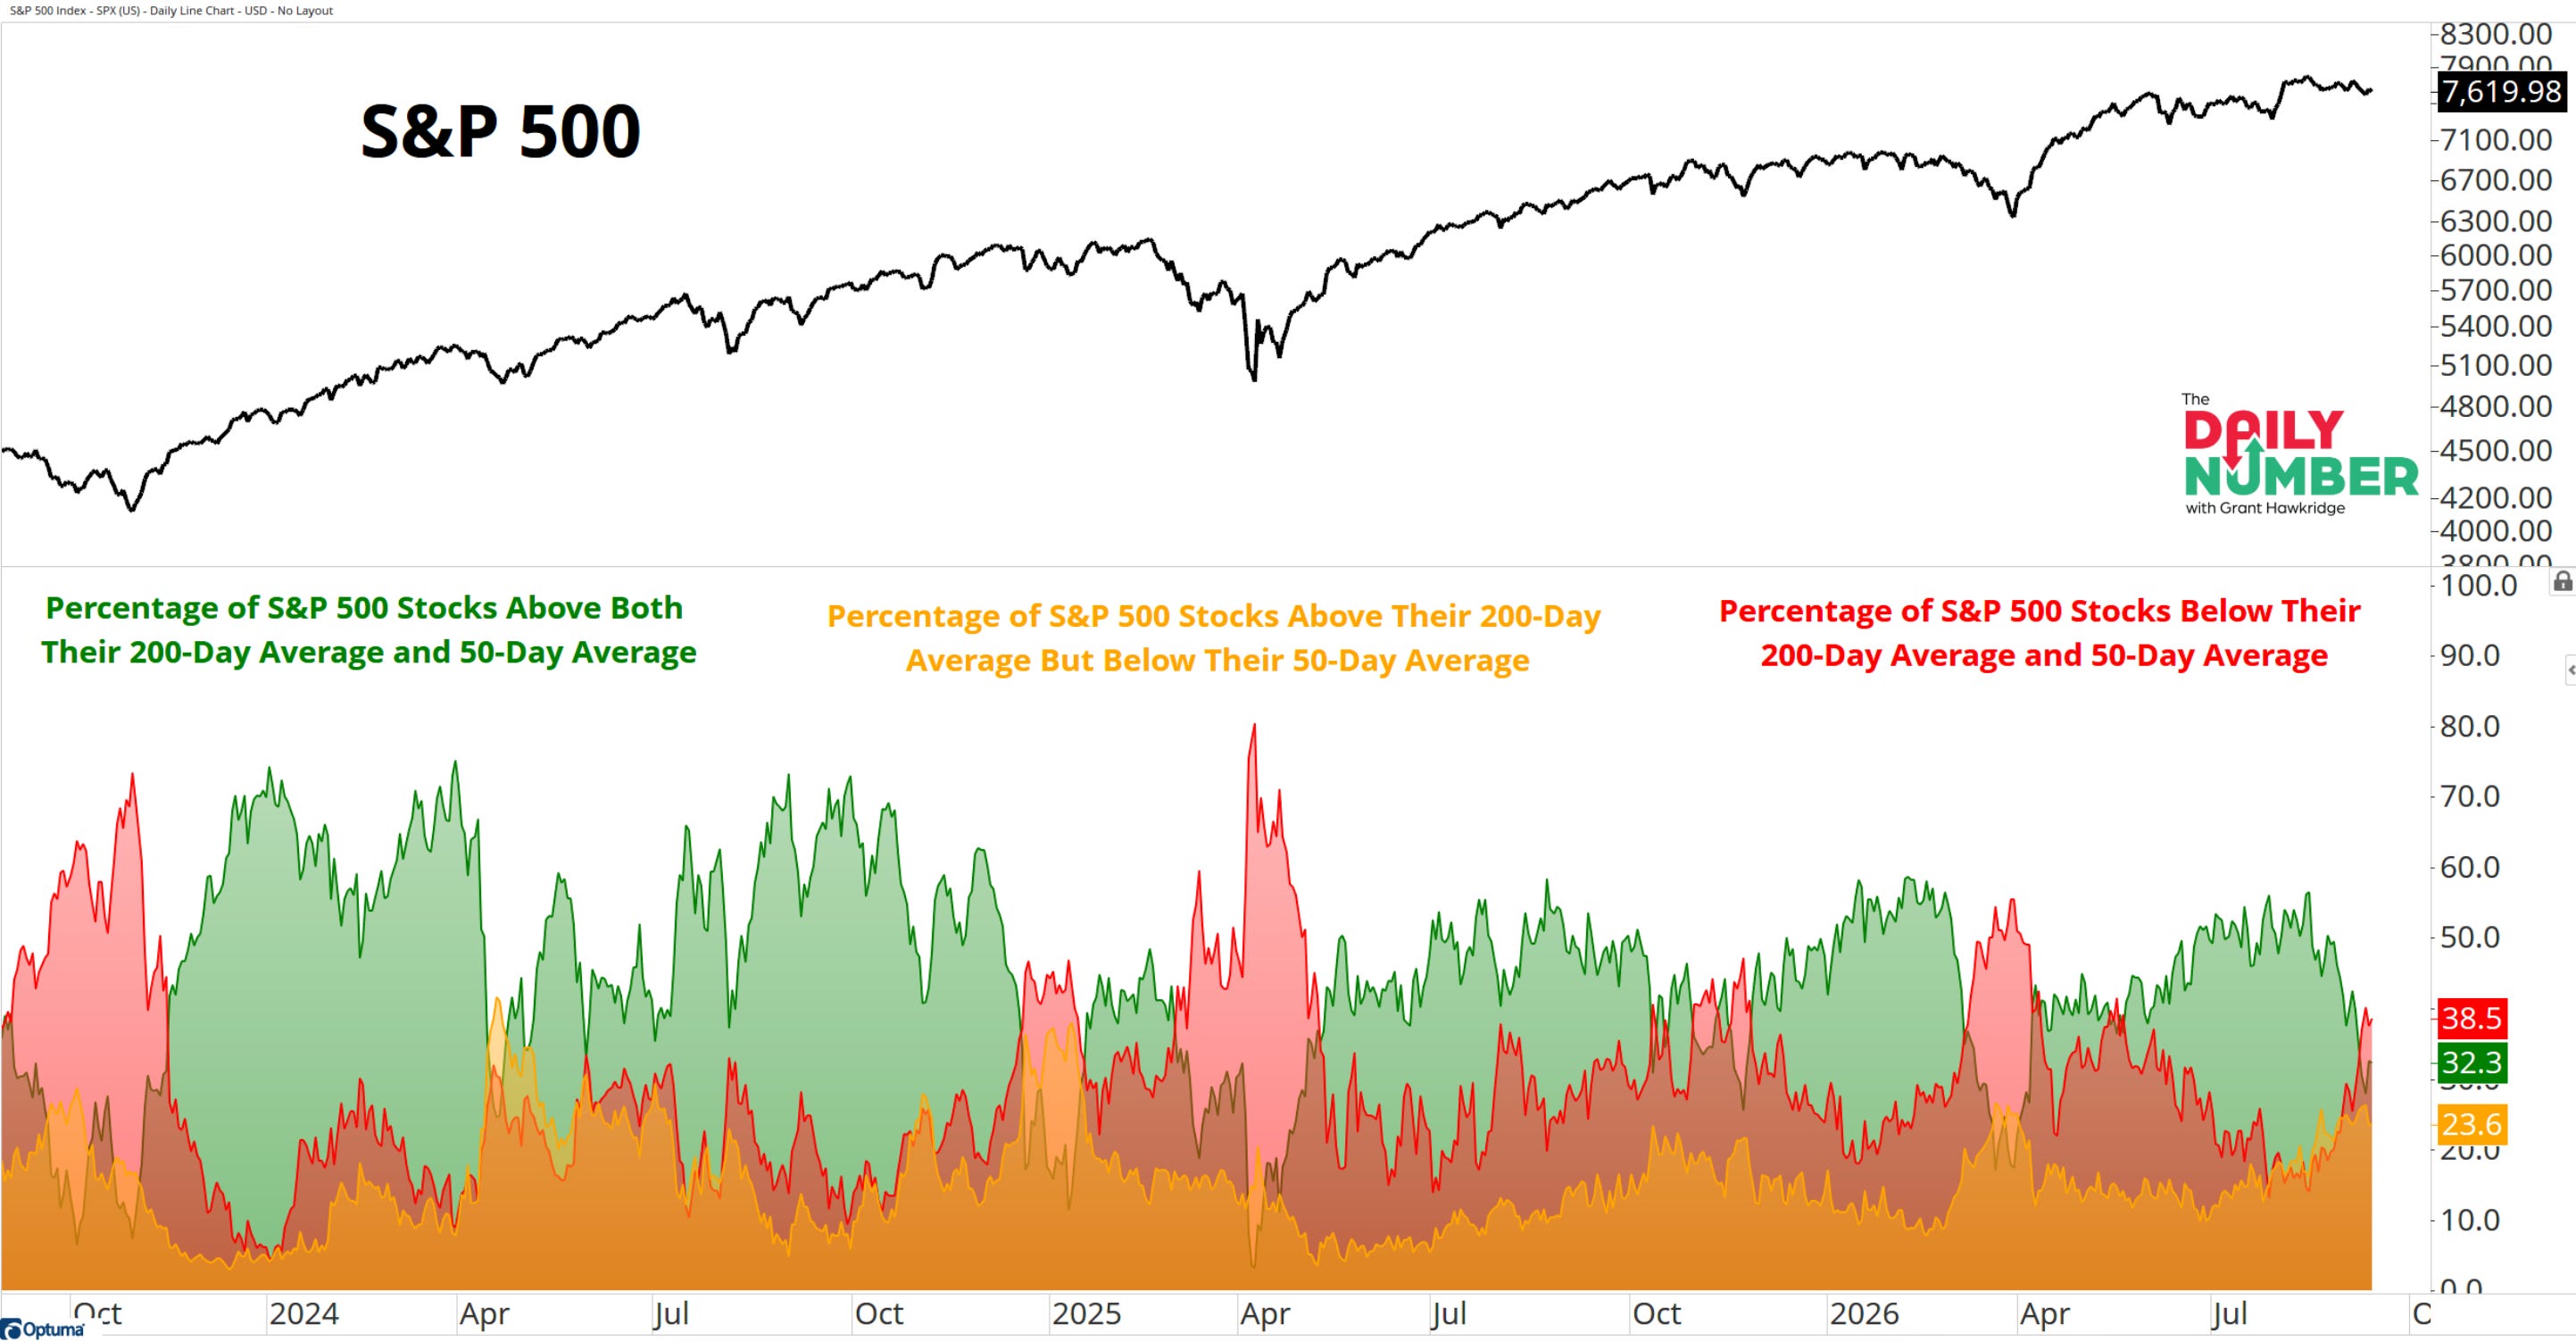
One of my favorite charts for understanding what’s really happening under the surface comes from my friend Grant Hawkridge. Right now, 38.5% of S&P 500 stocks are below both their 50-day and 200-day moving averages. Only 32.3% are above both. That means more stocks are sitting in weak trends than strong ones.
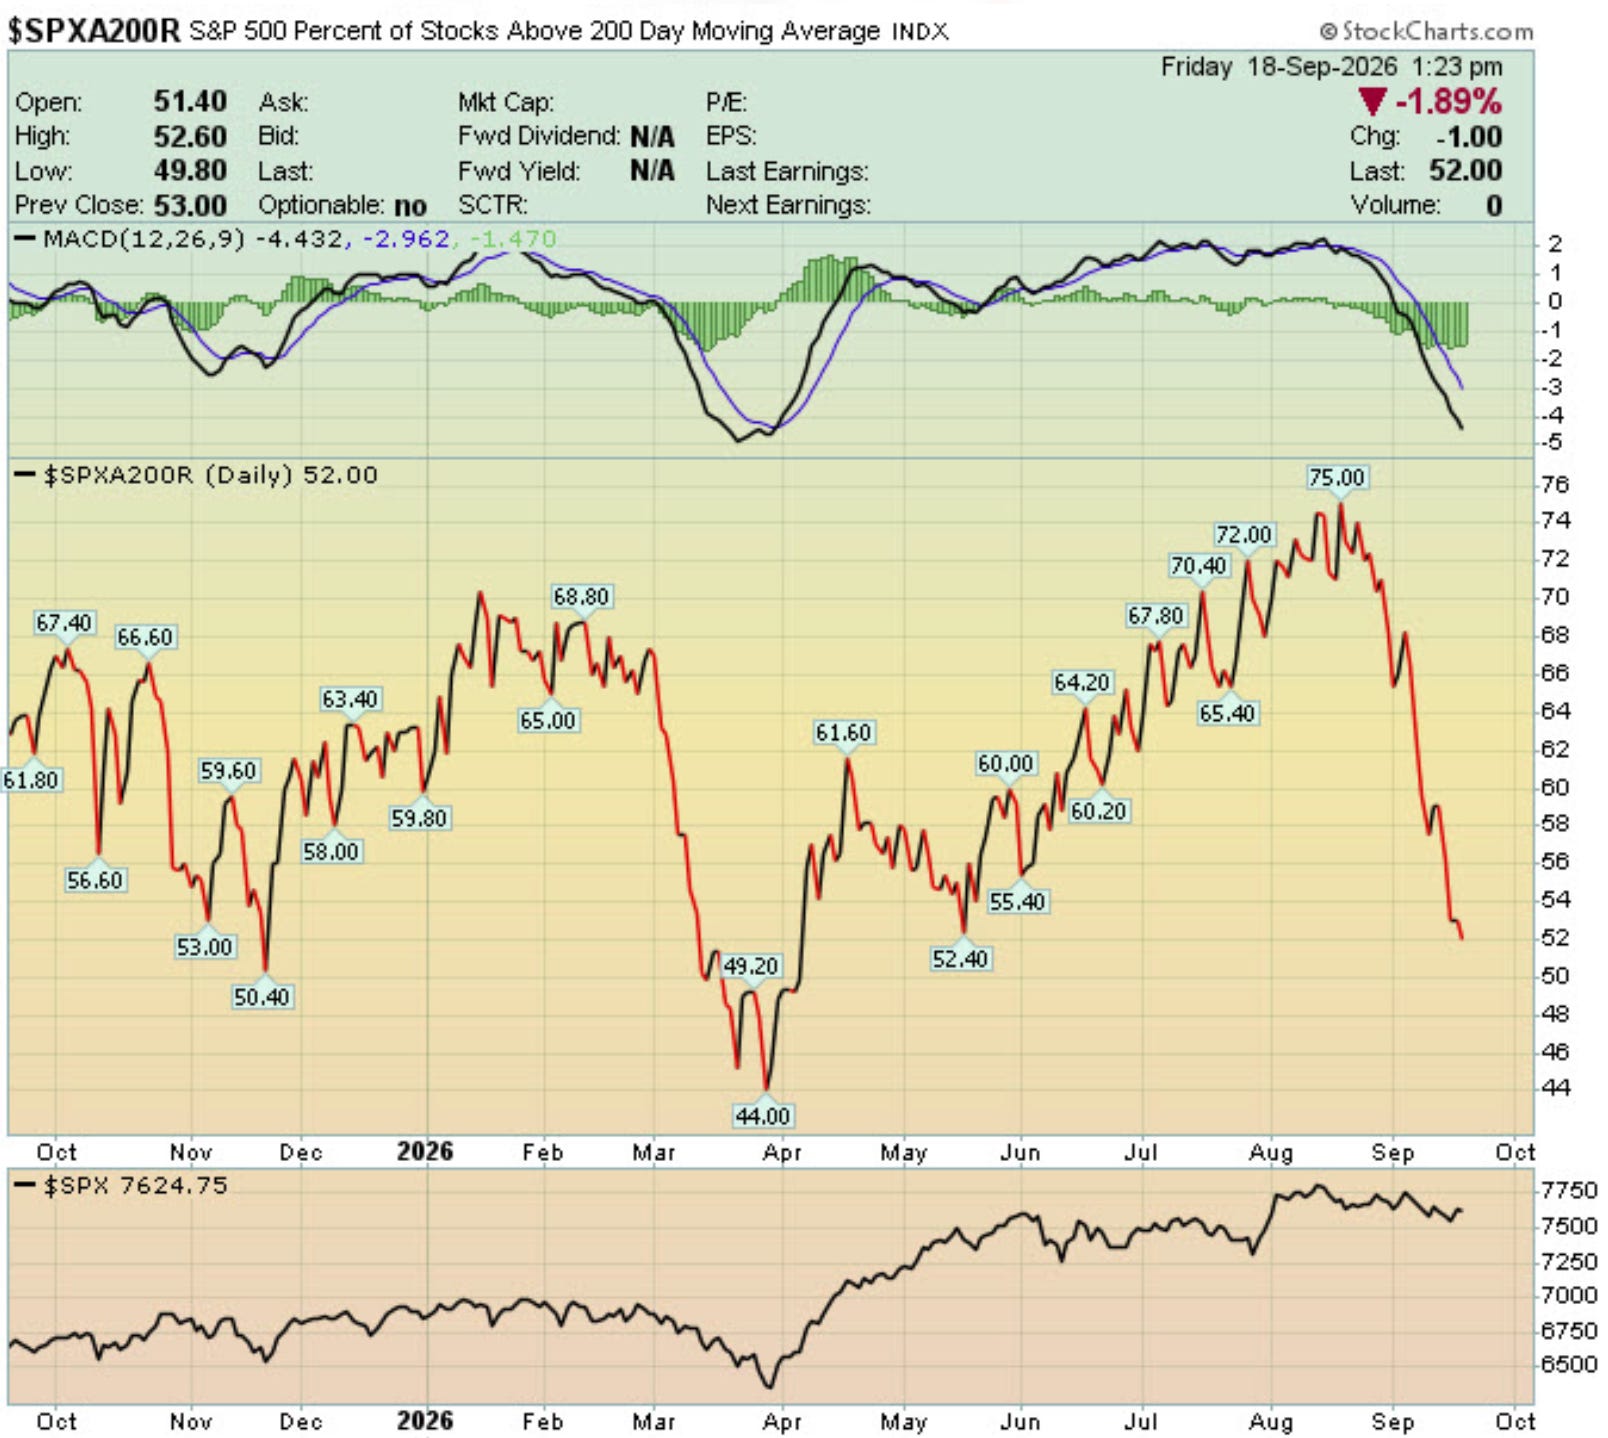
I’m watching the 200-day closely here. The long term trend is still intact. The short term picture is getting messy.
I flagged this exact issue last week in A Lot of Bad Breadth. Now the number is even more stark. Half the S&P 500 has lost its 200 day moving average. The index itself is still above its own 200 day, but the stocks underneath it are quietly breaking down. Breadth hasn’t improved. It’s gotten worse.
Put it together. Seasonality is working against us. The index is stuck in a downtrend channel. The Fed just hiked into a market with deteriorating breadth. None of this changes my long-term thesis. But the short-term picture needs to prove itself here.