This week saw the following.
Monday: It was the biggest one-day loss for the S&P 500 since September 2022.
Thursday: The S&P 500 rose by 2.3%. The biggest one-day gain since November of 2022. That’s the best day for stocks in 20 months!
After all this, the S&P 500 finished right back where it closed last Friday. Nothing actually changed.

To be precise it was a change of only 0.04%. That’s the smallest weekly changed in 6 years.
Jobless claims are what helped turn the market around on Thursday. They came in at 233,000 vs. 244,000 which was expected. It does signal that a collapse in the labor market may not be as certain as they were saying.
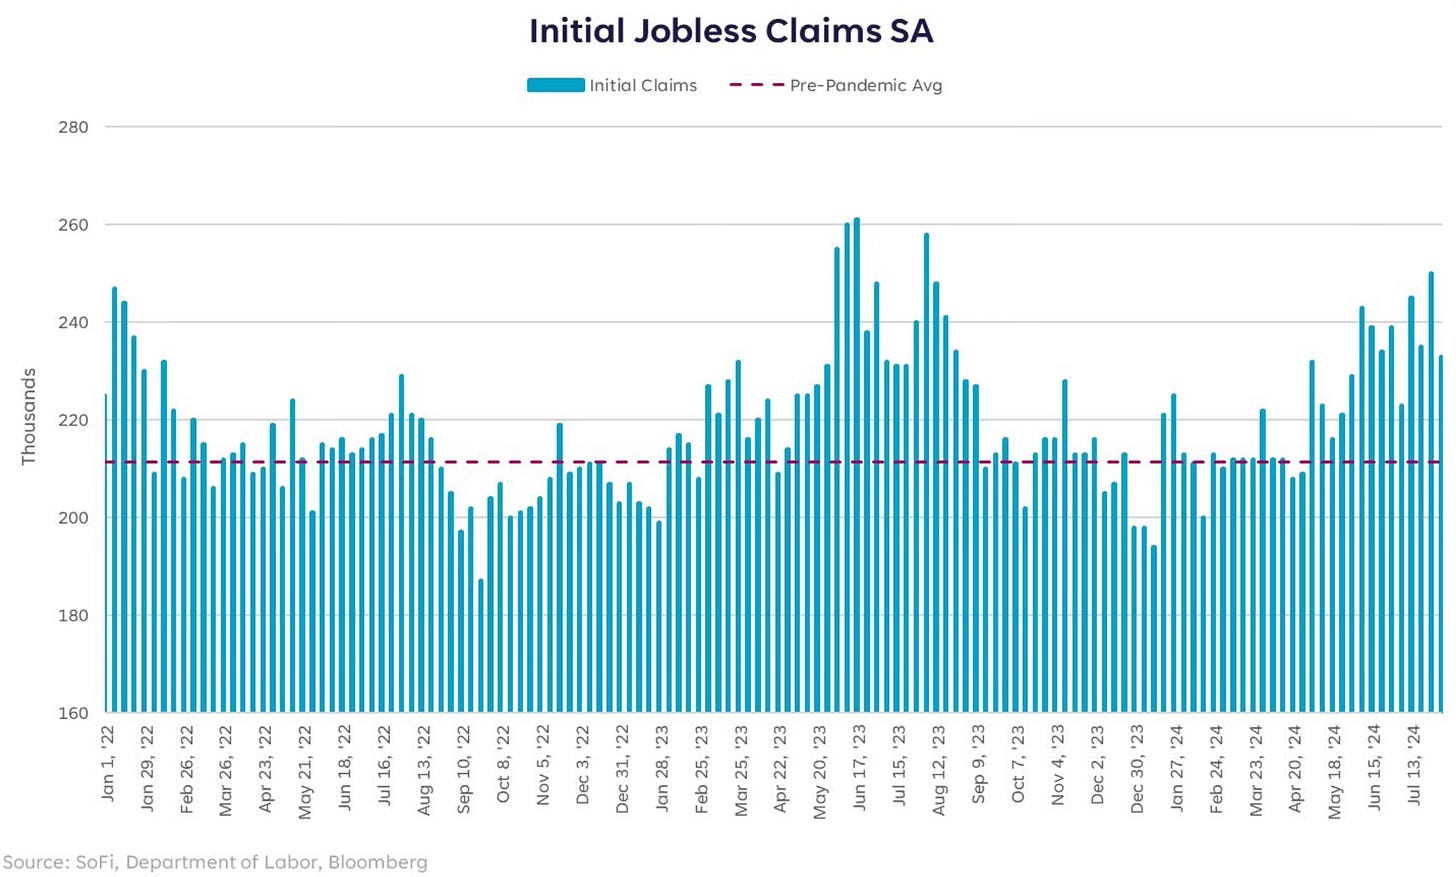
The fact that we have weekly jobless claims moving the market by 1-2% a day tells me the market is on edge right now. Volatility and uncertainty are in charge at the moment.
Market Recap
Data In The Past Week

Is The Selloff Over?
After overcoming another volatile roller coaster ride of a week, does that mean this selloff is over?
From the top on July 16th to today, we’ve seen a pullback of over 8%. So is that it?
If we’re starting to see these levels of volatility on what I would really call no important news at all, I don’t think this is it. We had the VIX hit levels in the past few days that were on par with the same levels the VIX saw during the GFC and COVID crash.
I mean if we’re seeing swings like that on some weekly jobless claims numbers, concern over a 25 basis point hike not taken by the Fed and a Japanese currency risk. This isn’t over.
There is a sentiment driven risk it seems like. What happens if we get some concrete fundamental changes?
If you thought this week was wild, what happens when the CPI comes out next week and it comes in hotter than expected? Or when Nvidia reports at the end of the month?
I’ve said over the next few months until the elections are past, to expect some higher volatility.
It doesn’t change the fact that we’re still in a bull market. Large selloffs like Monday can be viewed as days to buy the dip. These will be looked back on as buyable dips during a bull market. Nothing indicates this bull market is ending.
Hedge funds bough the dip Monday. It was bought at the fastest pace since March.
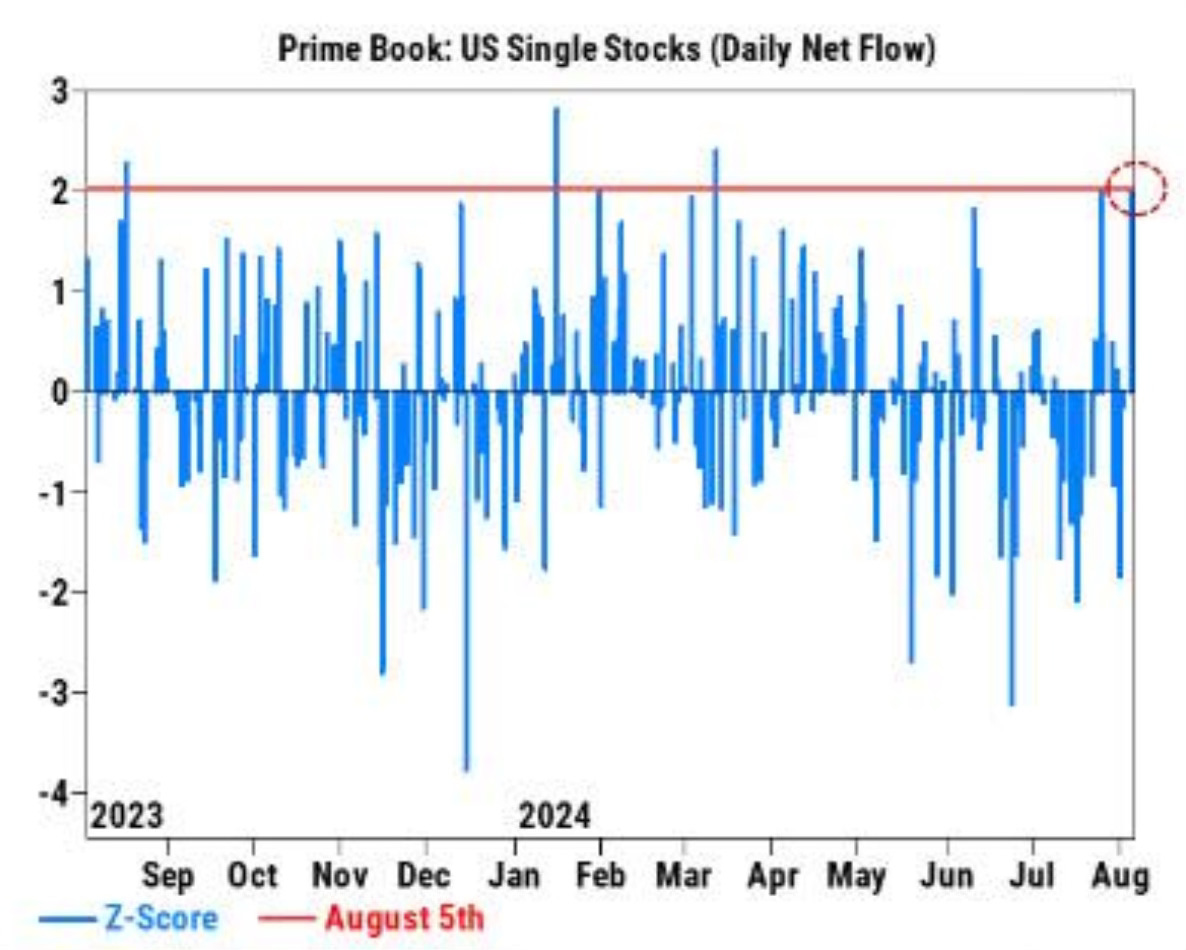
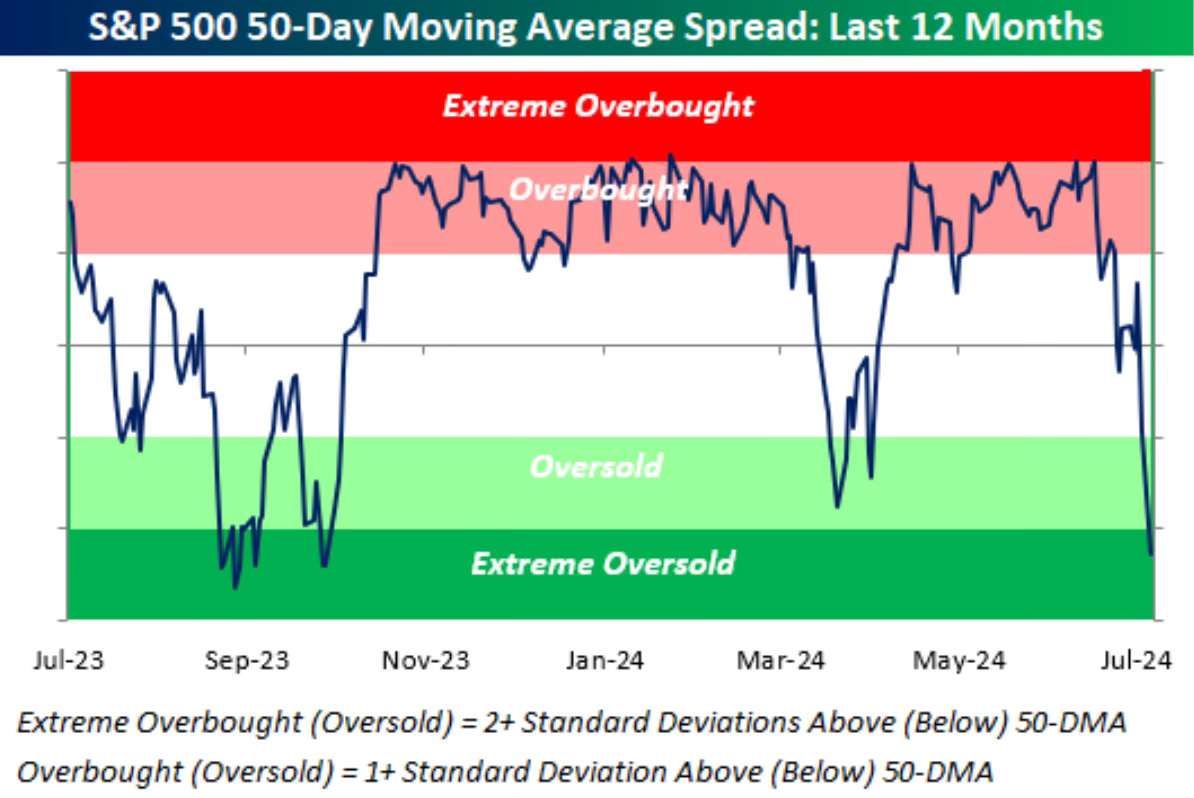
The 50-day moving average spread moved down into extreme oversold territory.
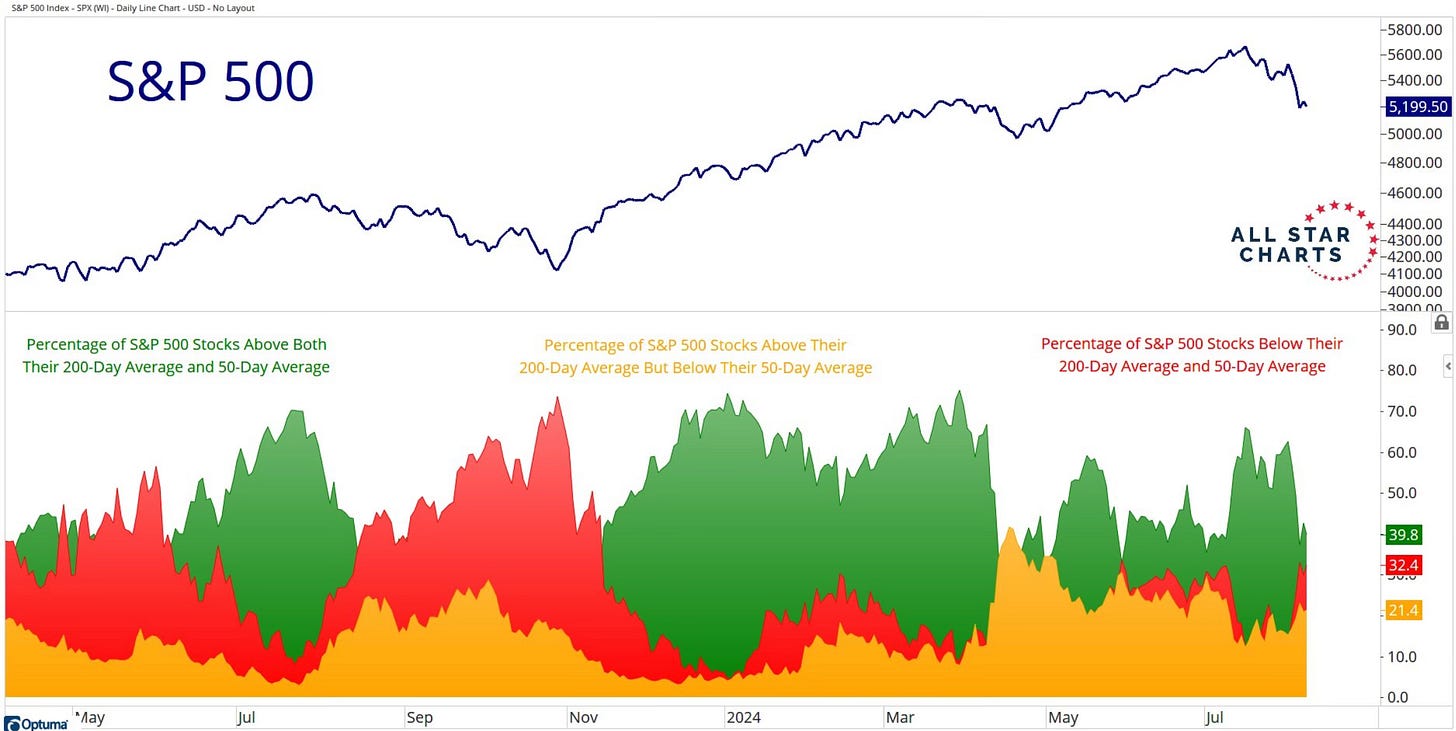
Under the hood things have got a little messy. With this much near term volatility should you be surprised?
But again, this is not uncommon at all. This is normal.
This chart shows you that since 1928, 94% of years have had a drawdown of 5% or worse. 64% have had a drawdown of 10% or worse.

What I Think Has Been Missed
With the busy week and all the back and forth price actions and volatility, I think one thing has been missed.
What drives stock prices more than anything? Earnings. Earnings drive stock prices. A lot of a company’s earnings is centered around profits.
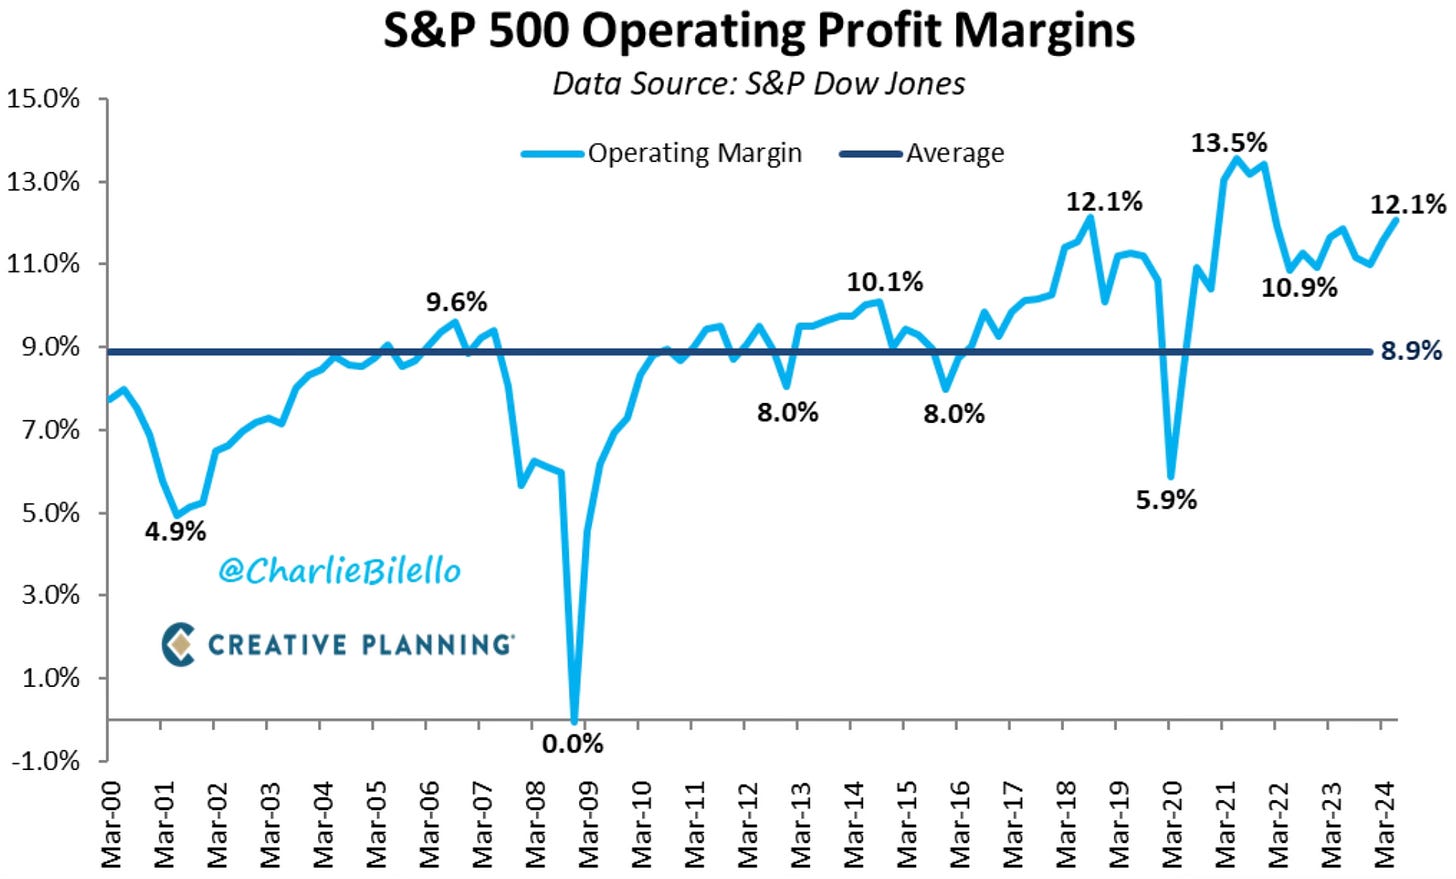
Did you know that through Q2, S&P 500 companies profit margins are now at the 2nd highest level on record? Profit margin expansion doesn’t happen if we’re in or near a recession.
A Charts Collection
This week there have been a number of charts that I’ve seen and they make you think. Is this a looming signal? Is this anything? Or is it just an interesting chart? That’s what I took from this collection of charts below.
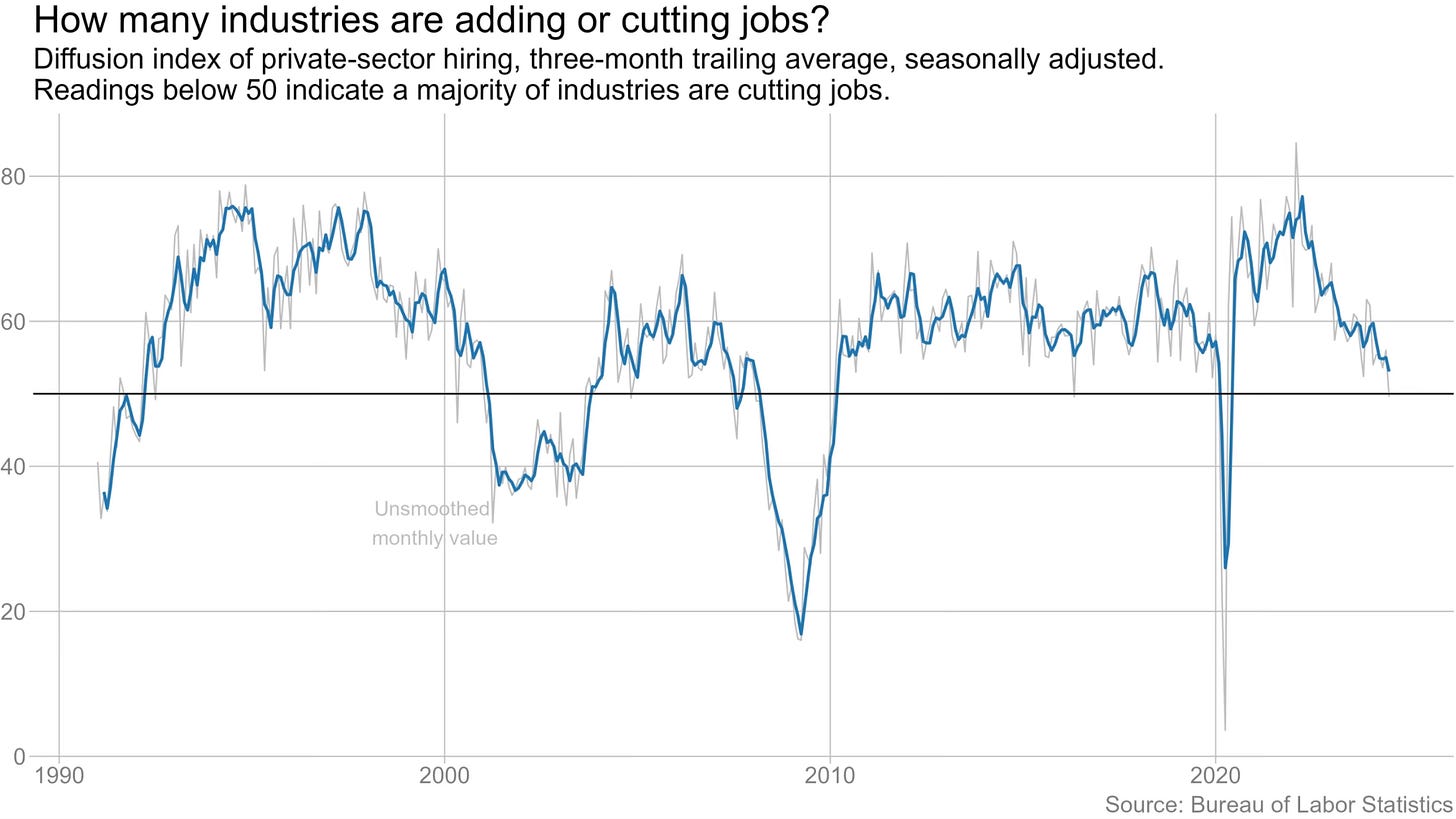
The chart and commentary from Ben Casselman was very interesting that more industries are cutting jobs instead of adding them.
The diffusion index, a measure of how widespread job growth is, fell below 50 in July, signaling that, for the first time since the height of the pandemic, more industries are cutting jobs than adding them.
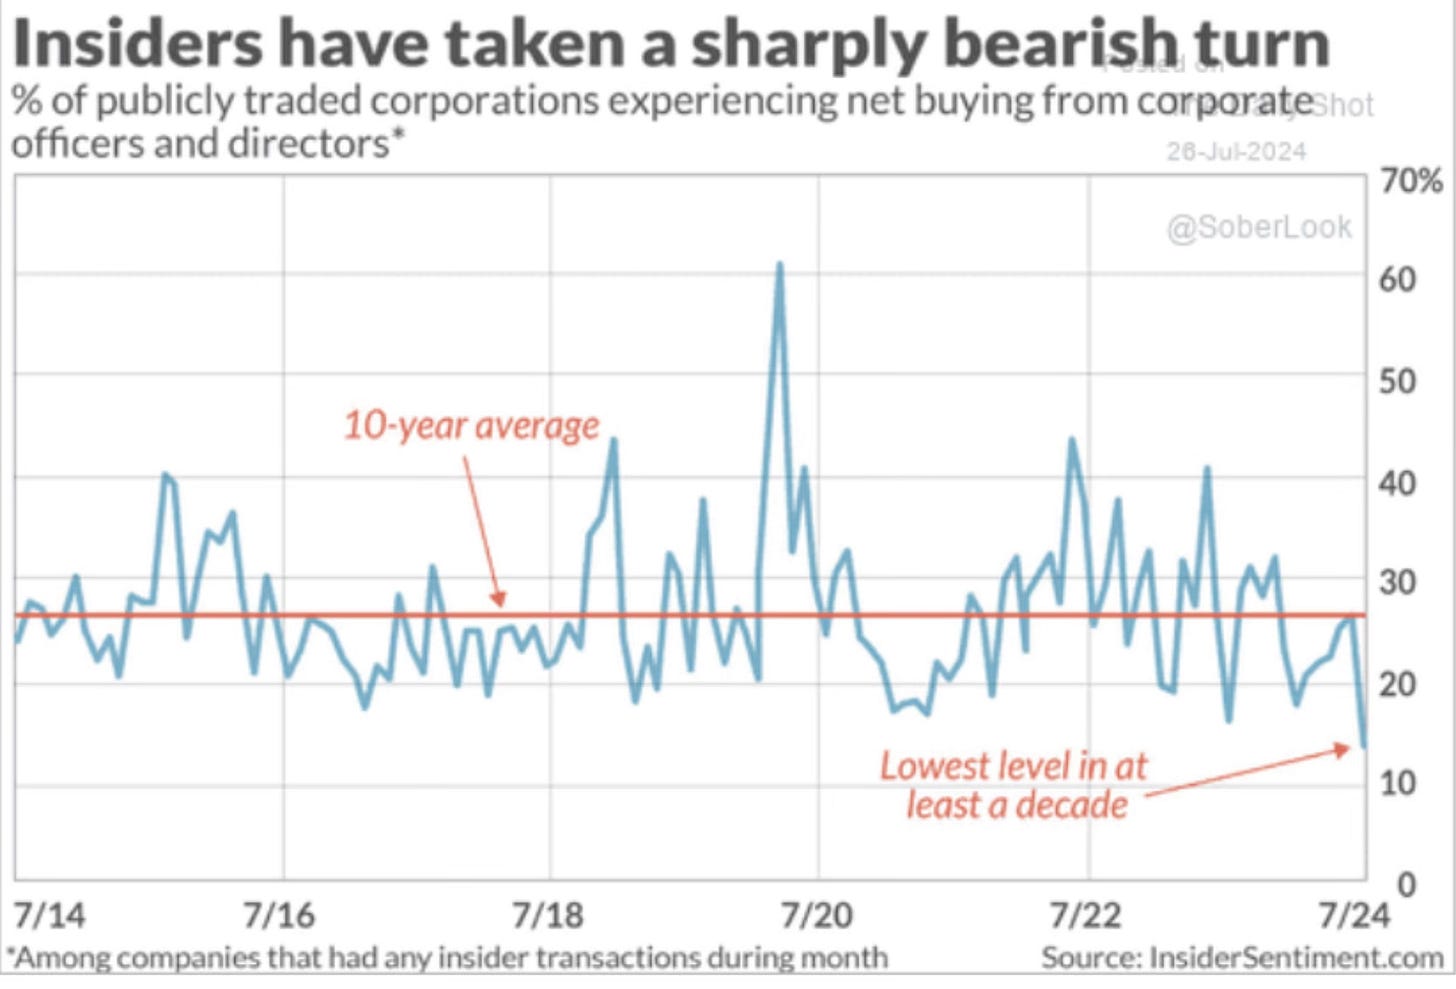
Bob Elliott pointed this chart out on what insiders are doing.
Interesting to see insiders with the most bearish flows in a decade.
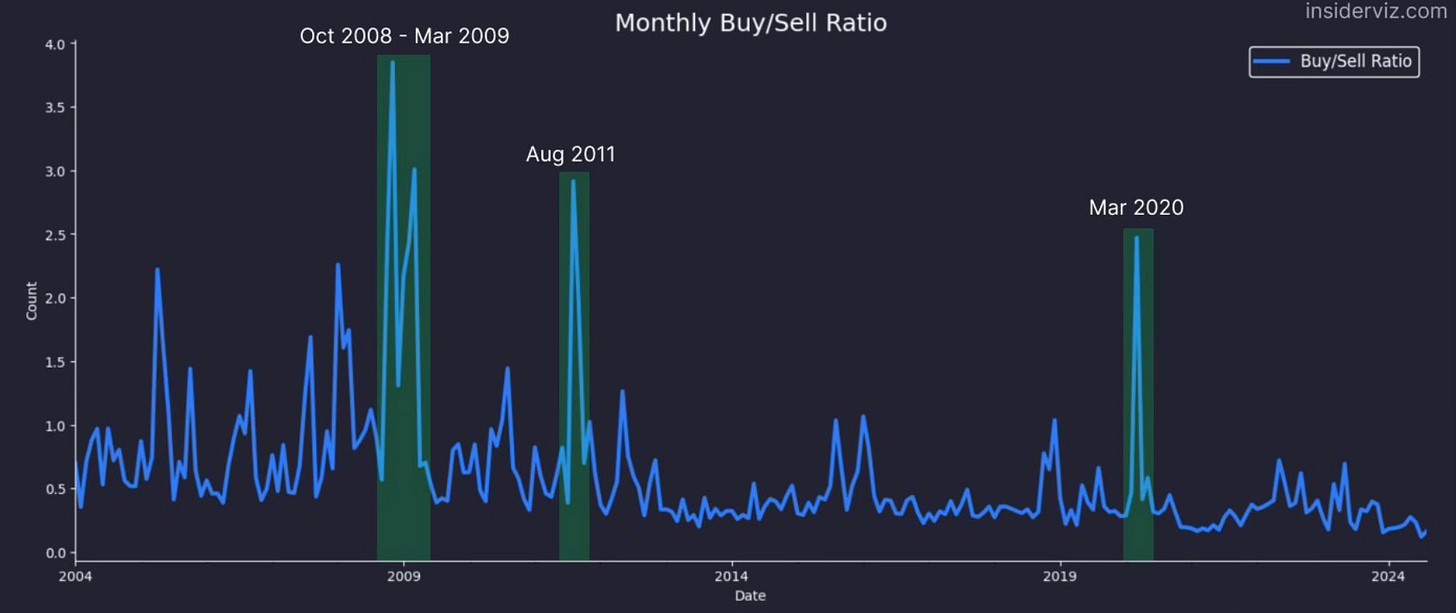
This was another chart on what insider activity has shown us historically from Markets & Mayhem.
Insiders sell for many reasons, but they only buy for one. Looking back we can see extreme buy/sell ratios for insider transactions have marked major market bottoms.
Then this chart probably stuck out the most. I don’t believe this has any bearing over the longer term. But it clearly coincides with the near term trading range and how investors try to invest off the odds who may be president. From Bespoke.
The stock market (using $SPY) has been tracking GOP odds to win the Presidency rather closely since the start of April. Most notably, the market's recent peak on 7/16 coincides with the peak for the GOP's odds to win.

A Look At Bonds
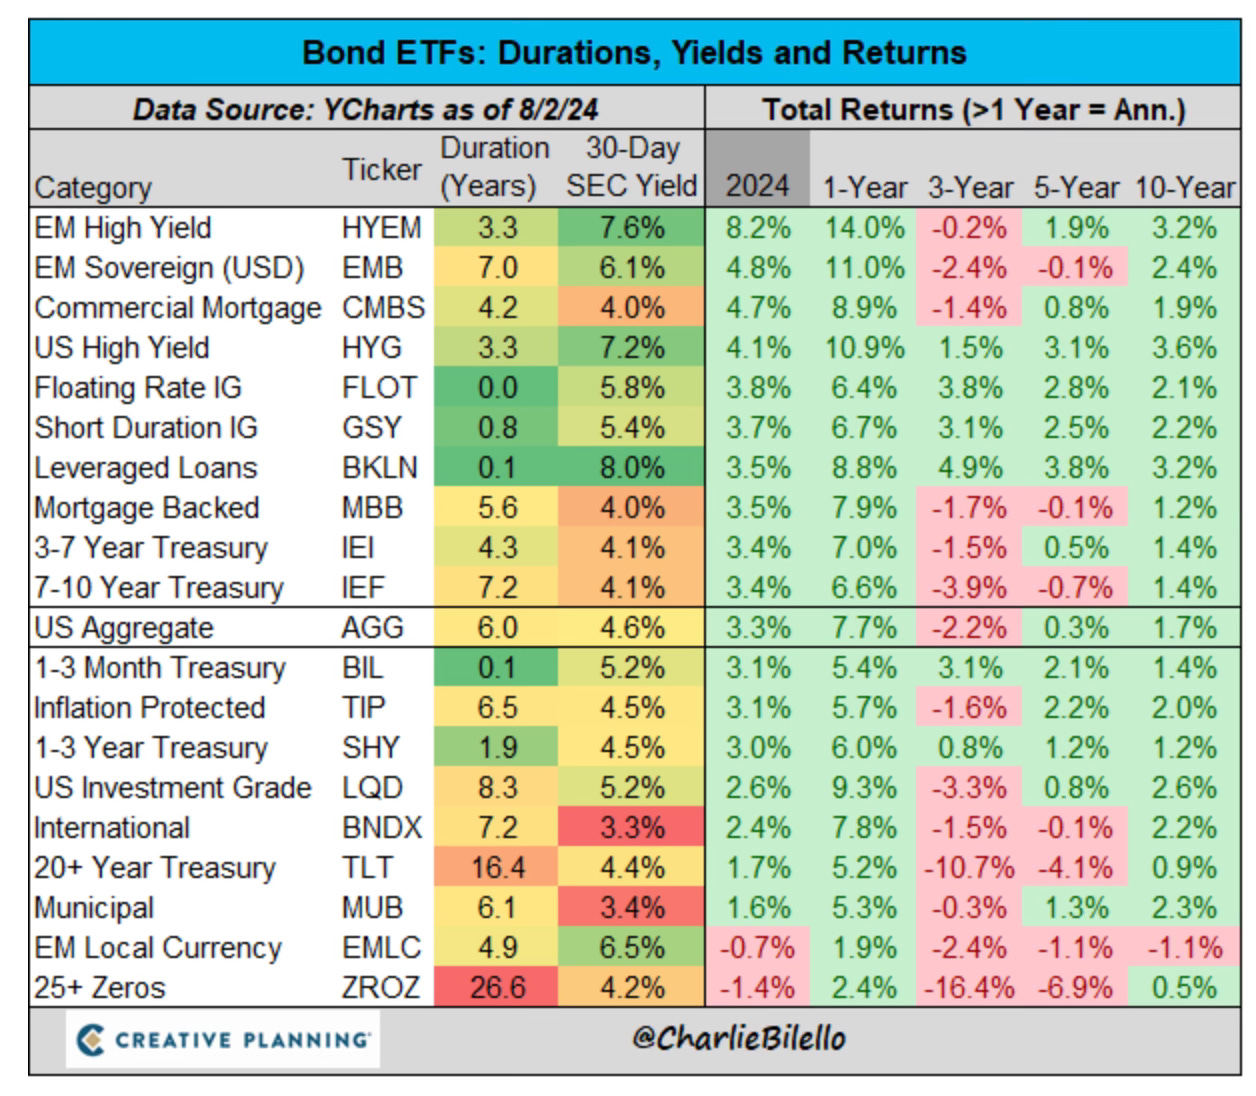
It’s been a while since I’ve shared much about bonds. I really like this chart that breaks out all the different categories and the returns over various timeframes.
Stock Calls
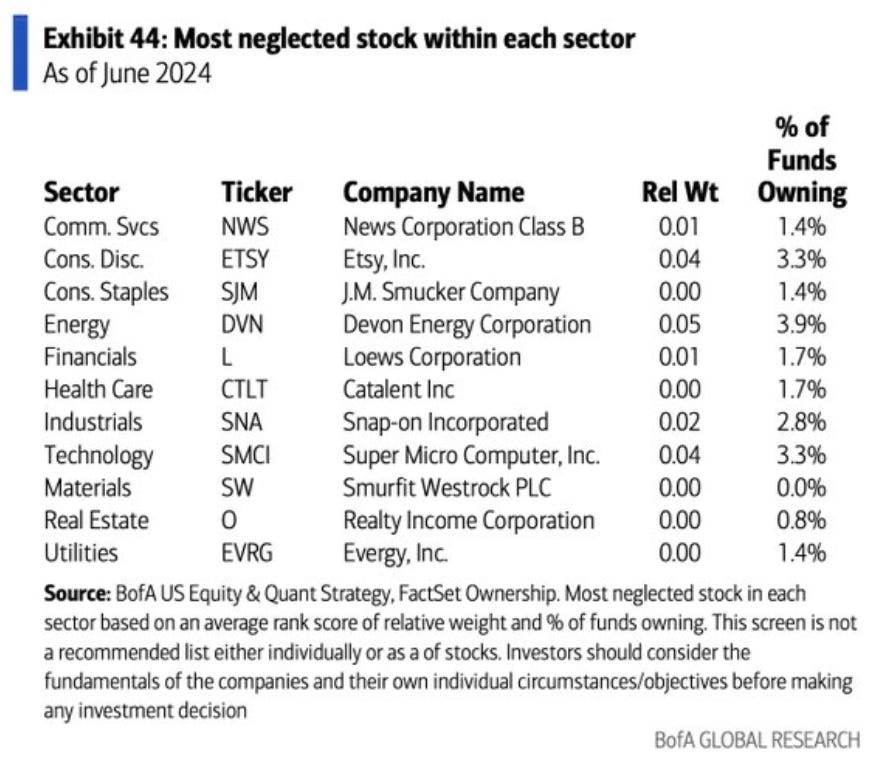
Since we’re in a very volatile range, this is the time to be sure you have you’re shopping list together. This is what BofA recently put out on what it was seeing with some individual stocks.
They updated their US 1 List. Marriott International replaced DraftKings. This is a list of some very good stocks.

This is the list of the most neglected stock within each sector.
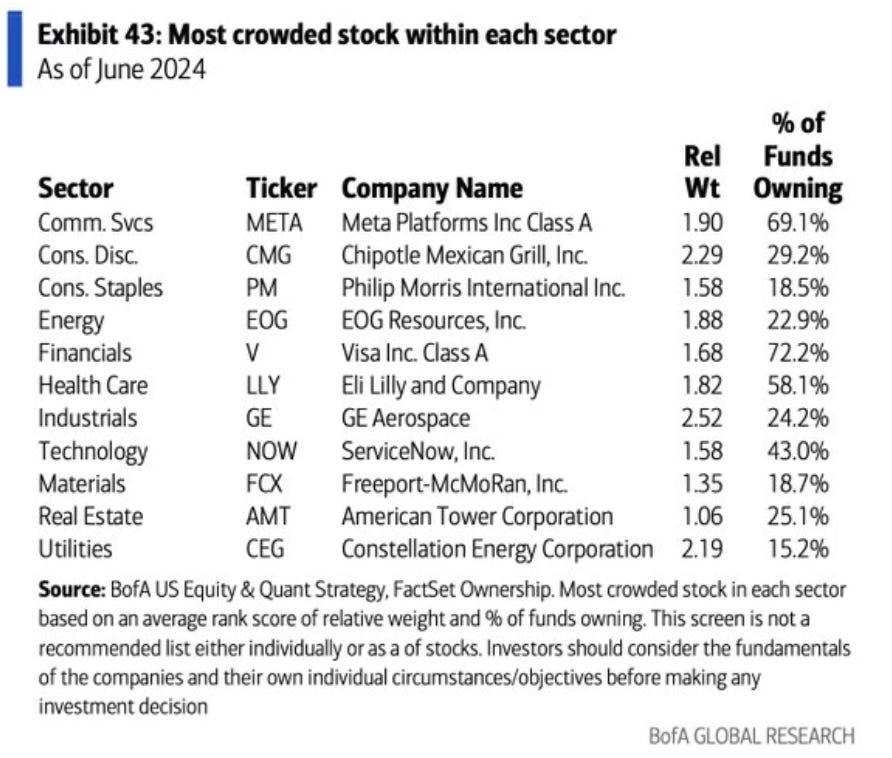
These are the most crowded stock with each sector.
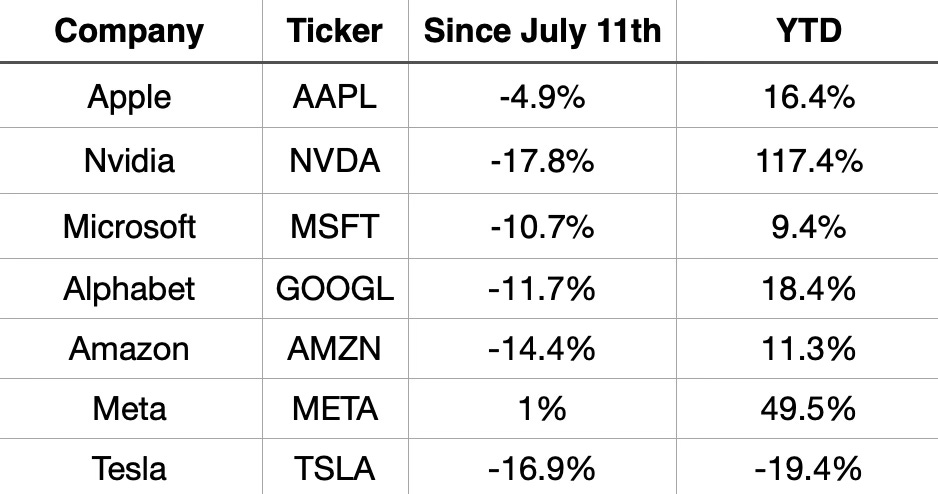
Magnificent 7 Follow Up
Last week I included a chart of the Magnificent 7 but it wasn’t completely correct. The first 7 names listed (which were the Mag 7) and their information was correct. There were two additional lines that weren’t correct and shouldn’t have been included. The wrong chart attached. I apologize for that error.
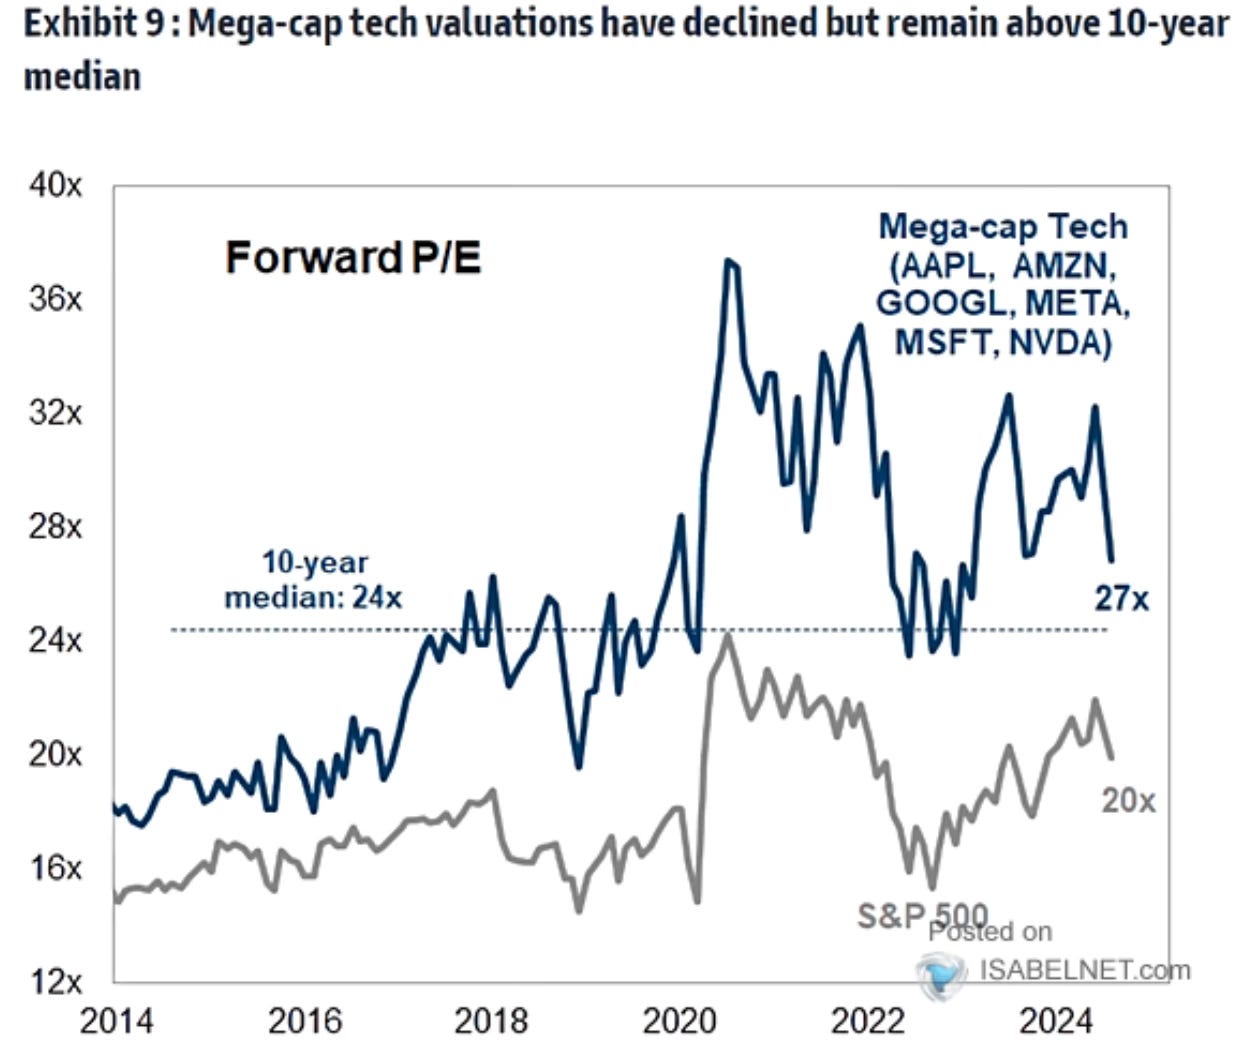
Here is the correct chart that’s up to date.
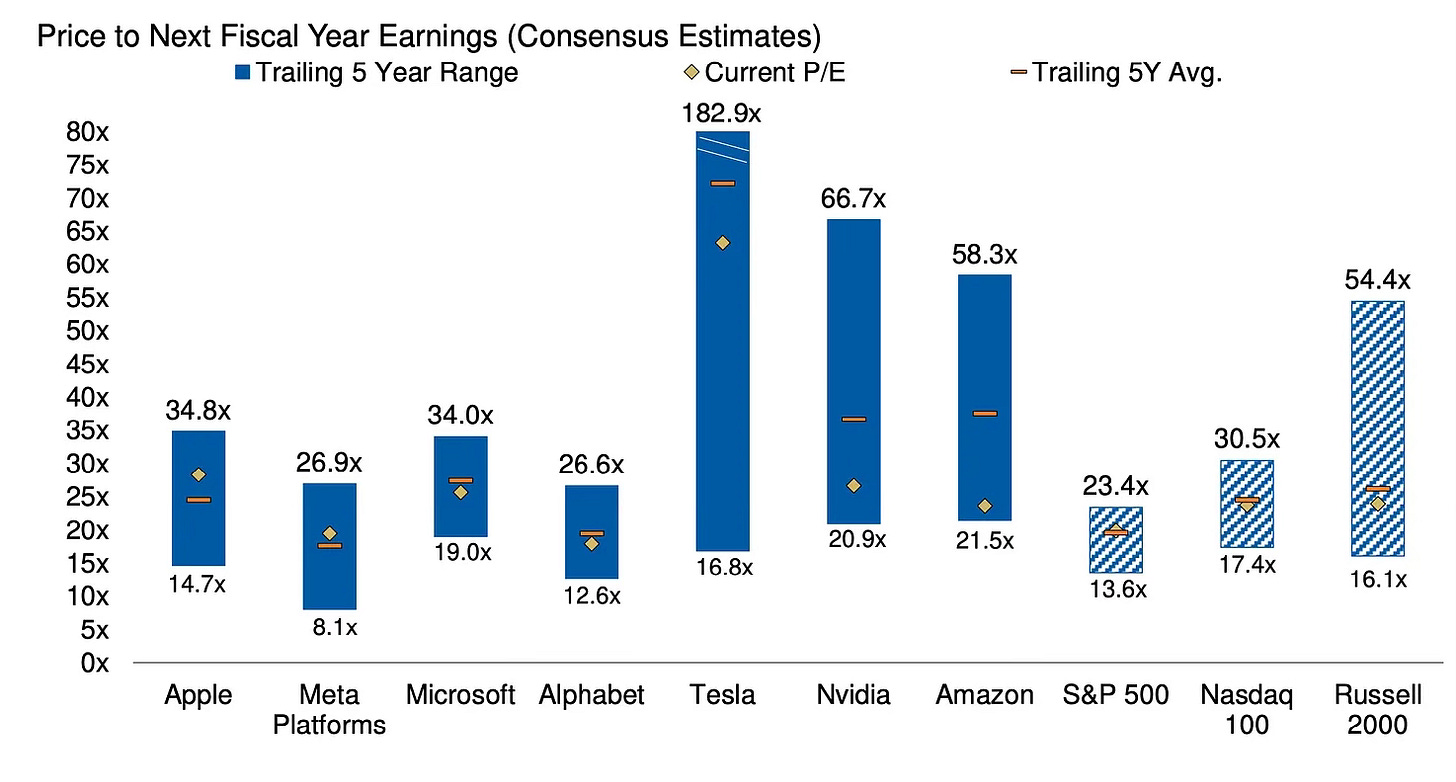
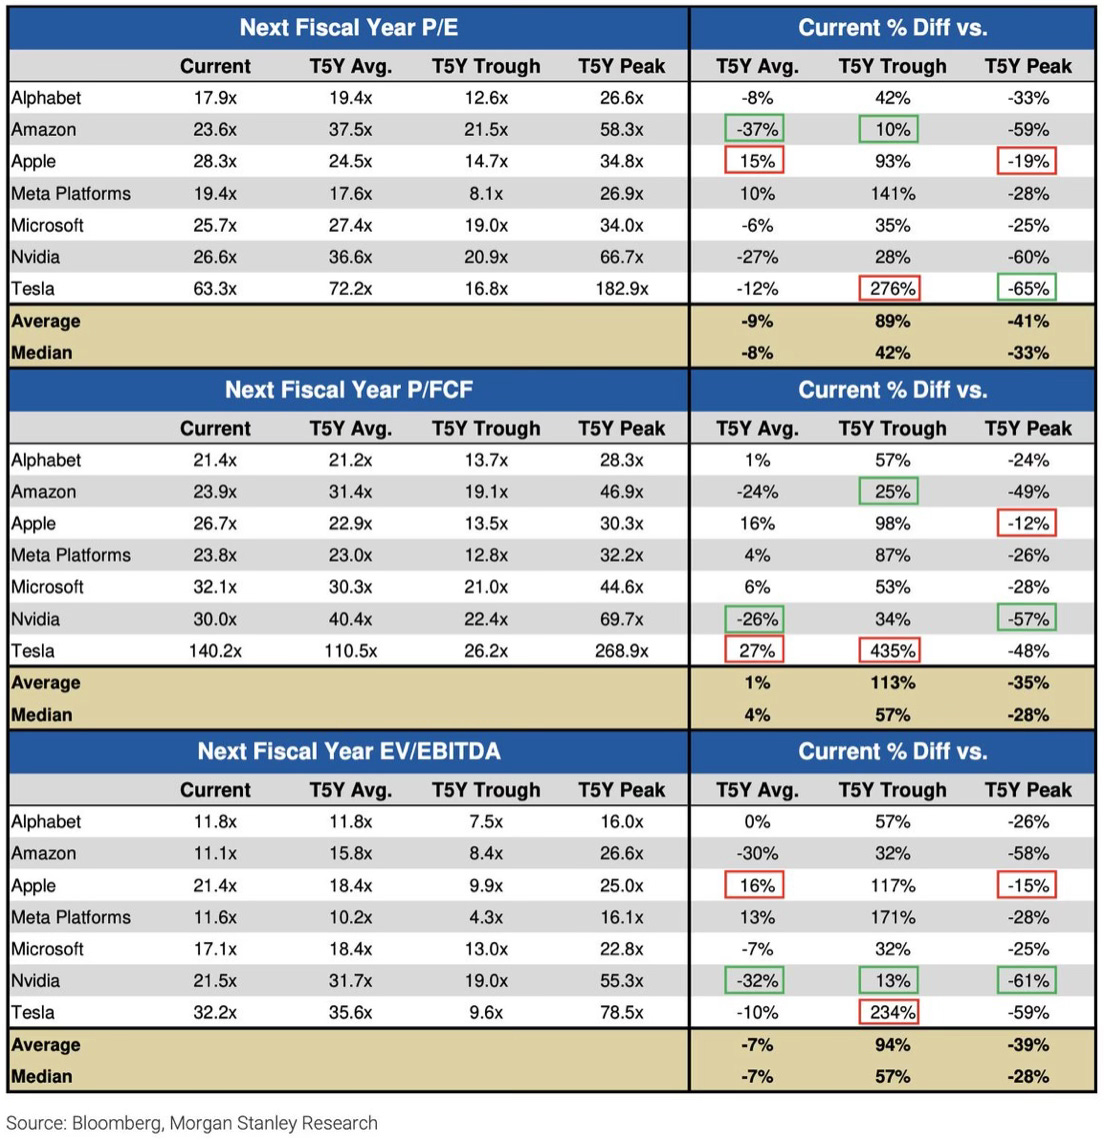
I’ve also added some more data on the Mag 7. Are they still a buy here at these levels? I’m still of the belief that these stocks are not done going up.
The valuations have gone down. They’re still not at all cheap as the forward P/E is still above the 10 year median.
These next two charts dig into each of their valuations. I still think you can make a case for all 7 of these stocks as long term buys here. I mean looking back there hasn’t been a recent time where they really haven’t been a good buy.
Upcoming Earnings & Data
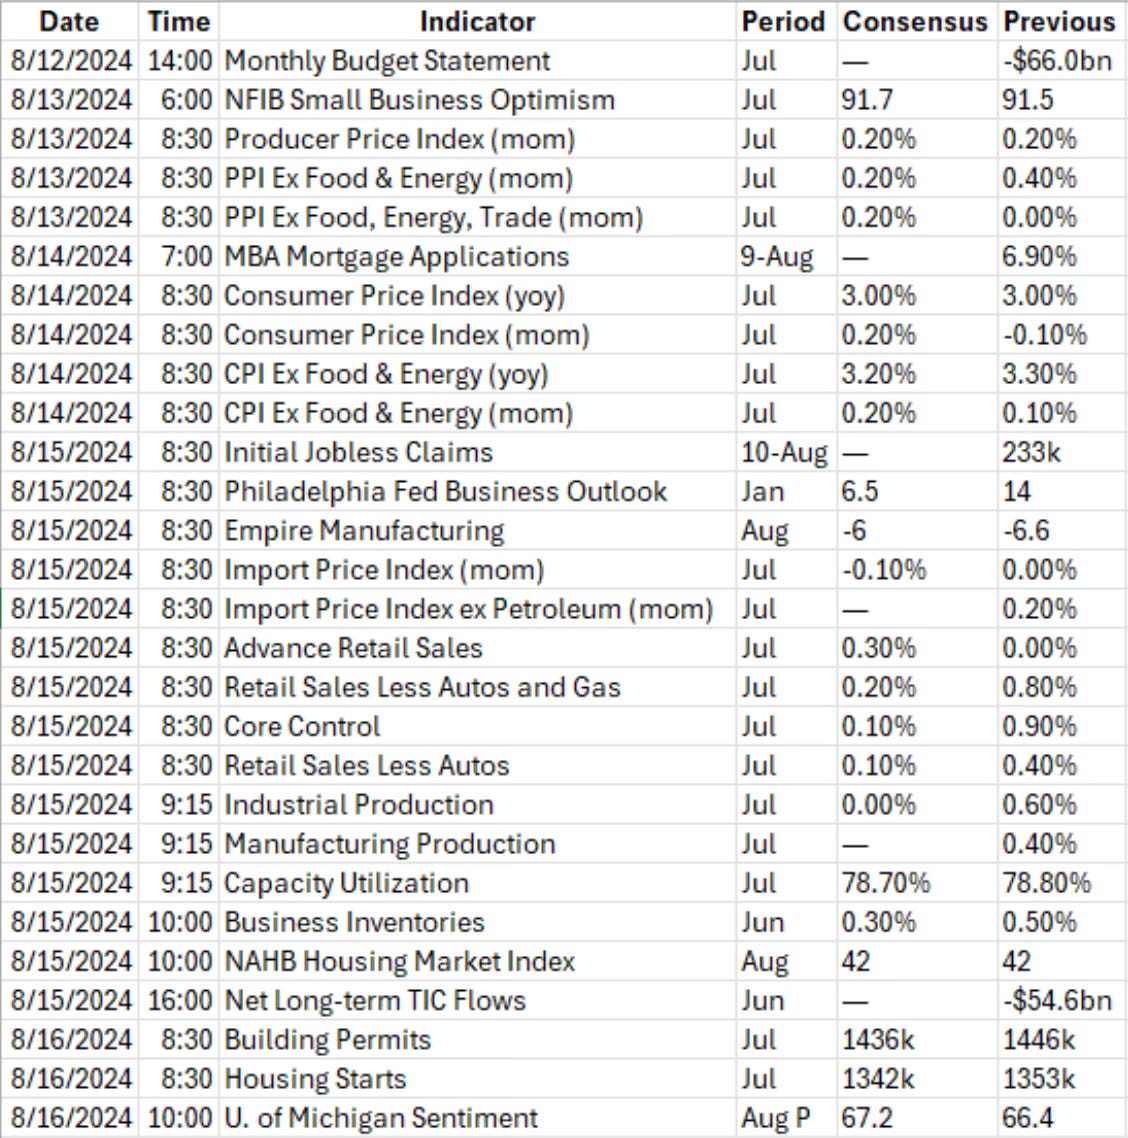
Only 9 S&P 500 companies report this week. I’m going to have a very close eye on what Home Depot, Walmart and John Deere have to say about the consumer.

The Coffee Table ☕
I enjoy reading and hearing Joe Fahmy’s take on what’s happening in the markets. He breaks things down which may seem complex, but not when he explains them. Why Sentiment Changes So Quickly is another piece by him worth reading. He helps makes sense why sentiment shifts so quickly now compared to years ago.
Bankeronwheels had a timely post called How Much Equity Risk Should You Take? There are a number of good points in this piece. If you were someone who was really worried earlier this week, then you may have to reevaluate your risk appetite.
Michael Antonelli wrote a great reminder of a post called What Gets Attention is Rarely Valuable. This is always forgotten when headlines start to spook investors. It happens time and time again. Another very sensible read from Michael.
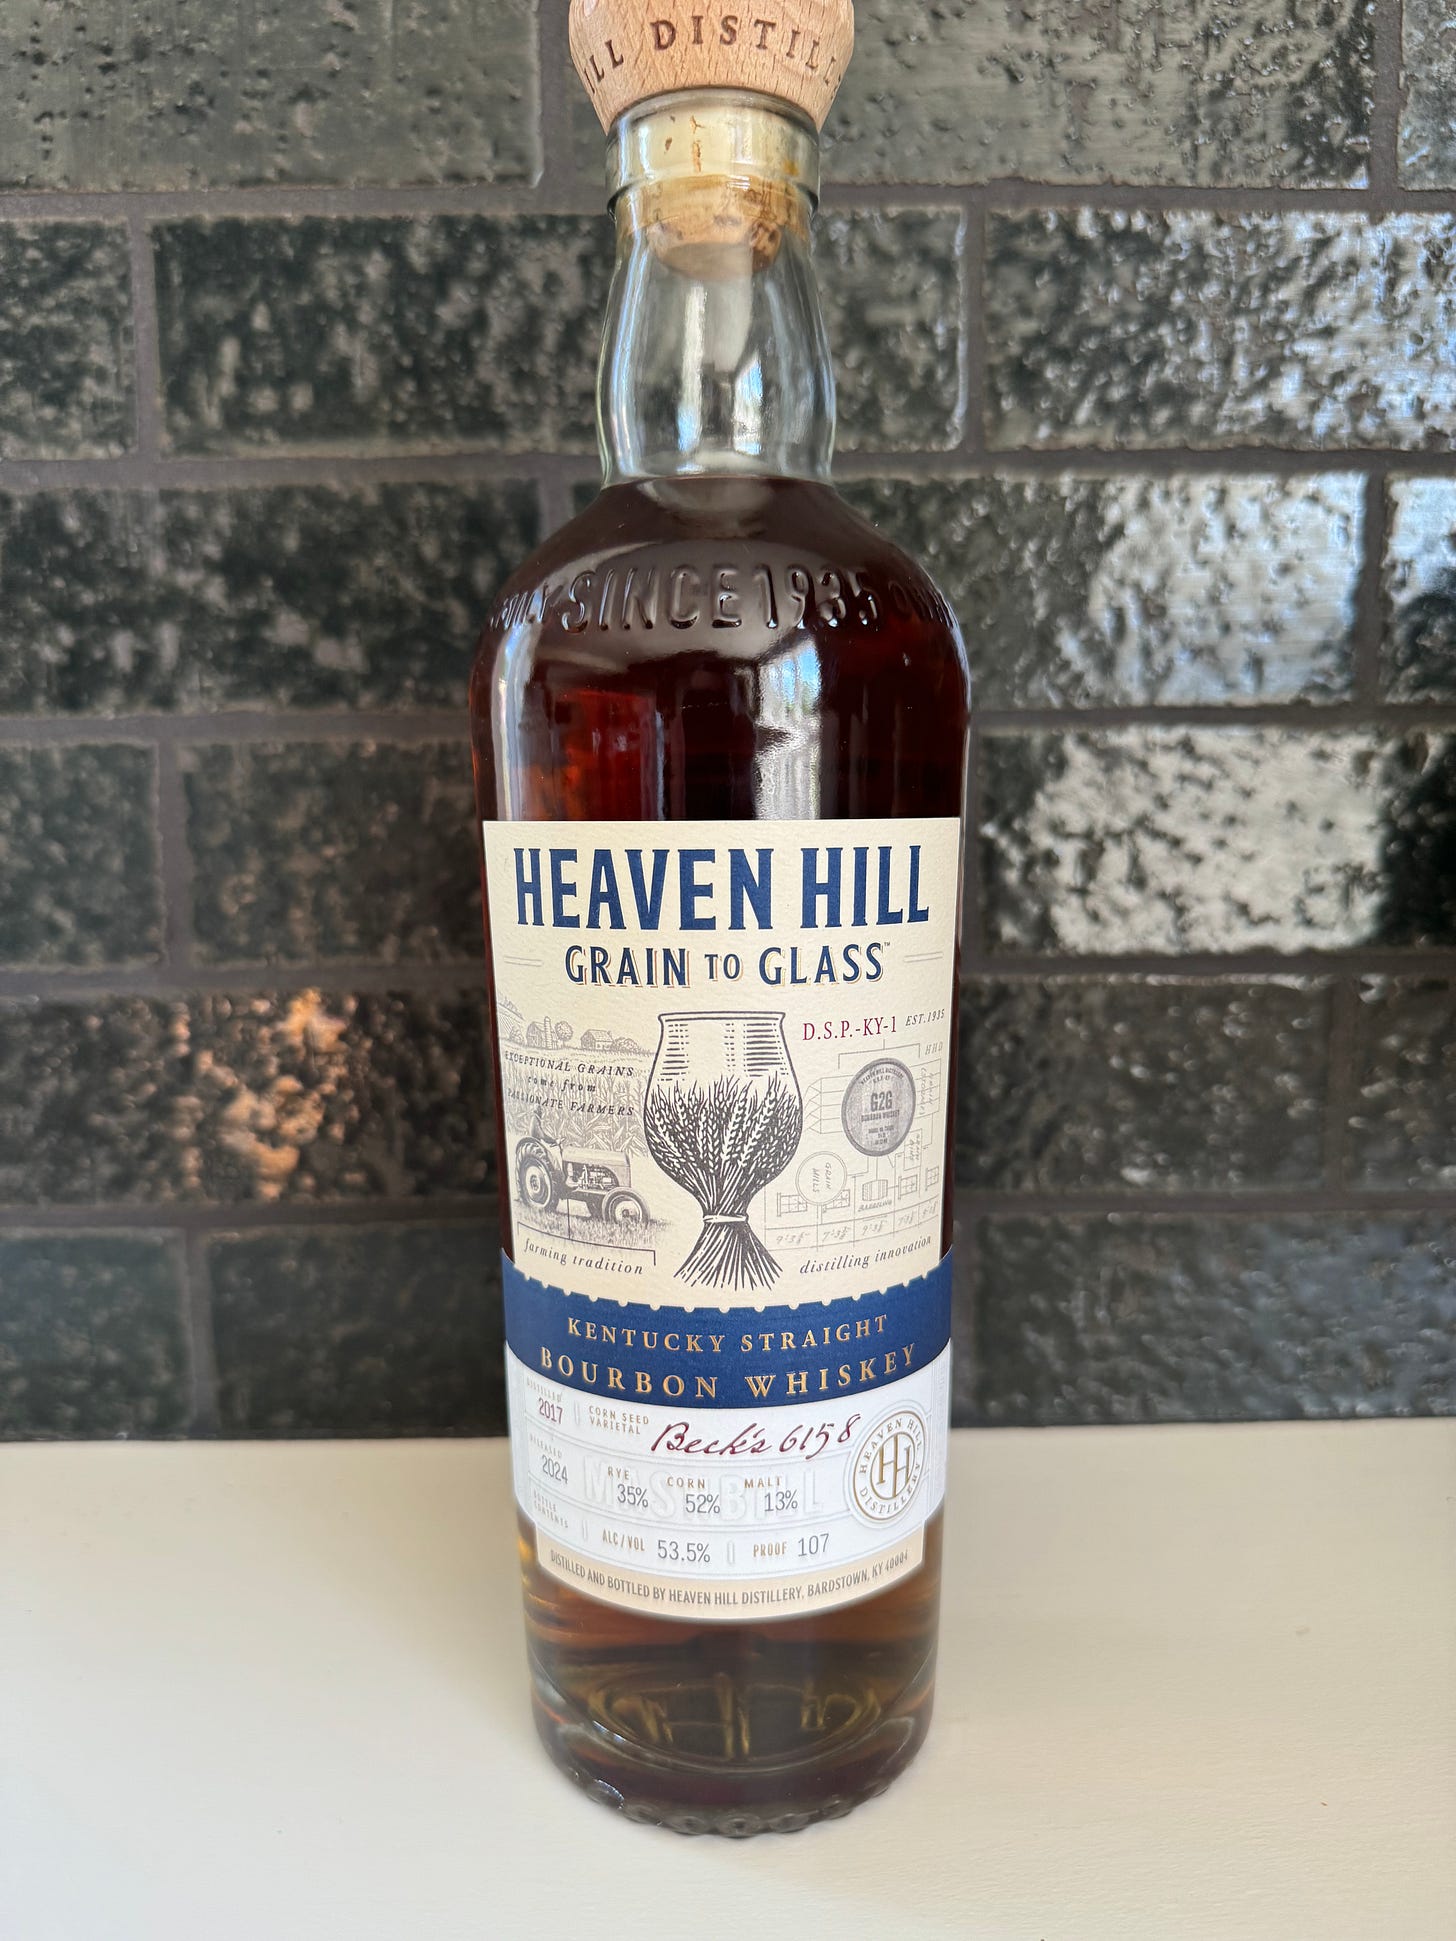
I was able to get a bottle of the newly released Heaven Hill Grain To Glass. I’m a fan of Heaven Hill and was excited to get this. It didn’t disappoint. To smell it came across fruity with a lot of apple and oak. To taste much of the same came through. Very fruity, apple, cinnamon and spice. Almost kind of an applesauce character with some honey and hints of oak to finish. It’s very enjoyable with quite a different profile. My favorite newly released bourbon so far in 2024.
Thank you for reading! If you enjoyed Spilled Coffee, please subscribe.
Spilled Coffee grows through word of mouth. Please consider sharing this post with someone who might appreciate it.


