
Investing Update: Is Momentum Weakening?
What I'm buying, selling & watching
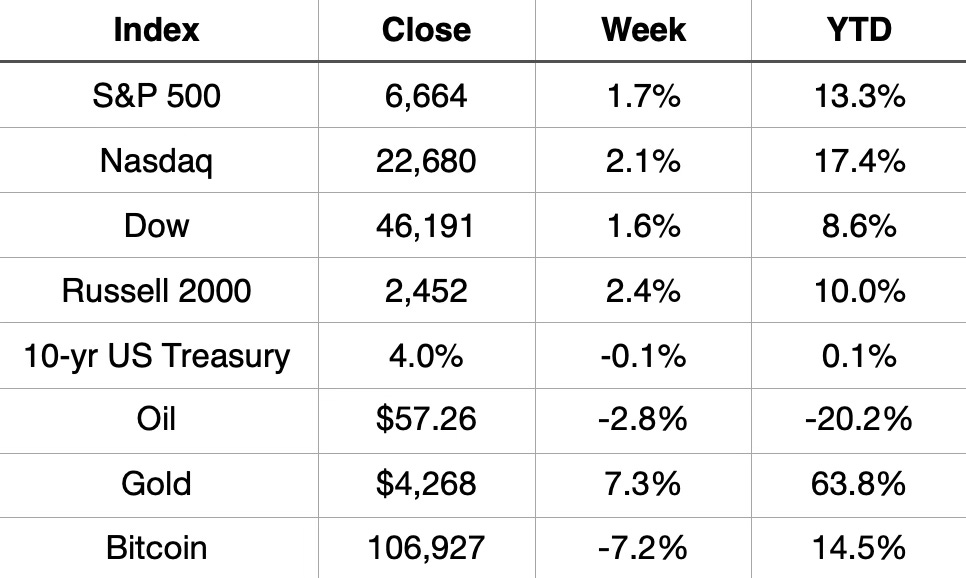
Wall Street bounced back this week, finishing higher across all major indices. It capped off a volatile stretch of trading as U.S.–China trade negotiations continued and renewed concerns over bad loans at regional banks resurfaced.
The Russell 2000 led the way this week, gaining 2.4%, followed by the Nasdaq up 2.1%, the S&P 500 up 1.7%, and the Dow up 1.6%.
Market Recap
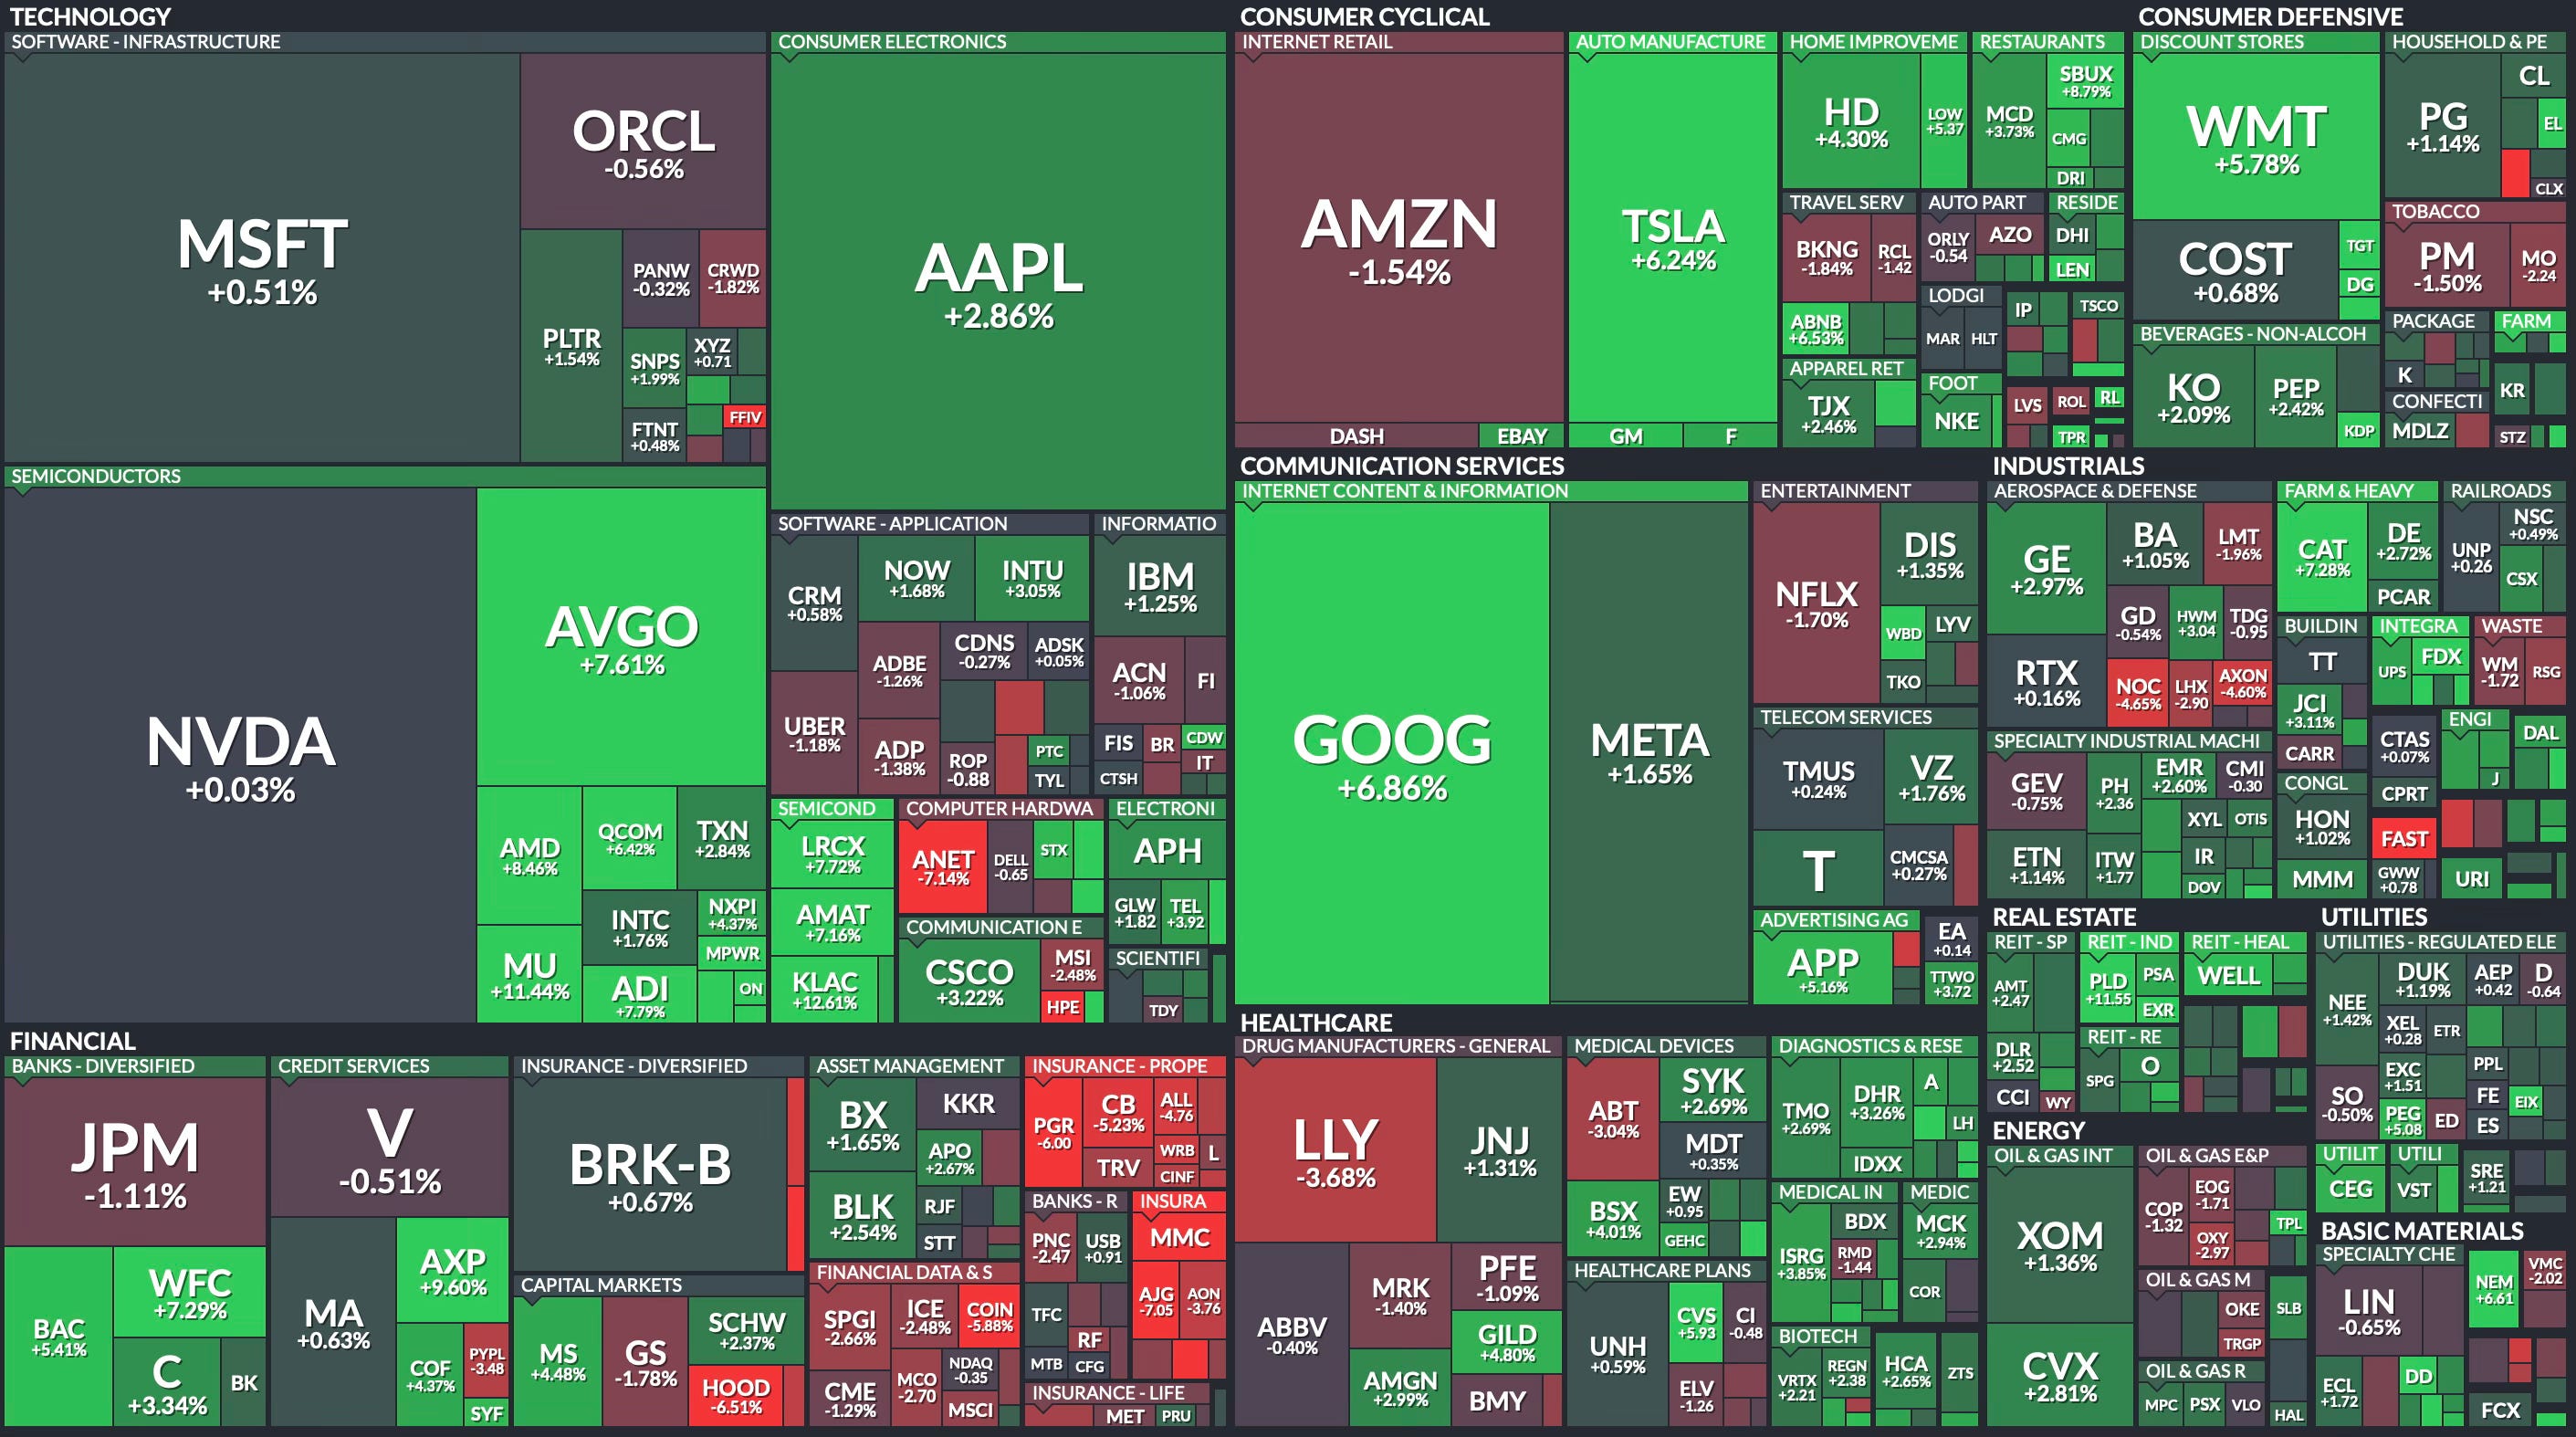
Weekly Heat Map Of Stocks
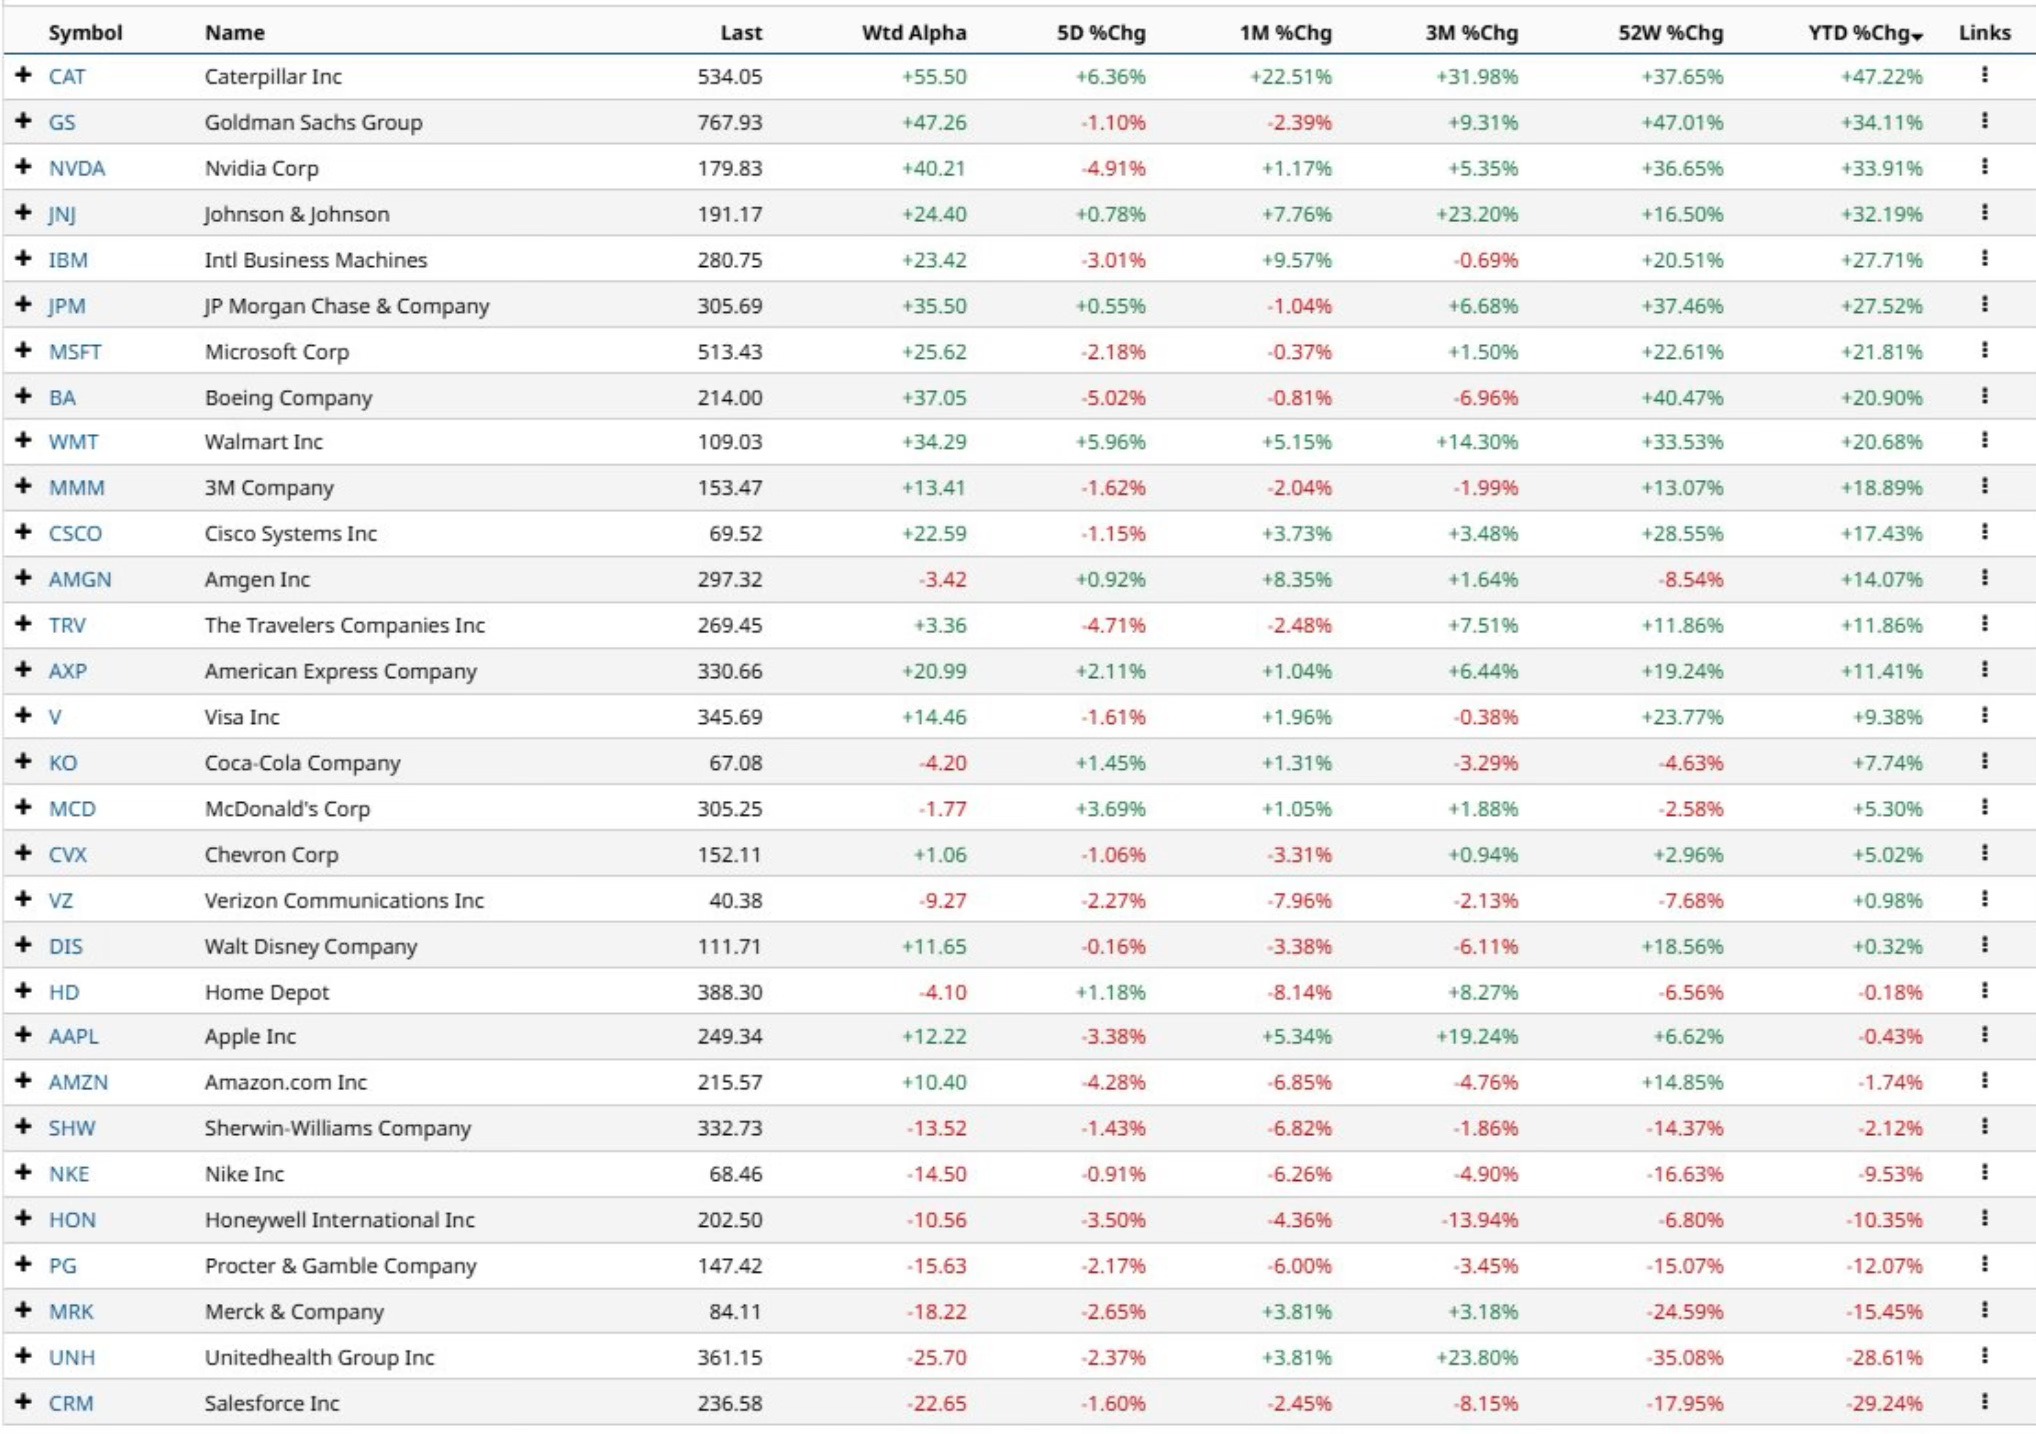
Dow Performance YTD
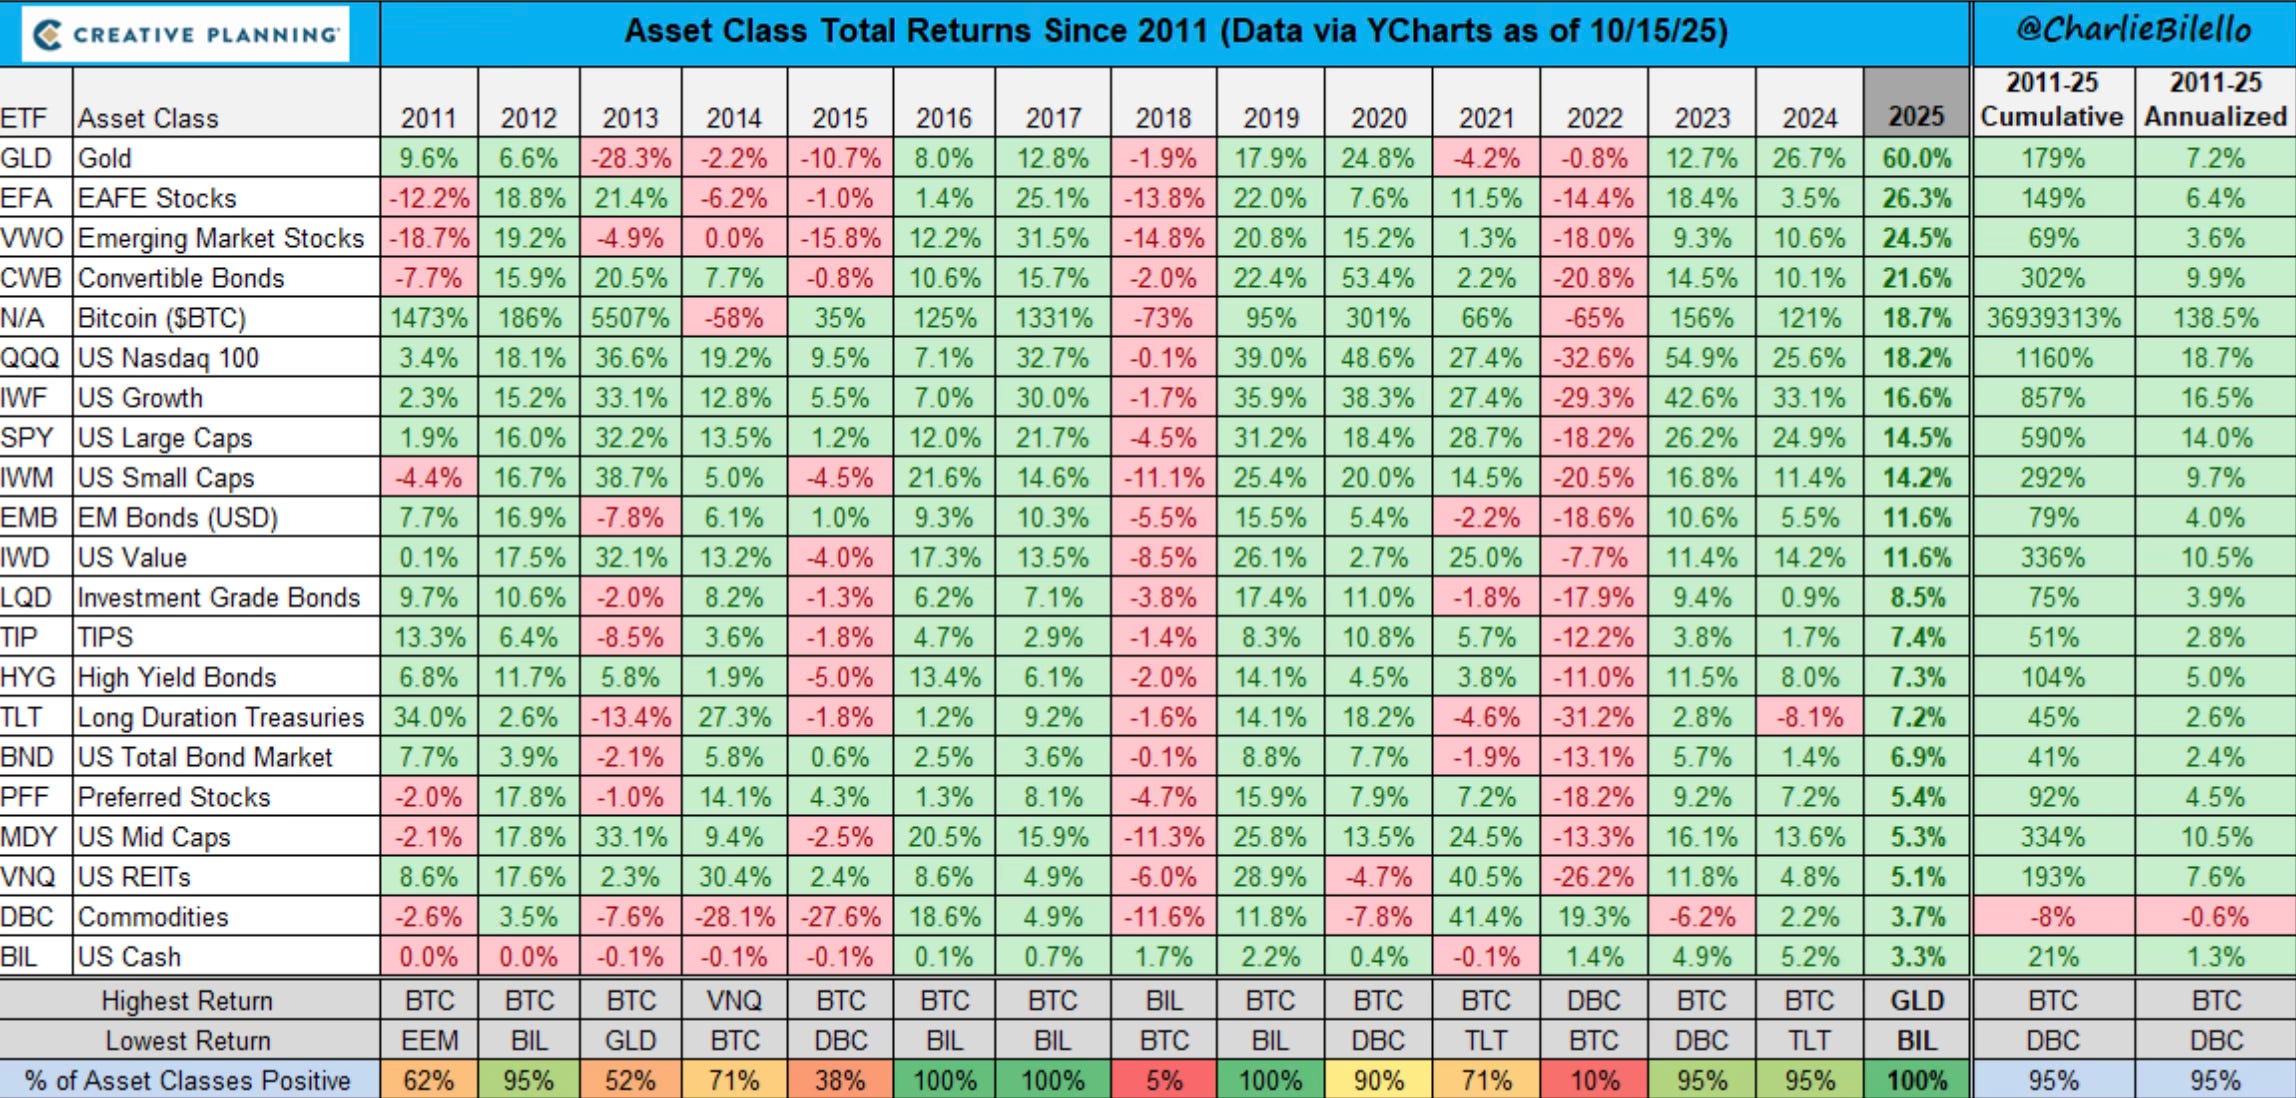
Asset Class Returns
The theme of 2025 is green. Every major assets class is green so far and that hasn’t happened in a year since 2019.
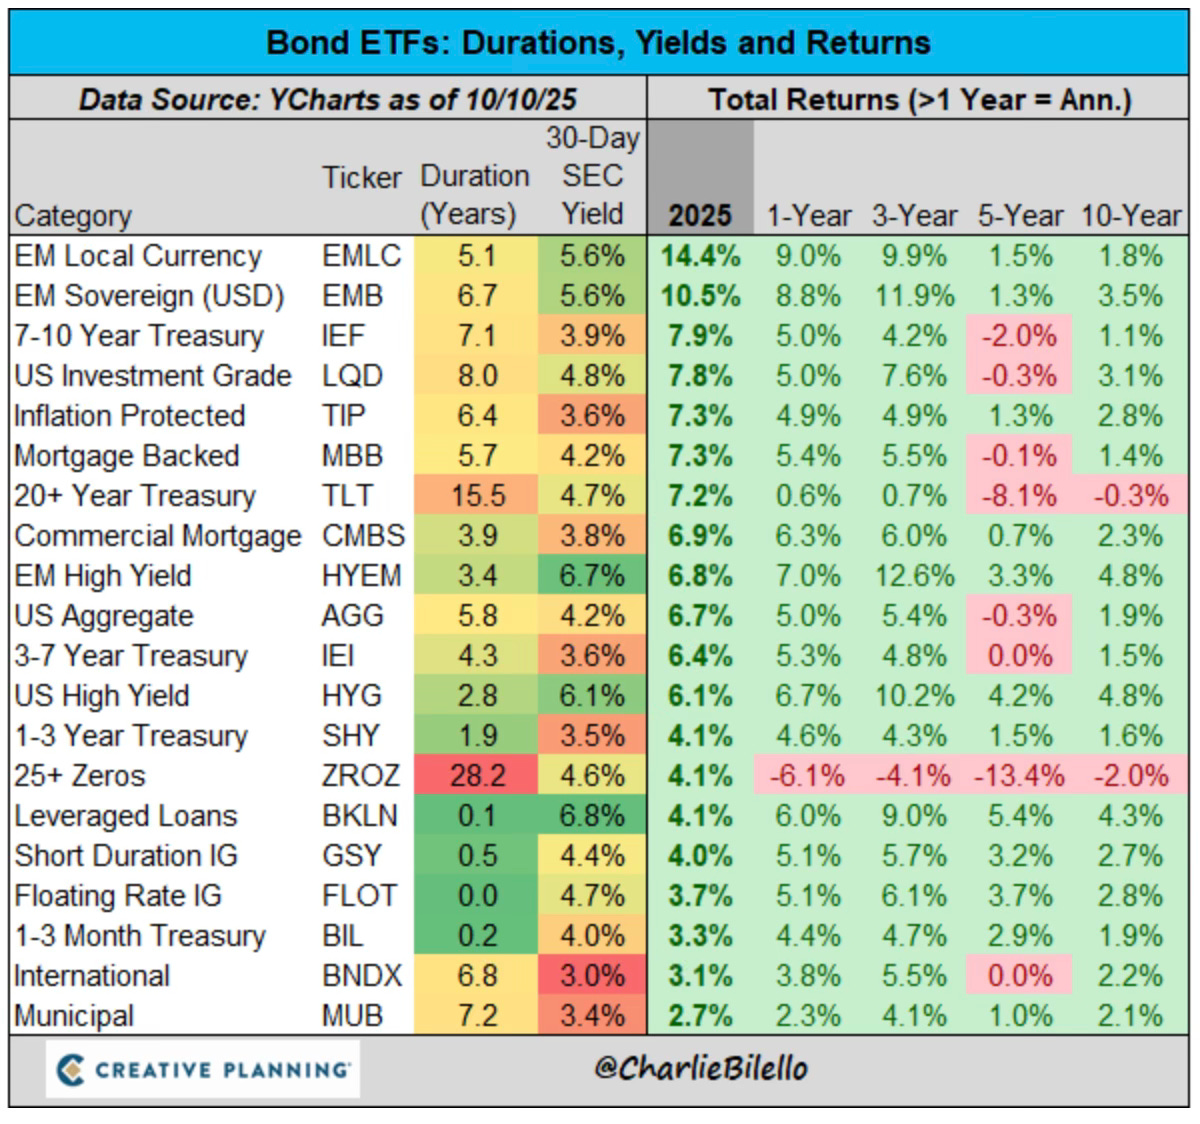
Bonds YTD
All the bond categories are now also positive YTD.
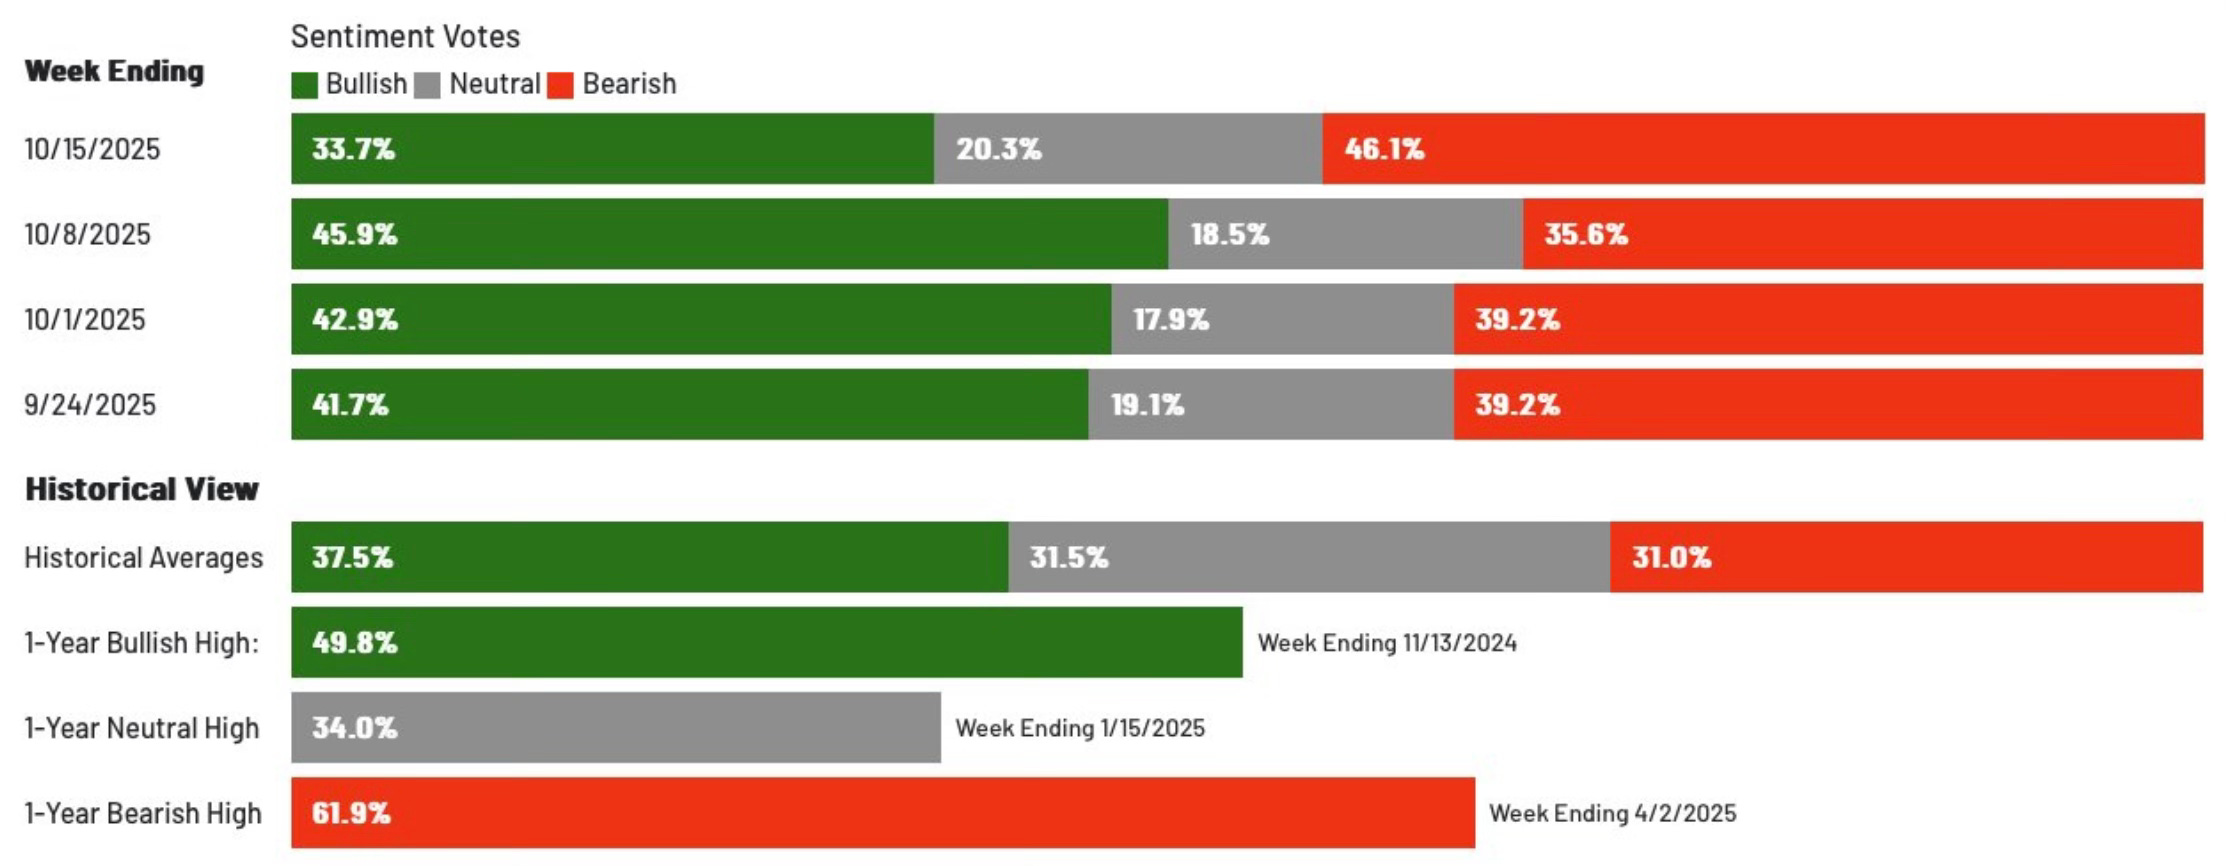
Last week I talked about how sentiment had flipped bullish after a long stretch of bearishness.
Well that didn’t last. The AAII Investor Sentiment Survey bears shot back up to 46.1% from 35.6% last week. The bulls flipped to 33.7% from 45.9% last6 week.
It may turn out to be a spooky late October of volatility.
Even with renewed volatility, it has been 100 days since the S&P 500 has had a 5% pullback. The average is 59 days. That shows just how smooth of a road the stock market has had over the past three months.
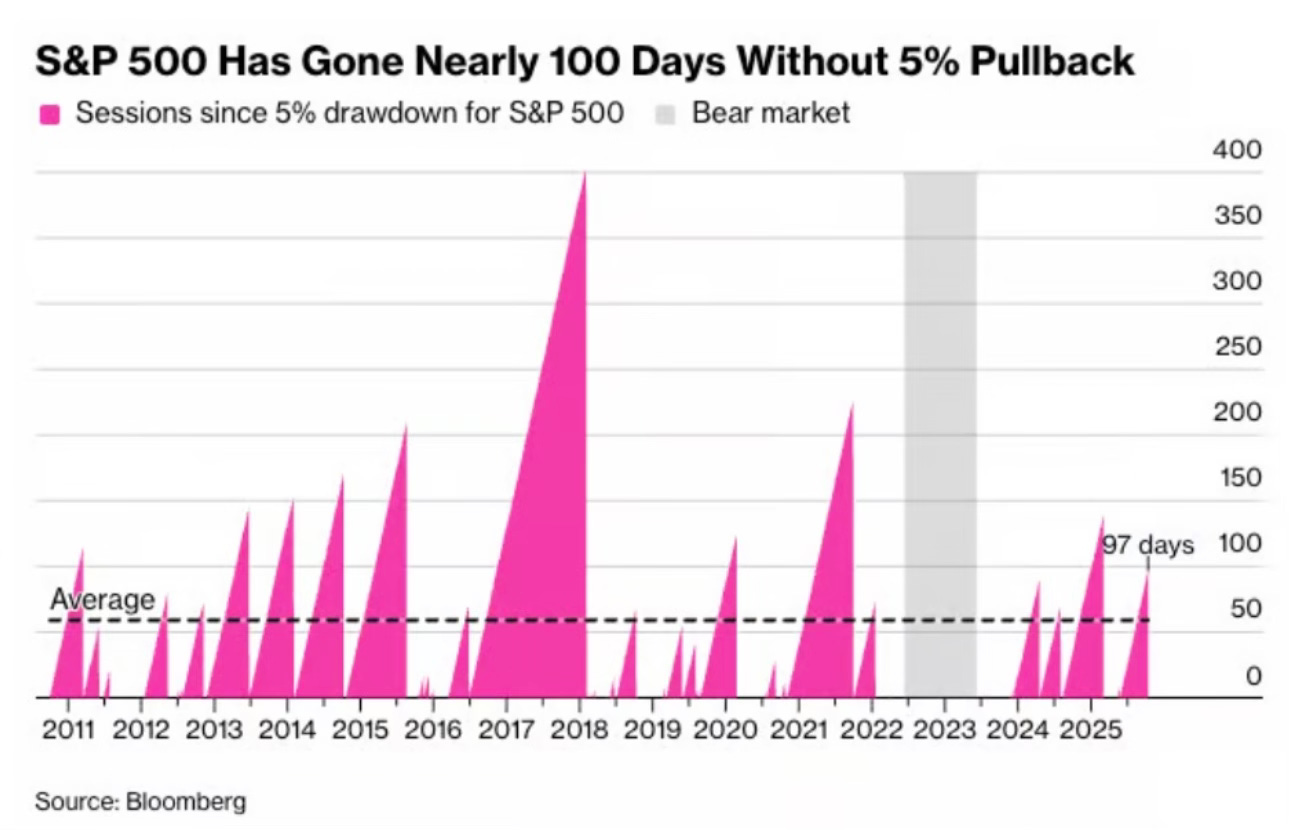
That’s what happens when you have the continued buying that we’ve been seeing.
Last week was the 5th largest single stock inflows in history.
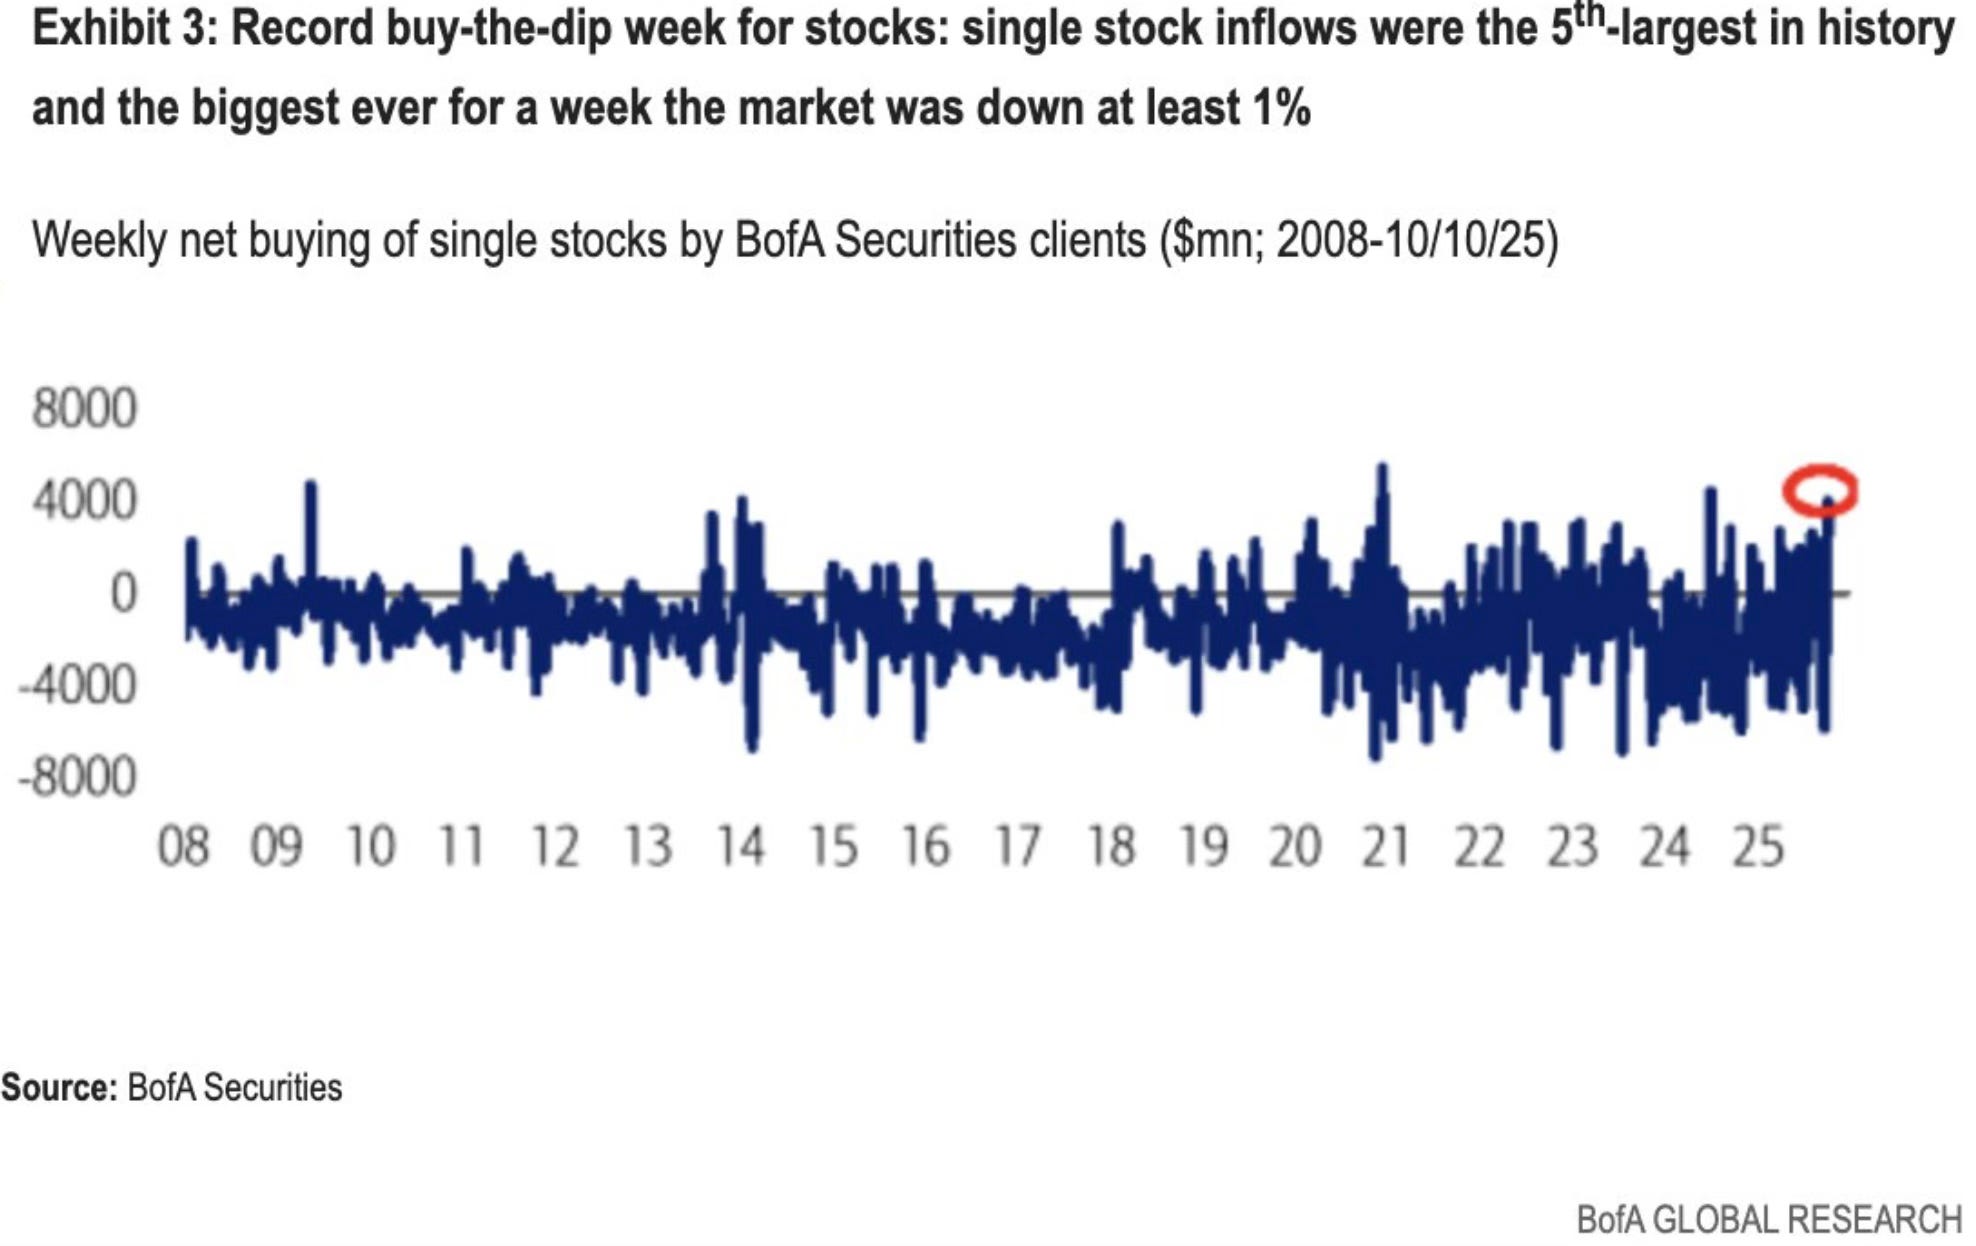
Then last Friday turned out to be the largest volume options day ever.
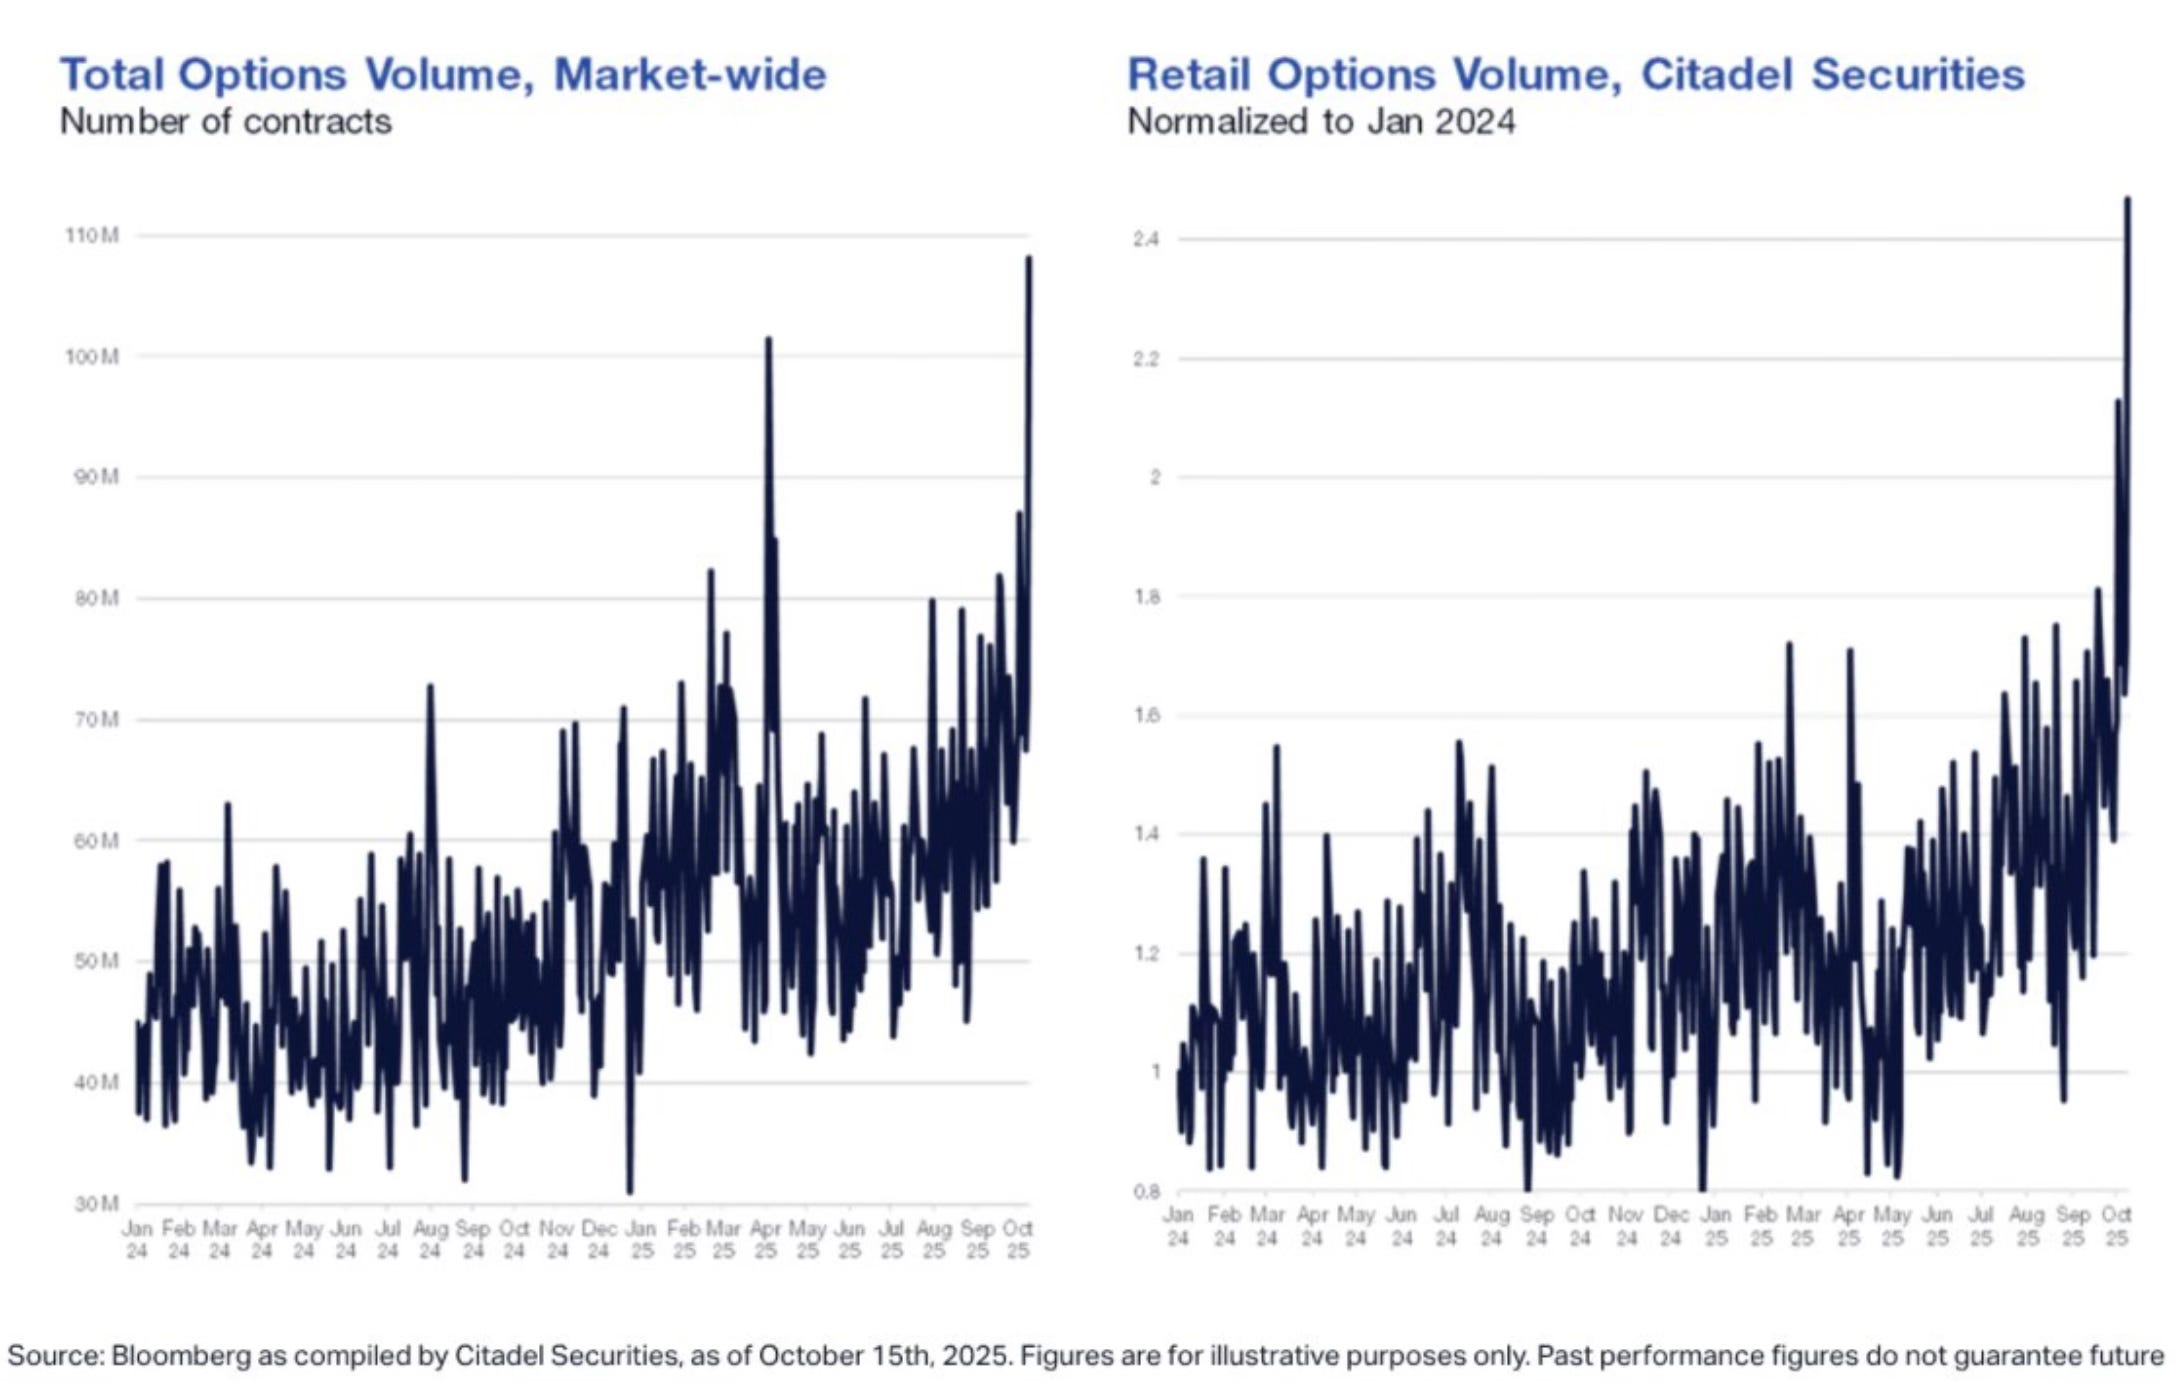
Any slight pullbacks are being bought and bought hard. As the market sells off, investors continue to step in and buy the dip.
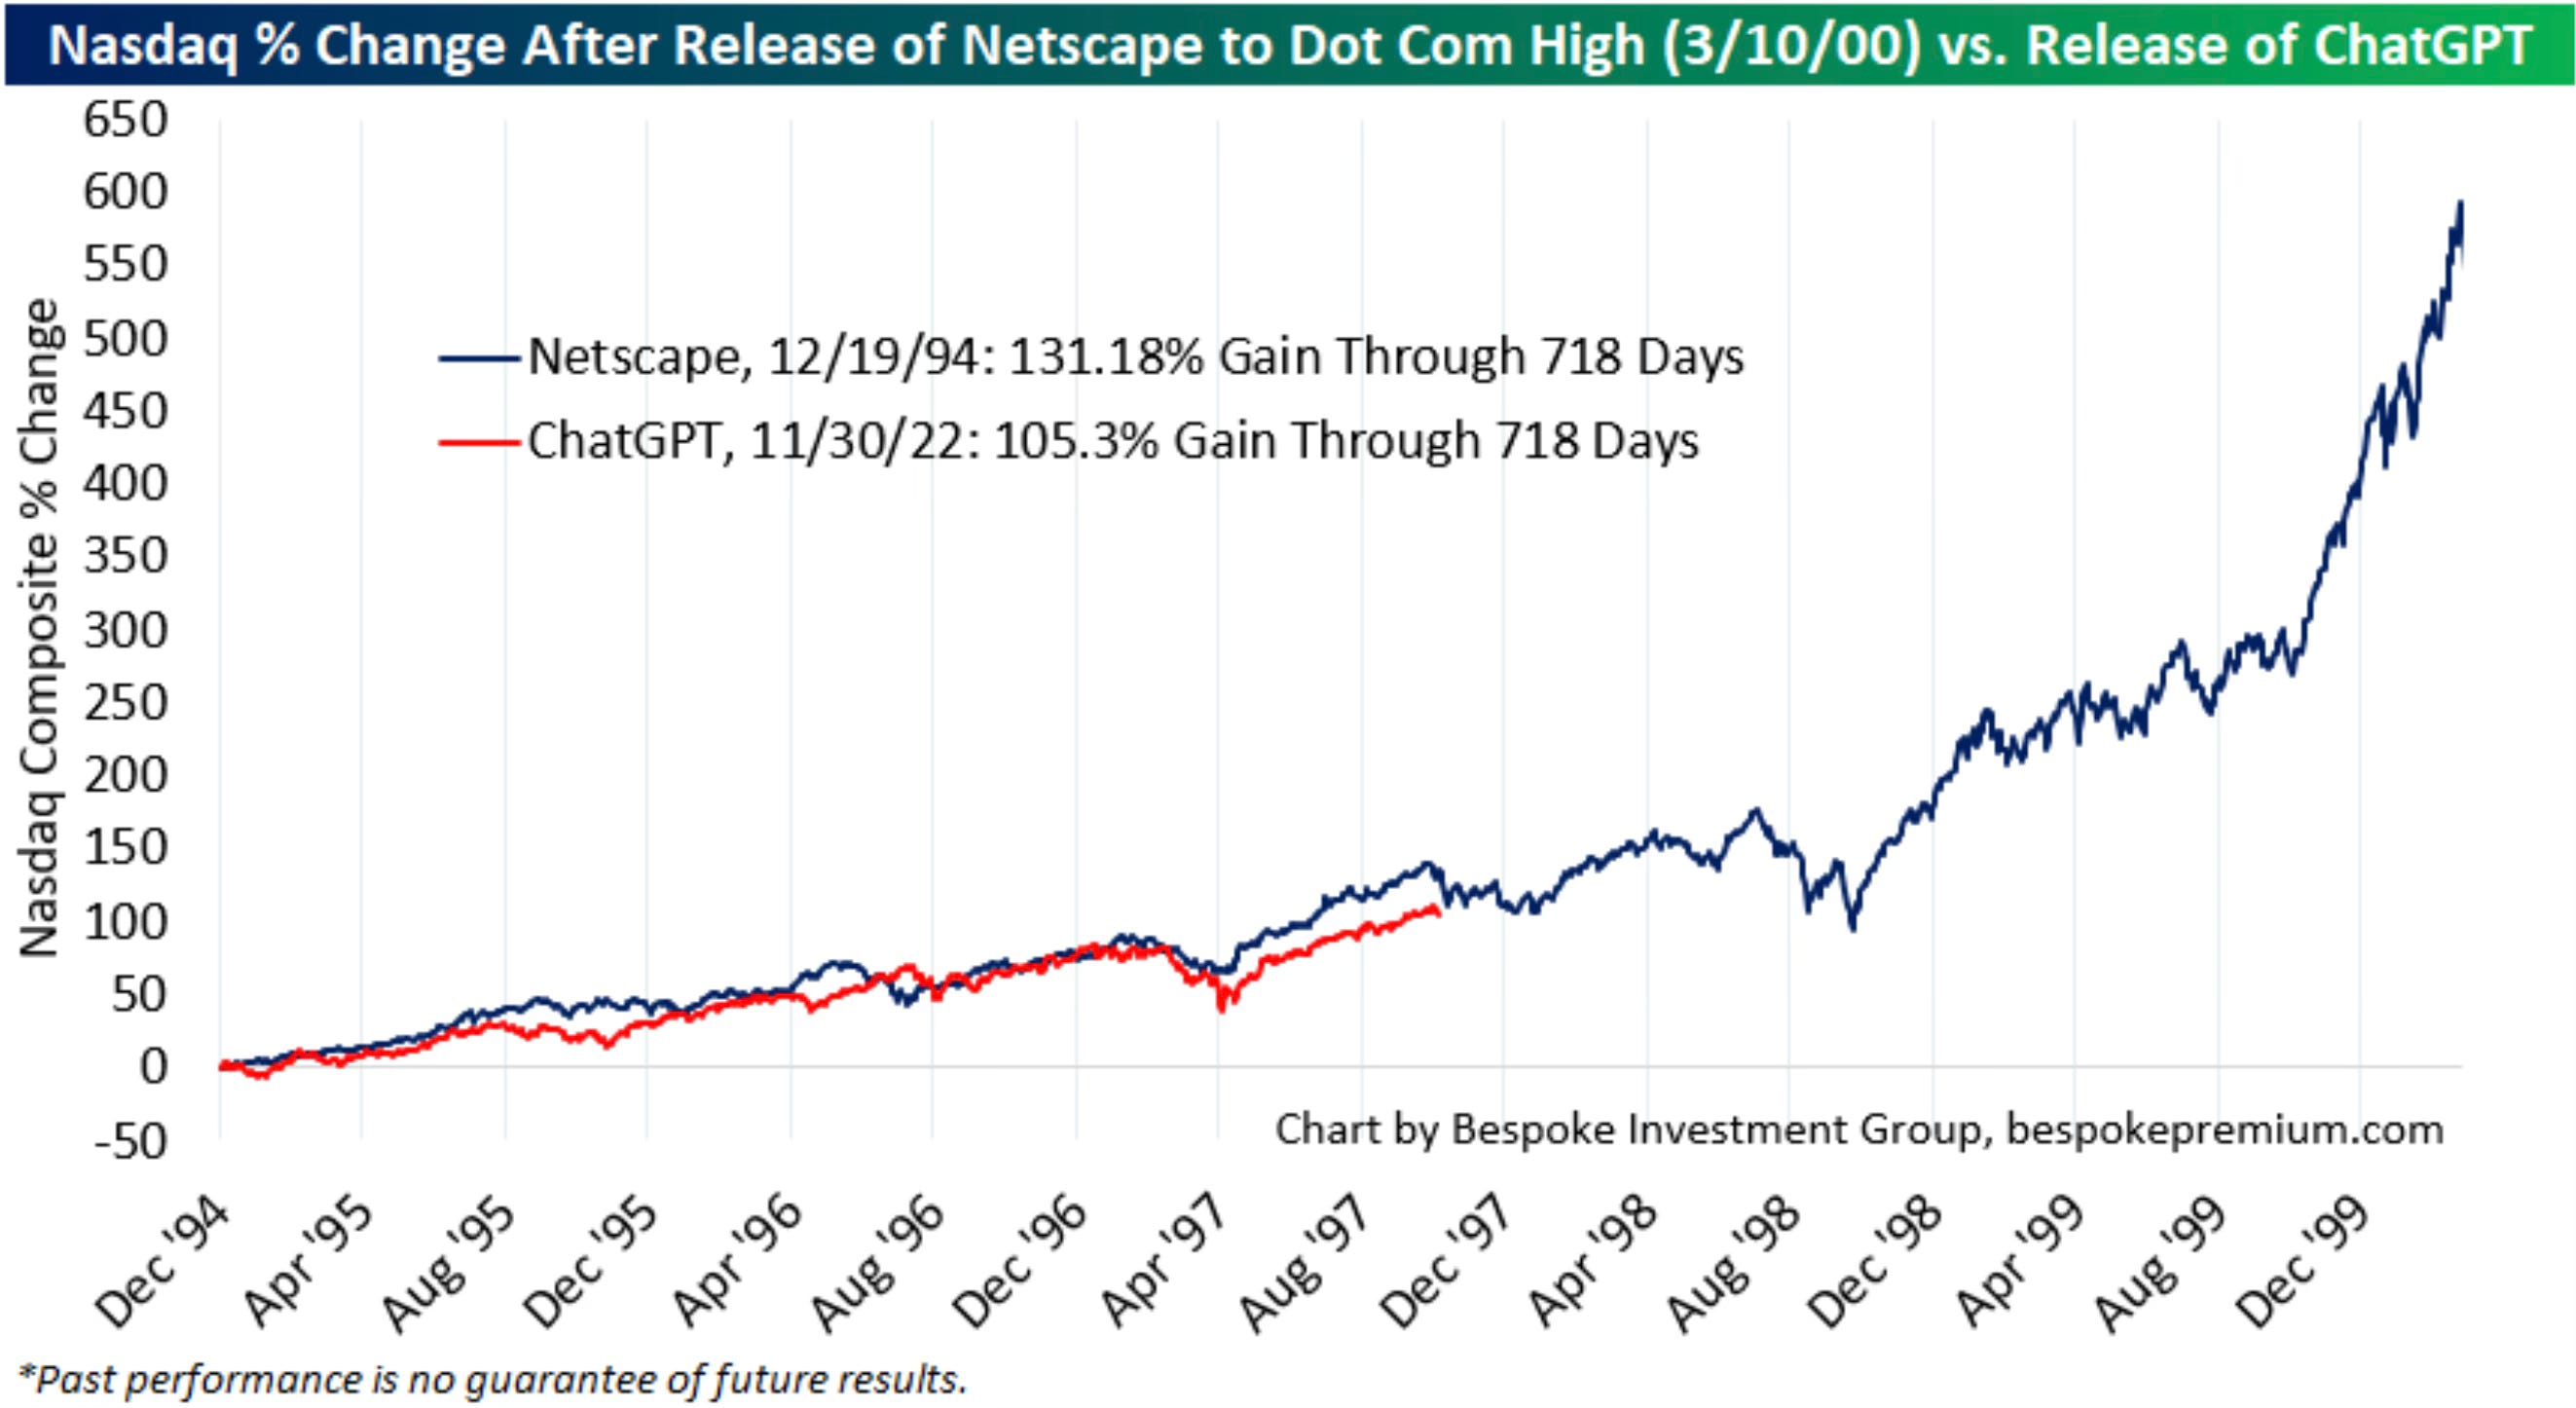
Netscape vs ChatGPT
I have to periodically check in to see if this wild chart that compares the release of Netscape during the dot-com frenzy to the release of ChatGPT. The Nasdaq is still tracking almost identically at this point through 718 days.
If this is indeed an AI bubble and it follows the dot-com bubble like it has so far, there is still another 2 to 3 years of gains still to come.
Is Momentum Weakening?
We just saw the S&P 500 close below its 20-day for the 6th consecutive day. It’s the first time this has happened since the April lows.
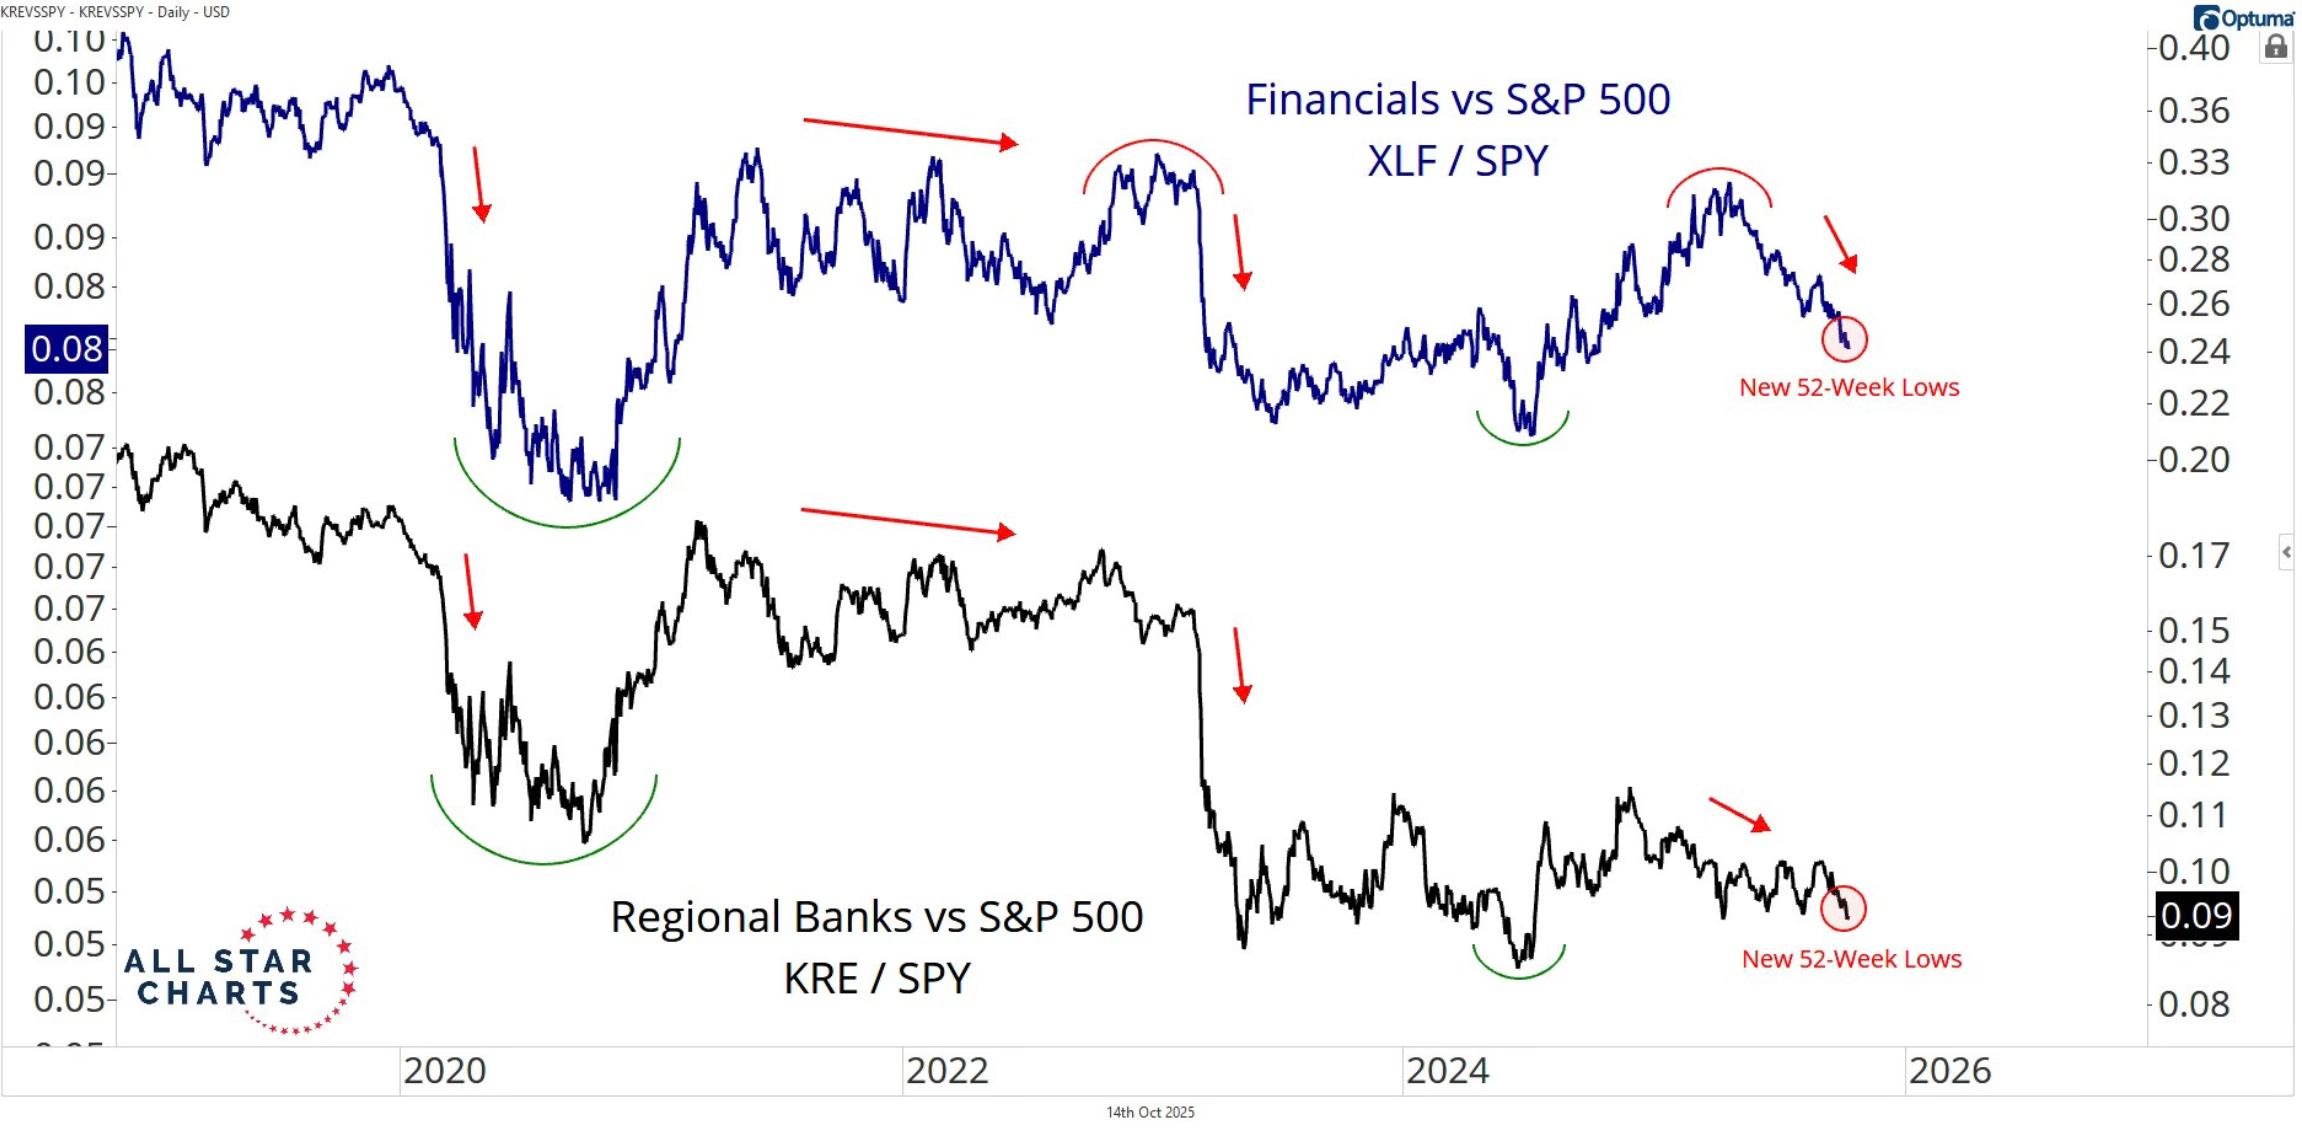
Regionals banks and financials just hit new 52-week lows relative to the S&P 500.
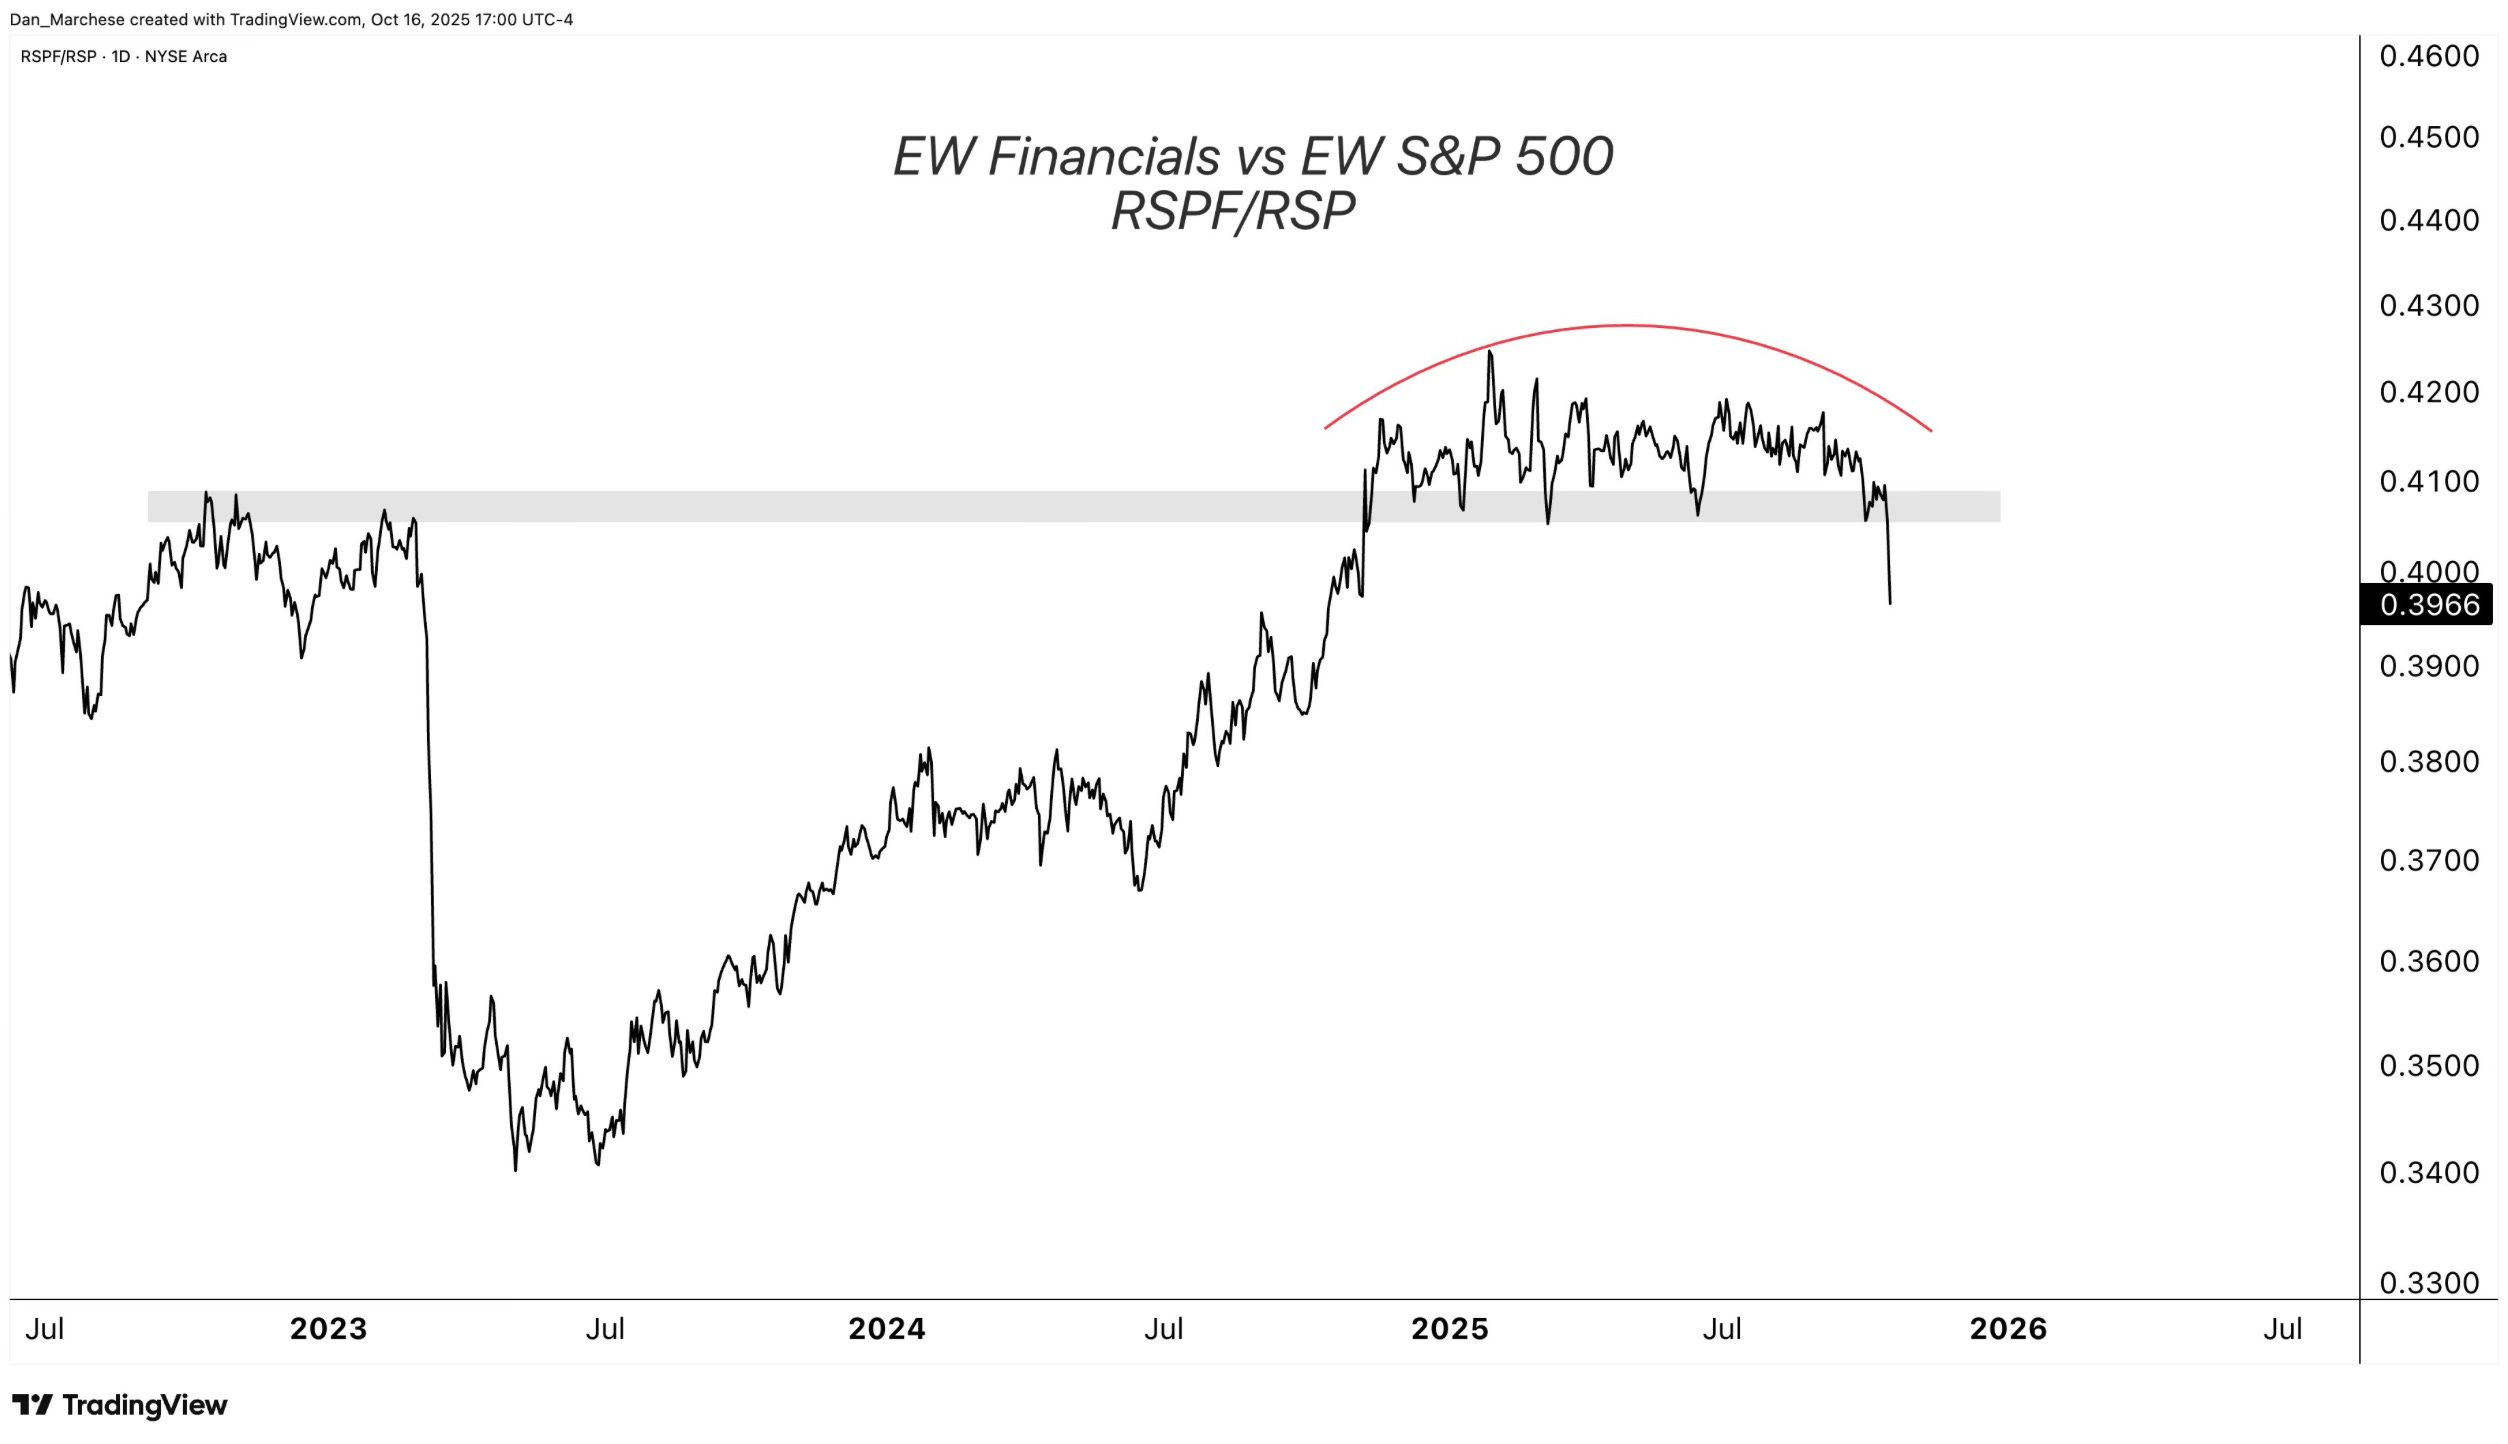
Are financials trying tell us something? Take a look at the equal weight financials vs the equal weight S&P 500.
You also have for the first time in five months, downtrends outnumber uptrends. 37.3% of S&P 500 stocks are now in downtrends.
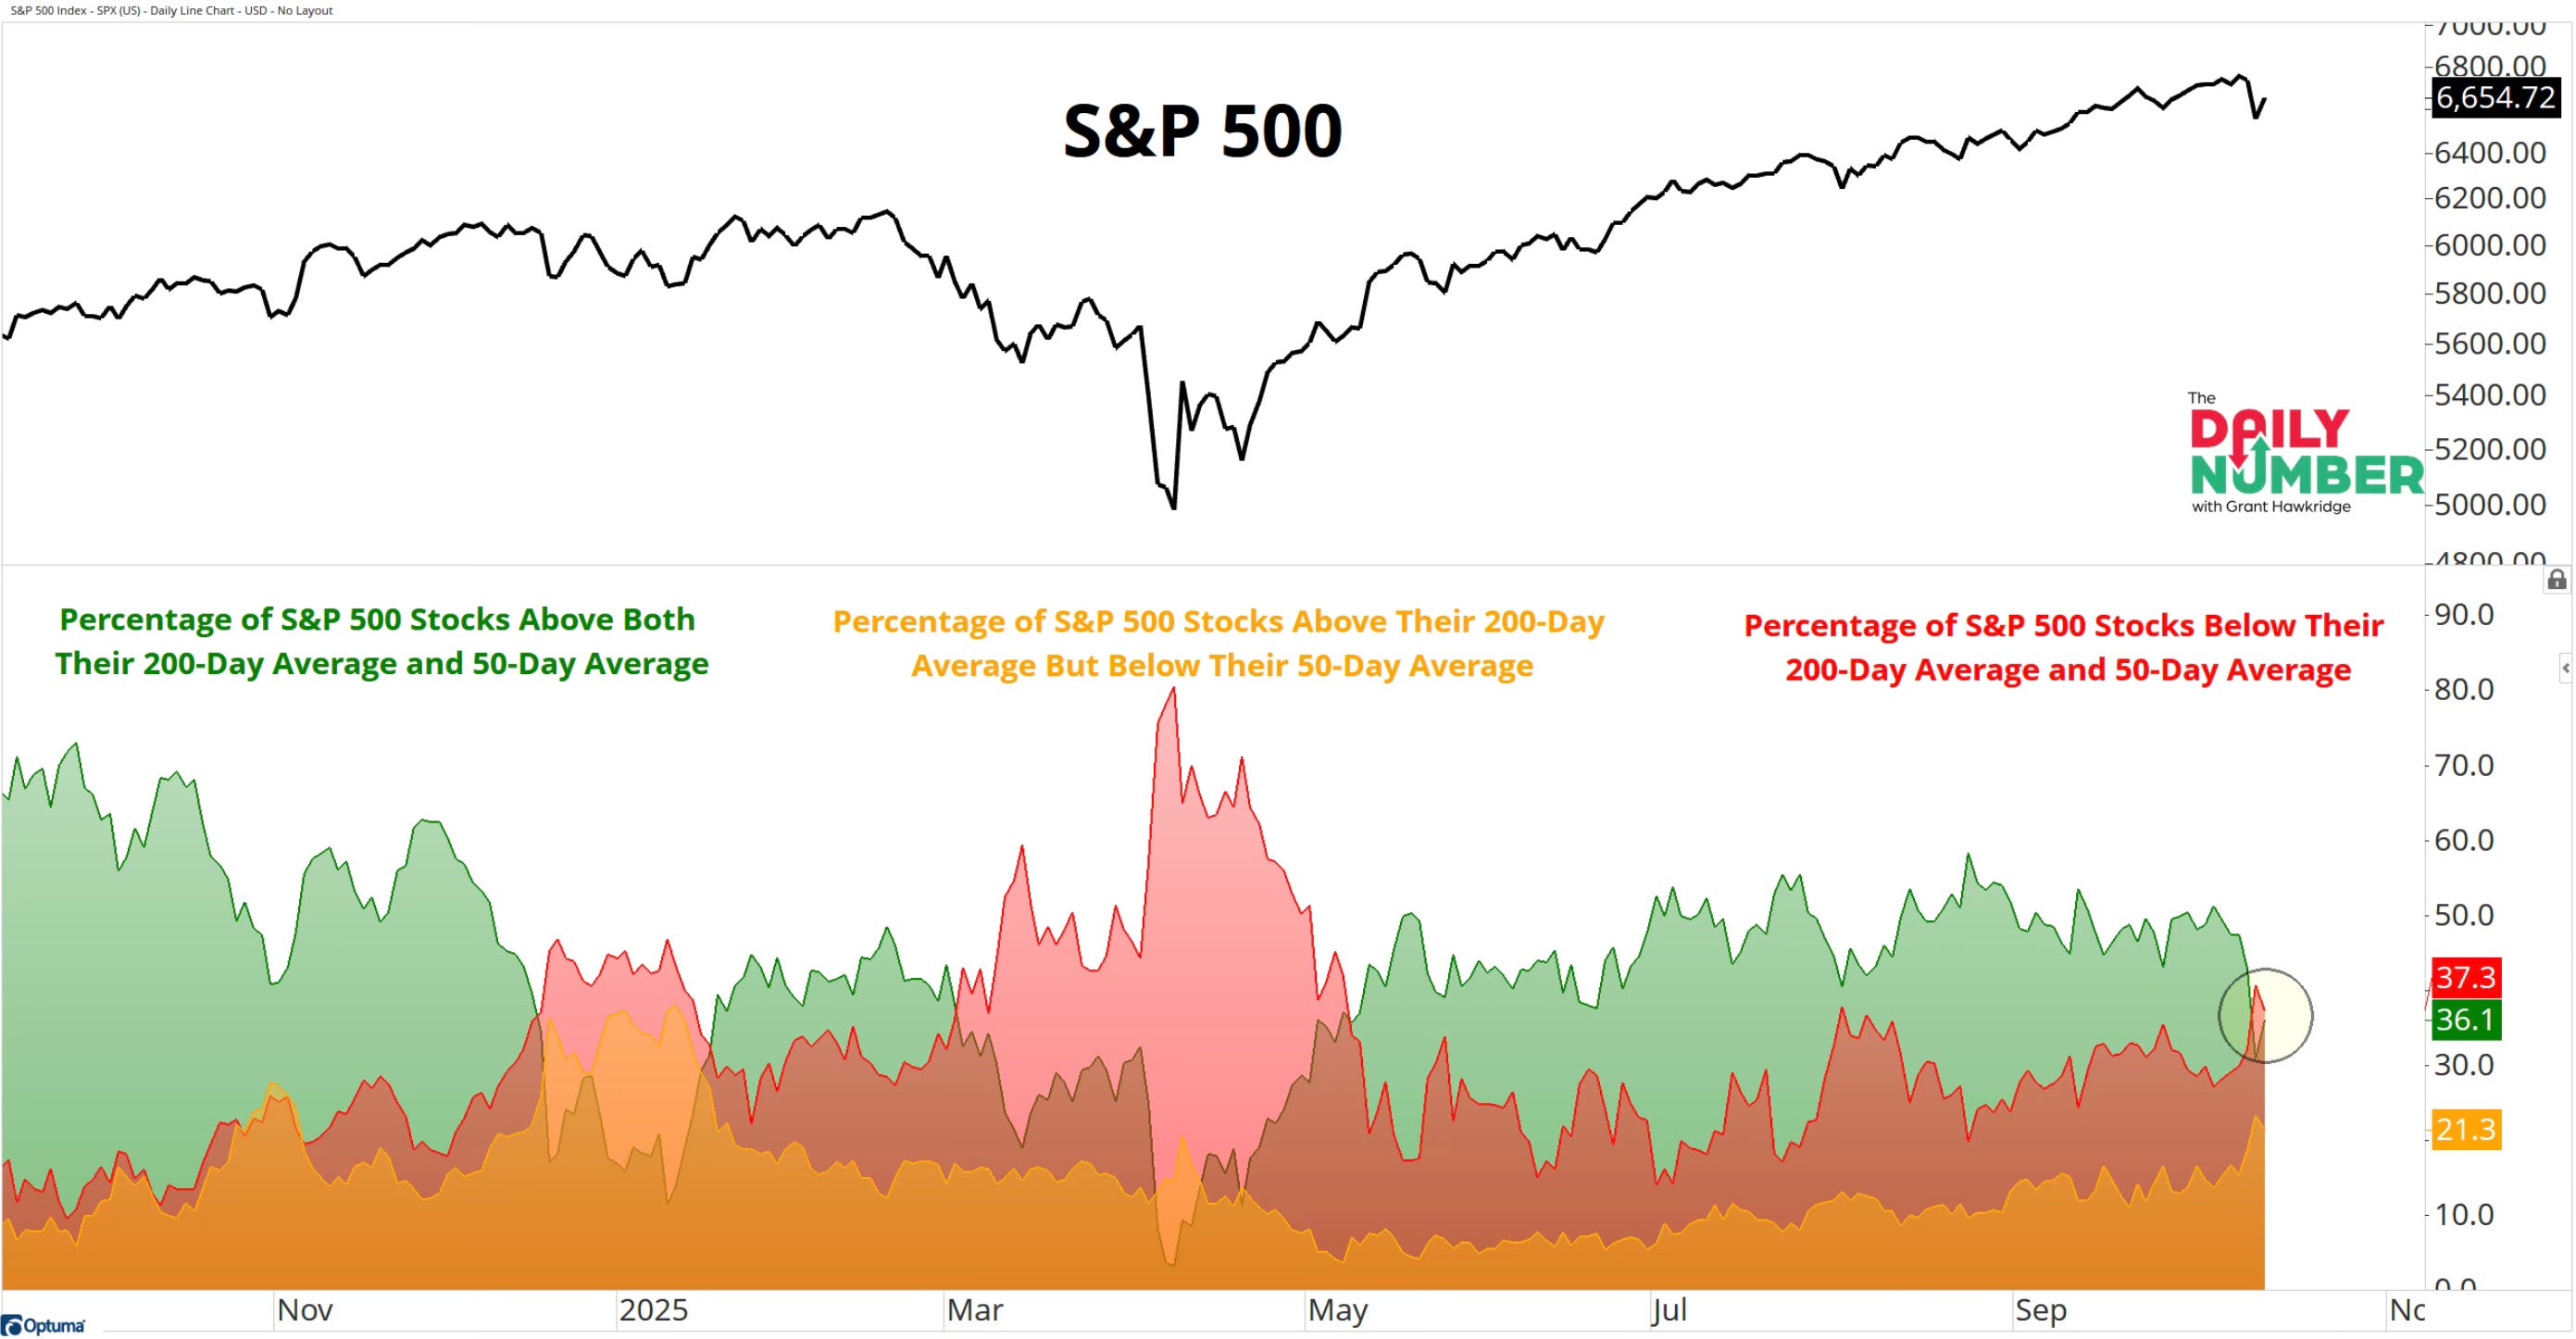
This isn’t what you see typically will see in a healthy bull market.