Investing Update: Is Inflation Reigniting?
What I'm buying, selling & watching
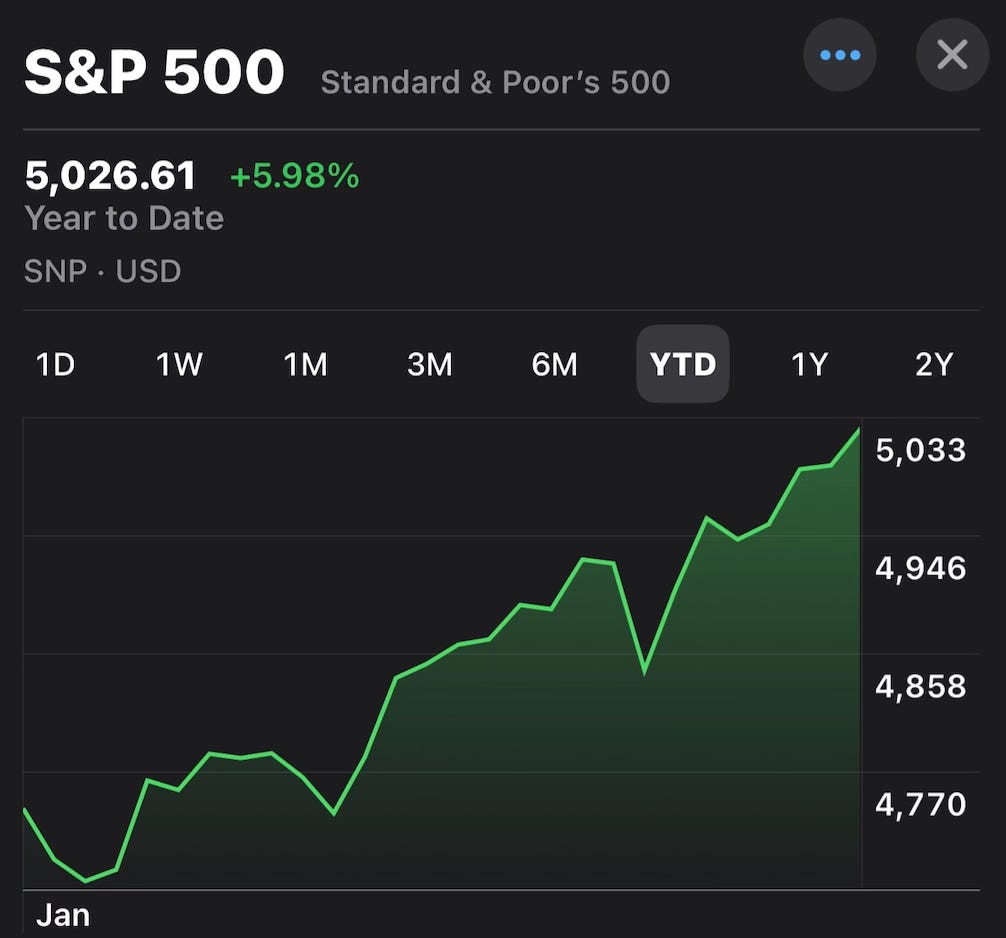
Last week was a week for the record books. The S&P 500 surpassed the 5,000 milestone level. Setting another new all-time record high.
The market has just been on fire lately. Just how on fire has the S&P 500 been?
14 of the past 15 weeks have been positive
Gains of 1% or more for 5 weeks in a row
Over 7% gains in 5 weeks.
Over 20% gains in 15 weeks
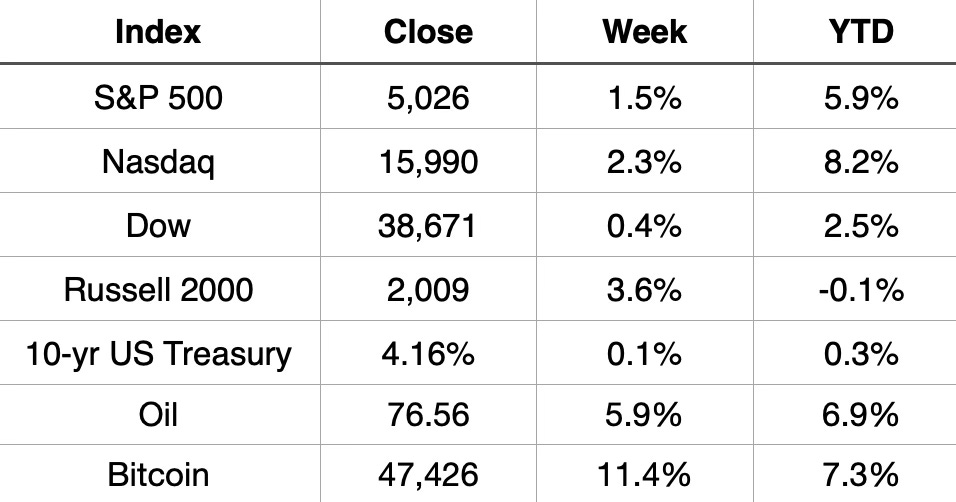
Market Recap
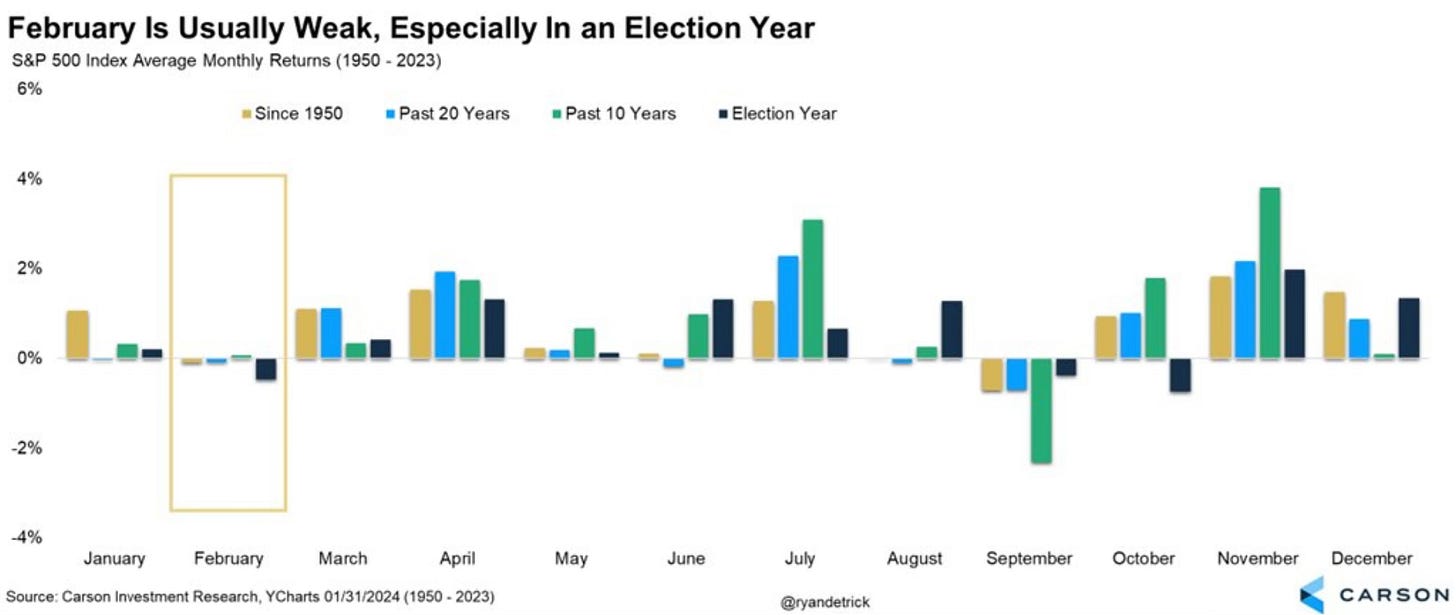
The white hot stock market now takes on February, which is historically the weakest month of the year. Average monthly returns for the S&P 500 in February have been weak going back to 1950, the past 20 years, past 10 years and it has also been one of the worst during an election year.
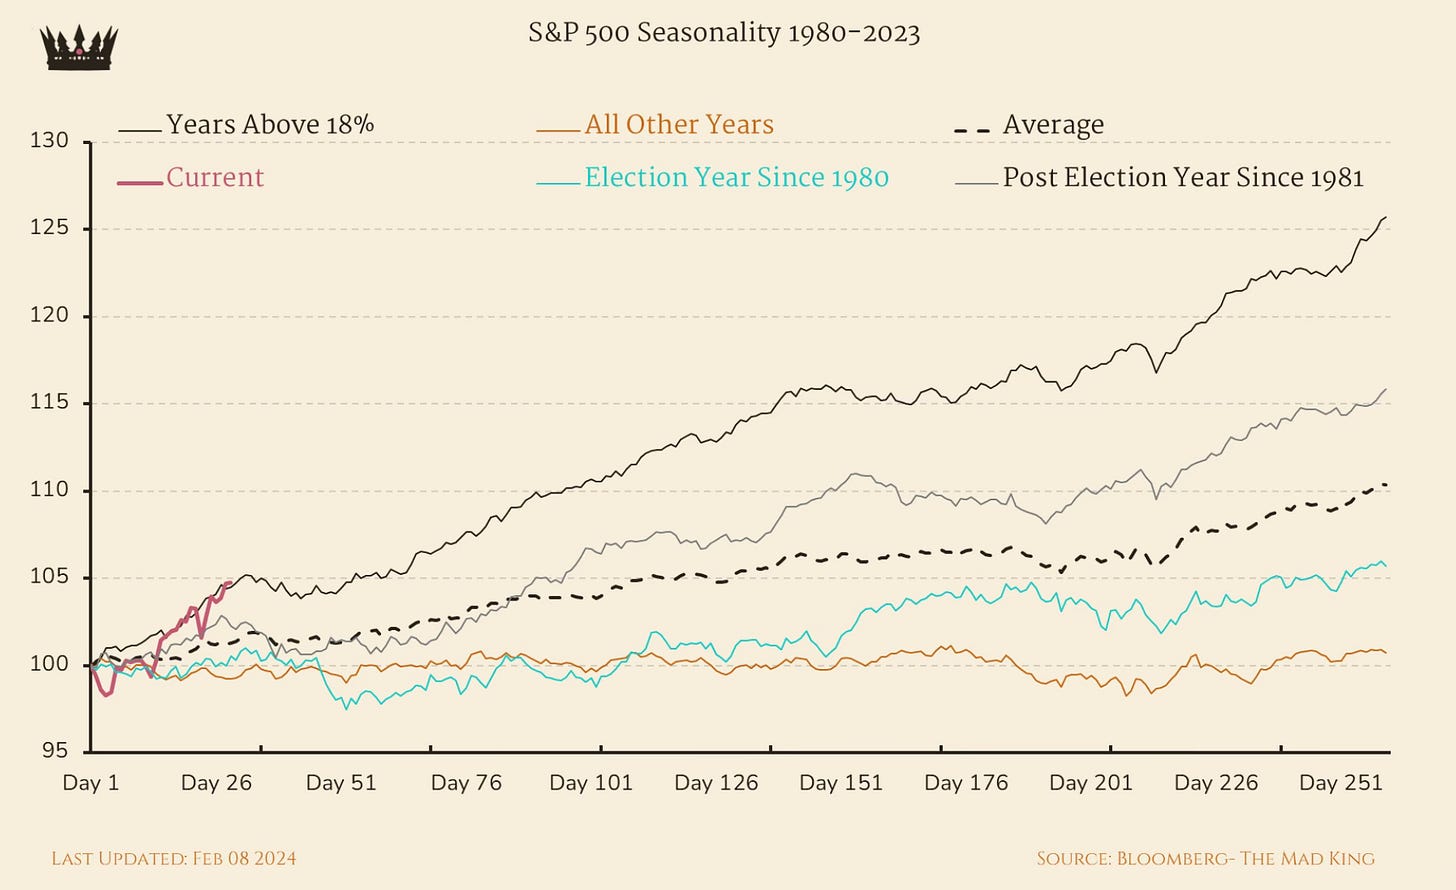
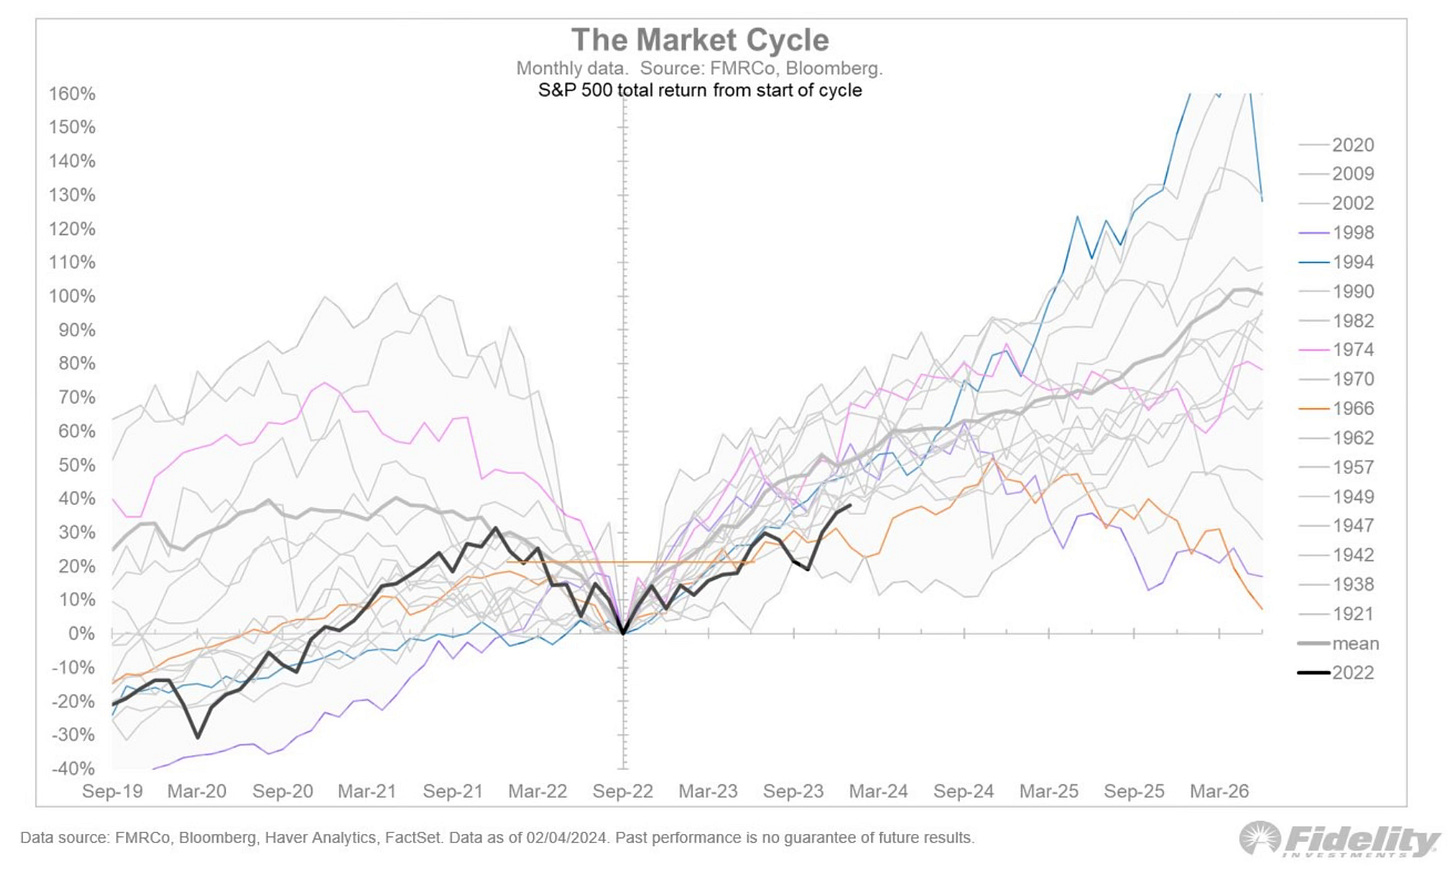
If you zoom out, the current track for the S&P 500 so far is outpacing the path for outlier years. I’m surprised how far ahead of pace it is for an election year.
This bull market has seen the S&P 500 gain 38%. The average gain in a bull market is 114%. The median is 76%. With an already quick and outsized gain, there could be a long runway ahead for more gains.
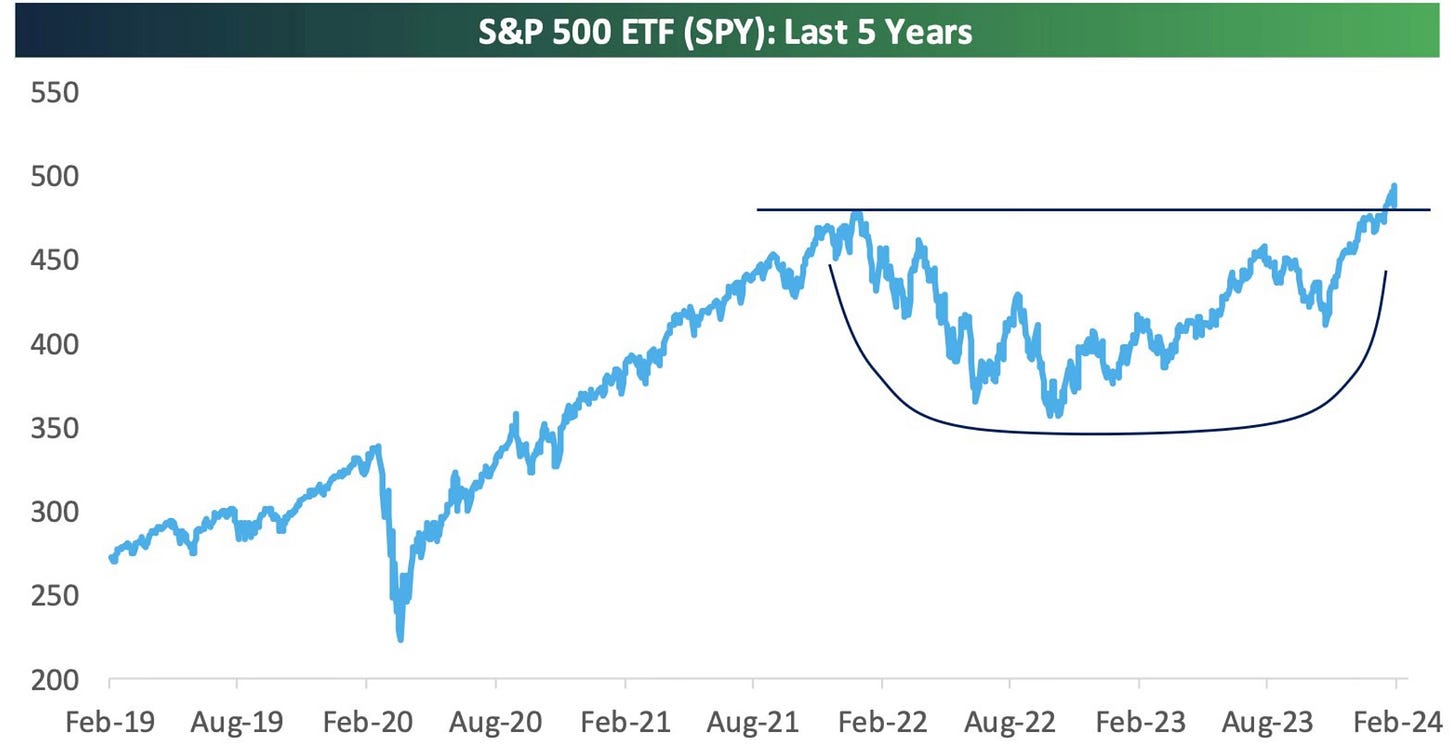
The start of this bull market cycle off the lows shows that it’s now getting on pace with the other years. It also shows just how much of an upside this cycle may have. The biggest chunk of gains historically could be yet to come. Yet to come on top of a record all-time high. The bulls are seeing a lot of green ahead!
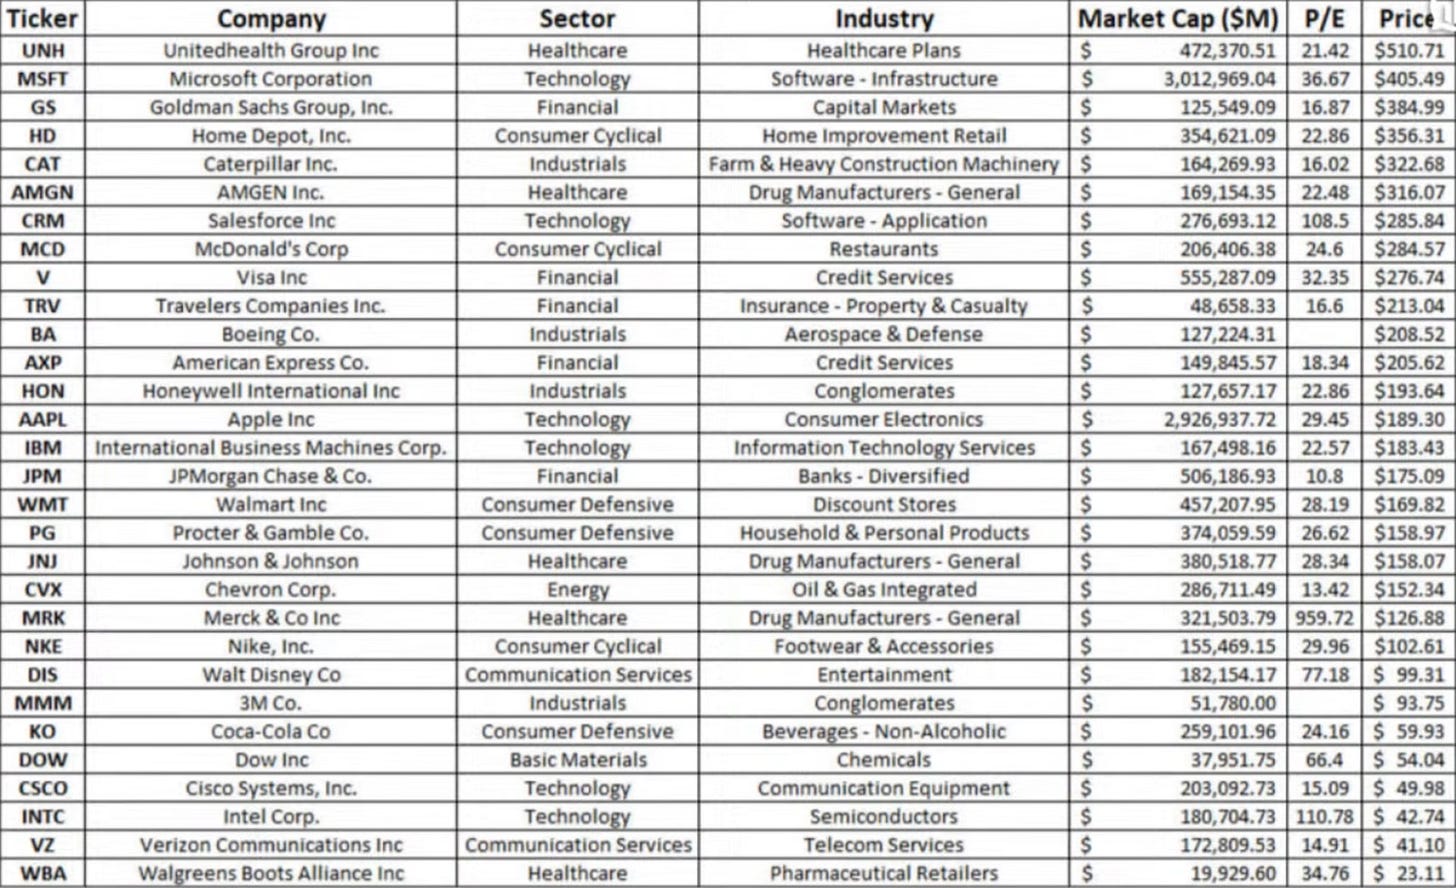
A Look At The Dow
I found this chart of the entire Dow interesting. It has the 30 companies listed along with their sector, industry, market cap, p/e ratio and price. It’s hard to find updated breakdowns like this showing it all in one spot.
Concern Under The Surface?
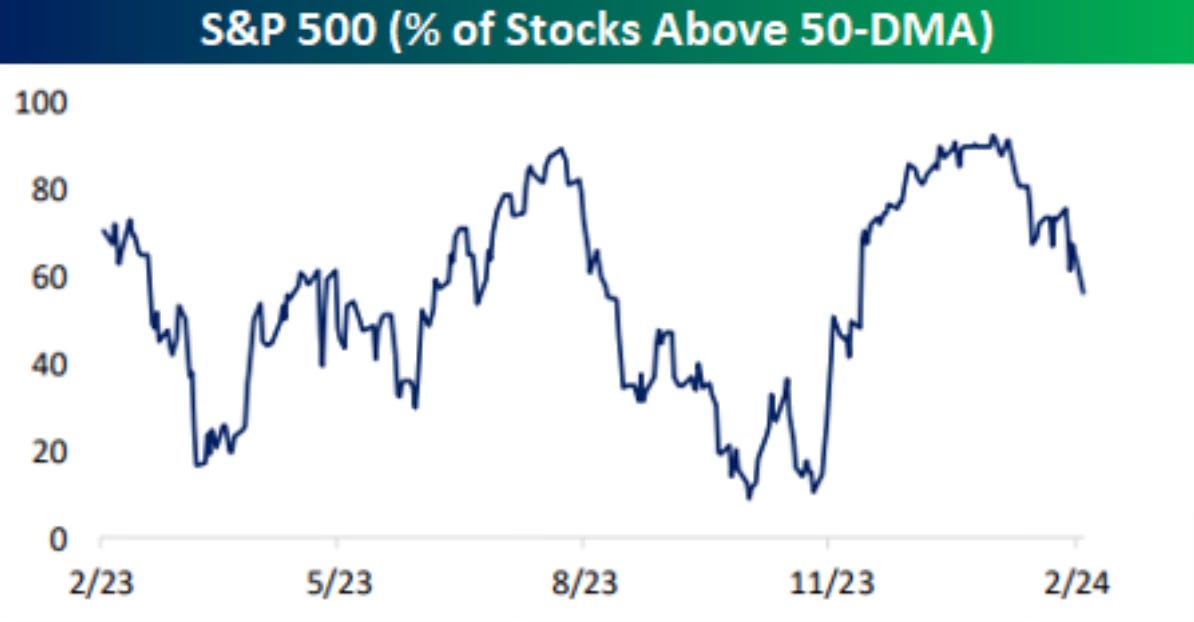
With all the momentum and all-time highs for the S&P 500 you would think it’s full steam ahead with no current roadblocks. But there is some movement under the surface of the S&P 500 index.
As the index sets new highs day after day, the number of stocks above the 50-day moving average is declining and declining rapidly. Right now only 57% stock are above their 50-day.
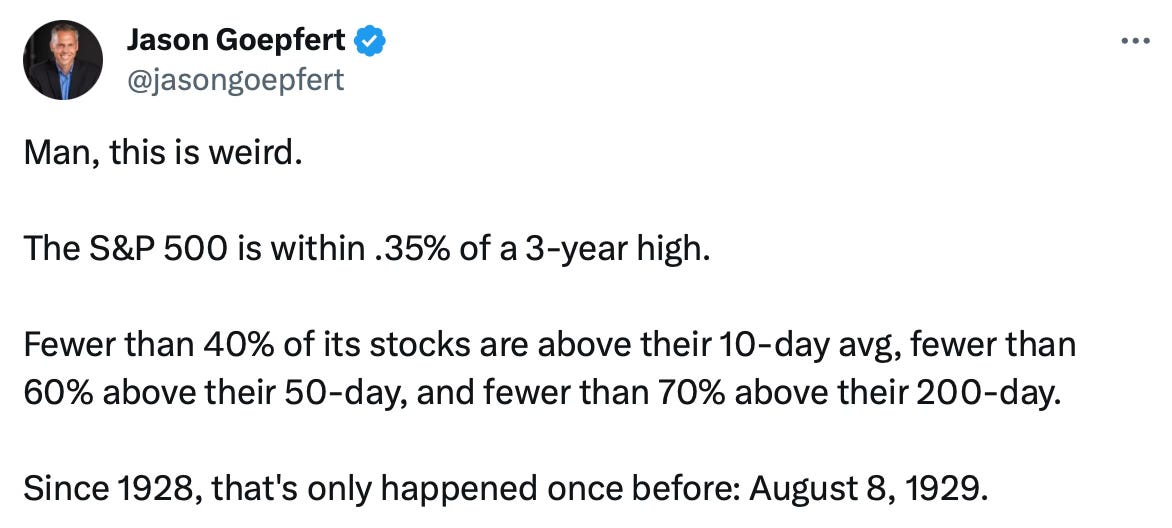
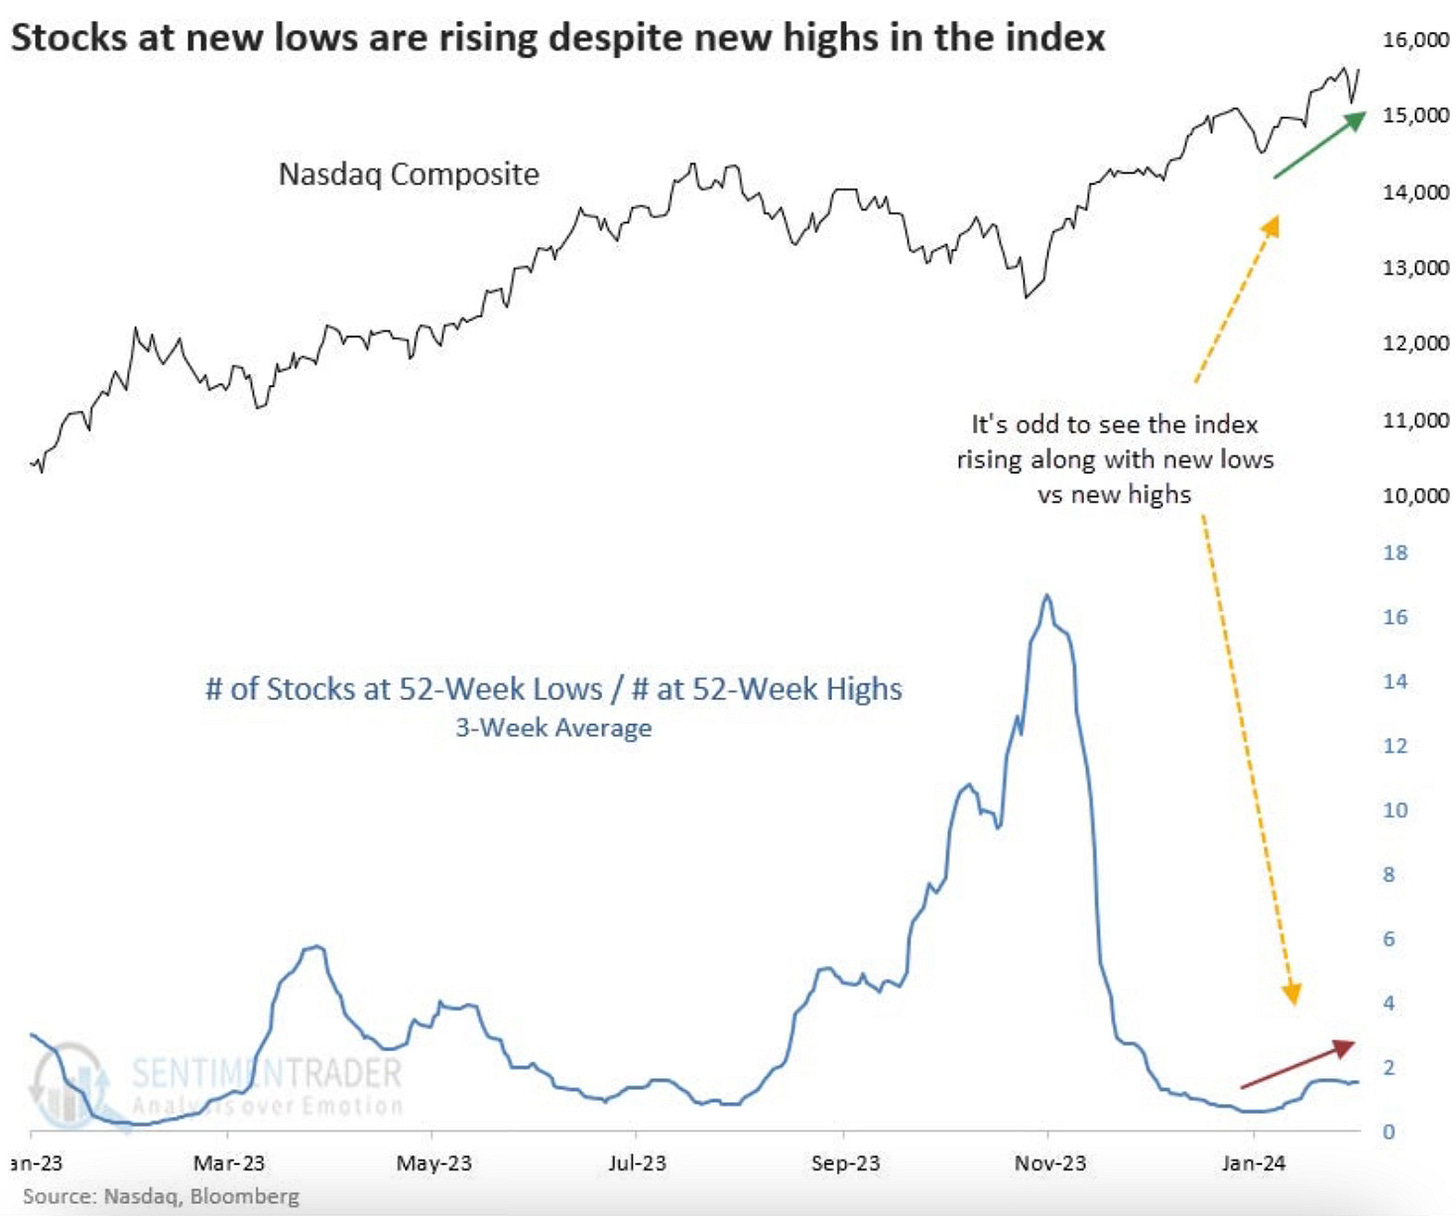
Jason Goepfert had another interesting stat which he shared on what the S&P 500 is experiencing under the surface. If momentum flips, this is something you look back on as a signal.
The Nasdaq is also experiencing similar concerns under the surface. More stocks have been hitting new lows than new highs.
The Recession Watch
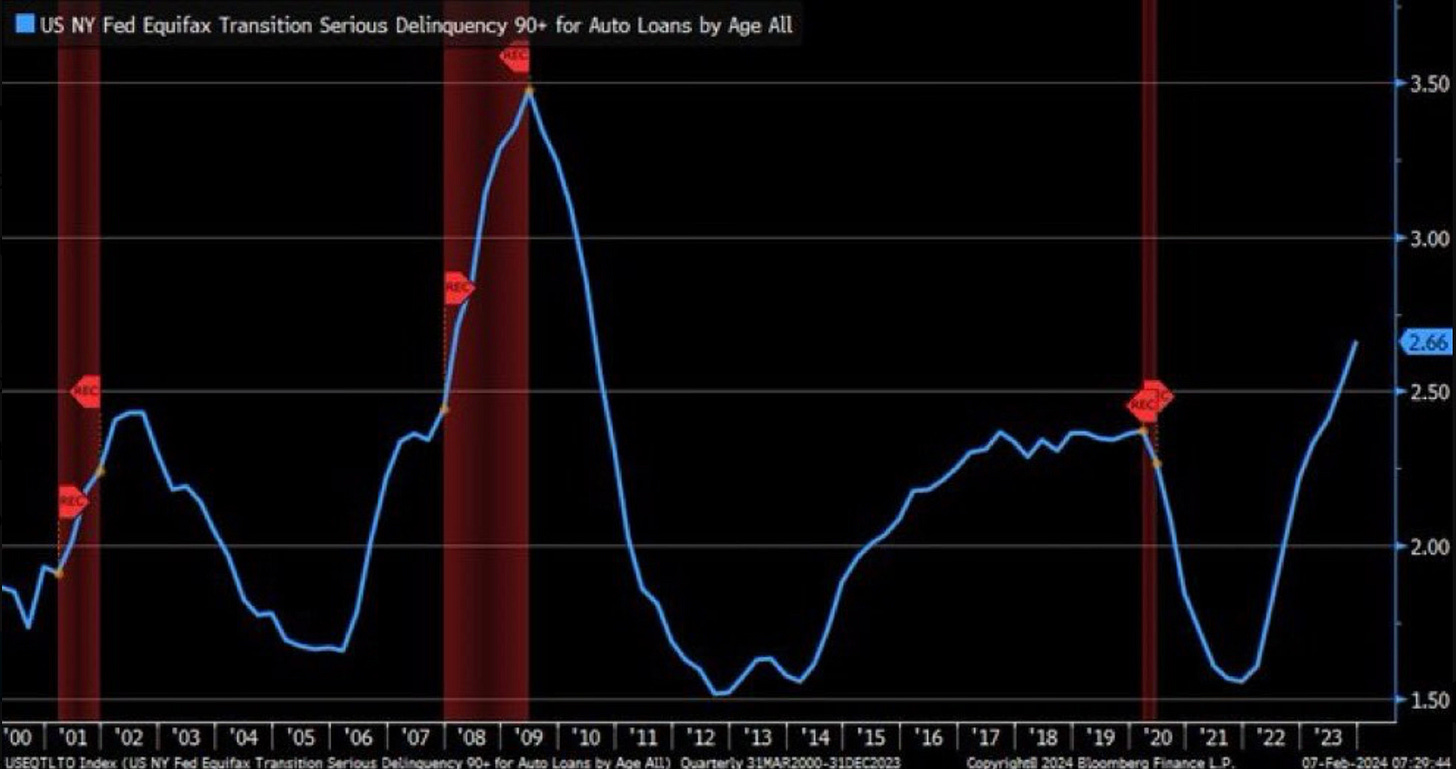
After the most predicted recession ever never happened, a lot of eyes have been on possible recessionary indicators. One indicator that has started to flash warnings signs is the auto loans in serious delinquency (90+ days). Data from Q4 2023 shows they’re now at the highest level in more than a decade.
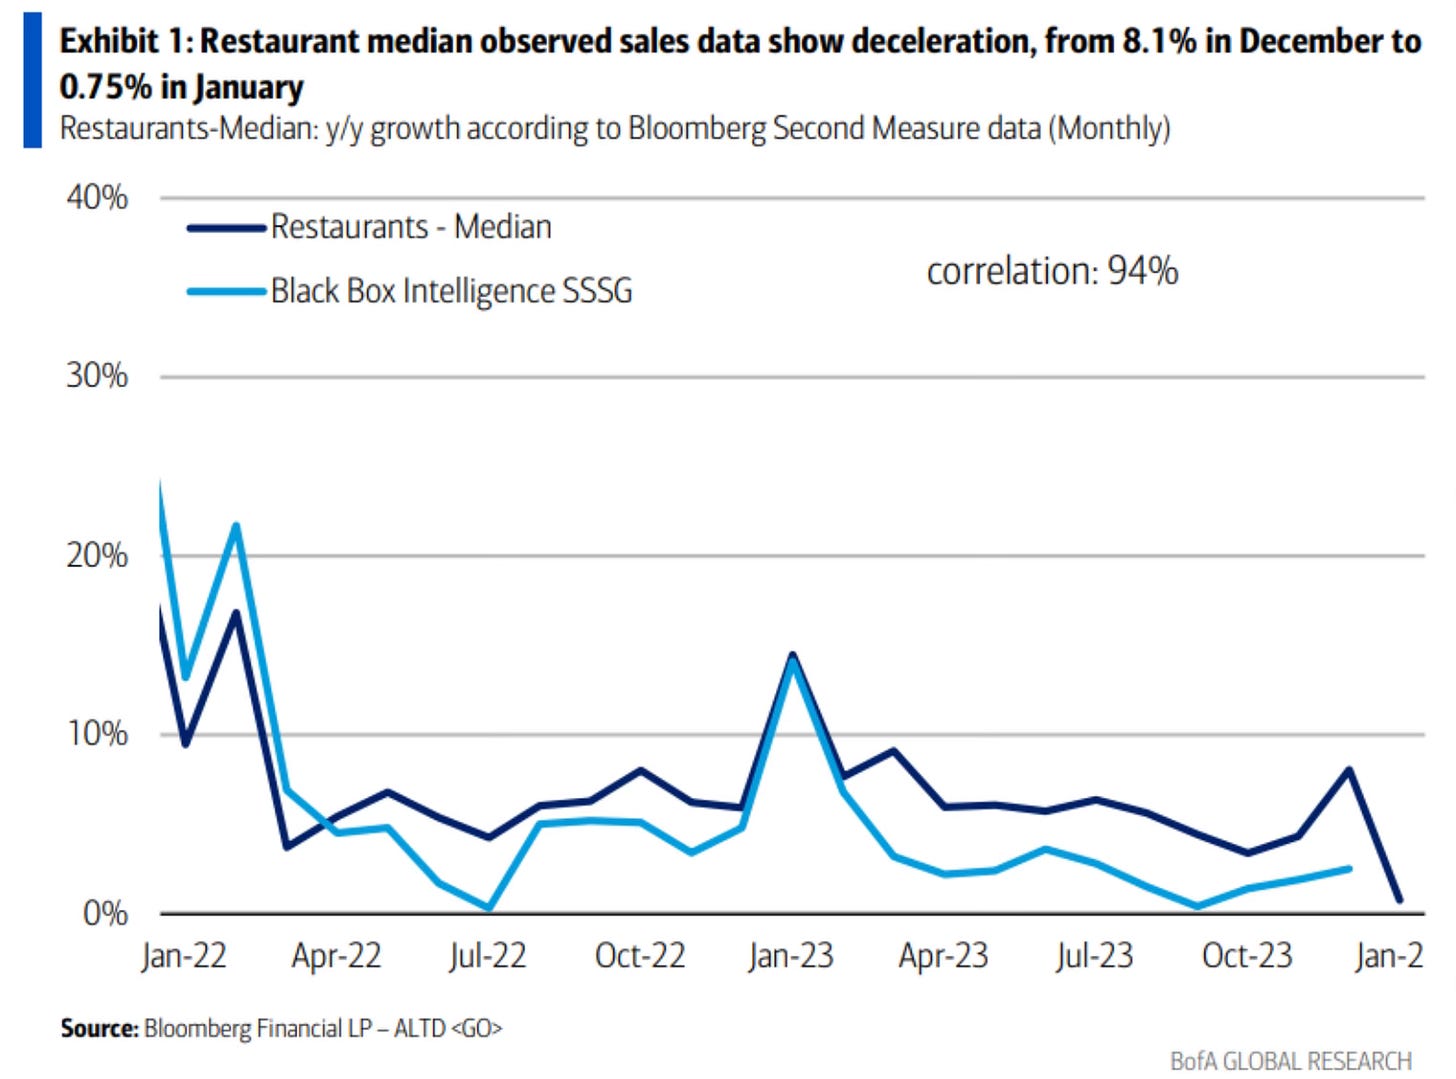
I also found the restaurant sales data very interesting. Were people not hungry in January? Or did they decide to just not go out to restaurants and ate at home?
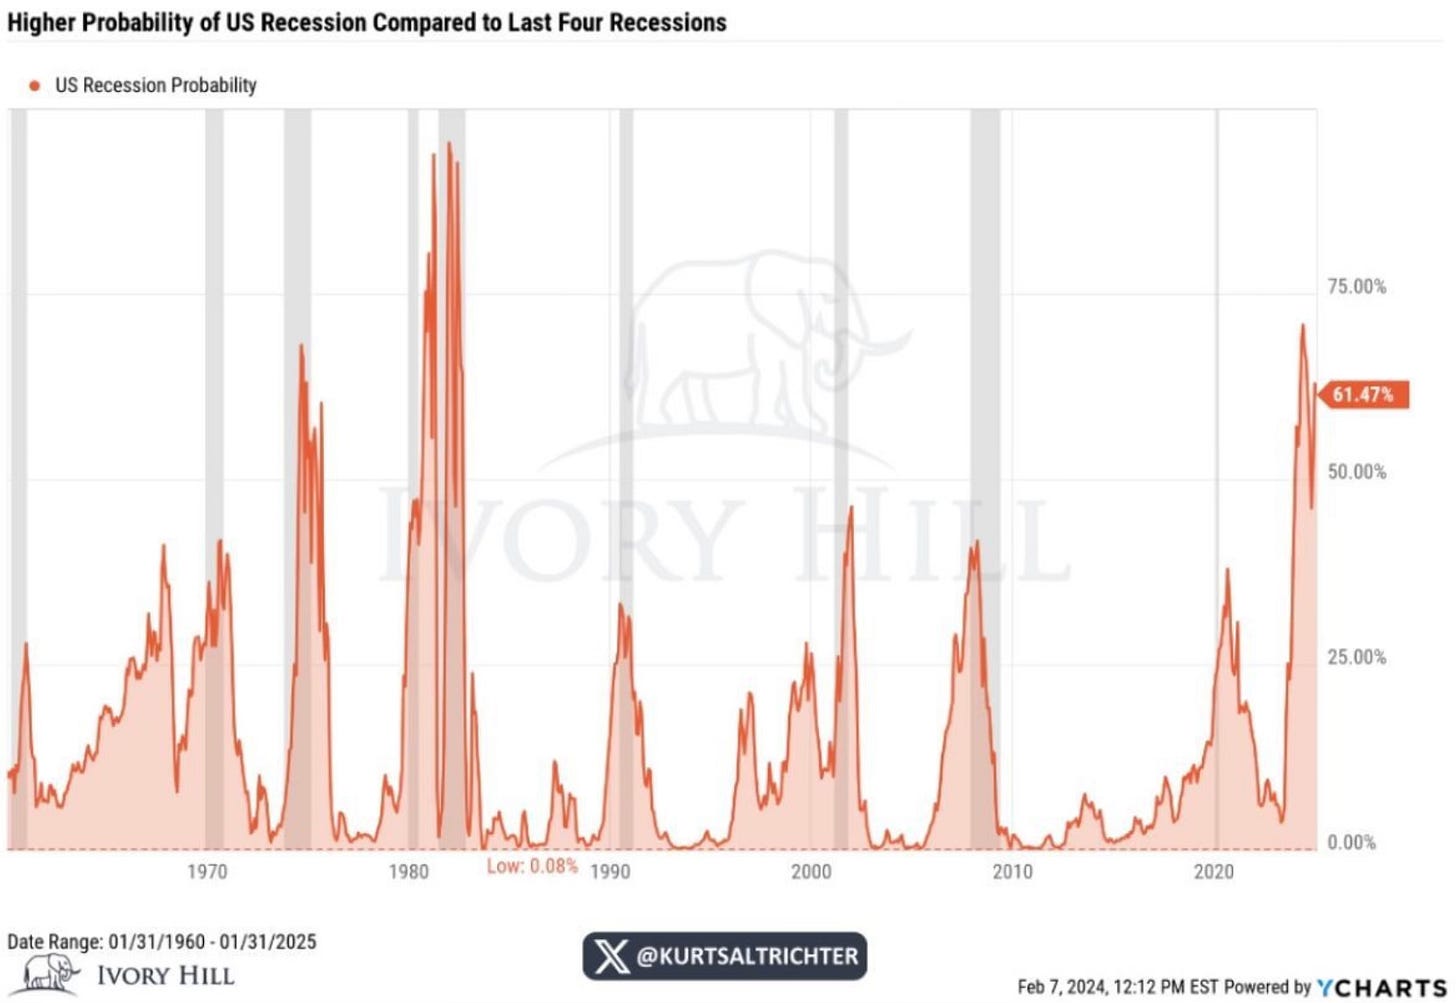
The US recession probability still remains sky high. The probability is still higher than the last four recessions and looks to even be rising.
Oil’s Record Returns
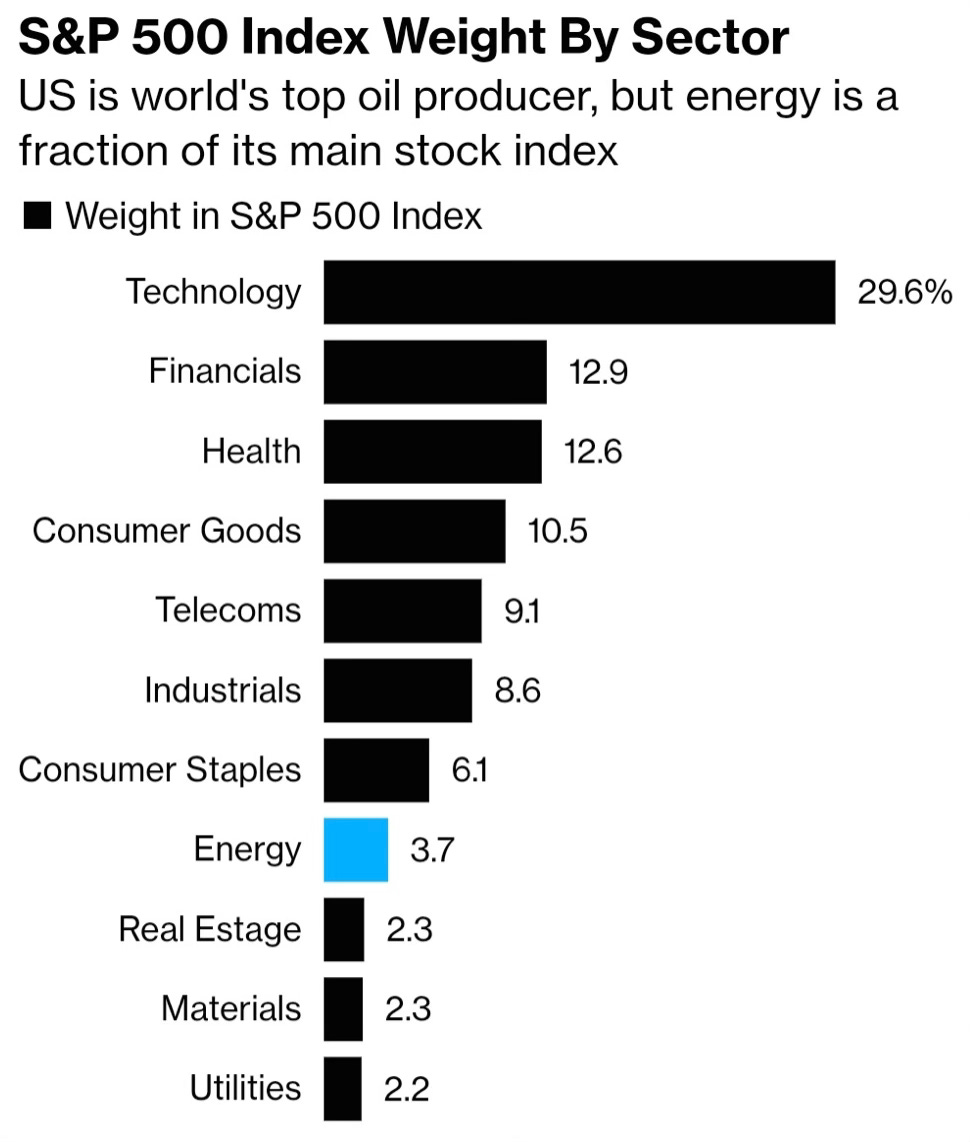
I learned something about oil this week. As all the attention is on technology, oil has paid out a record to shareholders. Big oil returned more cash in 2023 than it ever has. Even more than their record profit year of 2022.
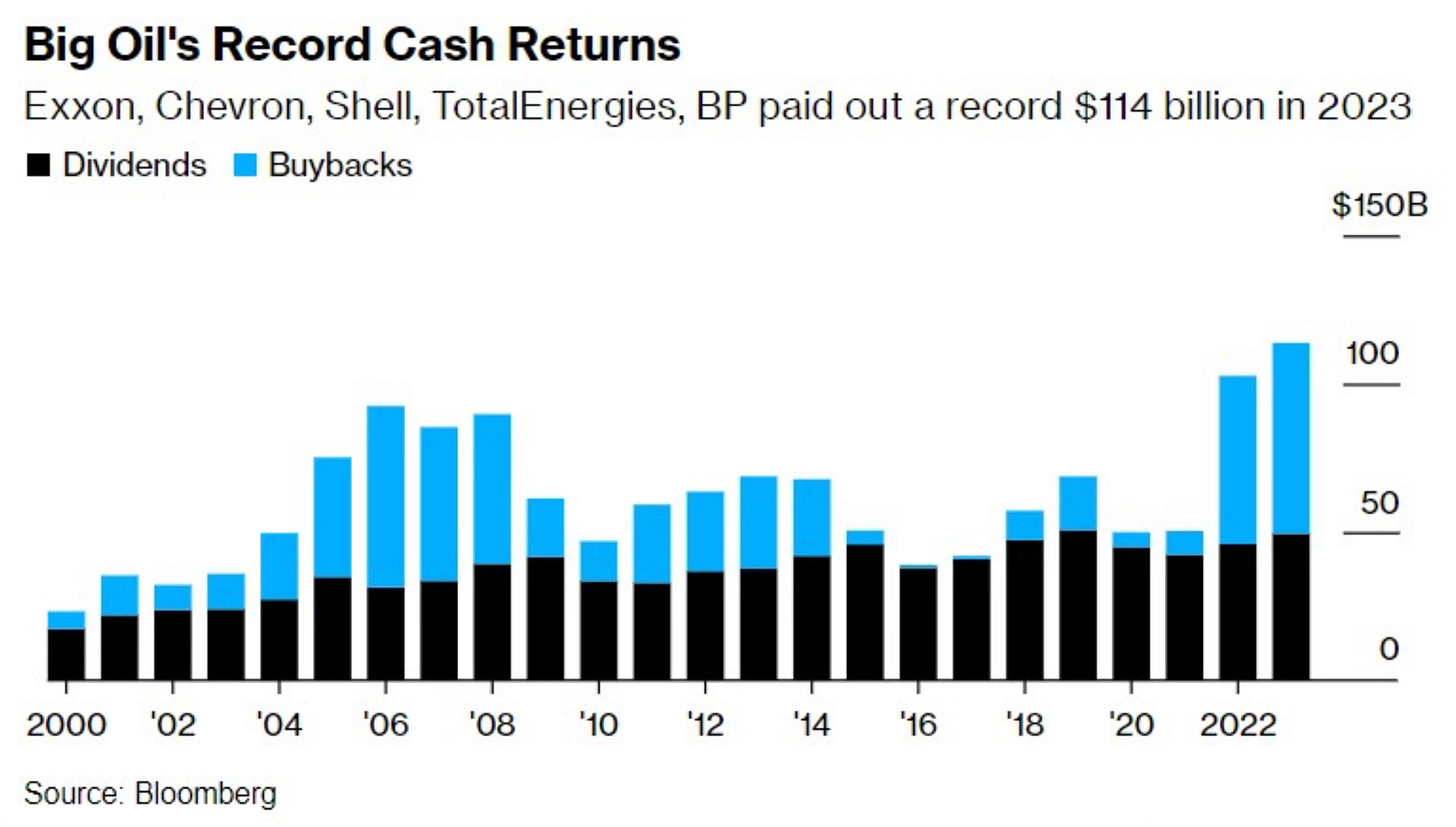
To think that energy is still so underrepresented in the S&P 500 weighting. The energy sector still only accounts for a 3.7% weighting. I thought the percentage had come up but it’s still microscopic.
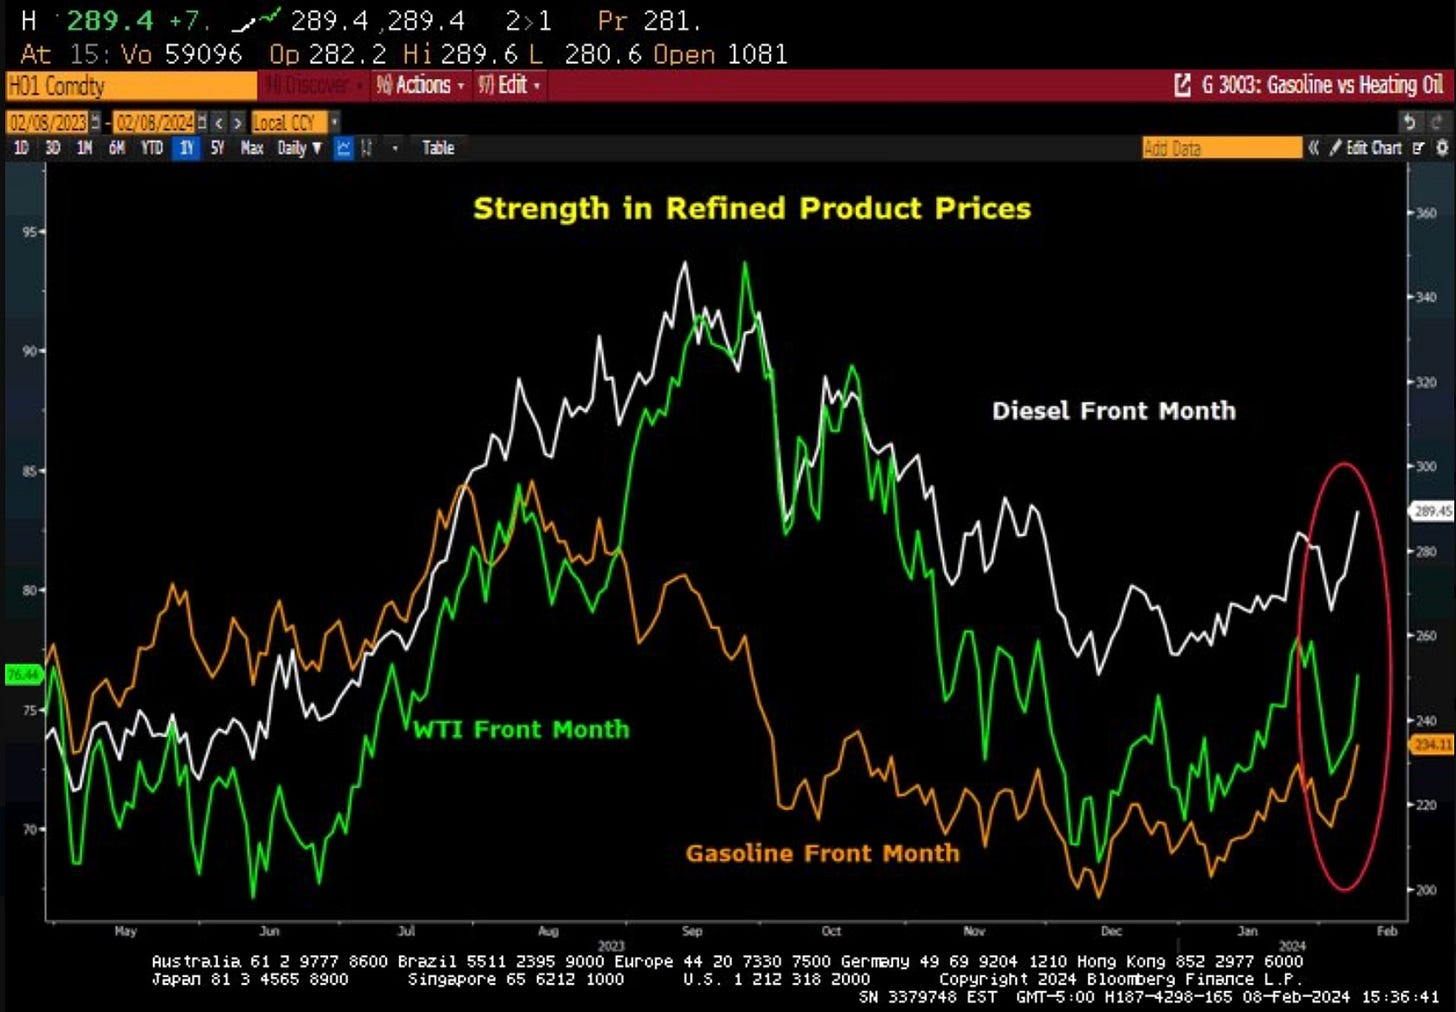
Is Inflation Reigniting?
We’ve been hearing that the rise in inflation has been defeated and how it’s falling like a rock. Data seems to be heading in a positive direction. But this week some very important early indicators have flipped into the other direction. I plan to be watching these very closely in the coming weeks.
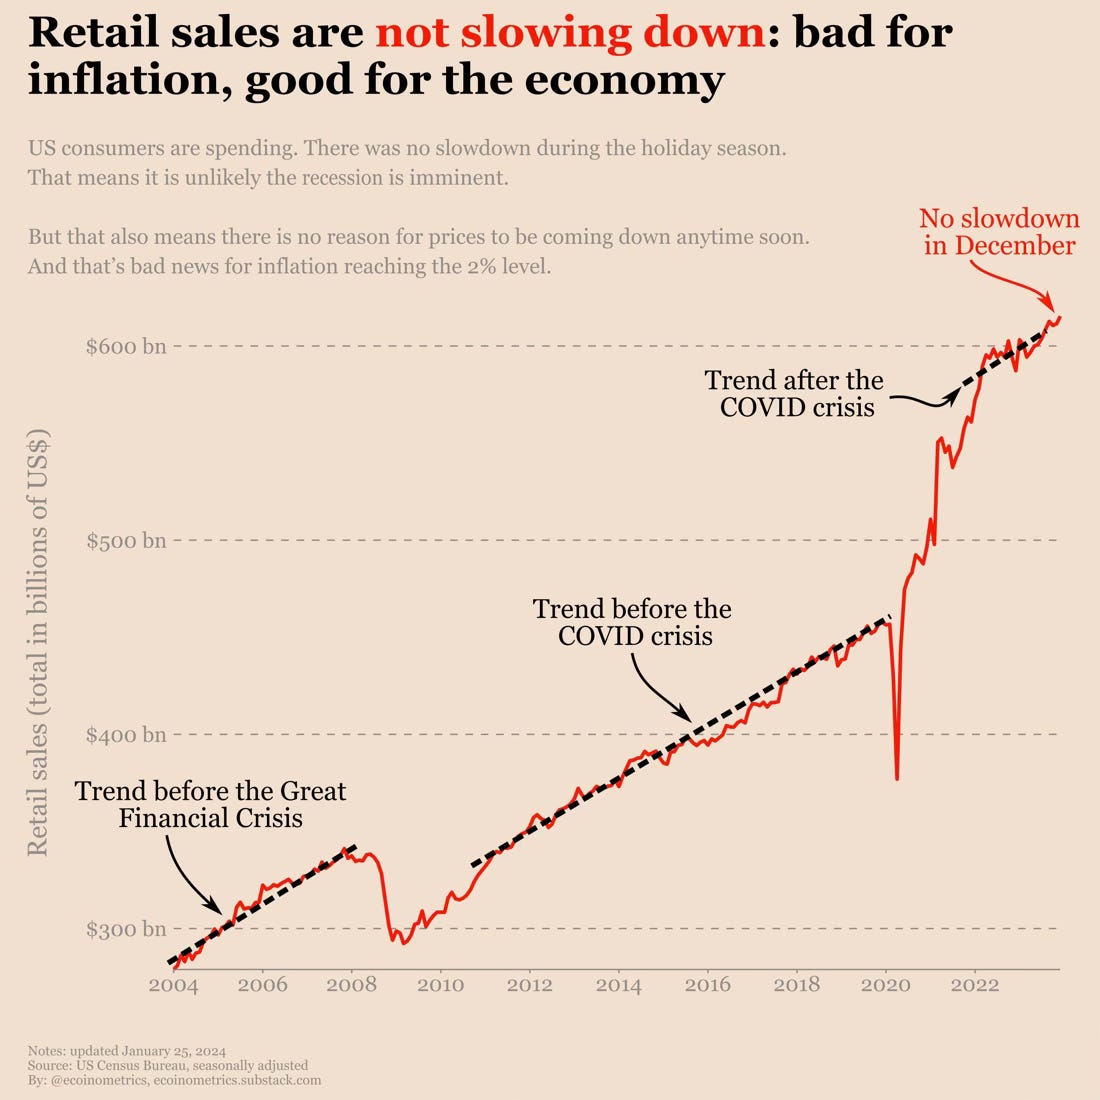
This all comes after data from December showed that retail sales are not slowing down. The below headline is perfect in how this is good for the economy but bad for inflation.
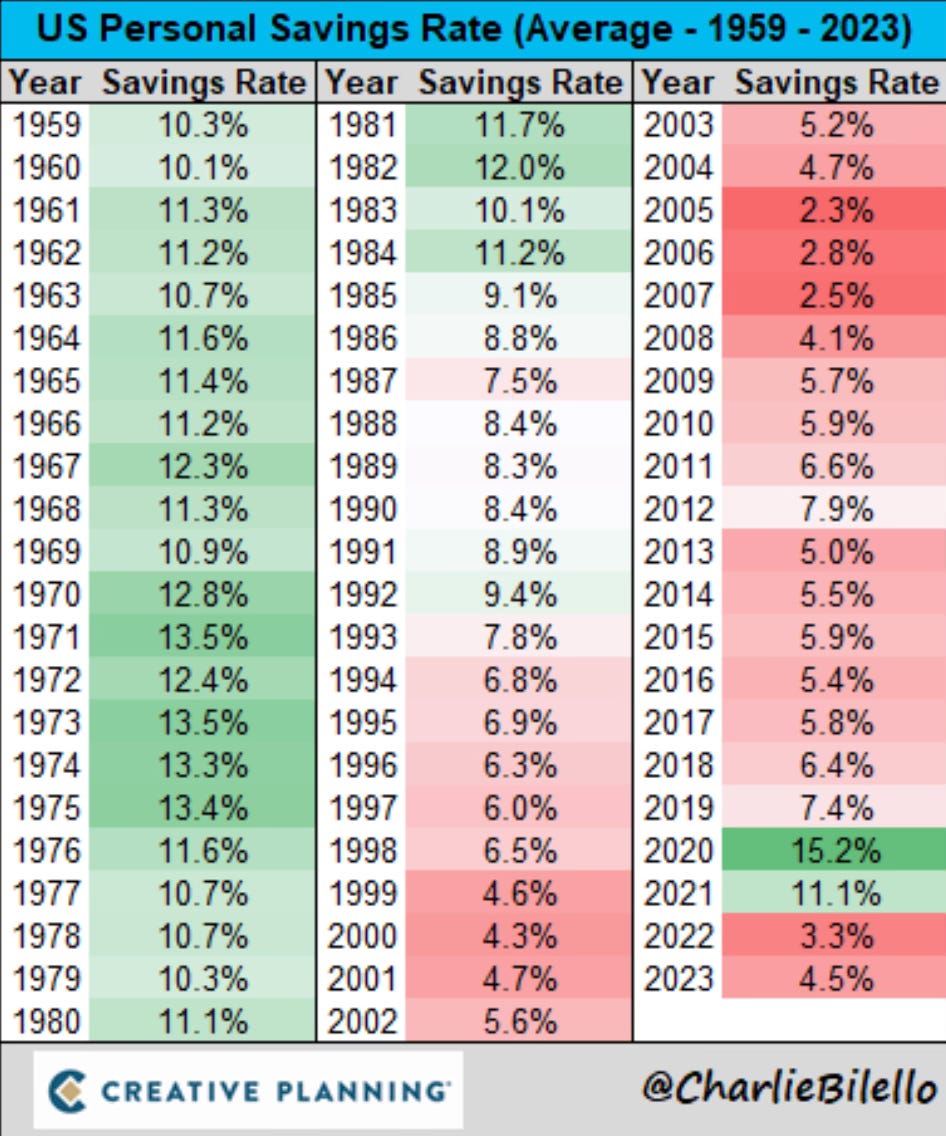
It’s a surprise that spending has continued and now we see that the US personal savings rate has started to tick back up from 3.3% to 4.5%. Consumers still have money.
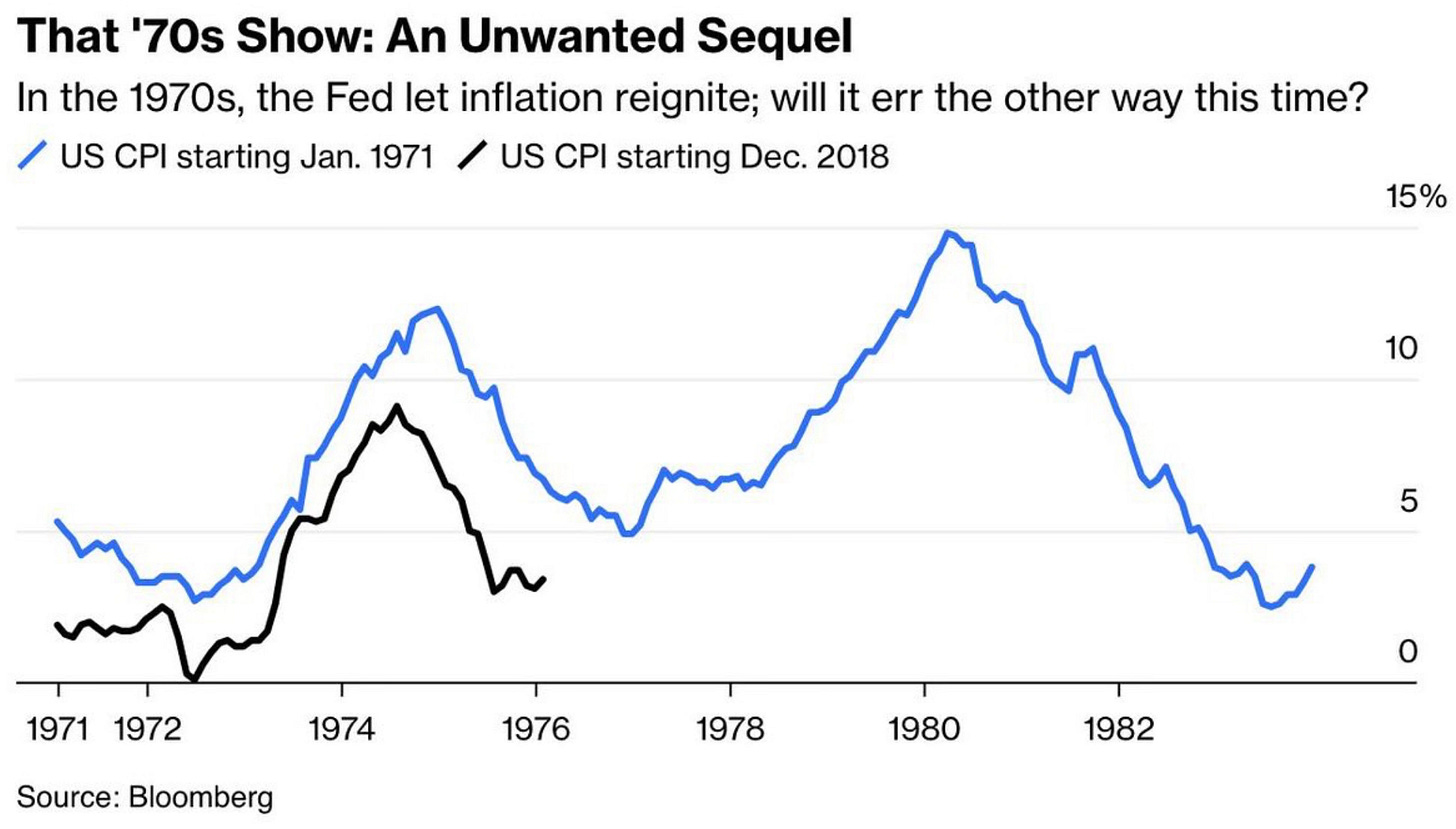
Then we have this chart which has been making the rounds in various versions. To me this is the cleanest and easiest to understand.
We know that inflation was reignited in the 1970s. What is fascinating is how the US CPI starting in December 2018 has tracked so closely to US CPI starting in 1971. As the charts illustrates, you can see what sits ahead if it follows this similar track.
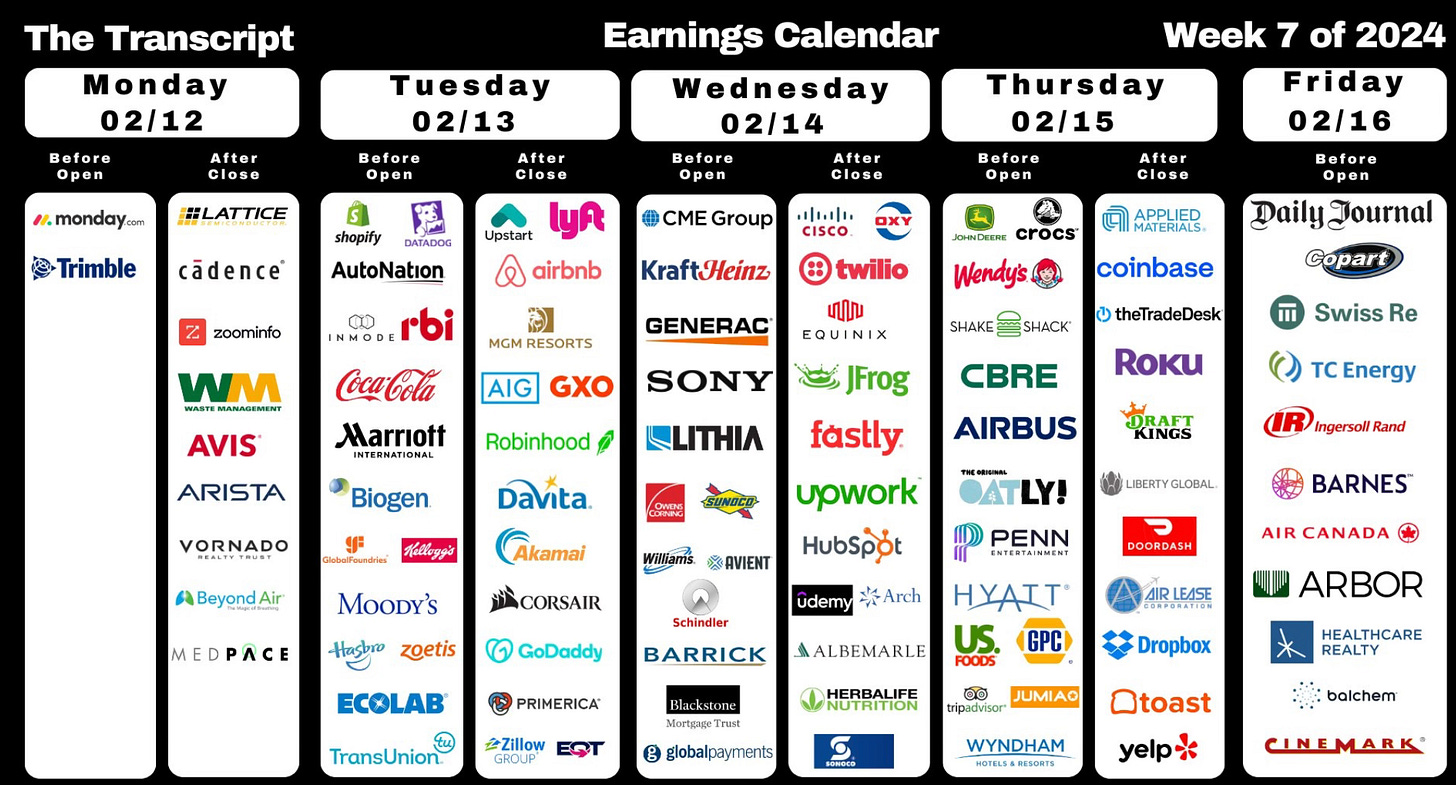
Upcoming Earnings
The Coffee Table ☕
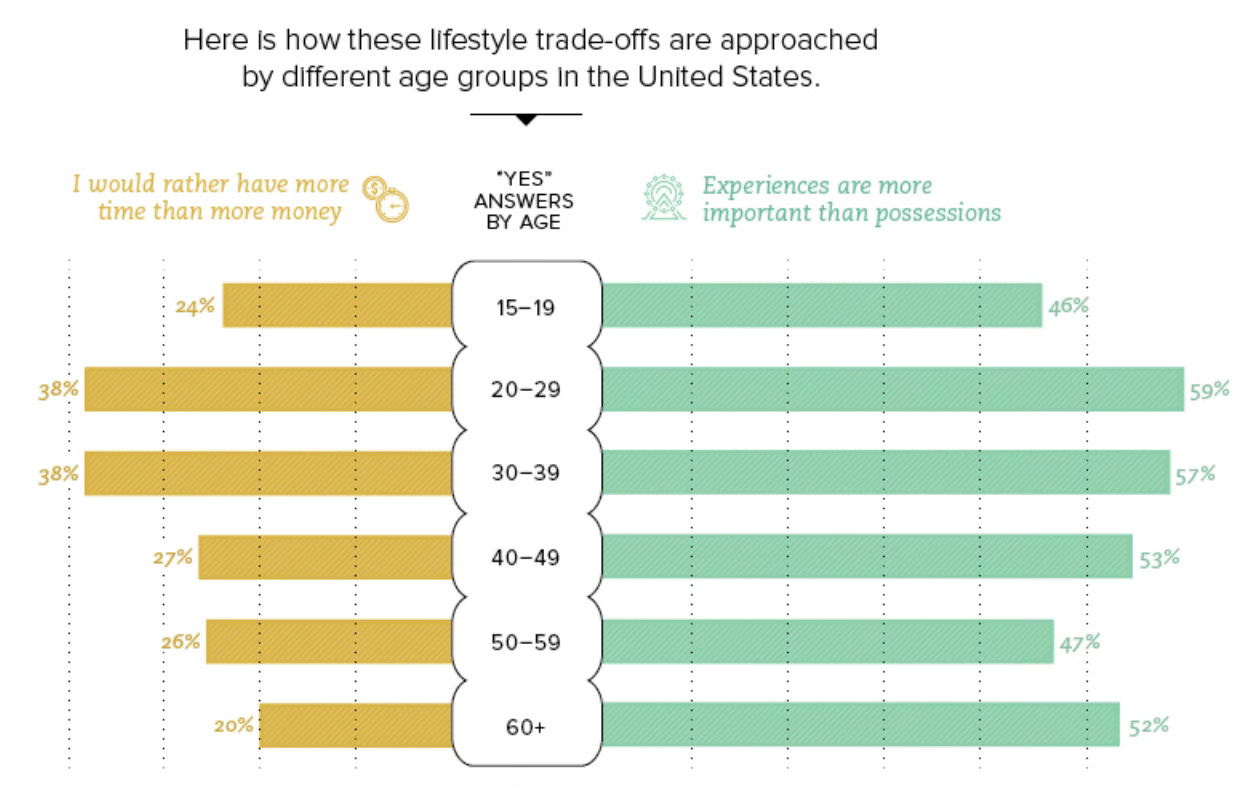
Tony Isola wrote a great post called Managing Money Is Easy, Managing Wealth Isn’t. This piece is loaded with meaningful wisdom and views we forget about and need to continually be reminded of. Might be my favorite piece I’ve read from Tony. It also includes this wonderful chart below.
I enjoyed reading this post by Jacob Schroeder who writes The Root of All Our Complicated Relationship with “Stuff”. It was interesting to see why we buy so much stuff. How it can boost confidence, make you happy and time travel even if it’s only for a short amount of time. Is less stuff the key to happiness?
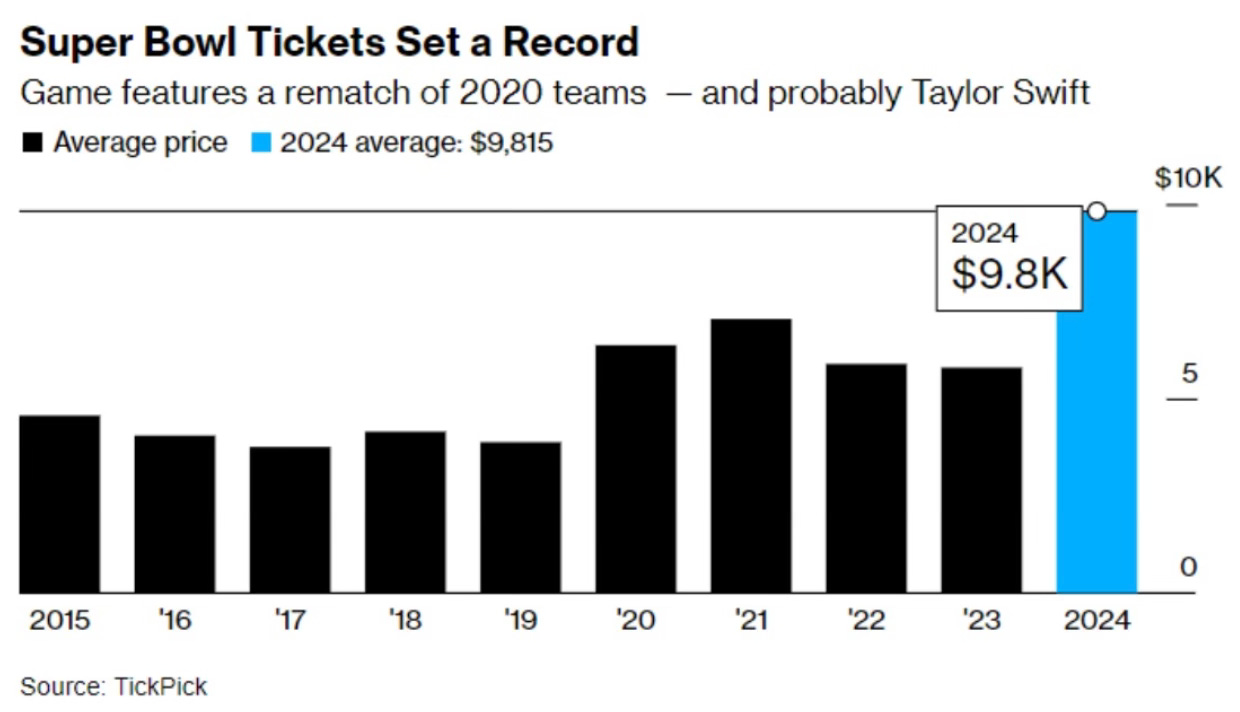
One plus of the Buffalo Bills not making the Super Bowl, is that I’m not tempted to spend what a ticket to this year’s Super Bowl is costing. The average price of a ticket has moved up to a record $9,815. That’s up 70% from last year’s average price!
Larceny Barrel Proof (Batch C923) This was recommended to me so I had to try it out. This comes in at a hot 126.4 proof. It smells wonderful as I got brown butter and snickers type notes. At the first I tasted those same things until the burn set in. It pivoted then to a heavy sweet and spicy finish with a hint of nutmeg. It punches hard and I got a bit more burn than I desire. I tried it neat and now know the next time to try it with a cube. It’s an exciting pour and if you like barrel proofs this is a good one to try.
Thank you for reading! If you enjoyed Spilled Coffee, please subscribe.
Spilled Coffee grows through word of mouth. Please consider sharing this post with someone who might appreciate it.
Order my book, Two-Way Street below.

