Investing Update: I Bought 2 Stocks
What I'm buying, selling & watching
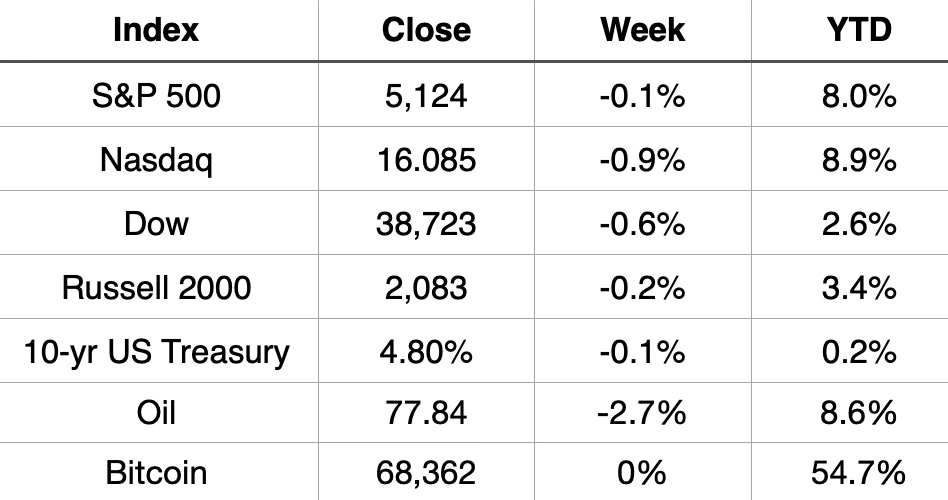
This week finished slightly lower for all the major stock market indices. The market still sits near all-time highs. It now makes 16 out the past 19 weeks have been positive.
Since October, the S&P 500 is now up over 25% and still without a 5% or more pullback.
Coming into this week the S&P 500 posted gains in 16 of 18 weeks for the first time since 1971.

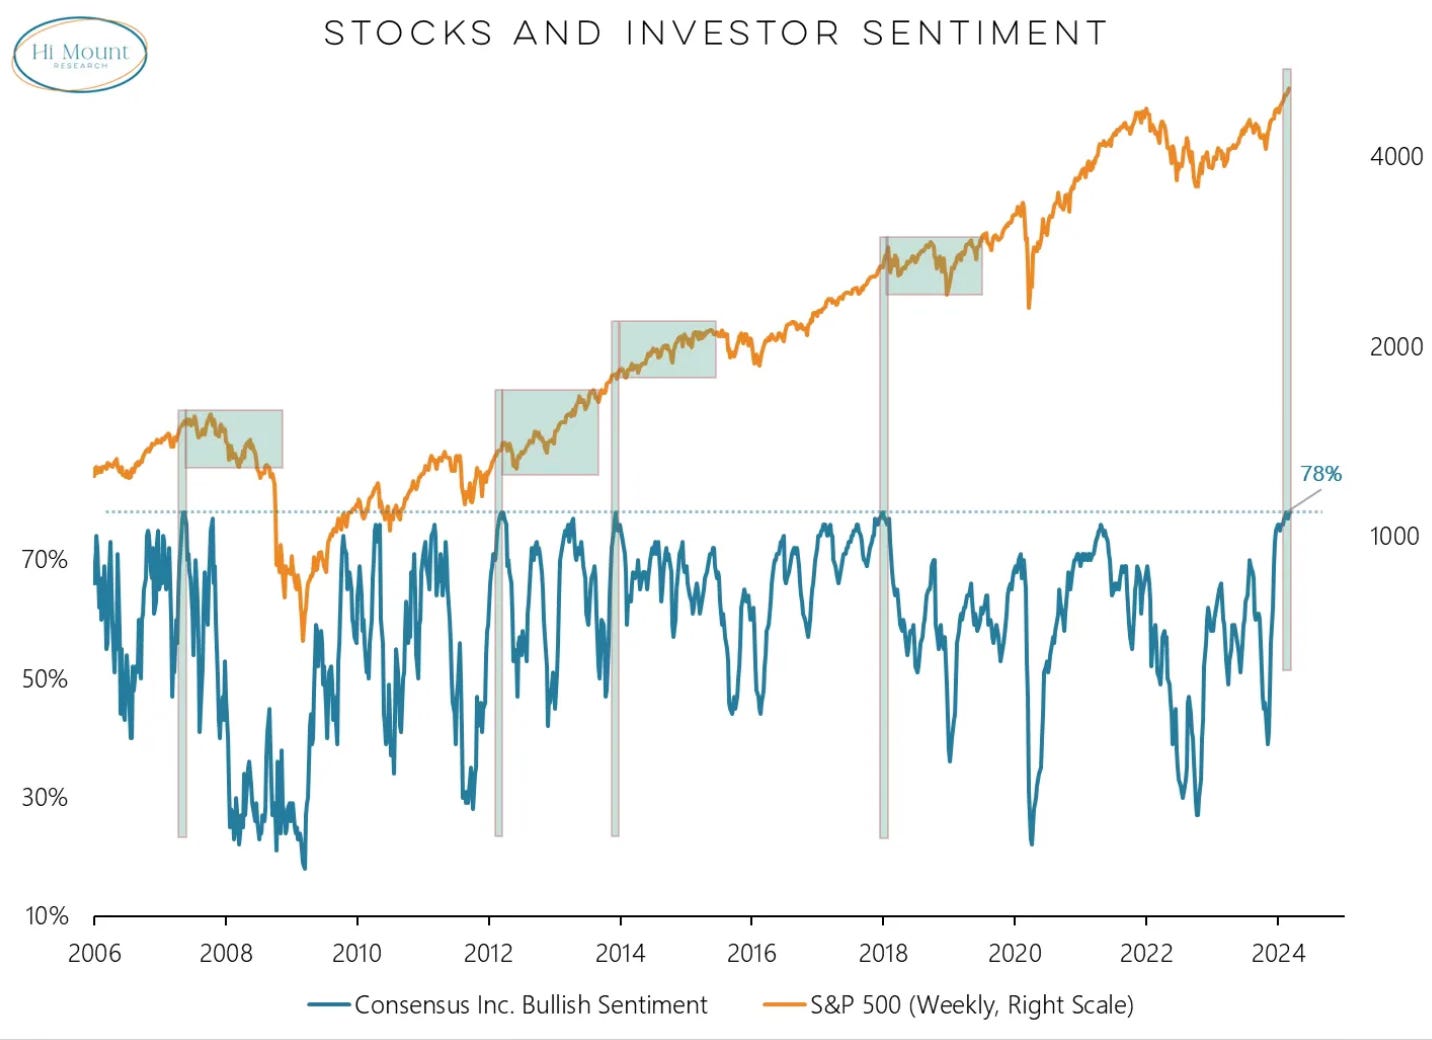
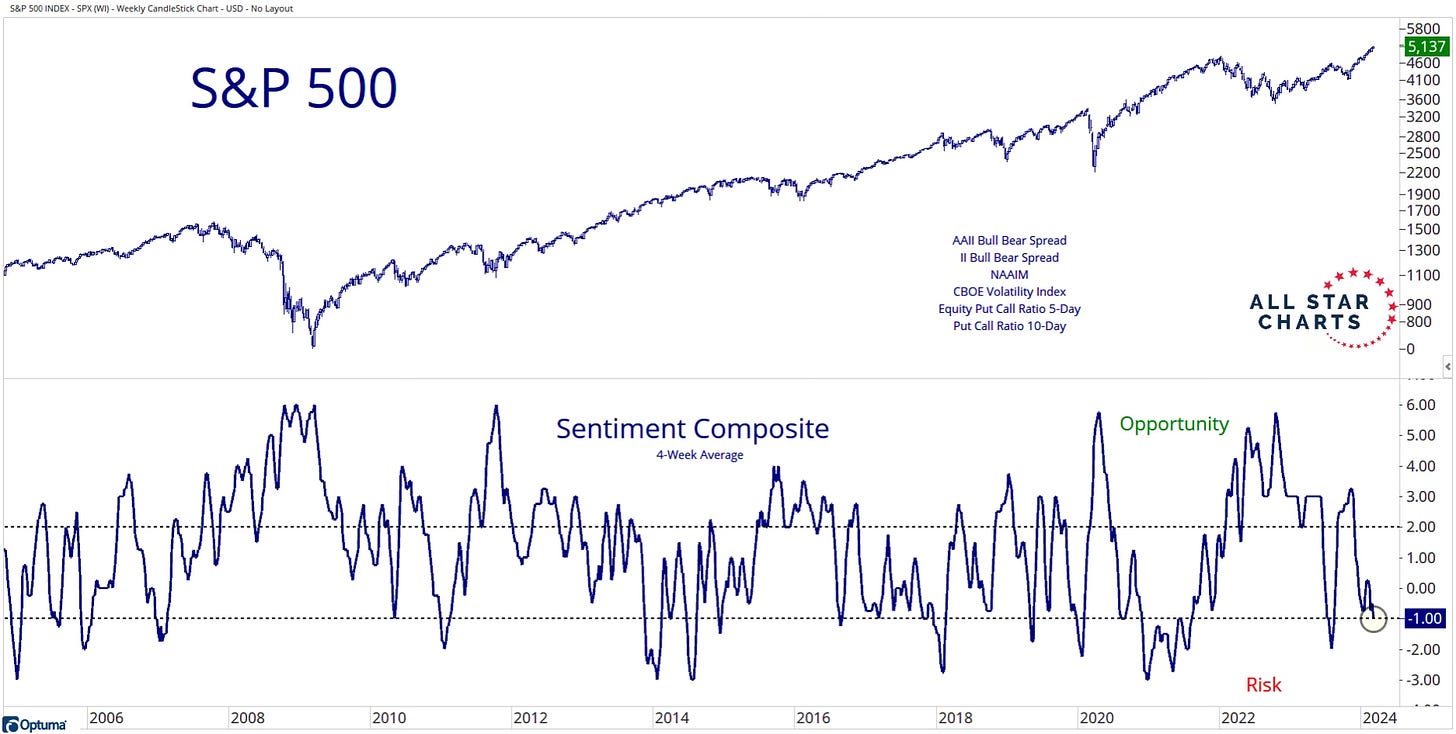
This has pushed investor sentiment to the highest bullish levels in 20 years. People are feeling comfortable investing in stocks right now.
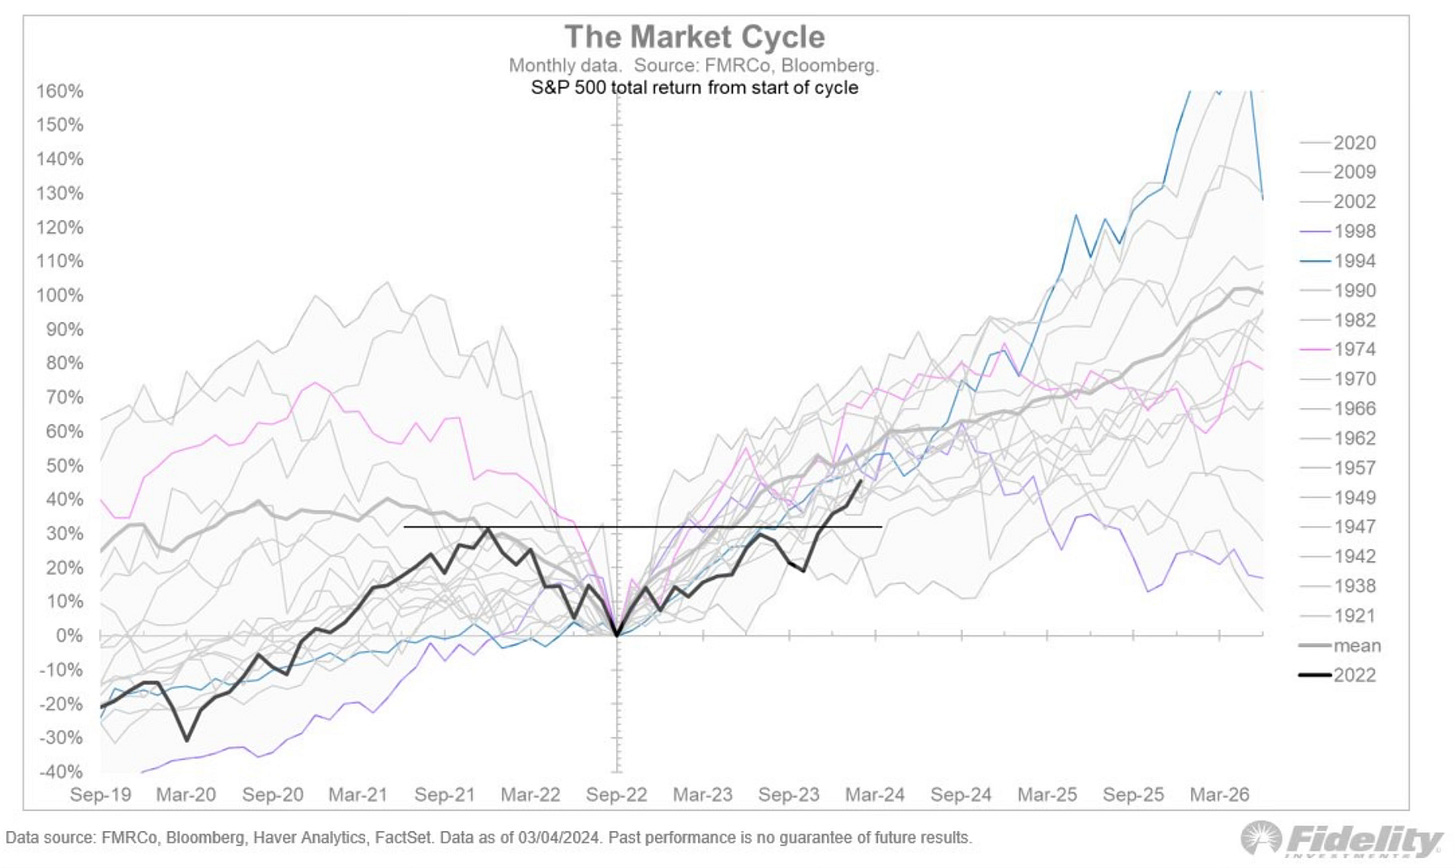
The recent surge higher has put this bull market right on par with a typical bull market. This charts historical bull markets from the starts of the different bull market cycles.
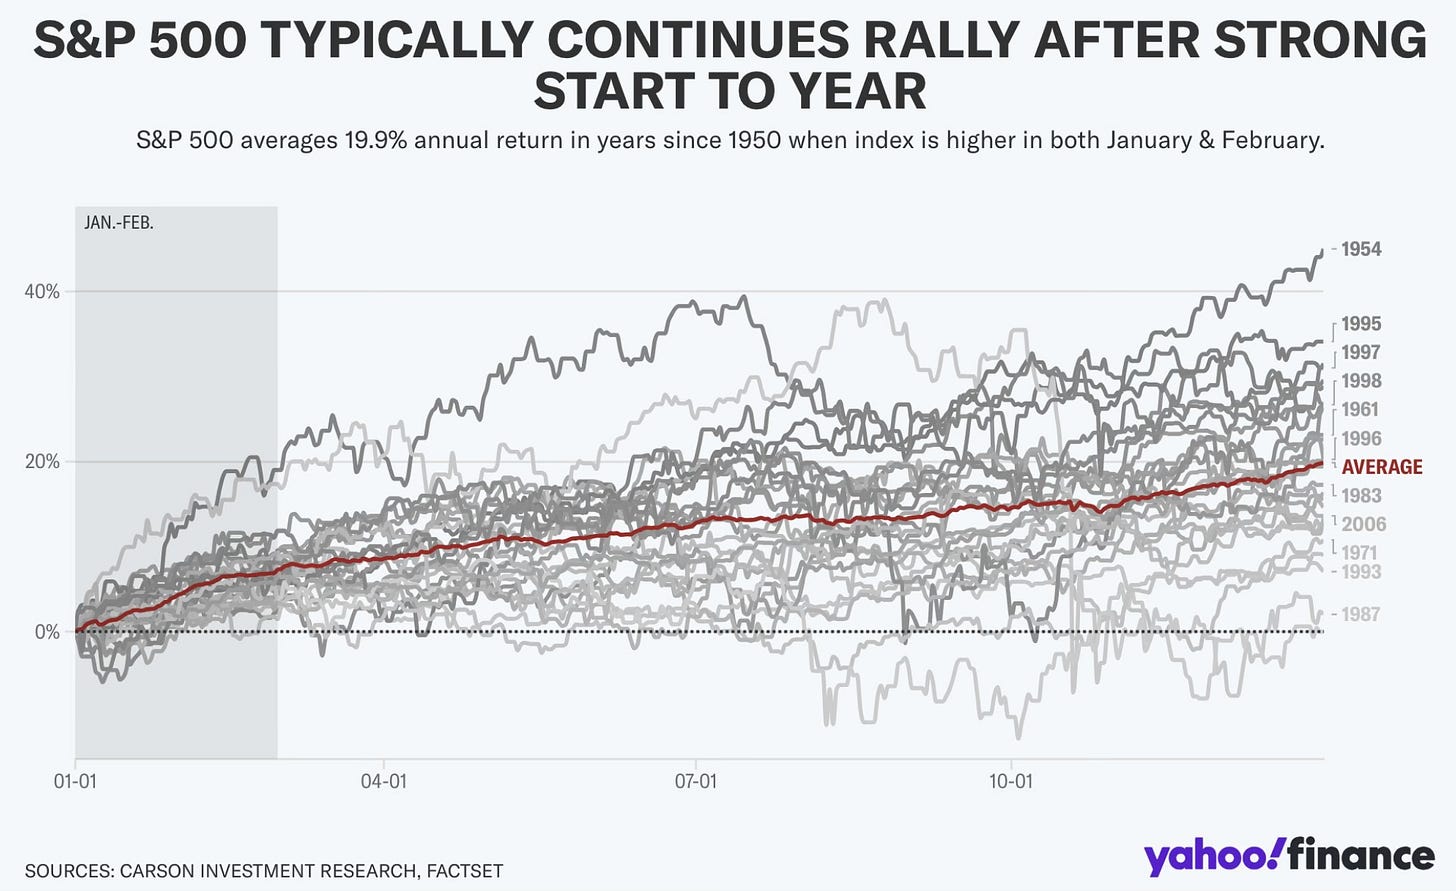
Going back to 1950, every time the S&P 500 has been higher in January and February it tends to finish the rest of the year strong. The S&P 500 averages annual returns of almost 20% when the index is higher in January and February.
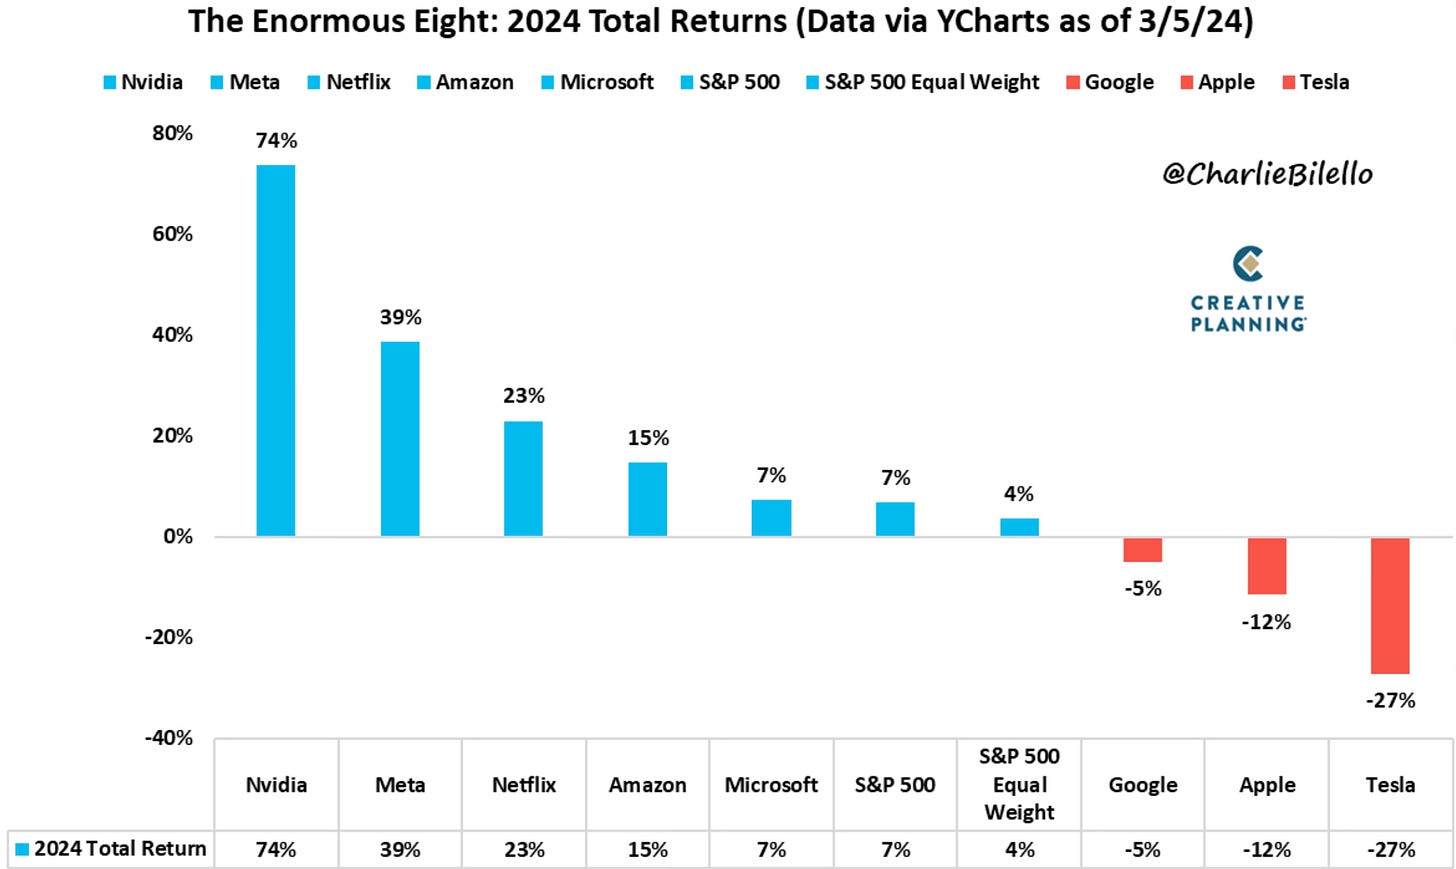
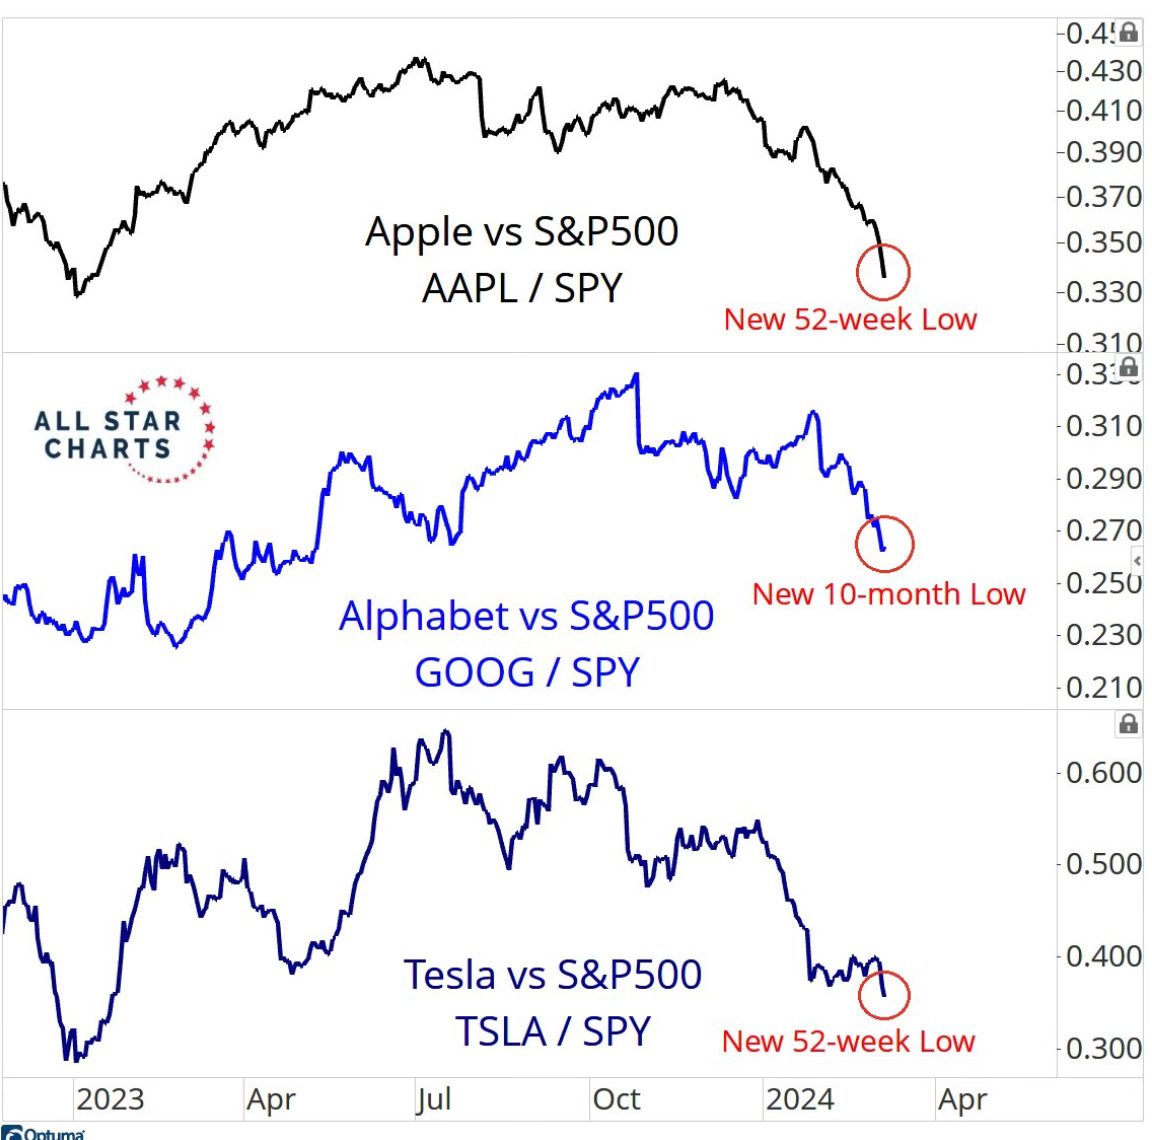
This chart shows what the Enormous 8 have returned so far his year as well as the S&P 500 and the S&P 500 equal weight. You can see that this rally has been gathering steam and going higher without participation from three of the biggest and most popular stocks in Apple, Alphabet/Google and Tesla.
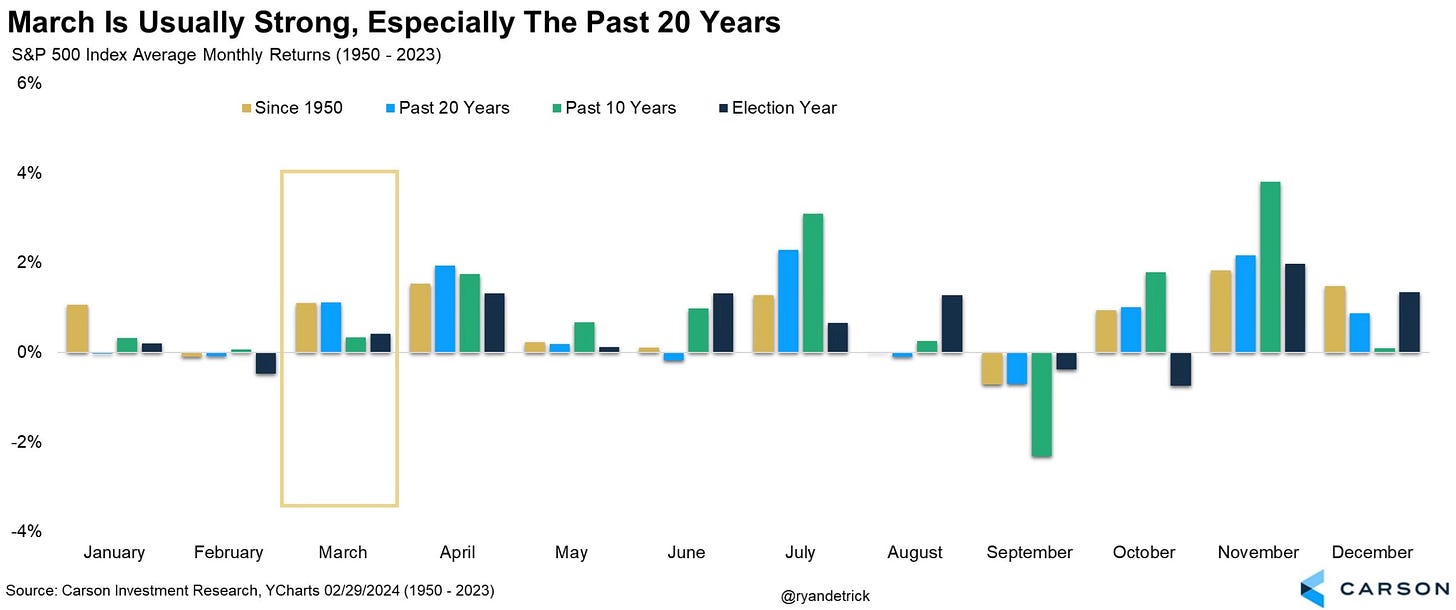
As we get into March, this is historically one of the better months of the year for the S&P 500. Over the past 20 years March has been the 4th best performing month of the year.
Downside Signals?
There are so many positives in the market while we continue to sit at all-time highs week after week. We have bullish things to point to all over the place. Sentiment, returns and historical data all show the bull market likely continuing to dominate and heading higher.
I researched to try and see if there are any downside signals that stuck out to me. I did find some data and charts that raised my curiosity a bit. Here are a few of them.
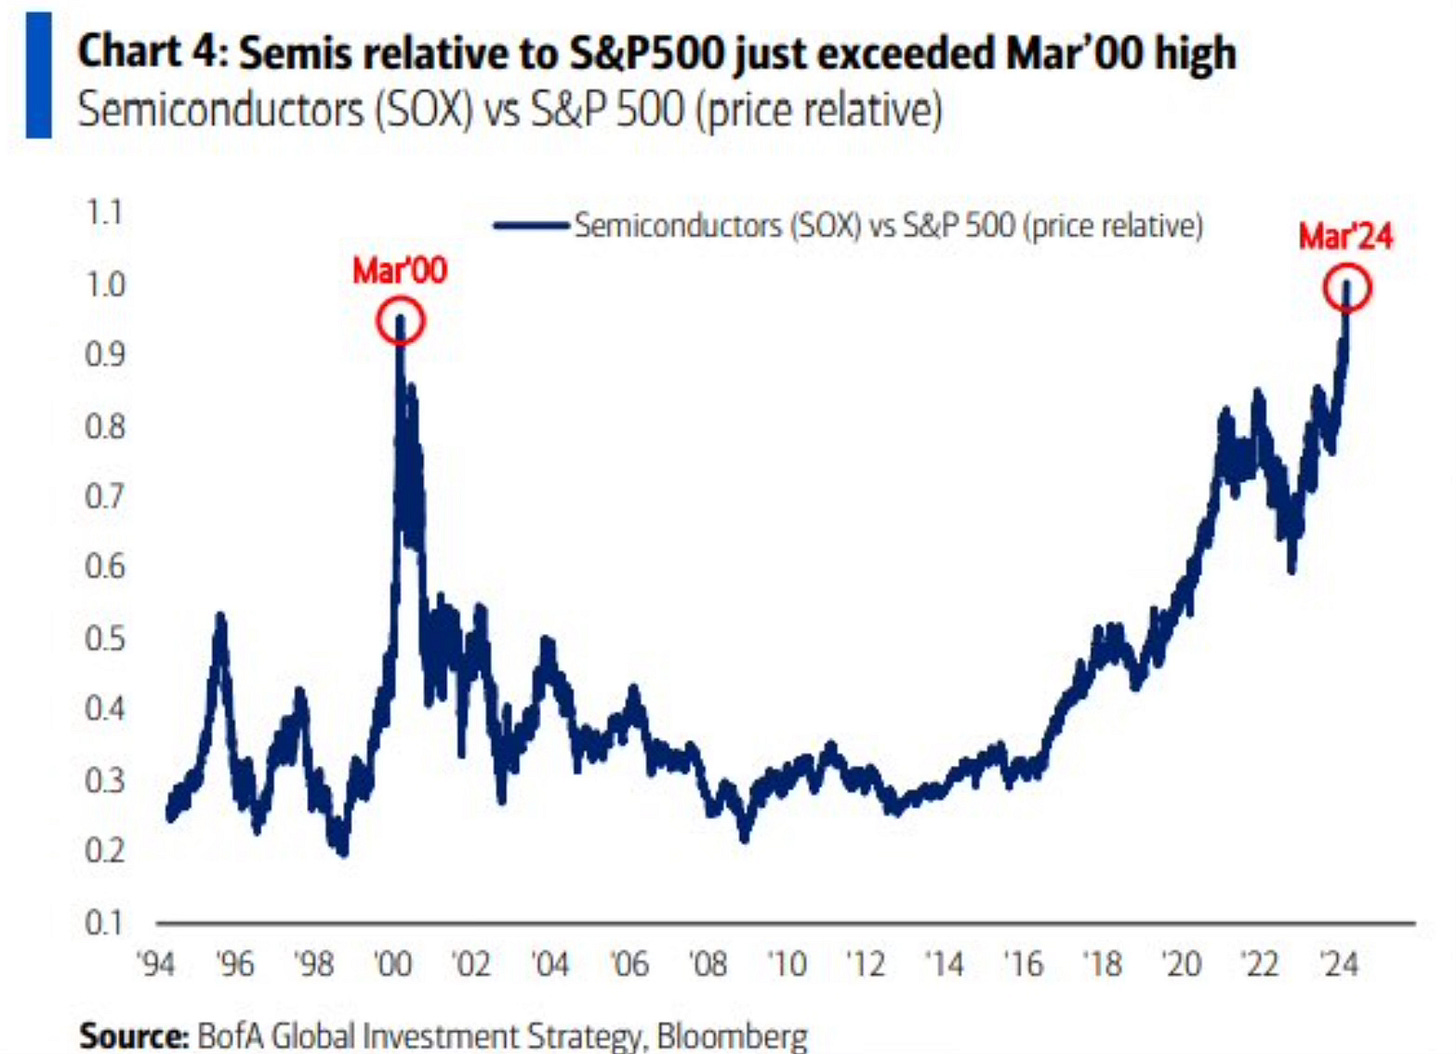
We know about the out of this world increase in Nvidia of late. But the entire semiconductors sector have surged as well. So much so that semis relative to the S&P 500 has now reached a level that just surpassed where it was in March 2000.
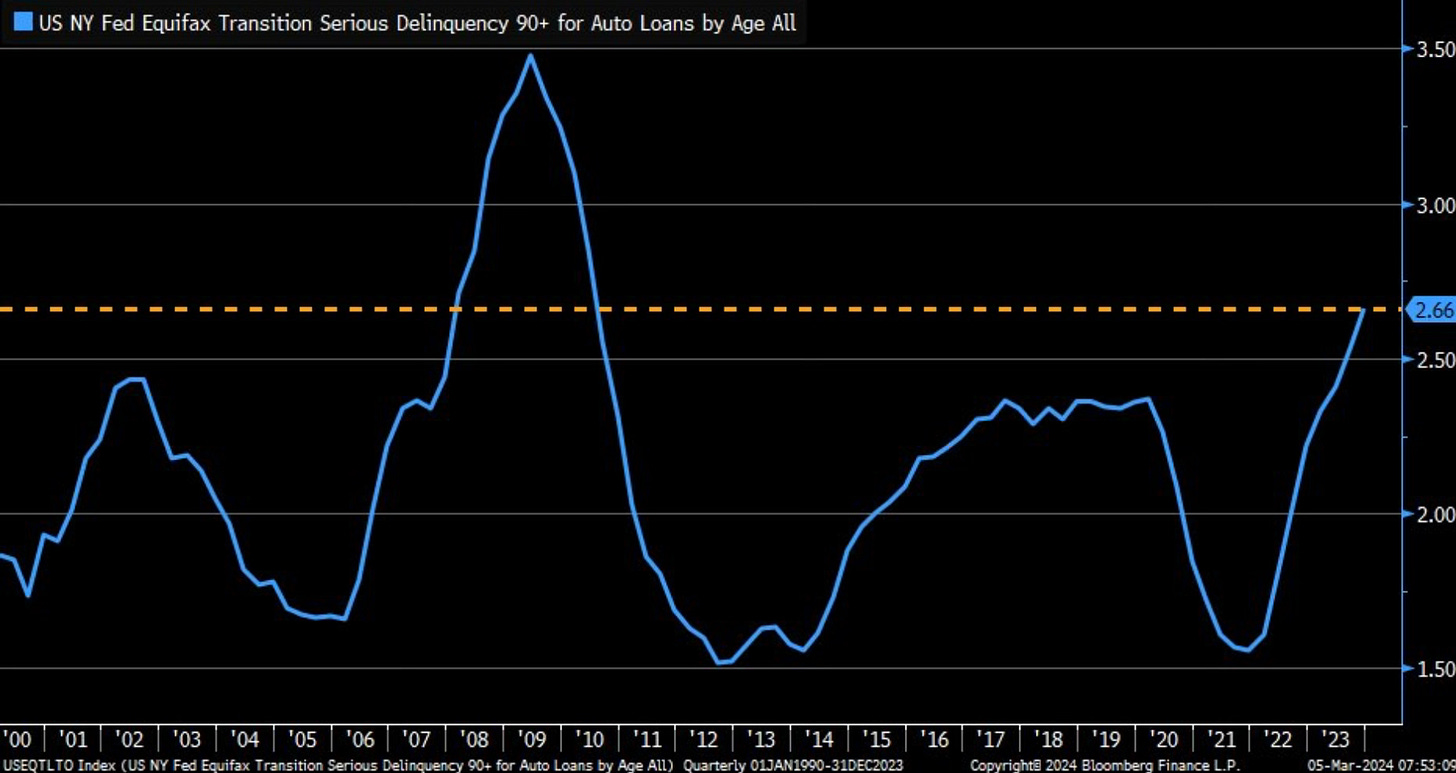
Serious delinquencies (90+ days) for auto loans rose 2.6%. That’s important because that’s the highest level since Q2 of 2010.
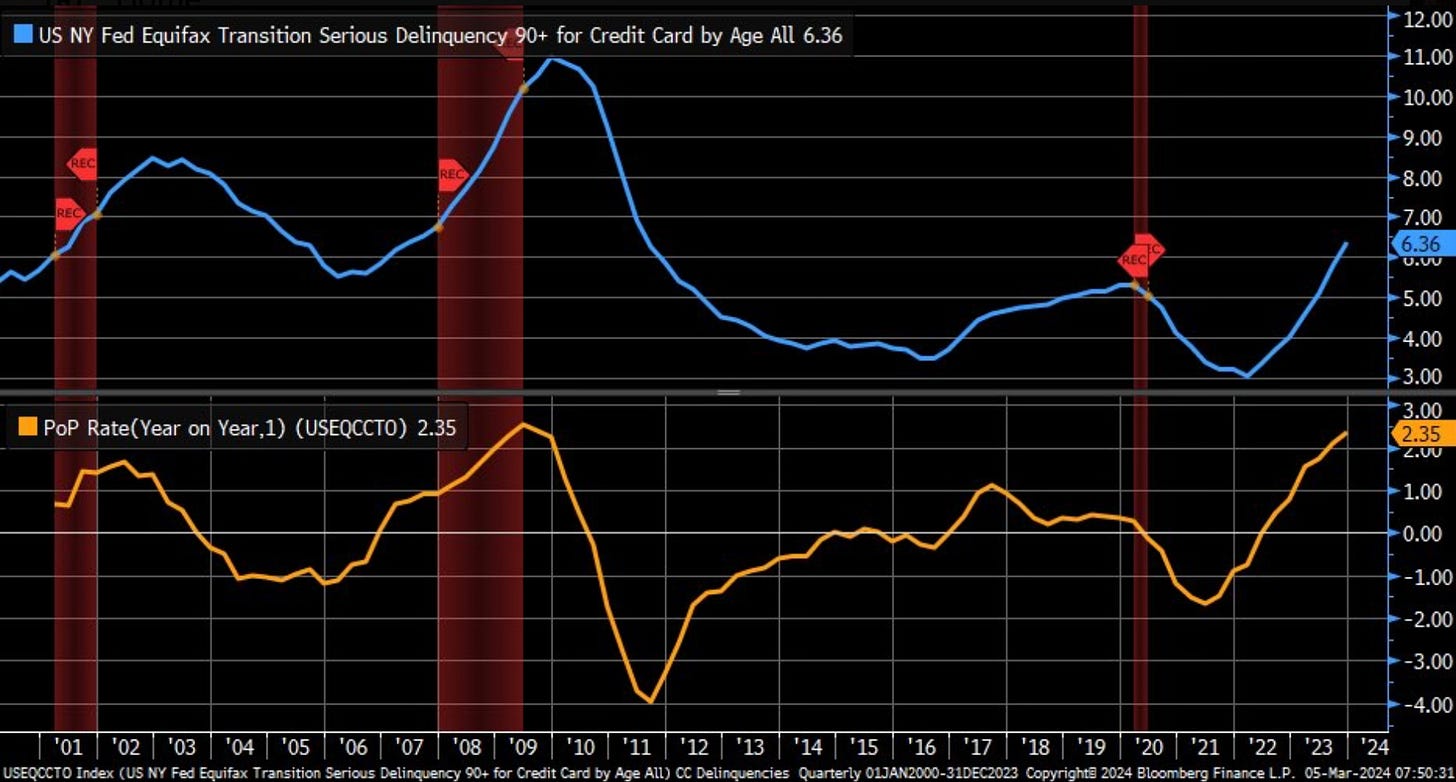
The credit card serious delinquency rate (90+ days) has also ticked higher. It’s now at the highest level since Q2 2011.
This chart shows the credit card delinquency rates by state.

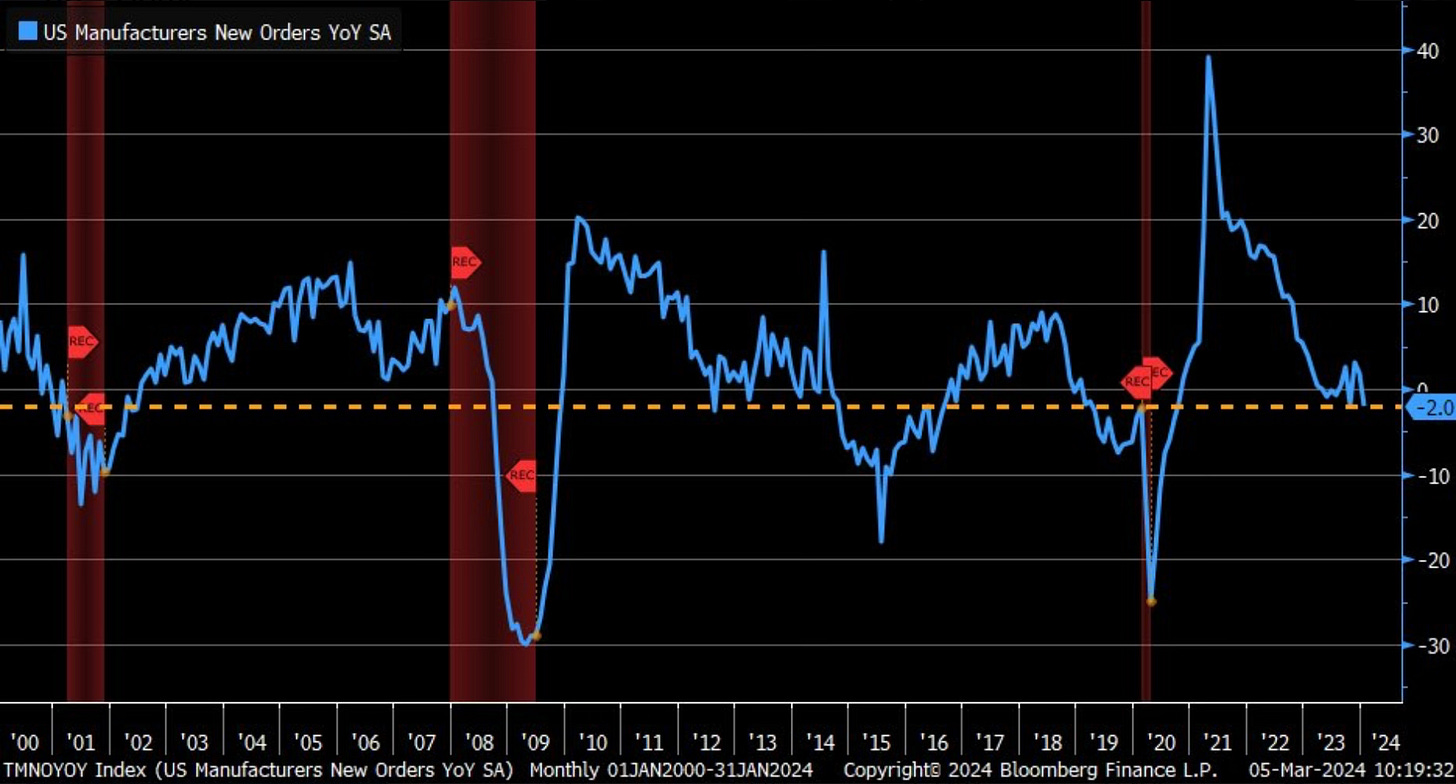
Year-over-year new factory order continue to dip. I’m watching this as this could give an early indication on any possible layoffs or increase to the all important unemployment rate.
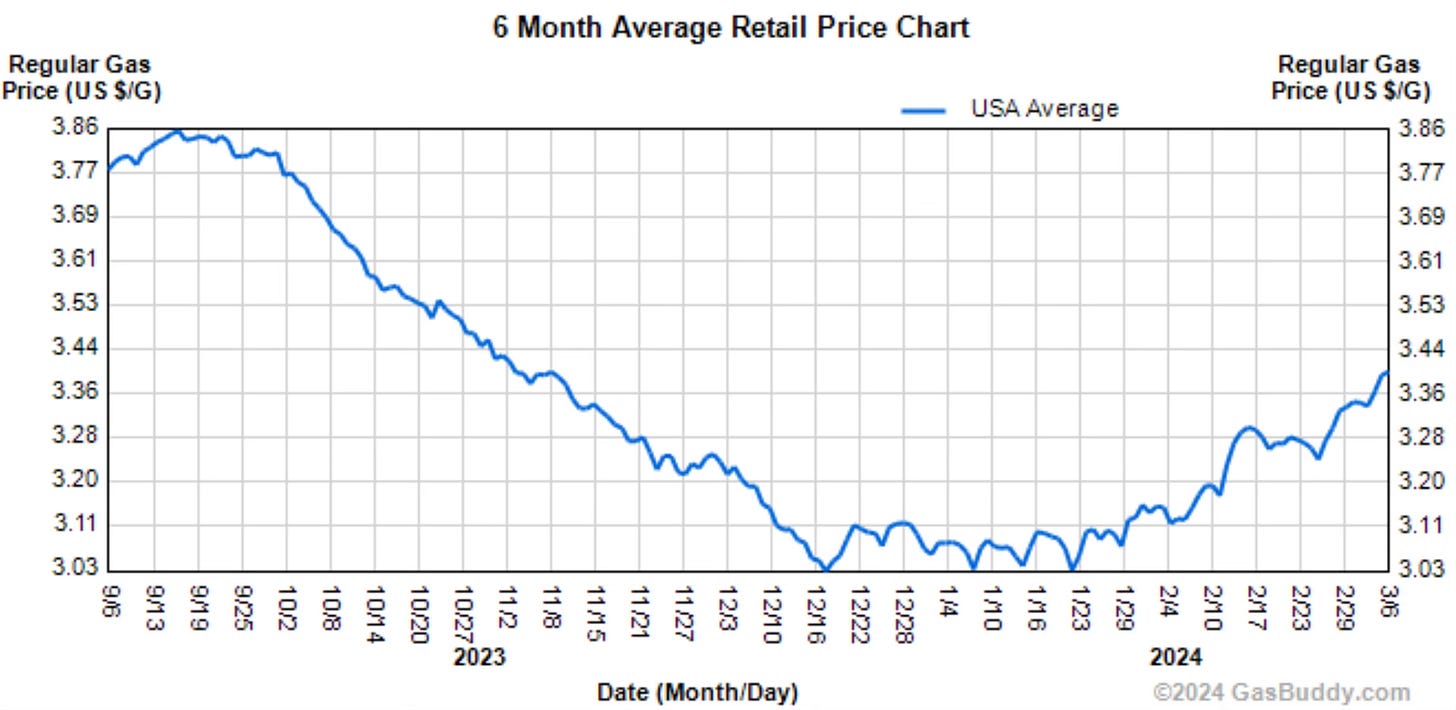
Something that I think has risen and gone under the radar is the increase in gasoline prices. US gasoline prices are now at the highest level since November.
And sometimes there is just too many people on one side of the boat. Investors can get too bullish or too bearish. Right now we are reaching overly bullish levels where that side of the boat gets to be over loaded creating possible risks.
The Economy Is Not Slowing
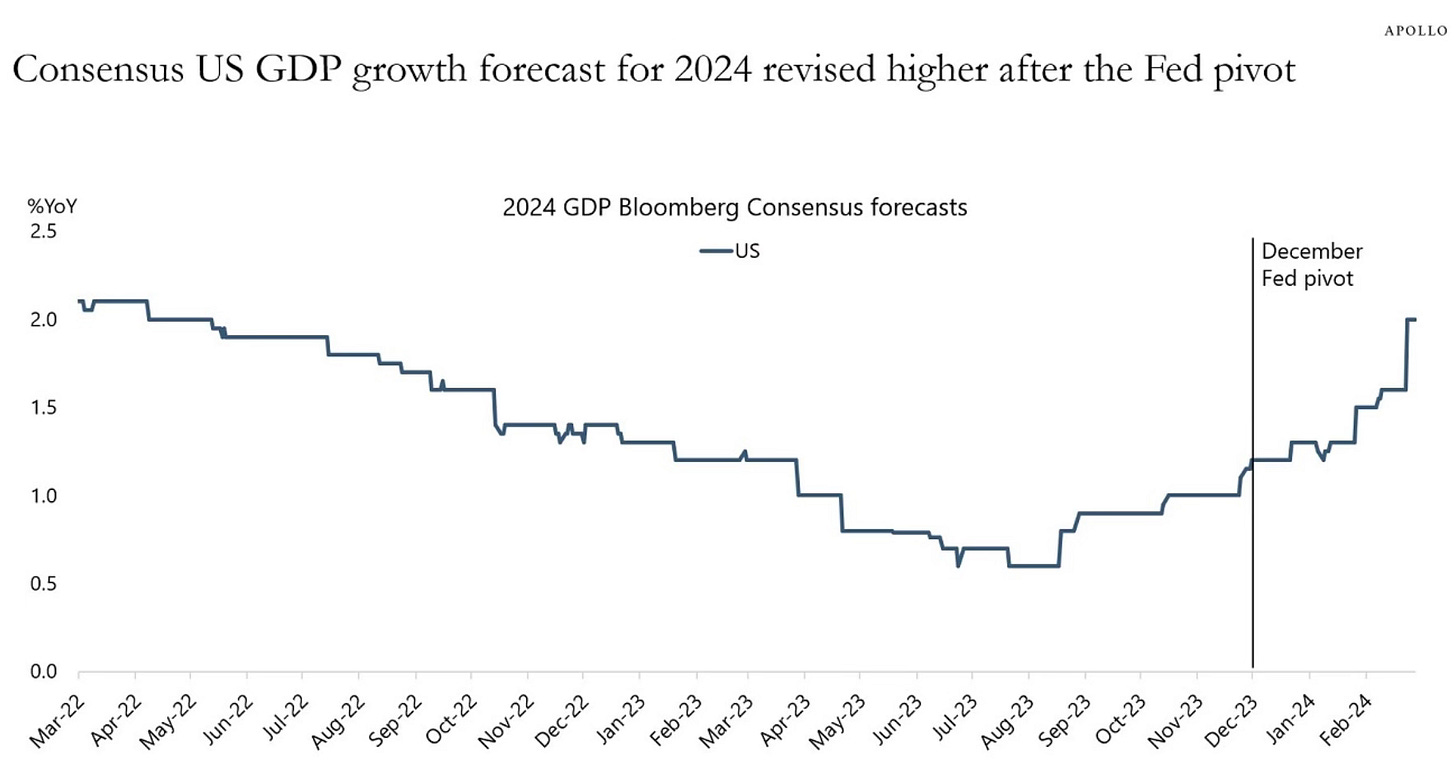
Contrary to what you hear or what people say, the economy is not slowing down. In fact it’s accelerating. A clear sign of that and what’s ahead recently came from Apollo's Torsten Slok. This is from his note, The Fed Will Not Cut Rates in 2024.
"The reality is that the US economy is simply not slowing down, and the Fed pivot has provided a strong tailwind to growth since December. The bottom line is that the Fed will spend most of 2024 fighting inflation."
The unemployment report which came out Friday showed little budge in the unemployment rate. It still remains under 4%. It’s been under 4% for 25 straight months.

We’re also continuing to see historical low layoffs. Anyone that says layoffs are way up aren’t looking at the data or are misinformed.
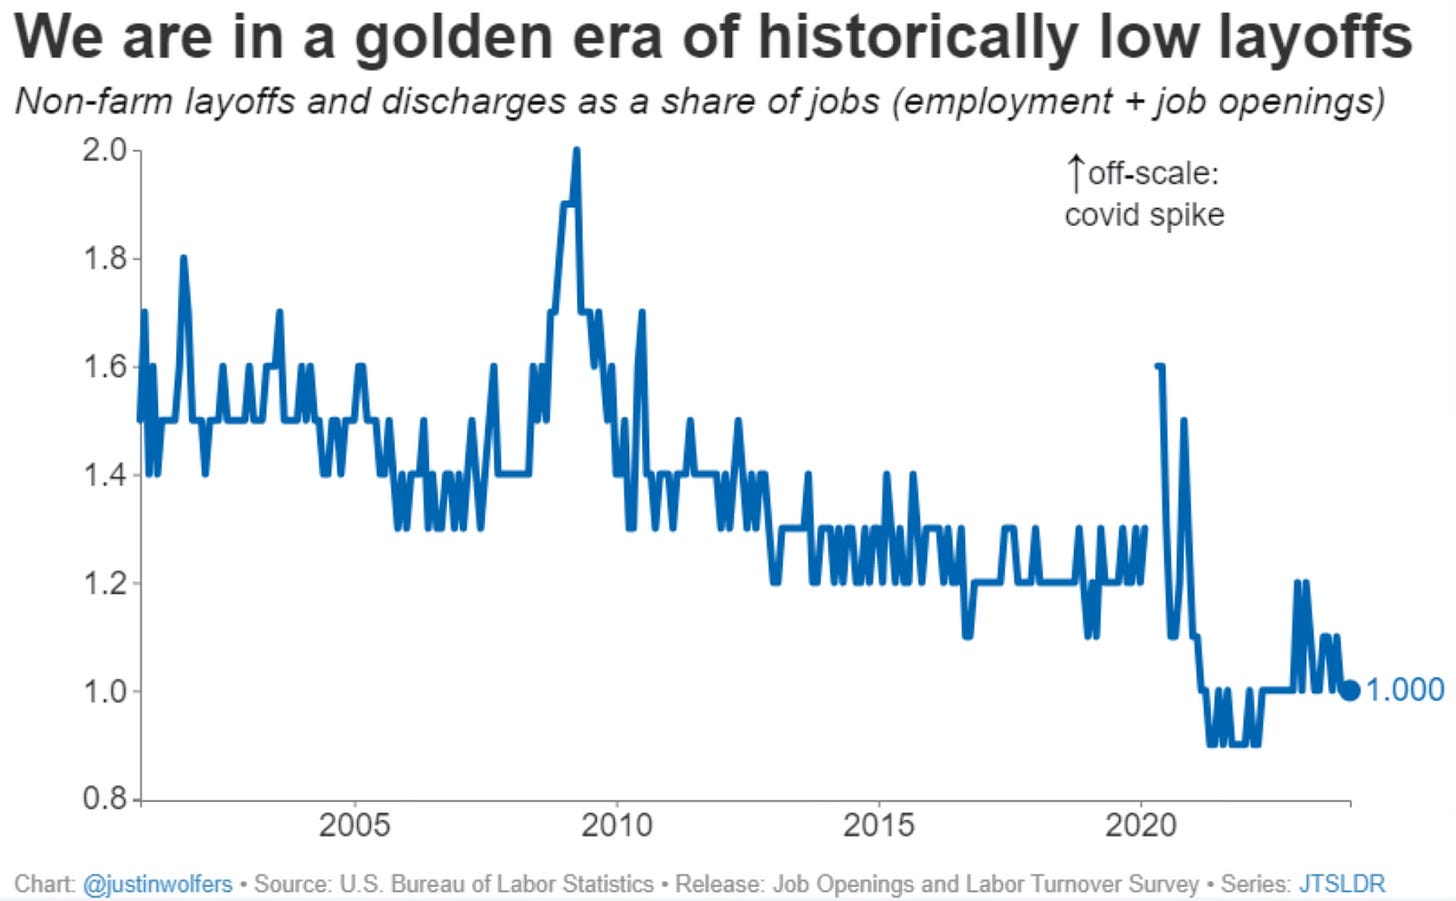
Can the labor market really get any stronger than this? It’s at historic levels and I don’t know if we will see it get any better than it is right now.
Allocation To Stocks Rise As Retail Investors Sell
The allocation to US stocks is at the highest level since November of 2021. Again, when I talk about everyone being on one side of the boat this is another example. People feel comfortable investing as the stock market is making all-time highs.
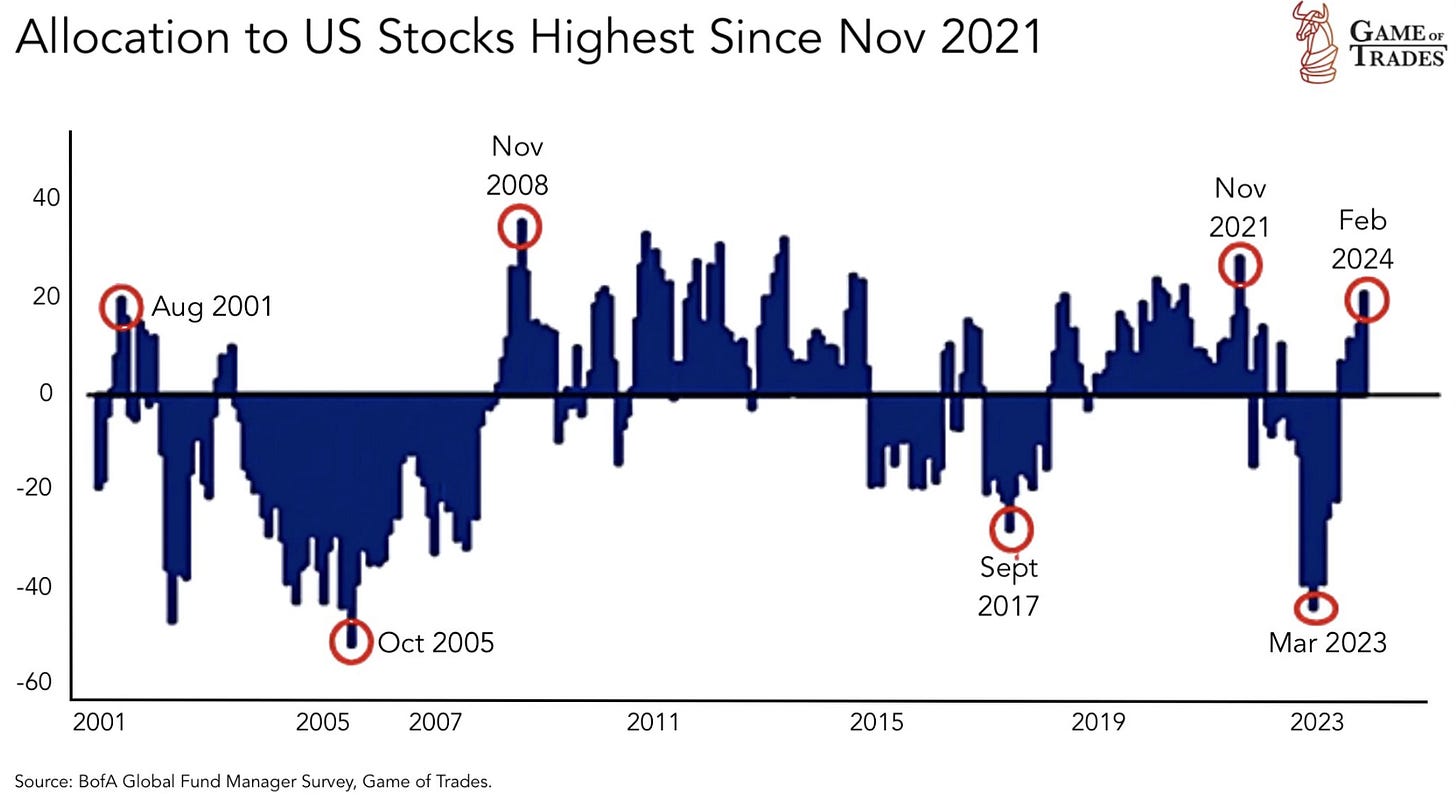
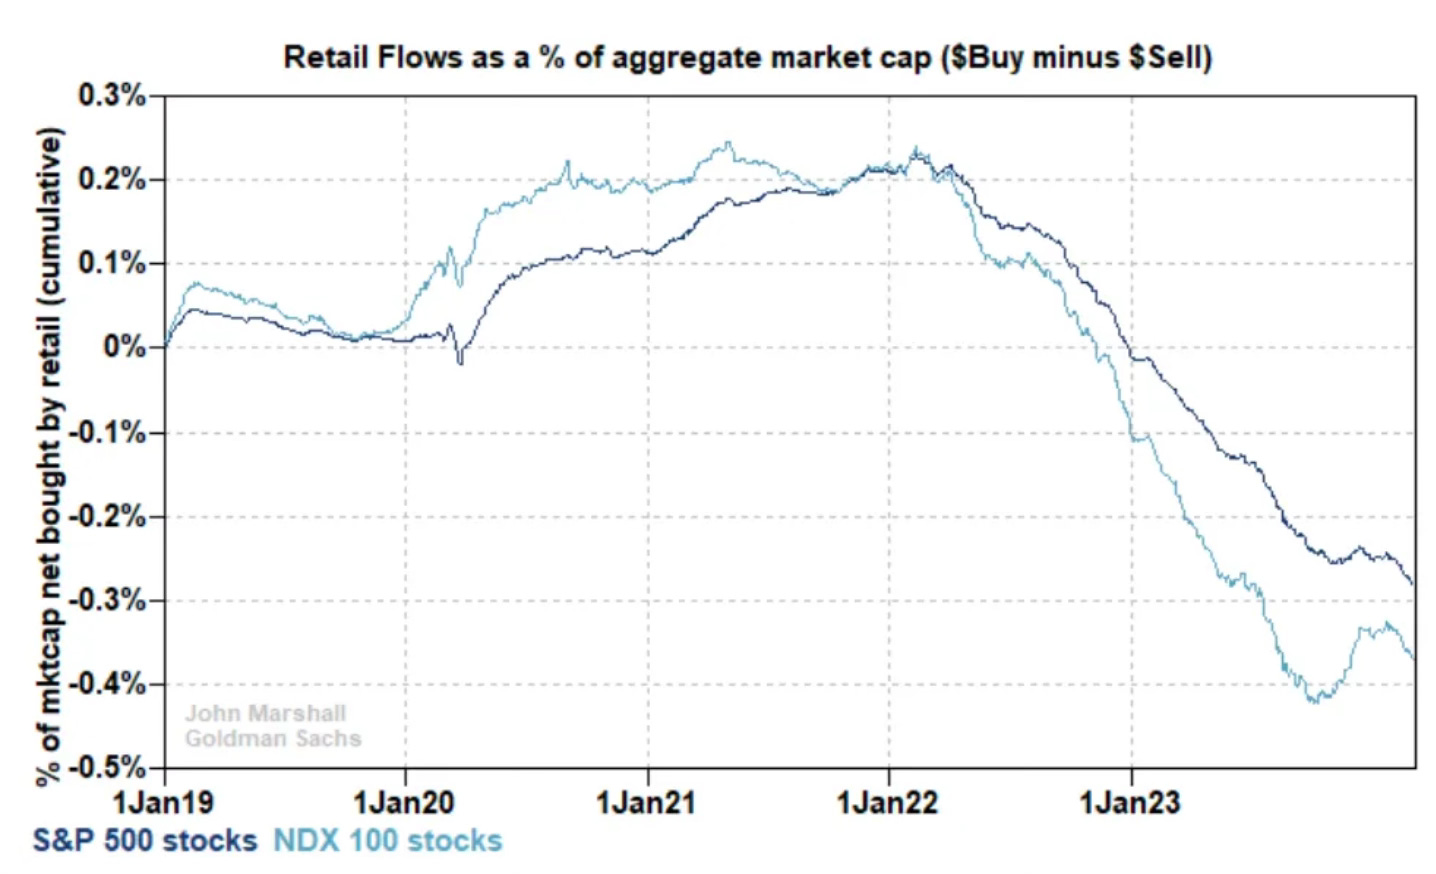
The interesting thing to this is that retail investors have been net sellers since February according to Goldman Sachs. As this giant run continues, retail investors continue to be sellers. I’m bookmarking this as things that stuck as signals about possibly being at a current cycle top.
Moves I’ve Made
Alphabet The stock that Spilled Coffee readers guessed correctly that I bought was Alphabet. It must have been too obvious since it was one of my 3 stock picks for this year. Investing Update: 3 Stocks For 2024.
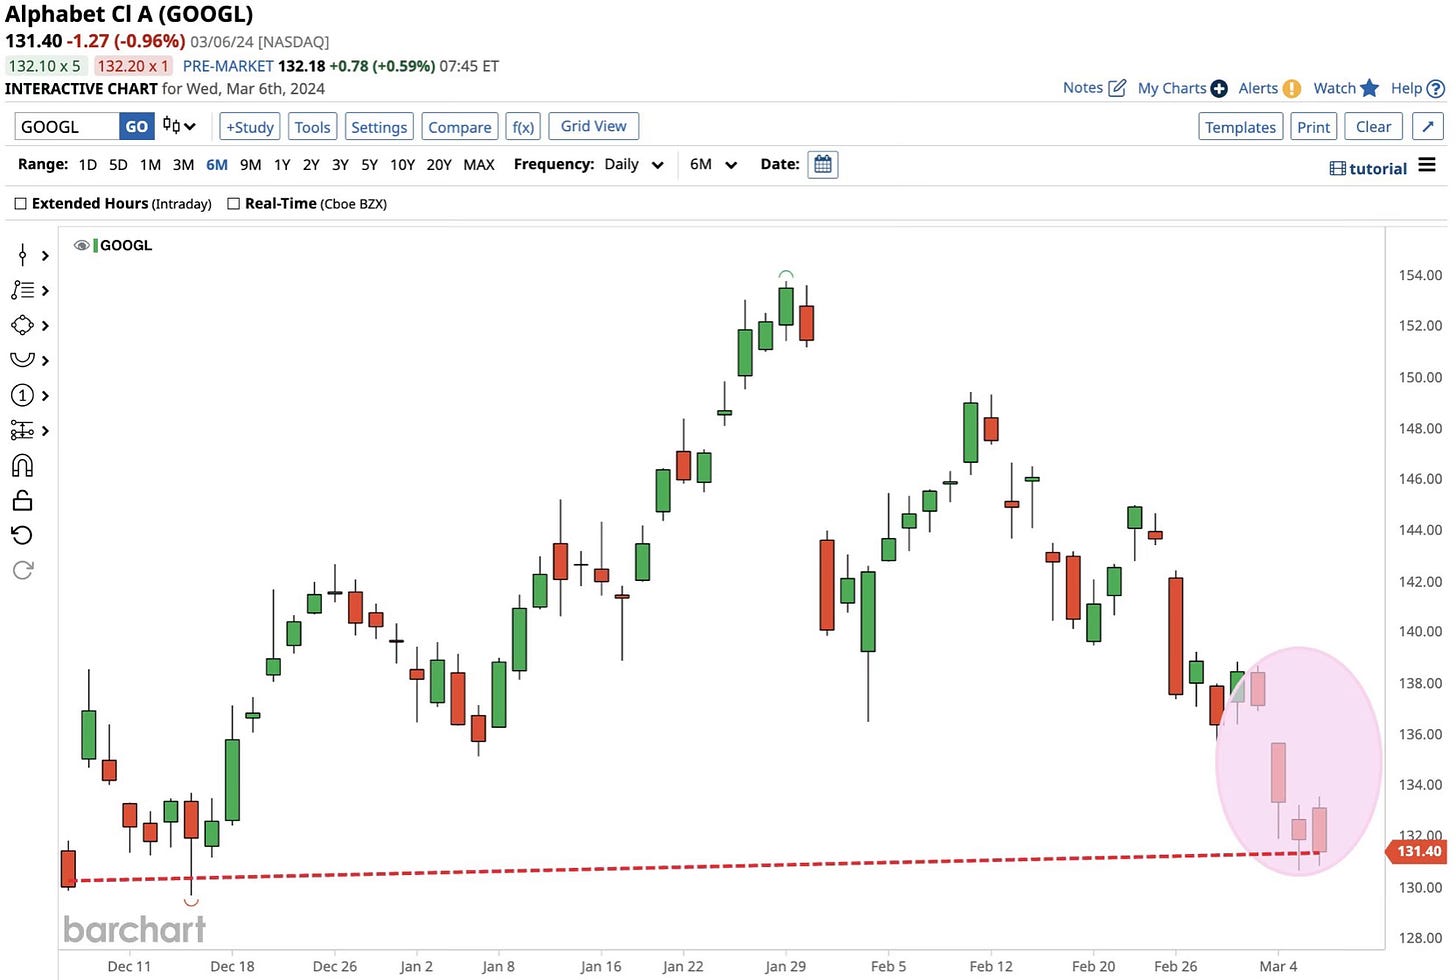
I bought shares at $132. This is the same level where I had bought shares back in January at $135 a share. It’s a level I feel the stock is simply just too darn cheap at with a Forward P/E of 17.5 with over $80B in net income.
Of the Mag 7 stocks it’s still much cheaper than the other 6. Here are the Forward P/E of the Mag 7 stocks.
Alphabet 17.50
Meta 20.90
Apple 25.38
Nvidia 26.37
Microsoft 30.49
Amazon 32.22
Tesla 47.65
I also believe this is a short term bottom. The AI rollout has been a disaster. It’s had constant problem but reminds me of the short term problems that Meta faced in 2022 when it was in a giant drawdown and recovered to rally. Plus it was one of my 3 stock picks for the year. So it better turn around!
The chart looks tough with a lot of red of late. It’s sitting right at its 200/day moving average.
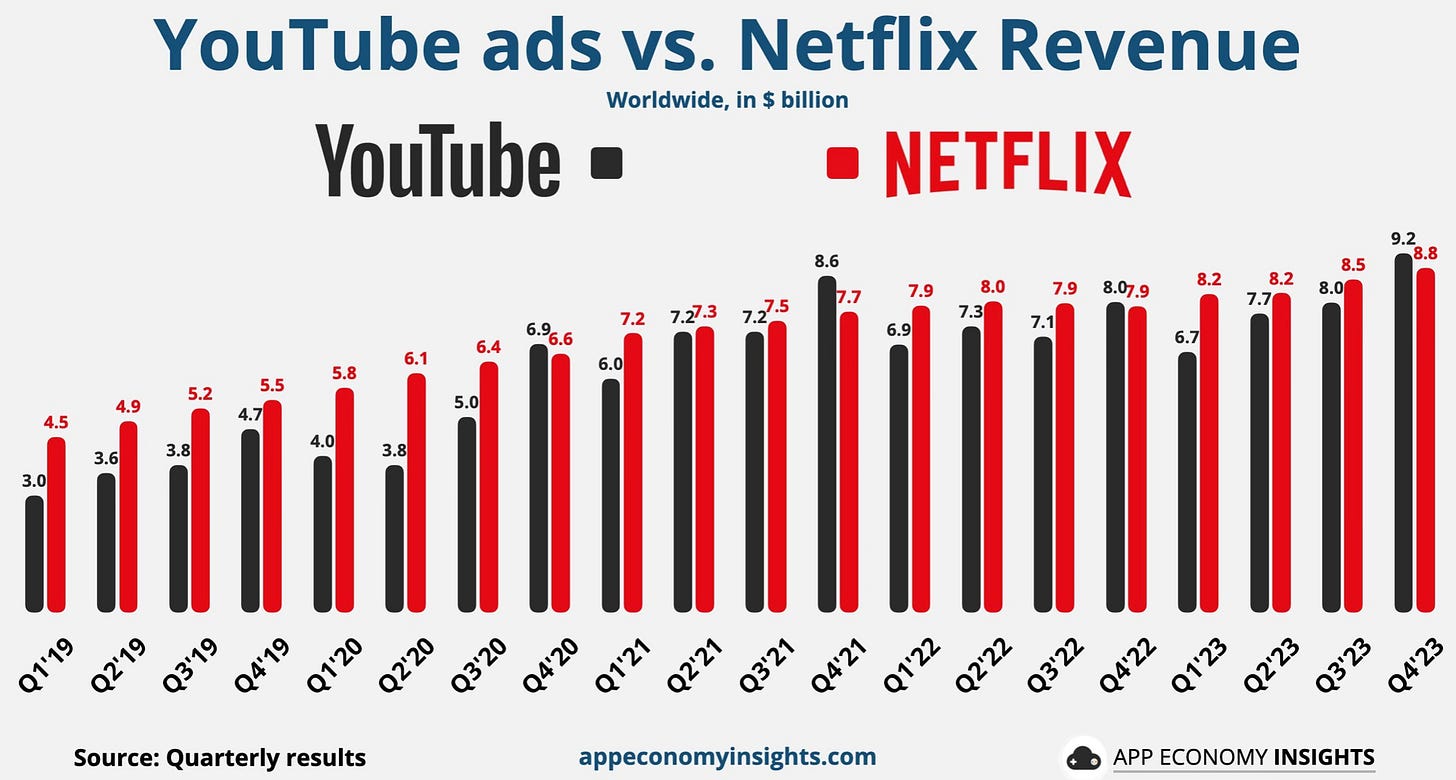
This was a chart that I came across recently that further instills my belief in that YouTube is the most overlooked area of Alphabet and one of the most under realized area of any of the mega-cap tech stock. With this type comparison again Netflix what is YouTube alone worth? Far more than I think Wall Street is giving it credit for.
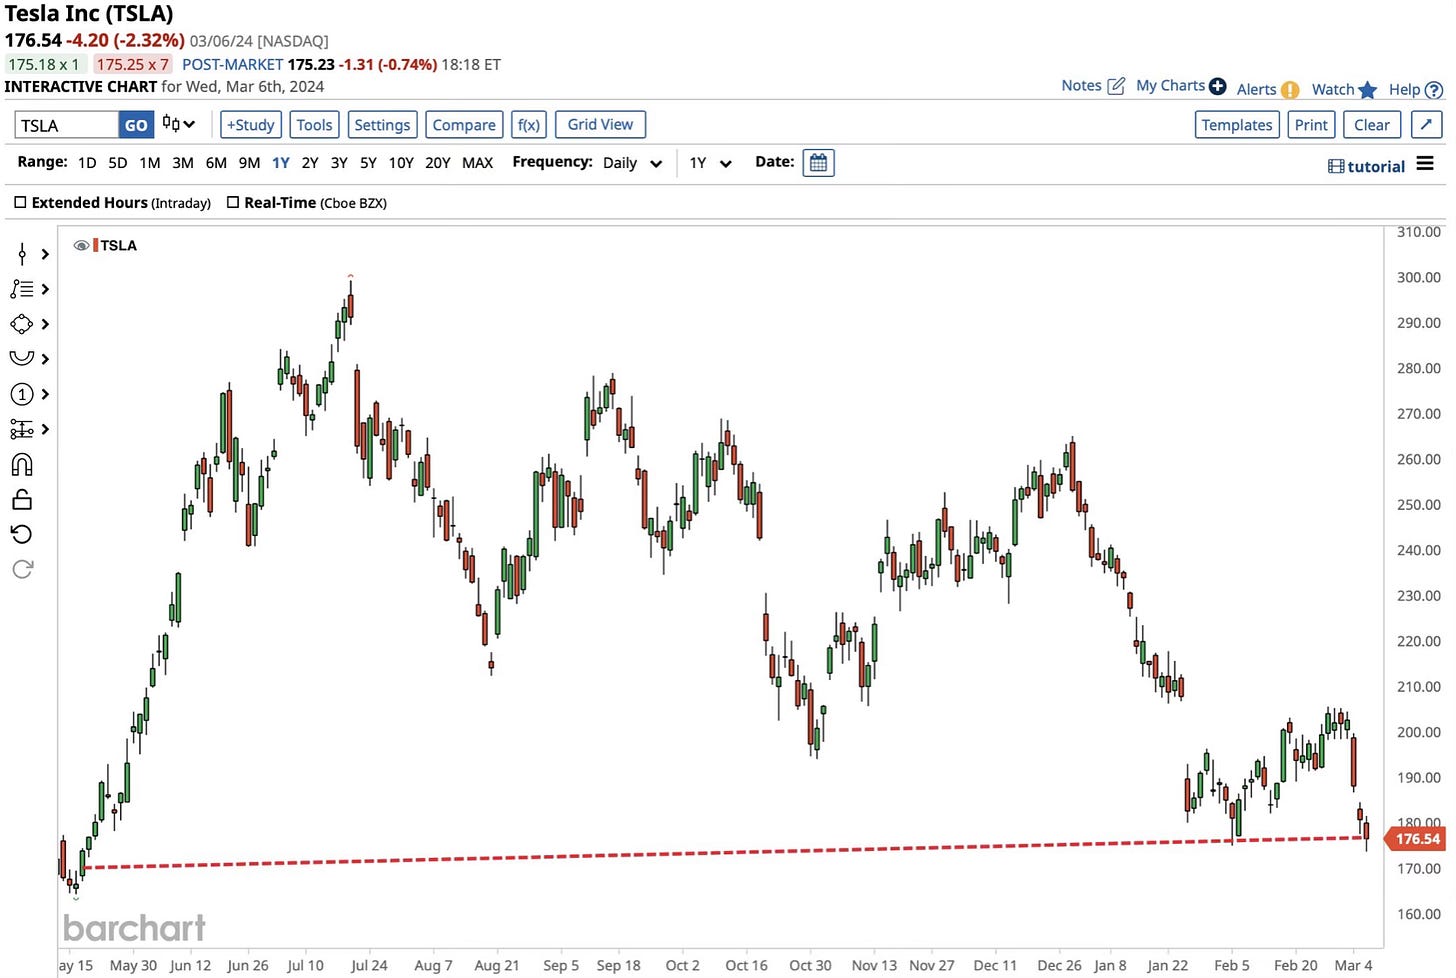
Tesla My other stock buy that nobody guessed was Tesla. Yes I know it has had a terrible year. To date it’s now the 4th worst performing S&P 500 stock. It’s the worst performer of the Mag 7. A lot has gone wrong and it’s led to a steep selloff. I’m a long term believer in what Tesla has coming and it’s continued innovation. So I added more shares at $180. This is the same level where I had last bought in January at $189 a share.
Similar to Alphabet the chart looks ugly. It hit the lowest level since May.
We can see in this chart just how rough of a go Alphabet and Tesla have had. In addition Apple is right in the same boat. I don’t think you can go wrong buying any of these three at these levels. I currently have positions in all three. They’re presenting a buying opportunity. Do you really think a year from now these three stocks won’t be higher than they are today?
Upcoming Earnings
The Coffee Table ☕
I’ve read a number of stories on the future of homeowners/property insurance and this has been the most researched and in depth pieces I’ve read. It’s going to be really interesting to see what the future holds for all forms of property insurance. Uncovered: A Hidden Crisis In US Housing. Tip of the hat to some great reporting by the Bloomberg team of Leslie Kaufman, Saijel Kishan and Nadia Lopez.
This post from Ryan Detrick had so many good charts that I wanted to share that I thought it was best to share the entire article on charts and tables to know for the upcoming election year. A lot of great stuff in this one. 16 Charts (and Tables) to Know This Election Year. Both Ryan and Sonu Varghese from Carson Group have been putting out some great content lately. Be sure you’re following what they’re doing.
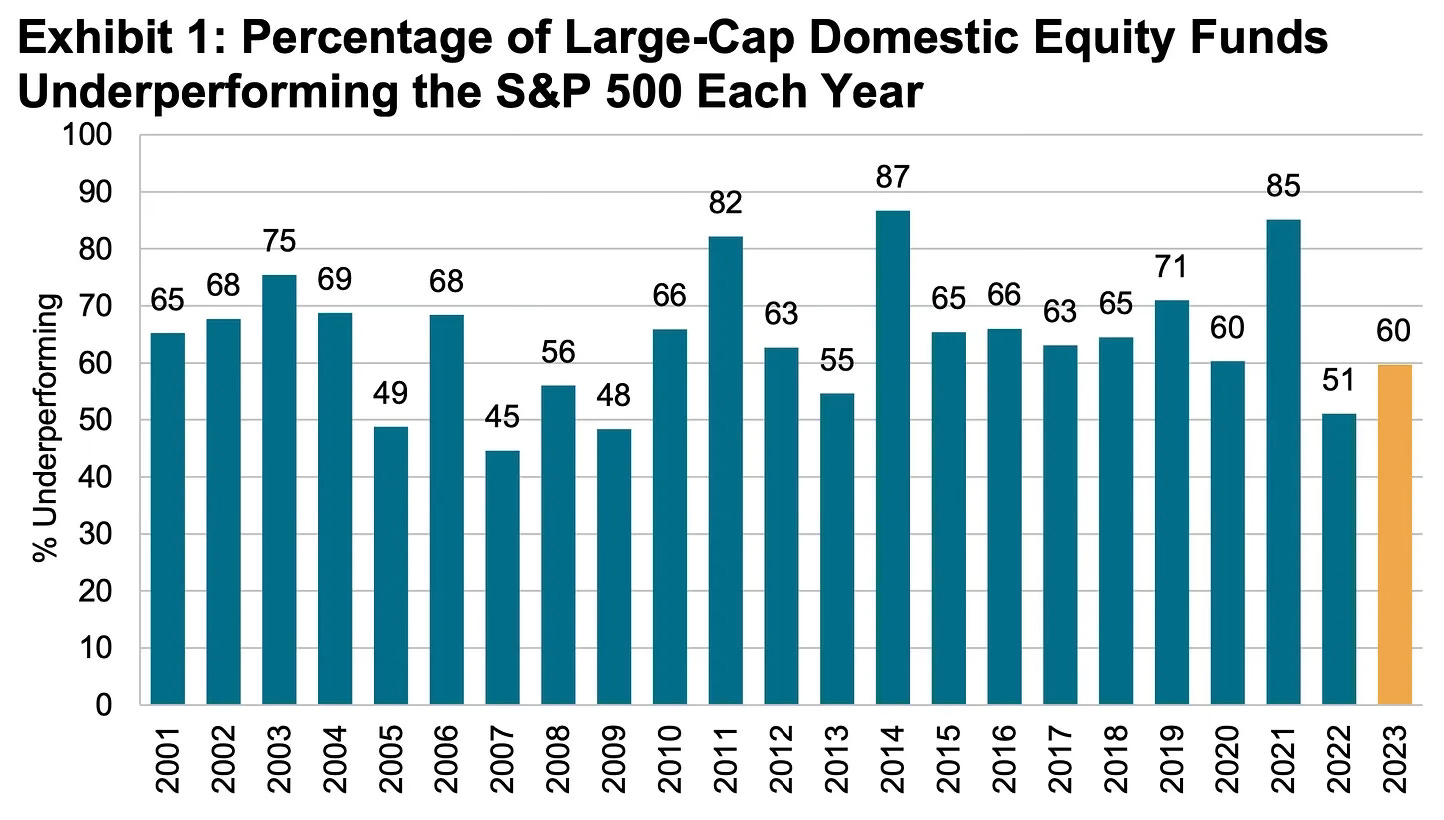
I enjoyed this post from Sam Ro, CFA of TKer by Sam Ro called Most stock-picking pros underperform in 2023’s market recovery. He reminds us just how hard it is even for professionals to beat the S&P 500. Here is a wonderful chart from his piece showing the percentage of funds that underperform the S&P 500 each year.
Thank you for reading! If you enjoyed Spilled Coffee, please subscribe.
Spilled Coffee grows through word of mouth. Please consider sharing this post with someone who might appreciate it.
Order my book, Two-Way Street below.

