
Investing Update: Hard Not To Be Bullish
What I'm buying, selling & watching
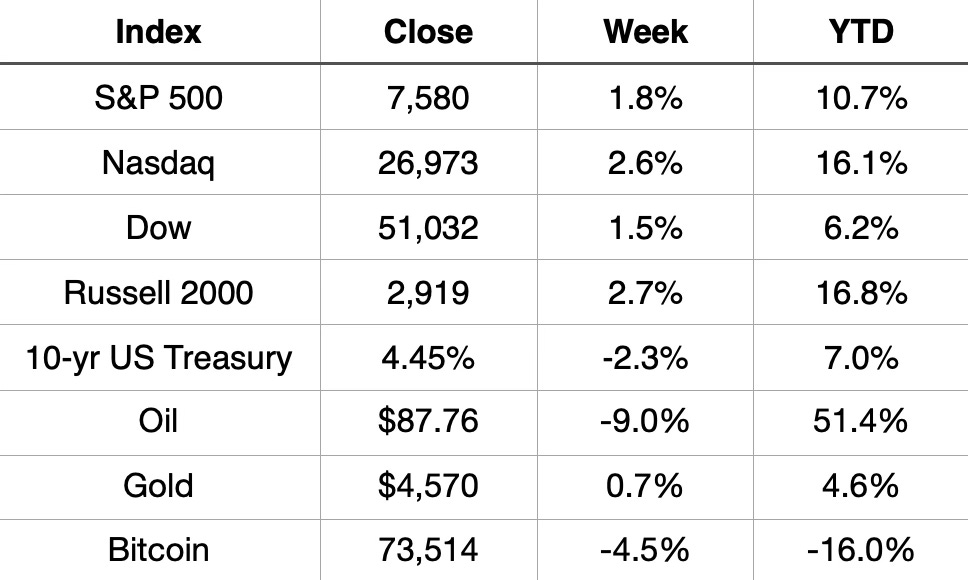
The S&P 500 closed the week at 7,580, up 1.8% on the week and now up 10.7% on the year. The Nasdaq had an even better week, gaining 2.6% and is up 16.1% YTD. The Russell 2000 was the real star again, up 2.7% for the week and up 16.8% for the year. The Dow gained 1.5% for the week and sits up 6.2% on the year. Oil had a rough week, dropping 9.0%, though it remains up a remarkable 51.4% on the year. The 10-year Treasury yield dropped, gold ticked slightly higher, and Bitcoin continued to struggle, falling 4.5% on the week and sitting down 16% on the year.
Market Recap
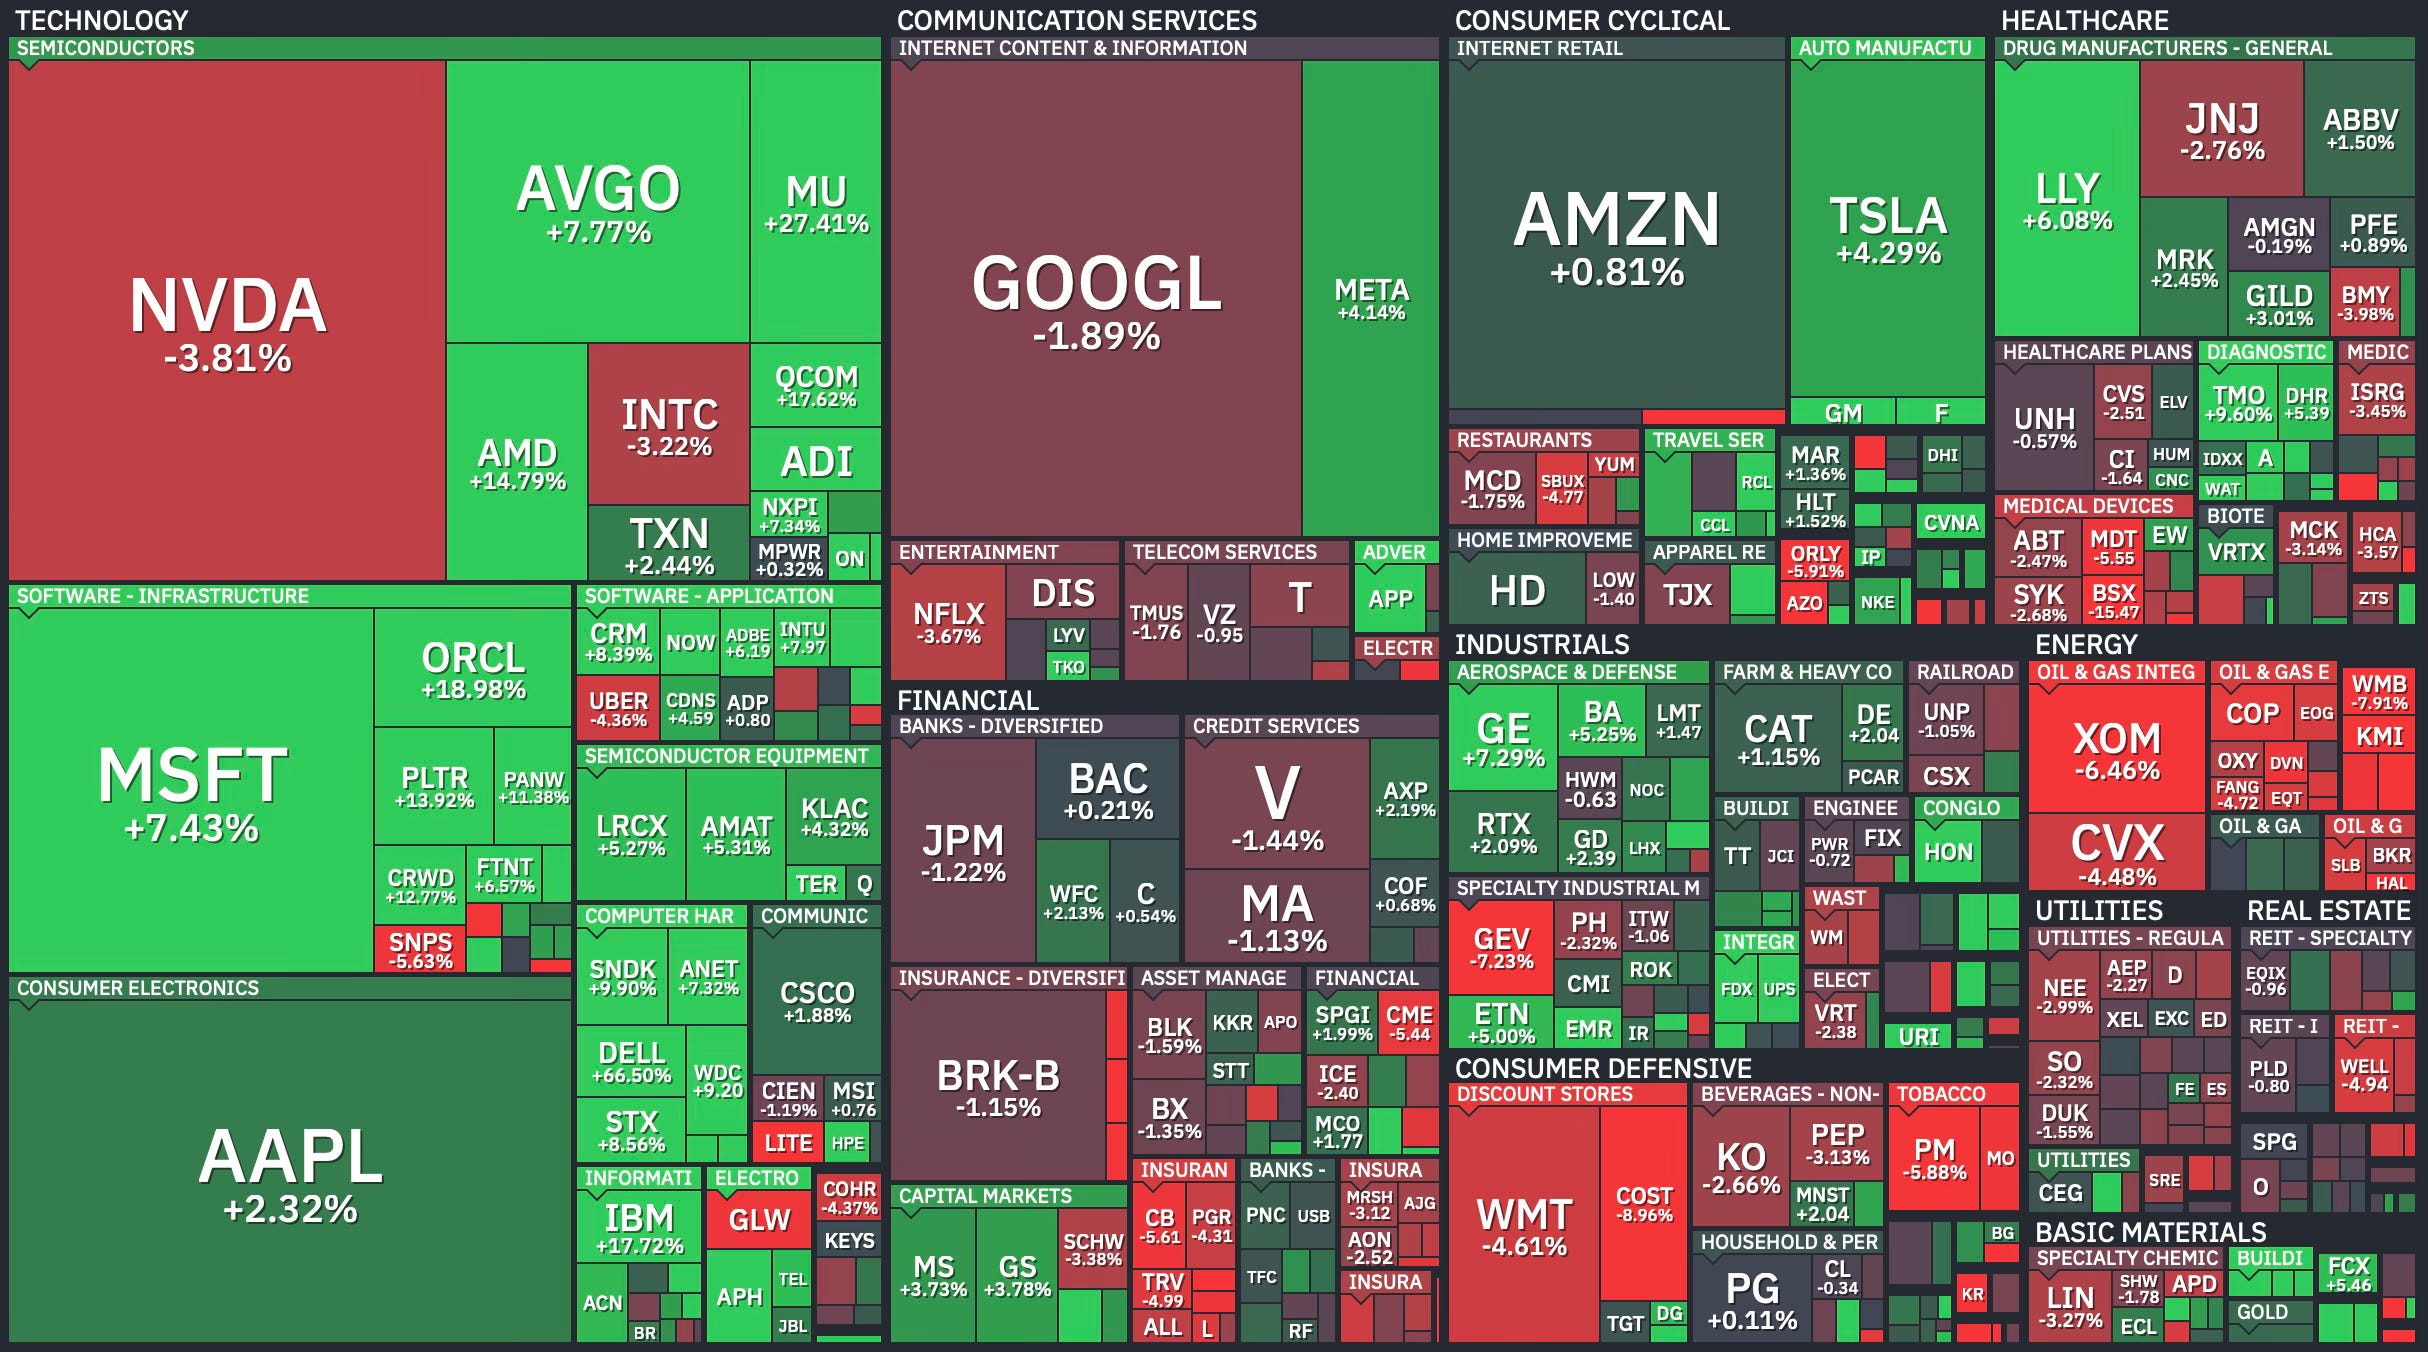
Weekly Heat Map Of Stocks
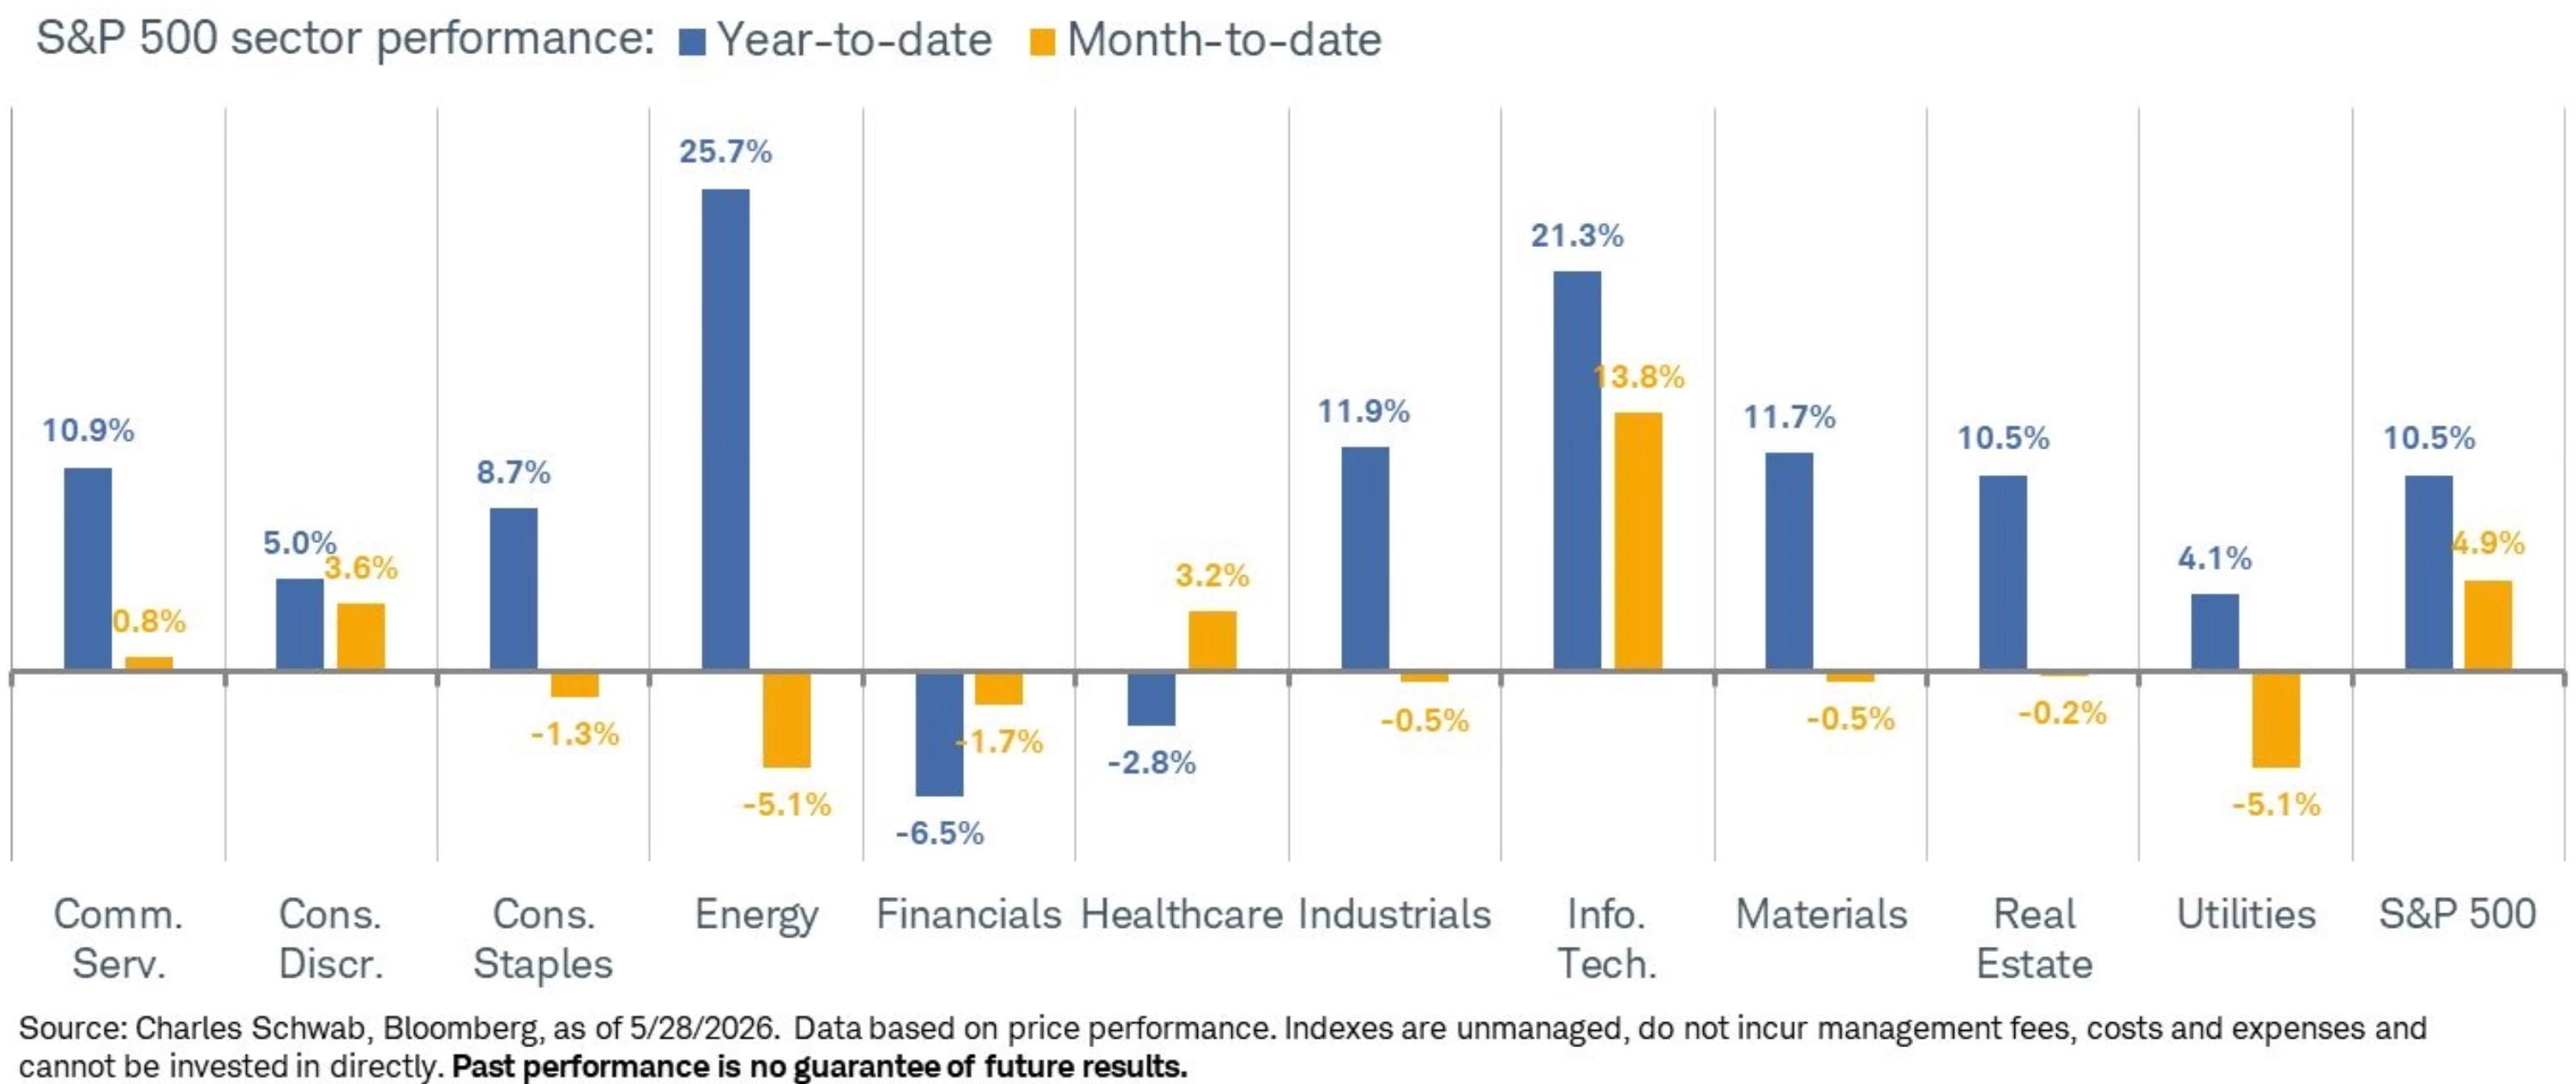
On the sector side, tech continues to lead everything. Info Tech is up 21.3% on the year and put up a massive 13.8% just in May. Energy is the other standout, up 25.7% YTD, though it was the worst sector in May, falling 5.1%. Financials and Utilities also had tough months. Healthcare quietly had a solid May, up 3.2%.
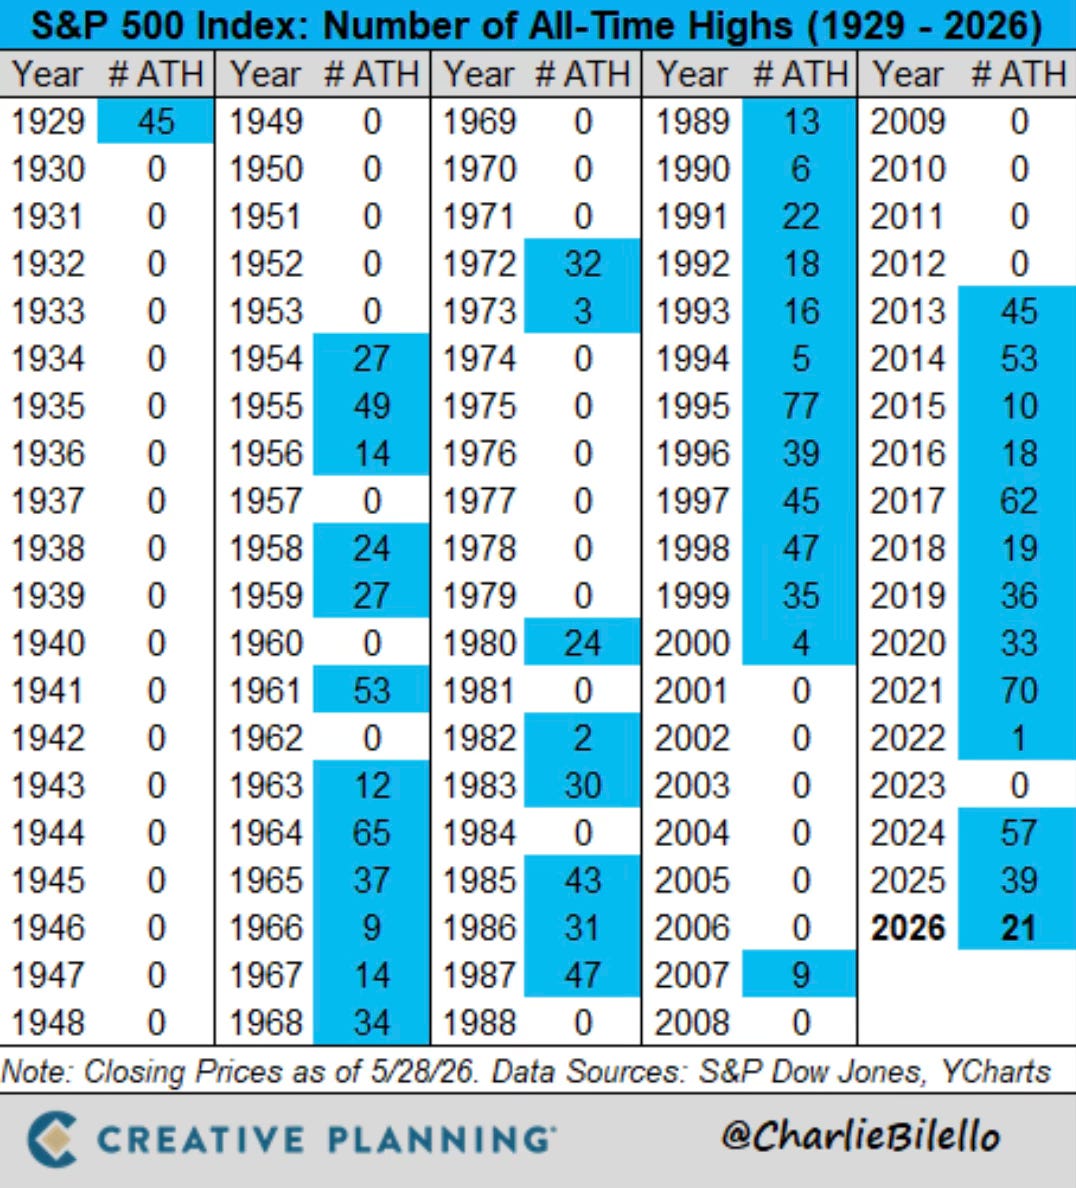
The S&P 500 has already hit 21 new all-time highs in 2026. Through late May, that puts this year on pace with some of the strongest ATH years in history. For context, 2024 had 57. We have seven months to go.
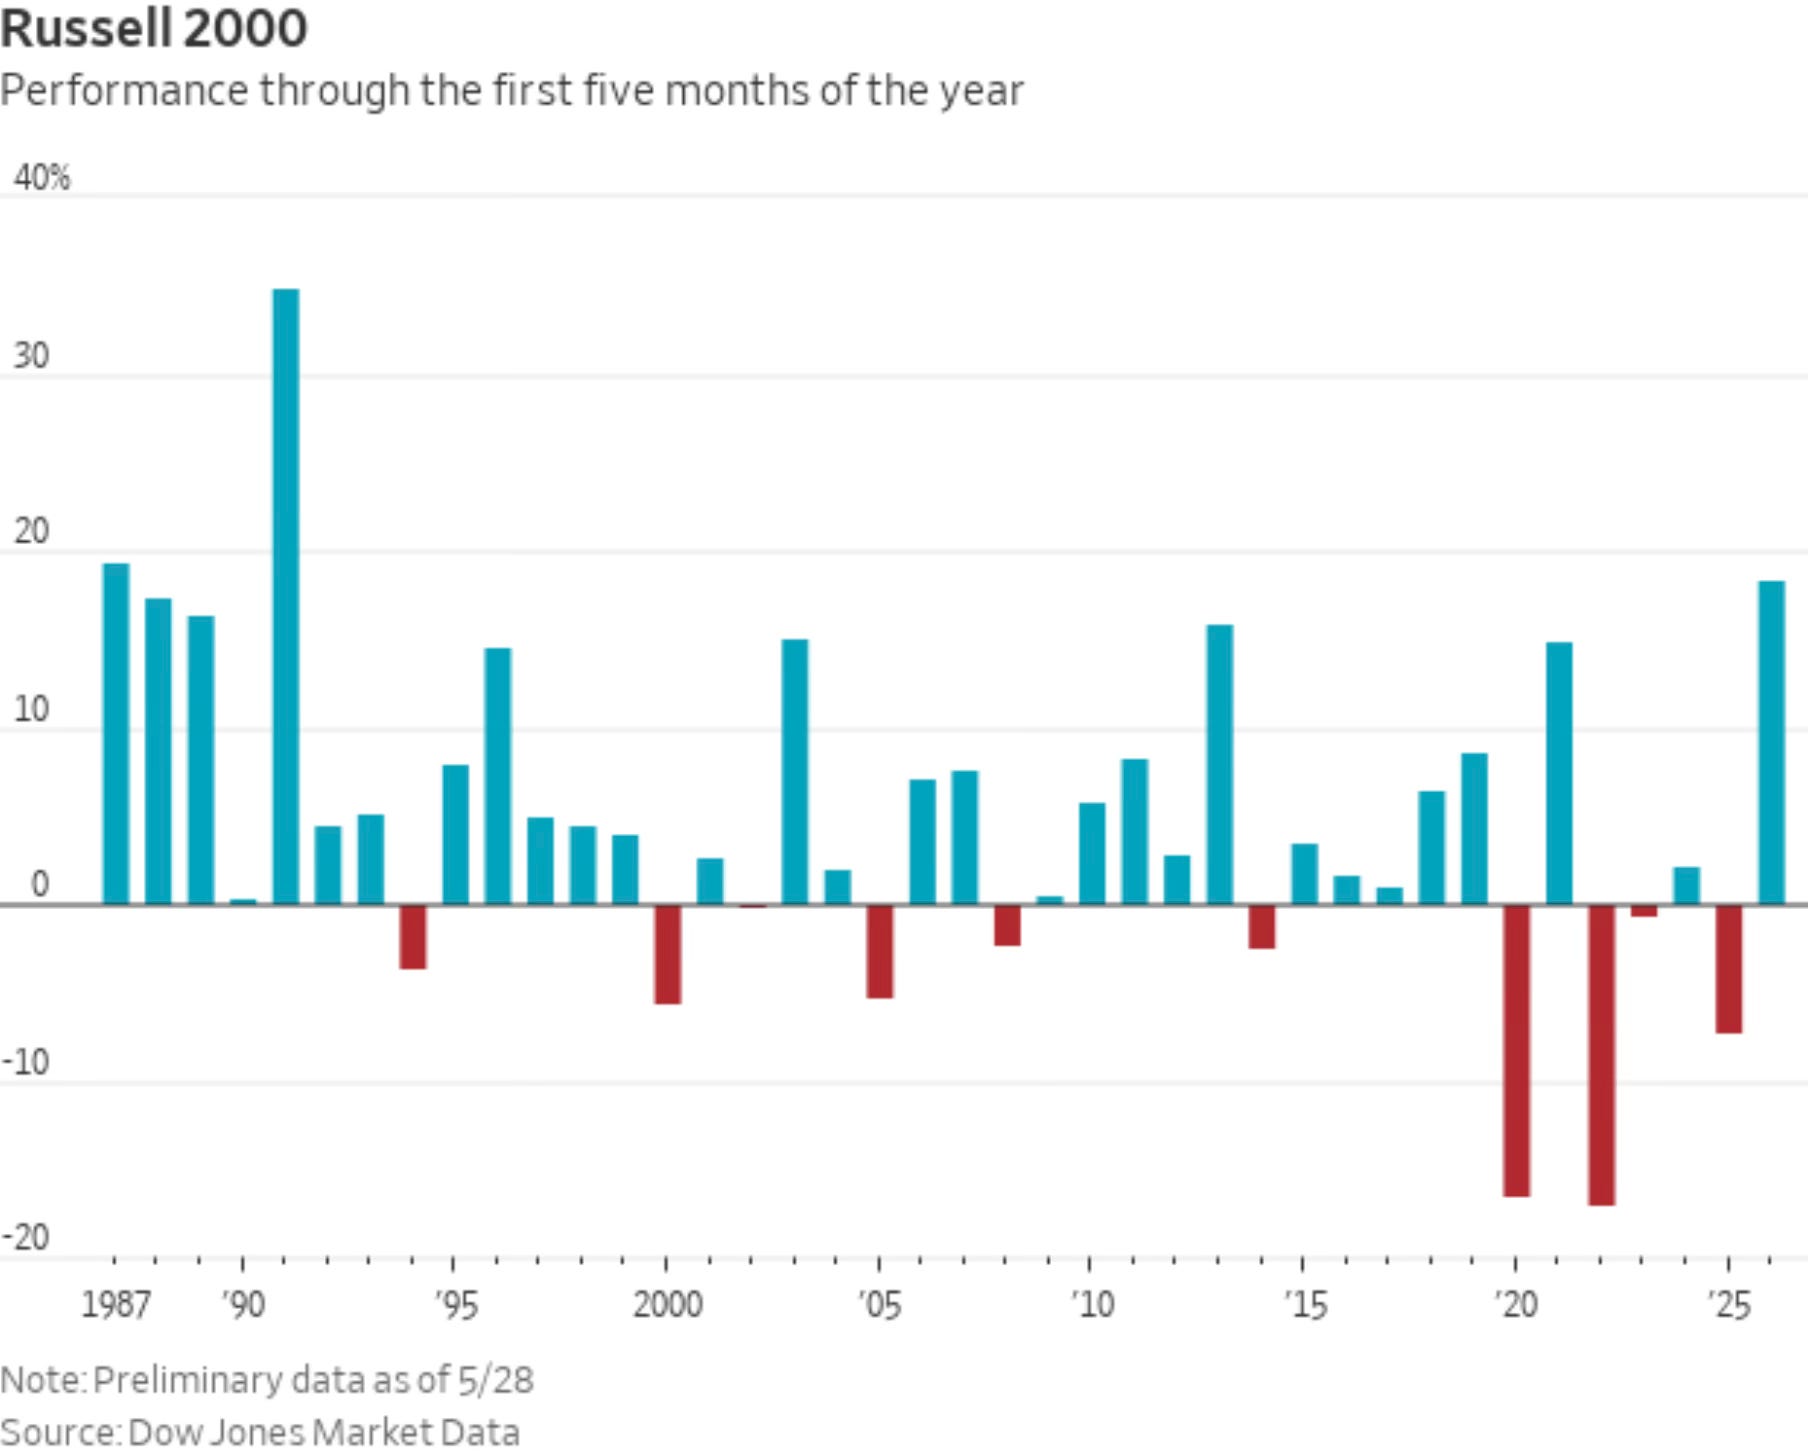
The Russell 2000 deserves its own callout. Small caps are up about 18% through the first five months of the year. That is the best start since 1991. And it is outperforming the S&P, Dow, and Nasdaq.
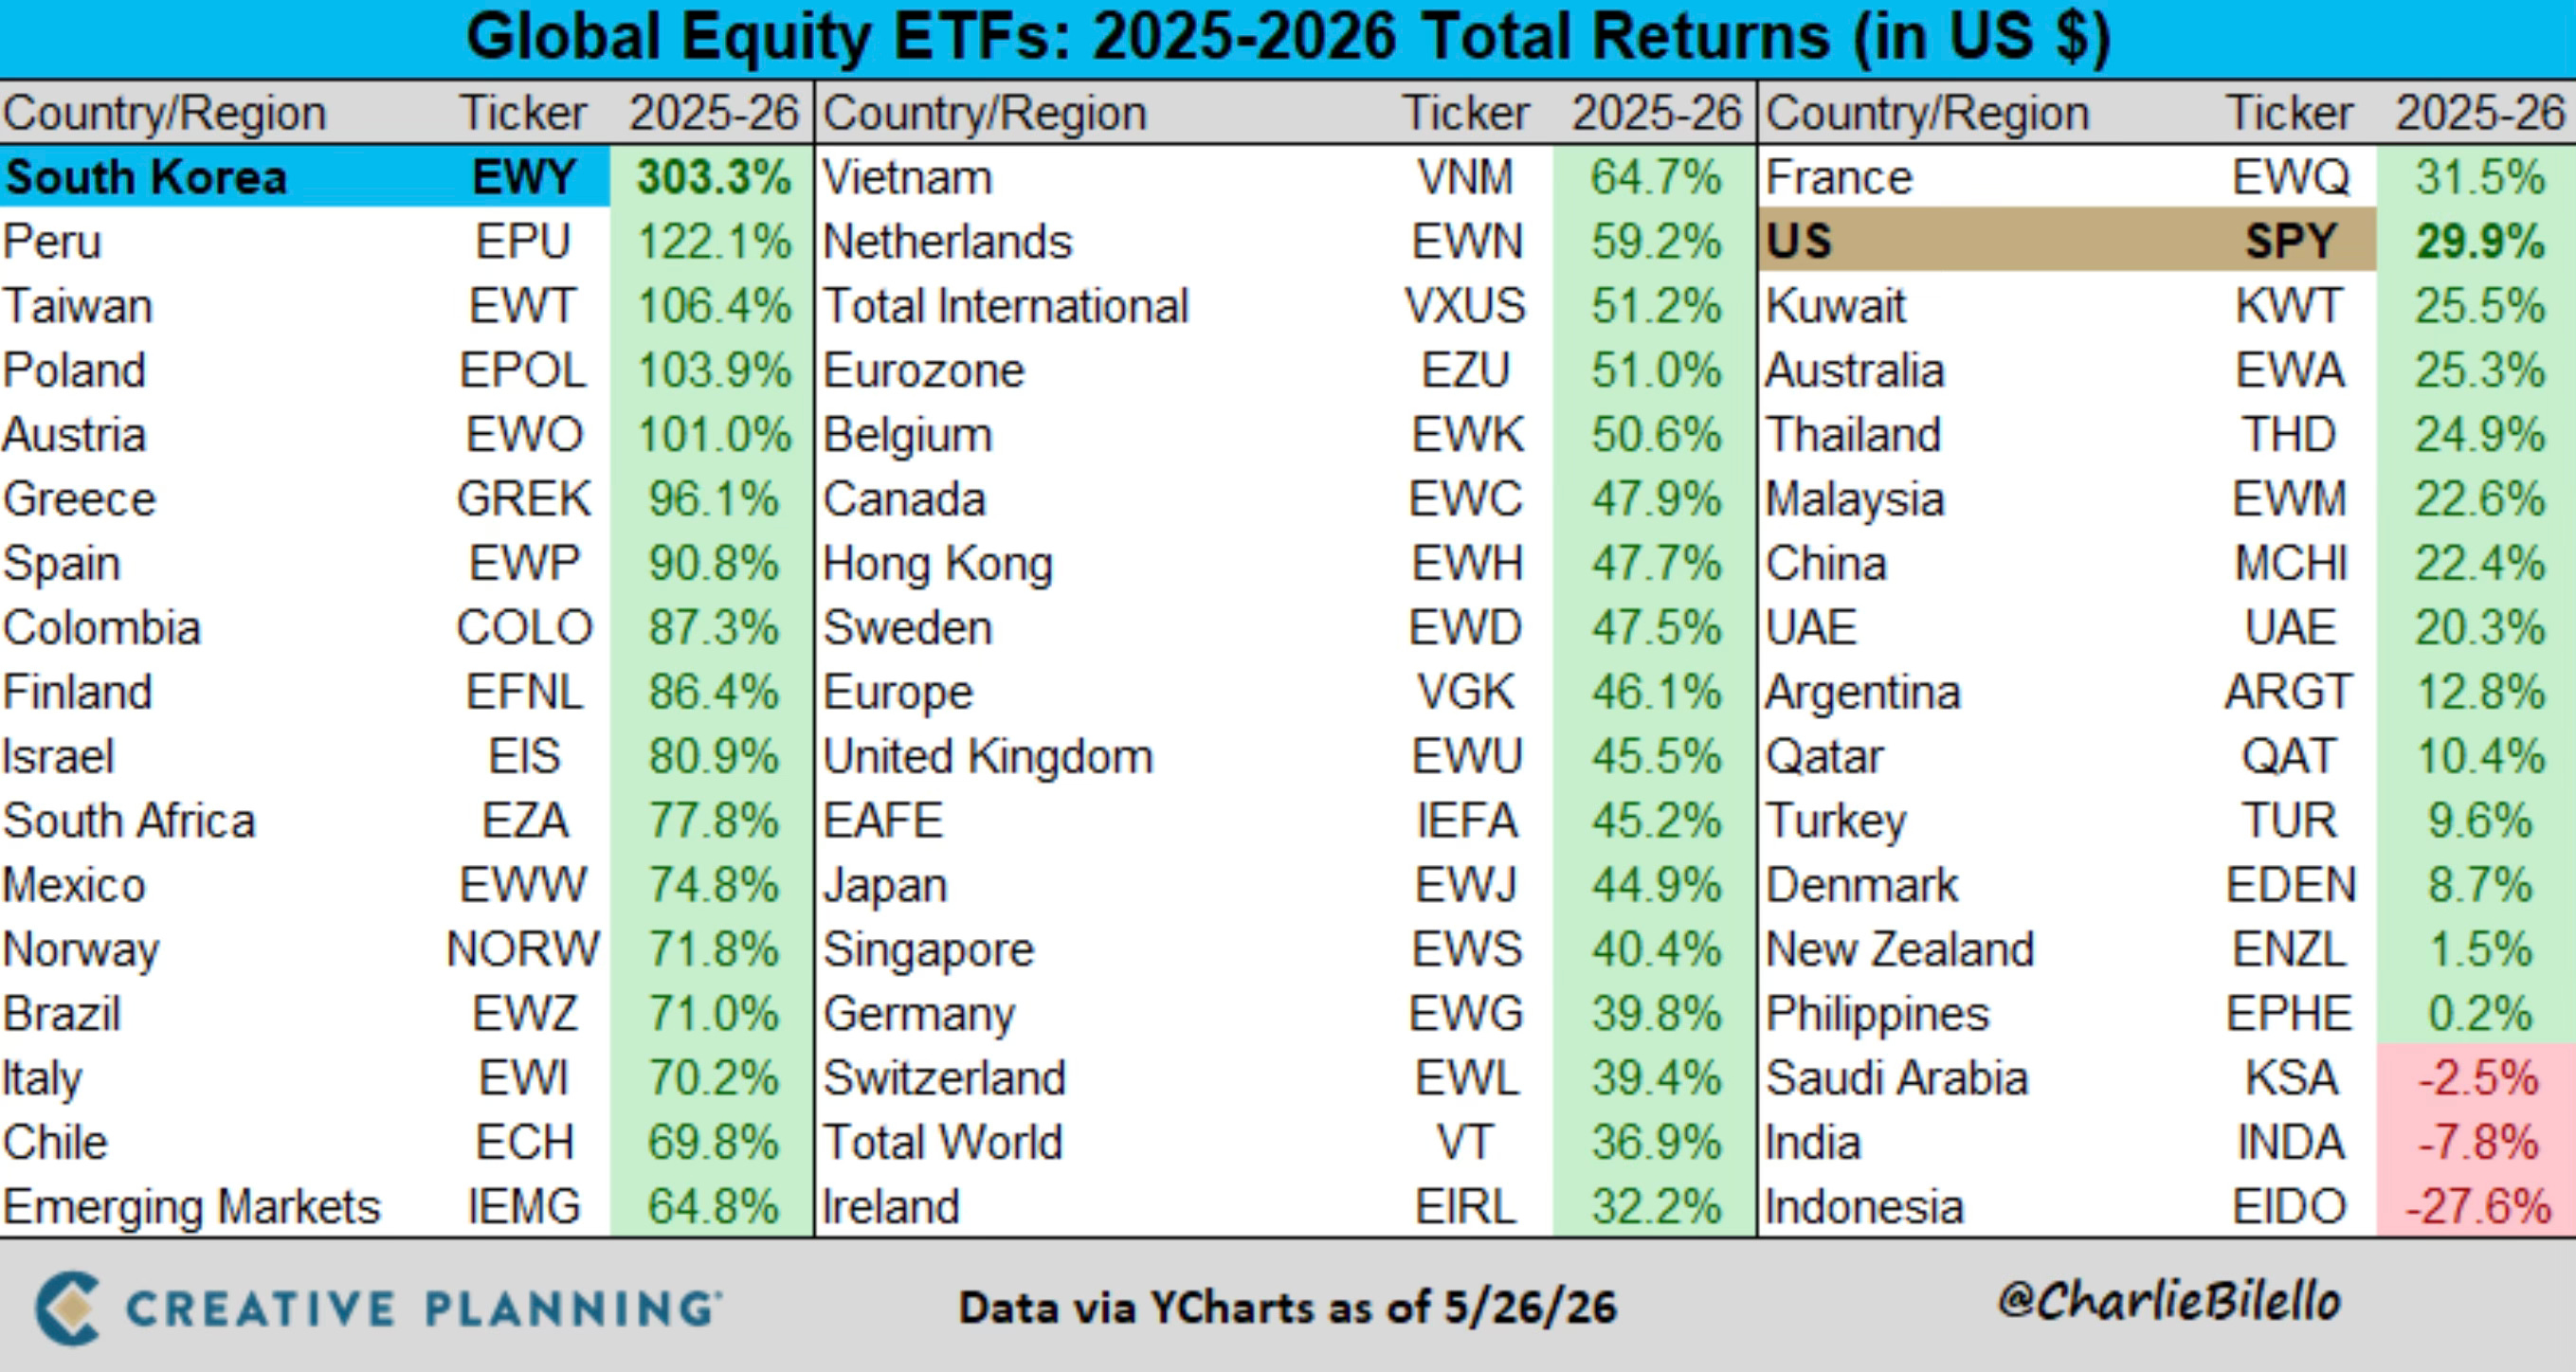
The global picture is something else entirely. The US (SPY) is up nearly 30% over the past year and a half. But South Korea’s EWY is up 303%. Taiwan, Poland, Austria, Greece, Spain, and Colombia are all up more than 80%. Even Emerging Markets broadly are up nearly 65%. Indonesia is the big loser at -27.6%. International is having a moment.
I Said Don't Sell in May. Don't in June Either?
May closed strong. The S&P 500 gained about 4.9% on the month, which brings the combined April and May return to roughly 15.9%. That is a massive two-month run.
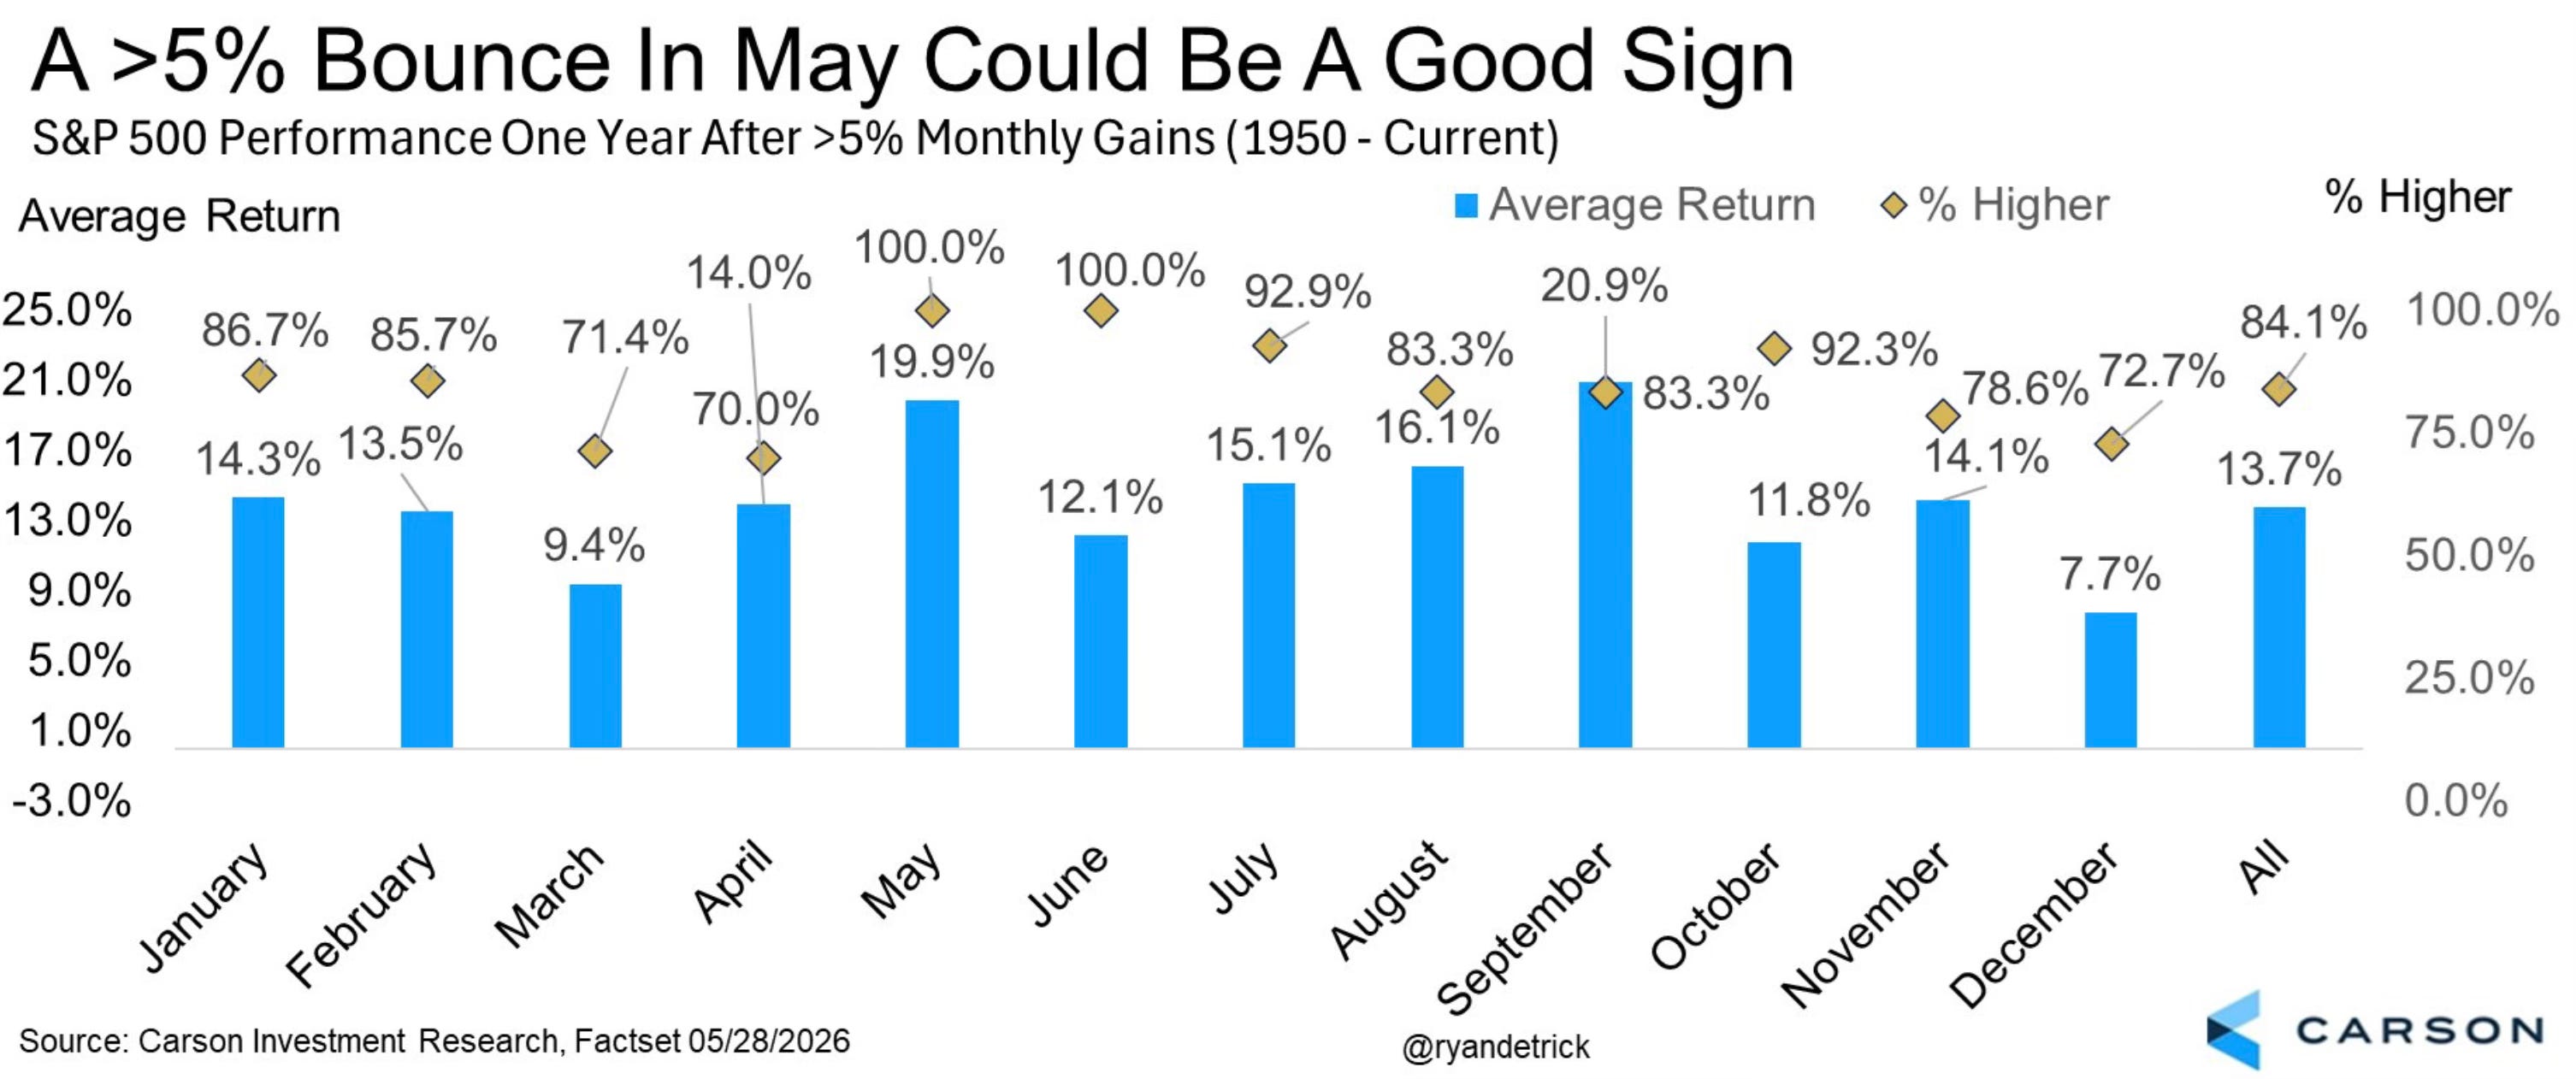
History says to take that seriously. When May gains more than 5%, the S&P 500 has never been lower one year later. That stat has held every single time since 1950, with an average return of nearly 20% in the following 12 months.
The April and May combination is just as telling. Every prior instance where both months gained more than 4% saw a positive June. Every single one. The average June return in those setups was around 2.4%.
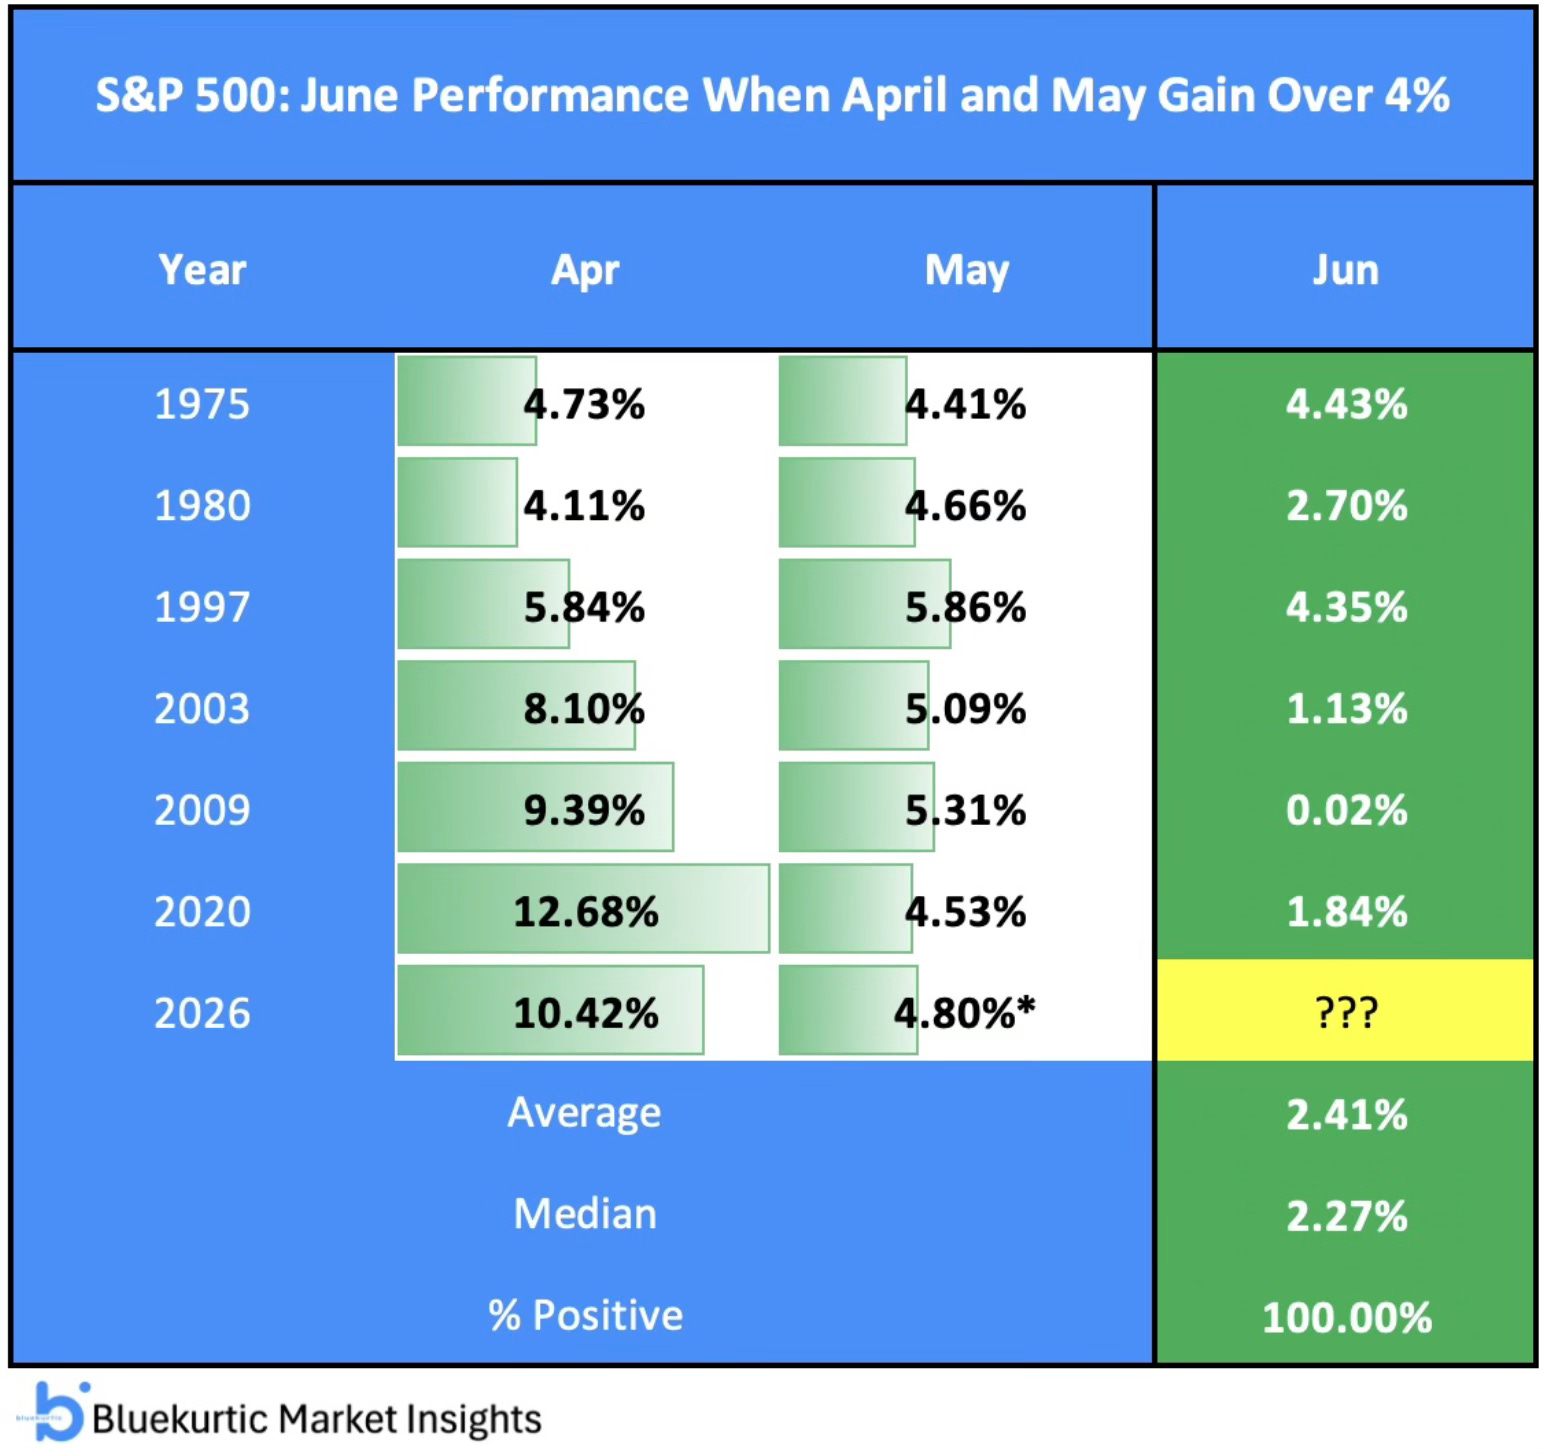
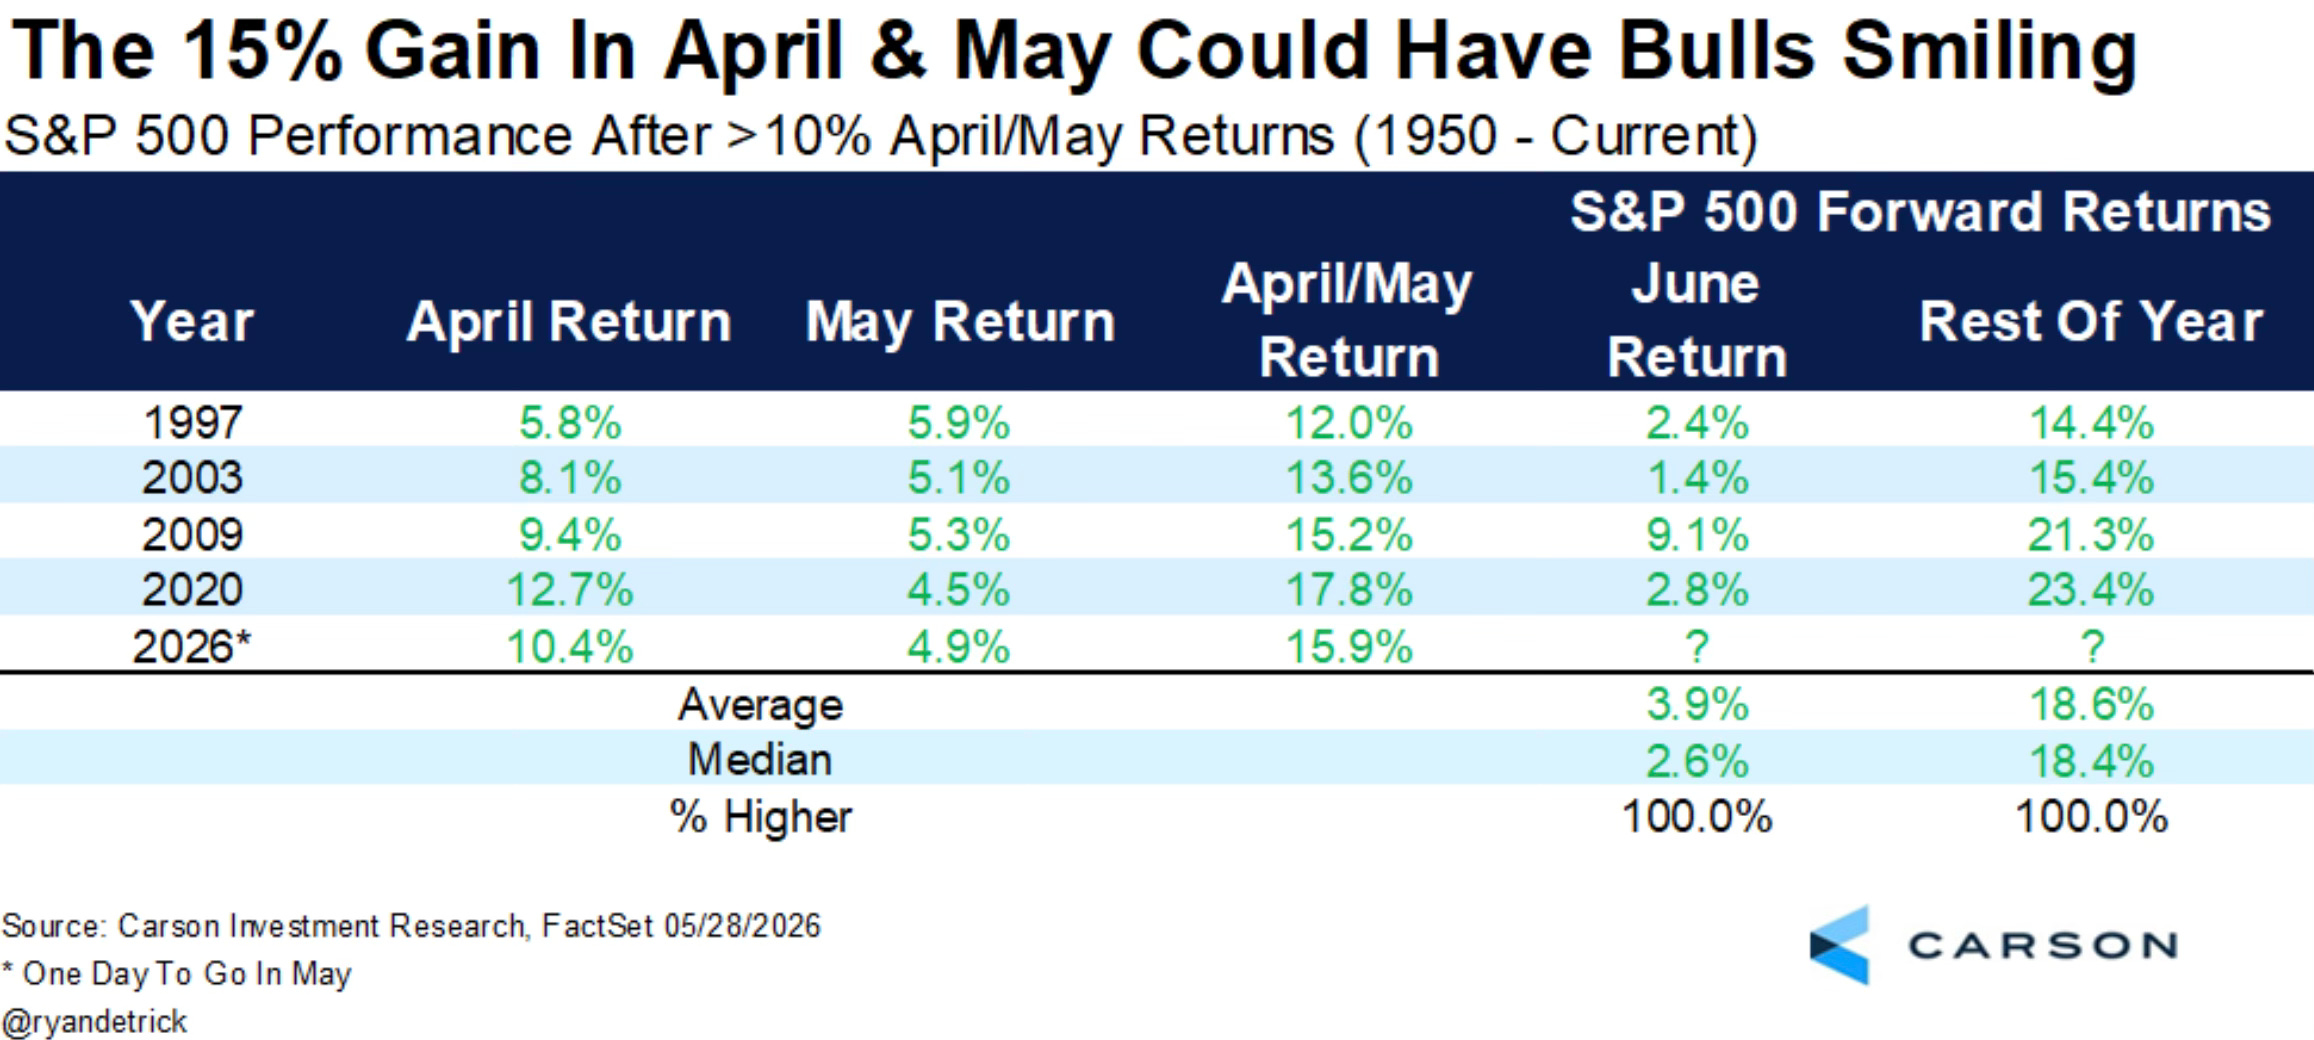
And when the combined April/May return exceeded 10% (which happened in 1997, 2003, 2009, and 2020, and now 2026), the rest of the year was up double digits every time, averaging nearly 19%.
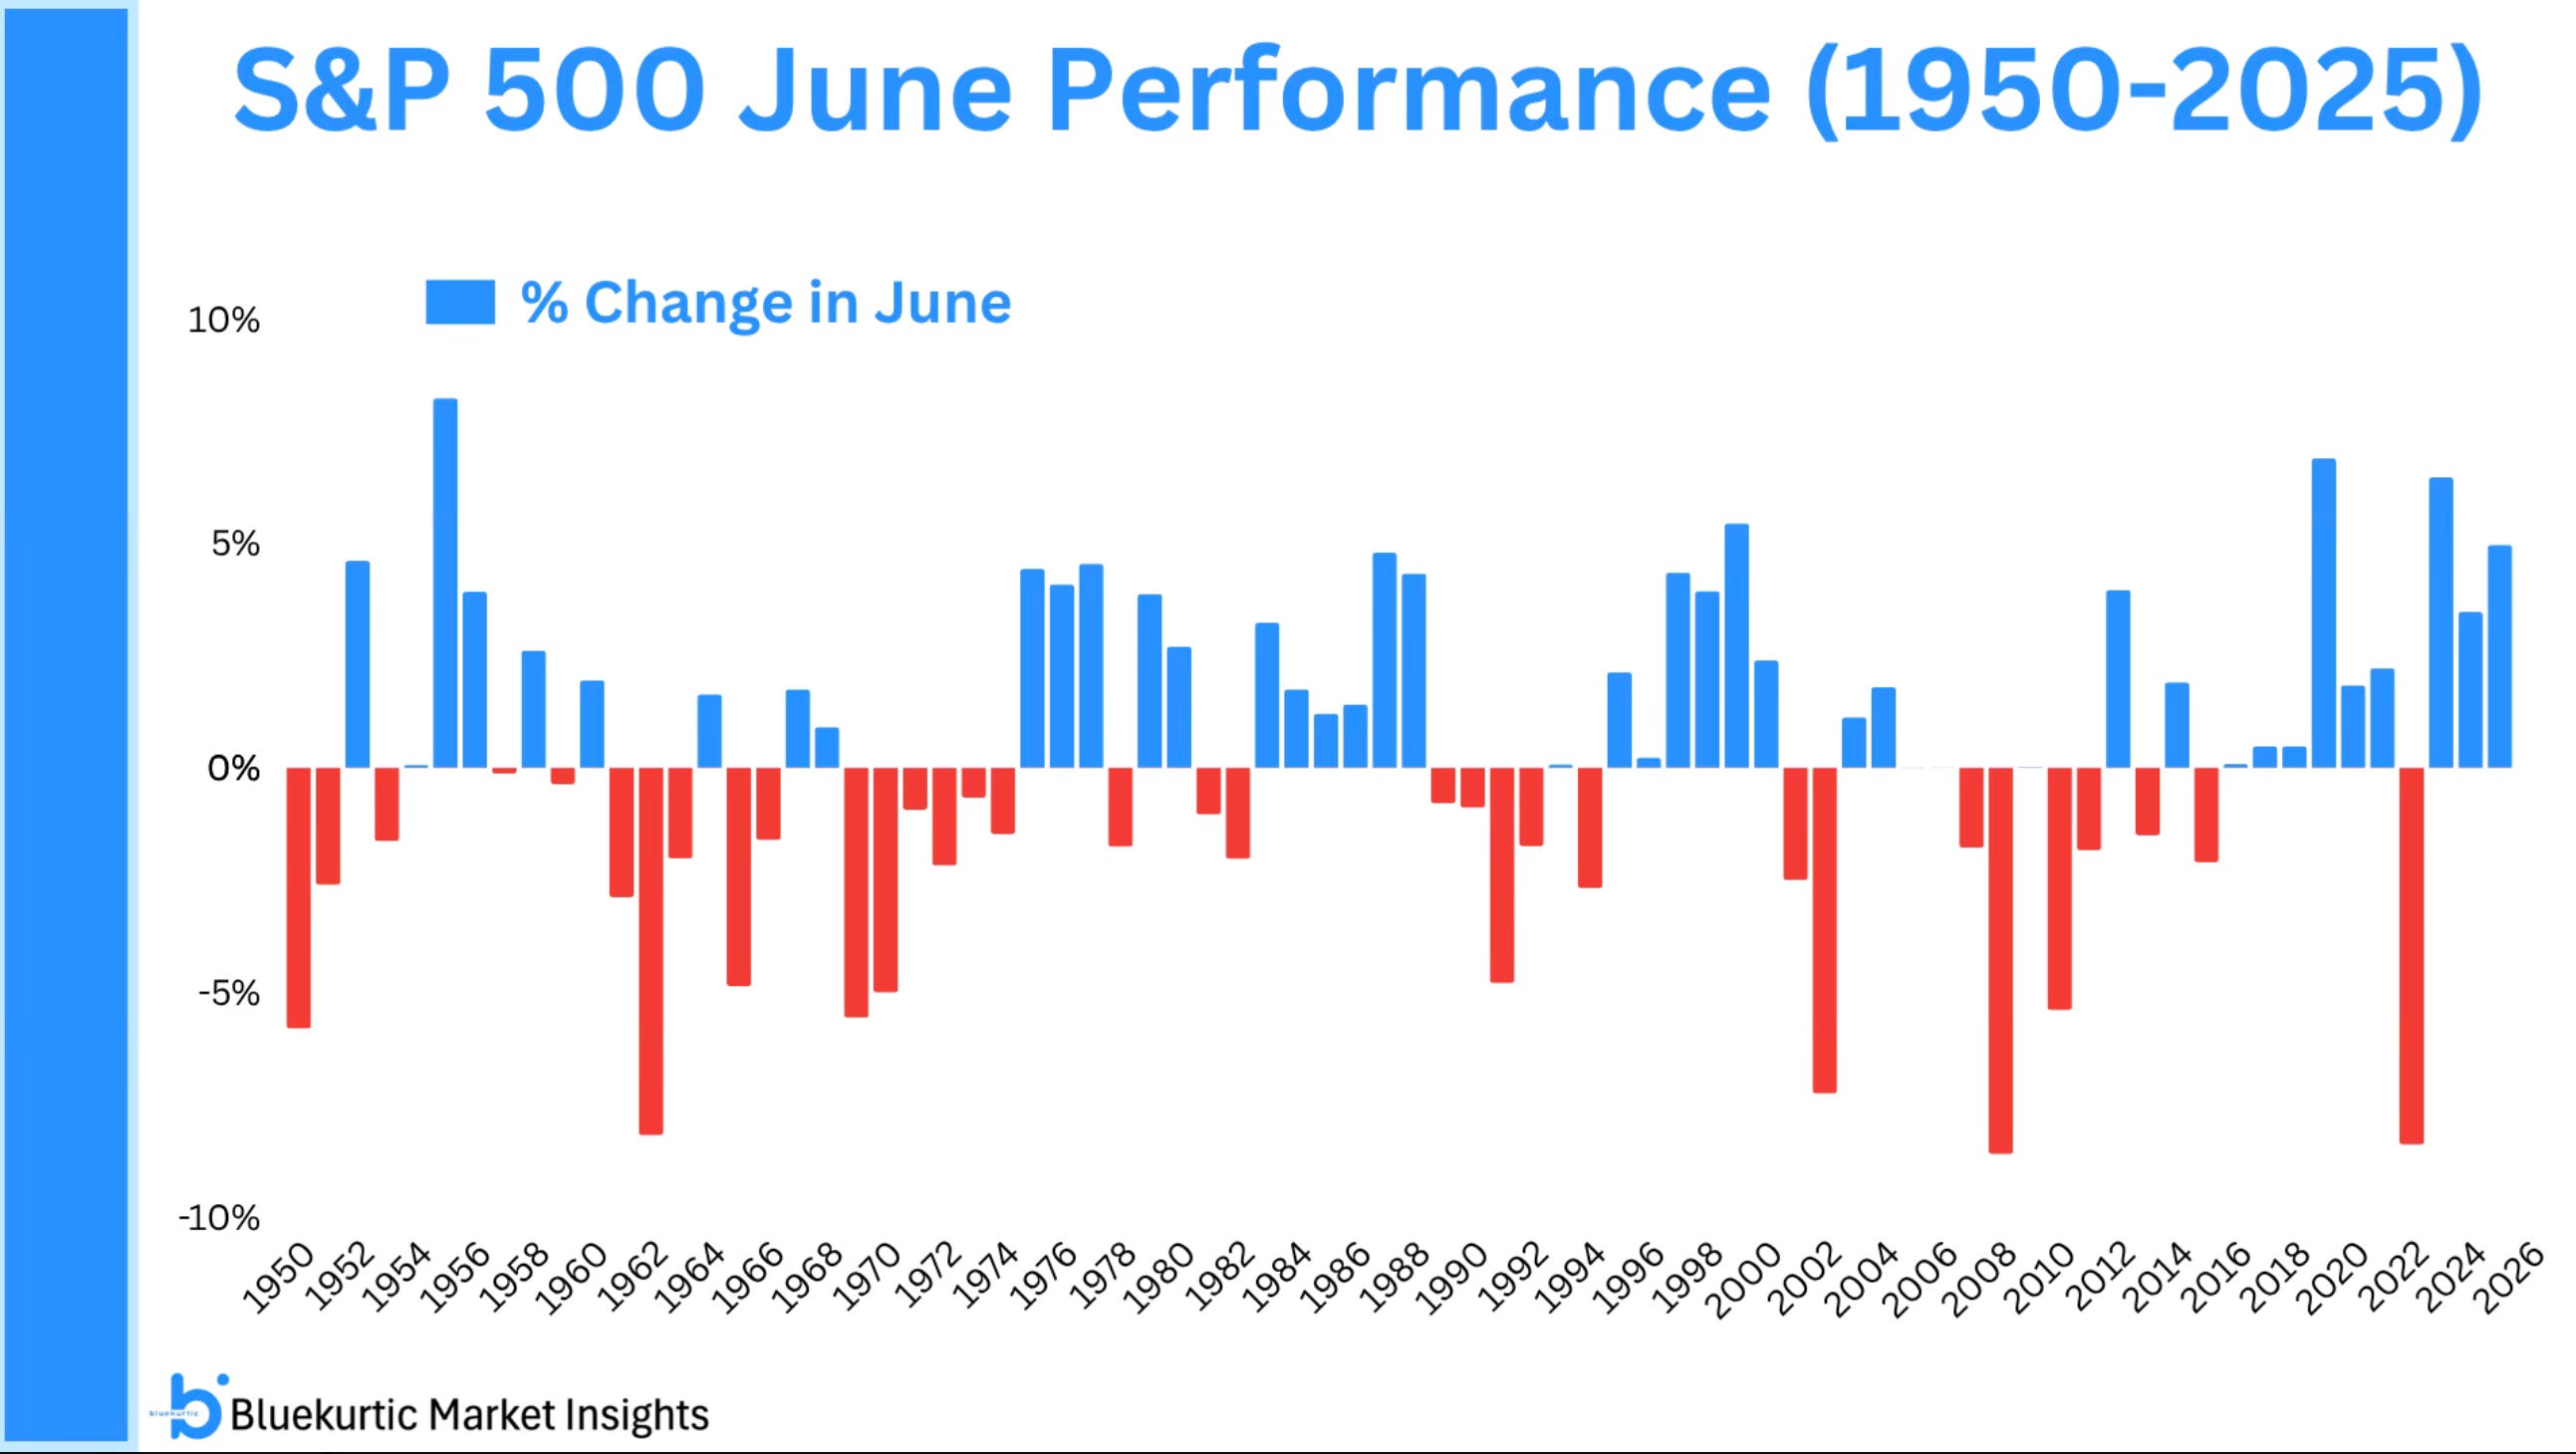
June also just tends to be pretty good on its own. The S&P 500 has finished higher in 9 of the last 10 Junes. That is a hard trend to argue with.
None of this means anything is guaranteed. But the historical setup heading into June is about as clean as it gets.