Investing Update: Buy The Dip?
What I'm buying, selling & watching
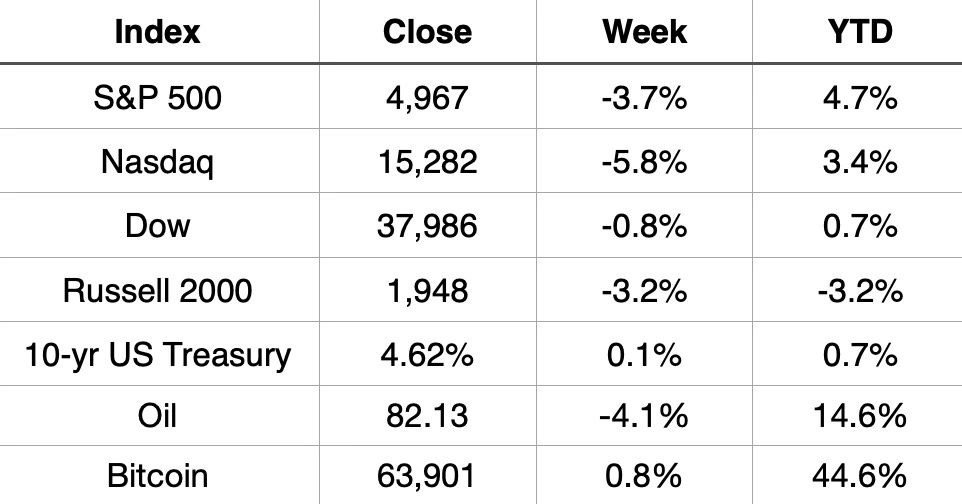
For the third straight week the S&P 500 finished in the red. It closed below the psychological level of 5,000 at 4,967 and is now down 5.5% from the highs.
The Nasdaq finished down for the 6th session out of the last 7. This was its worst week since September. It’s now down 7% from the highs.
Market Recap
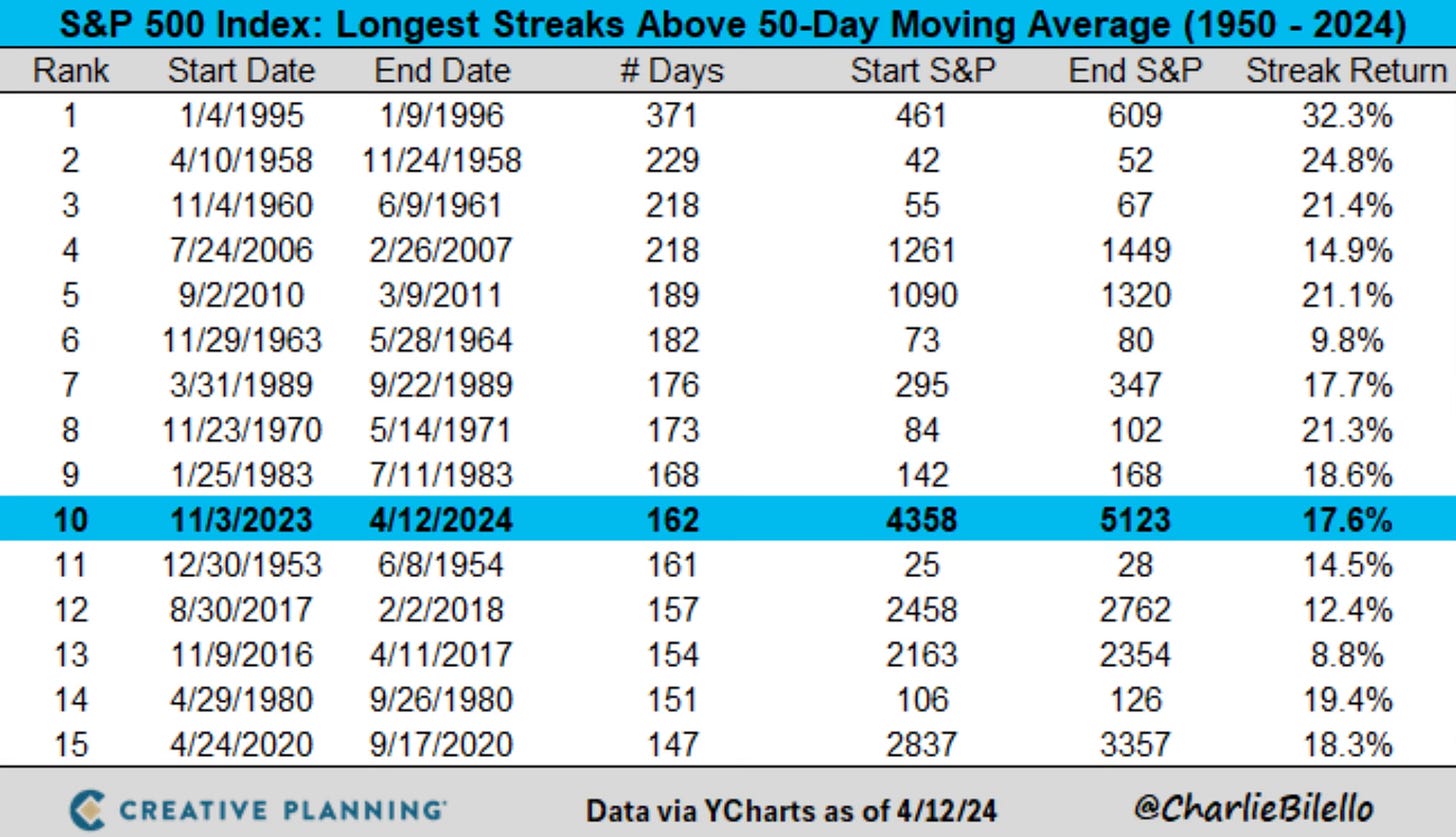
This comes after one of the smoothest stretches that the market has ever seen. The S&P 500 just had the 10th longest streak above the 50-day moving average since 1950. A total of 162 days above the 50-day.
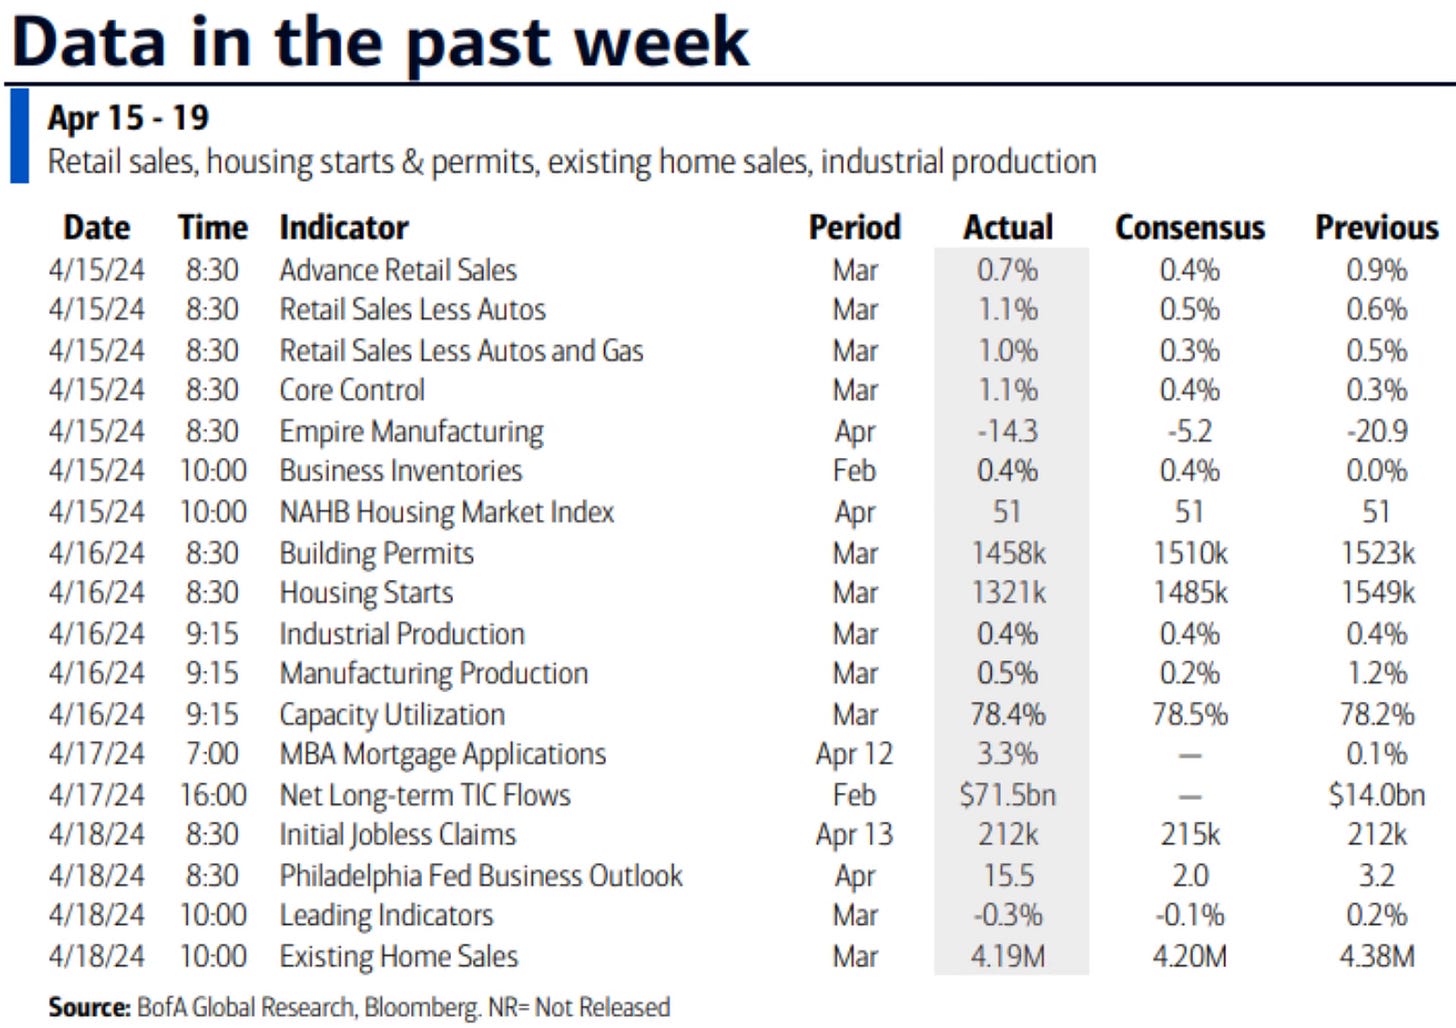
We knew that couldn’t continue. Now we’ve seen the inevitable pullback and it turned downward quick.
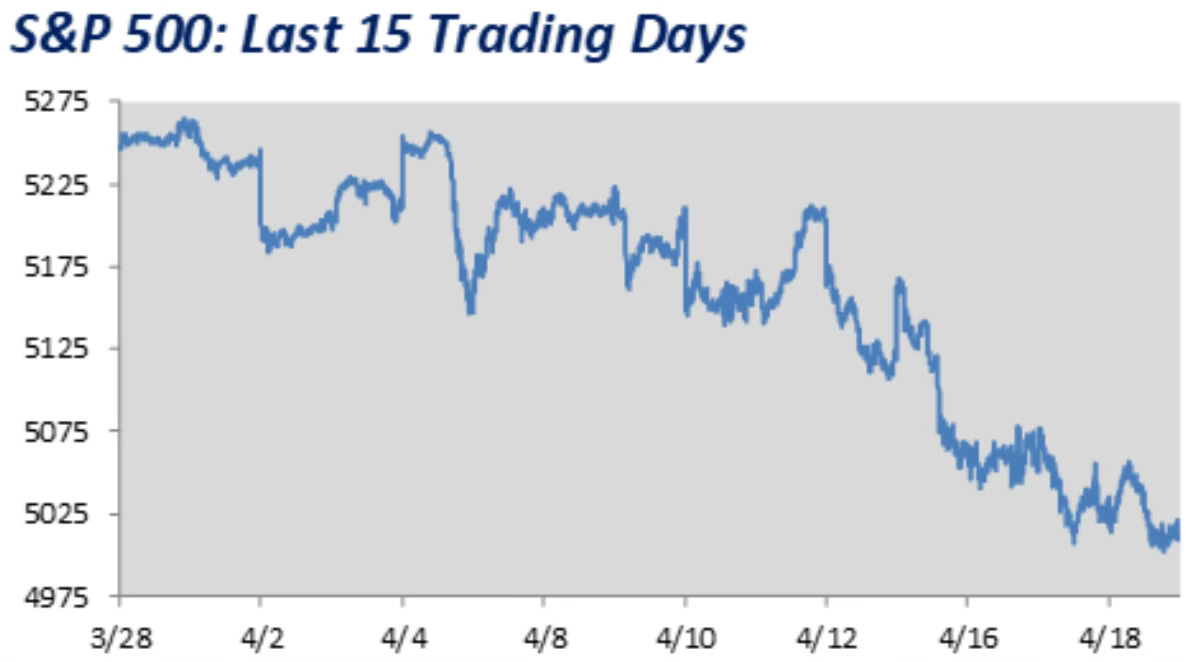
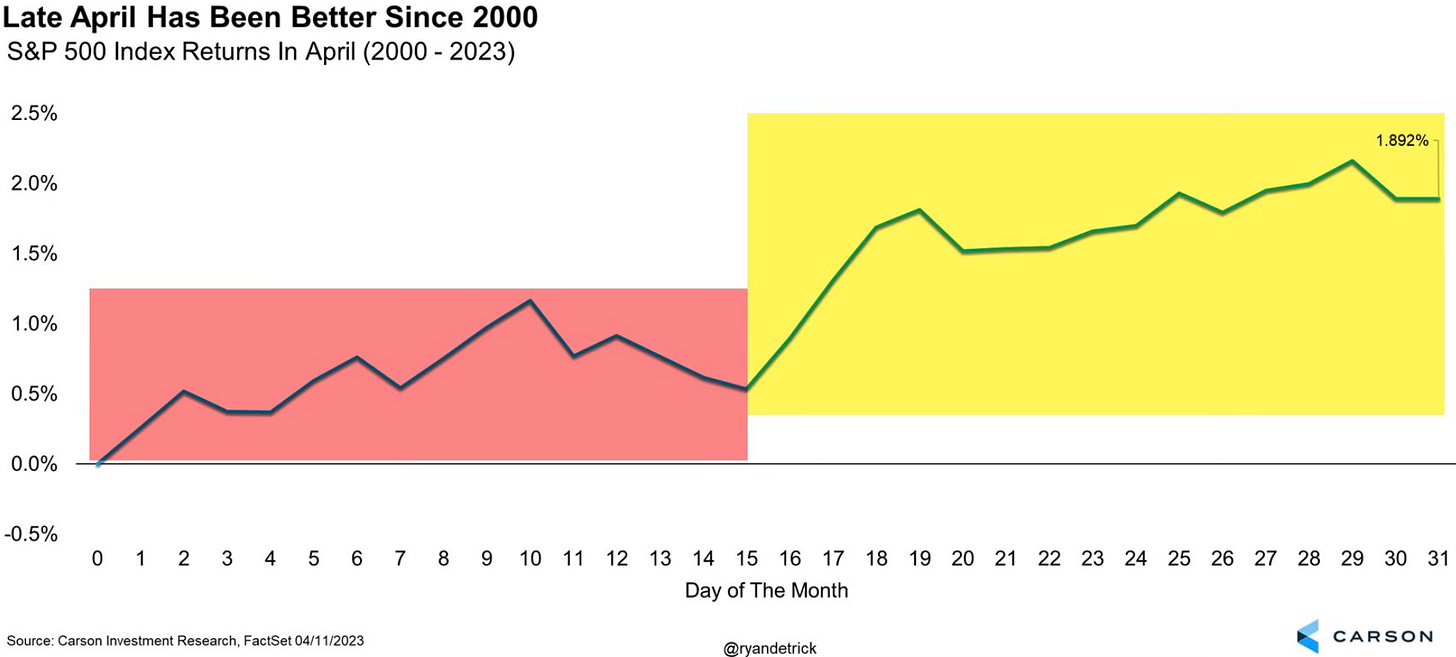
Since 2000, the S&P 500 historically has stumbled to start April but has turned it around to finish the second half of the month strong. So far 2024 is bot following that path.
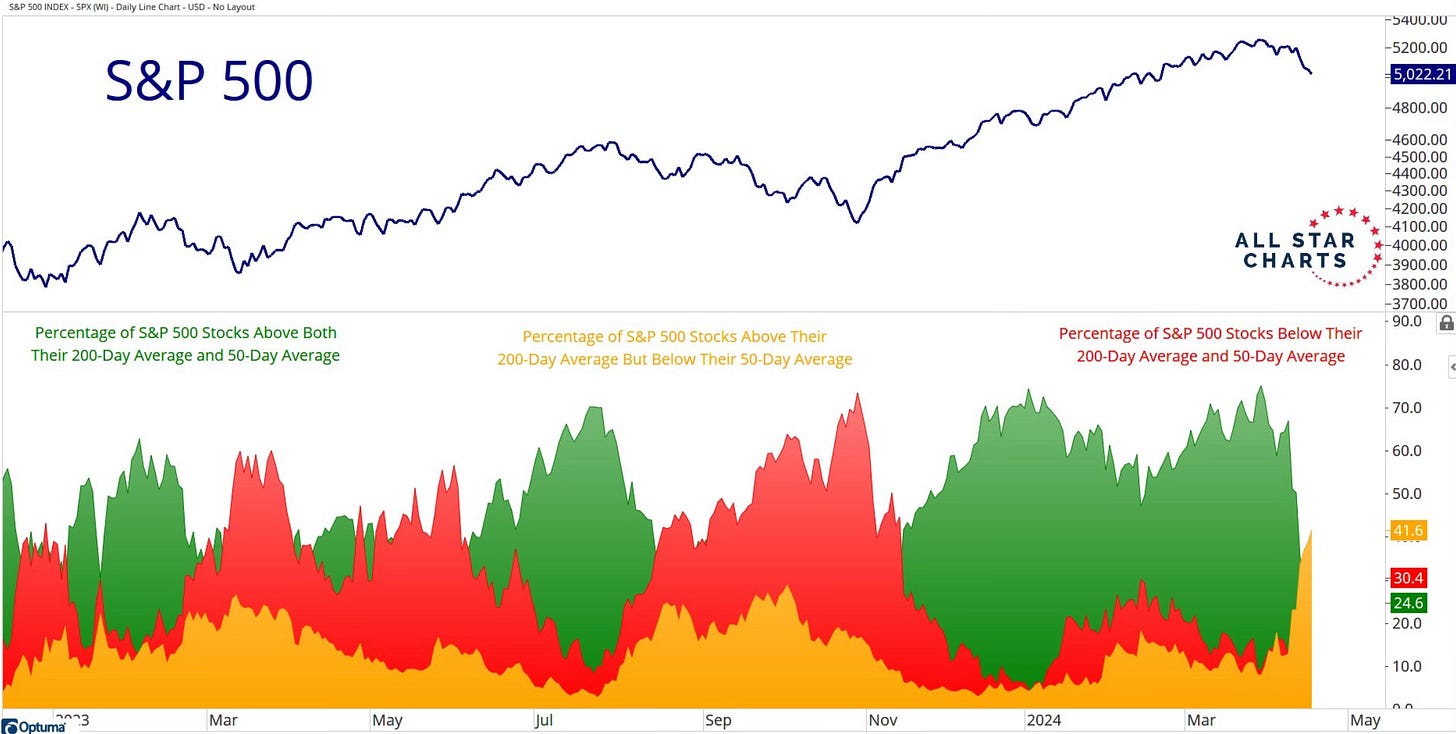
Under the surface we can see just how much has been changing by this colorful gem of a chart by Grant Hawkridge who writes JottingOnCharts.
Over 40% of S&P 500 stocks are above their 200-day moving average but are also below their 50-day moving average. This is in yellow and you can see it starting to replace the green, which is stocks above both the 200-day and 50-day. This is the highest level of yellow since 2021. The short term environment is changing. If we start seeing red, that’s when the risks increase.
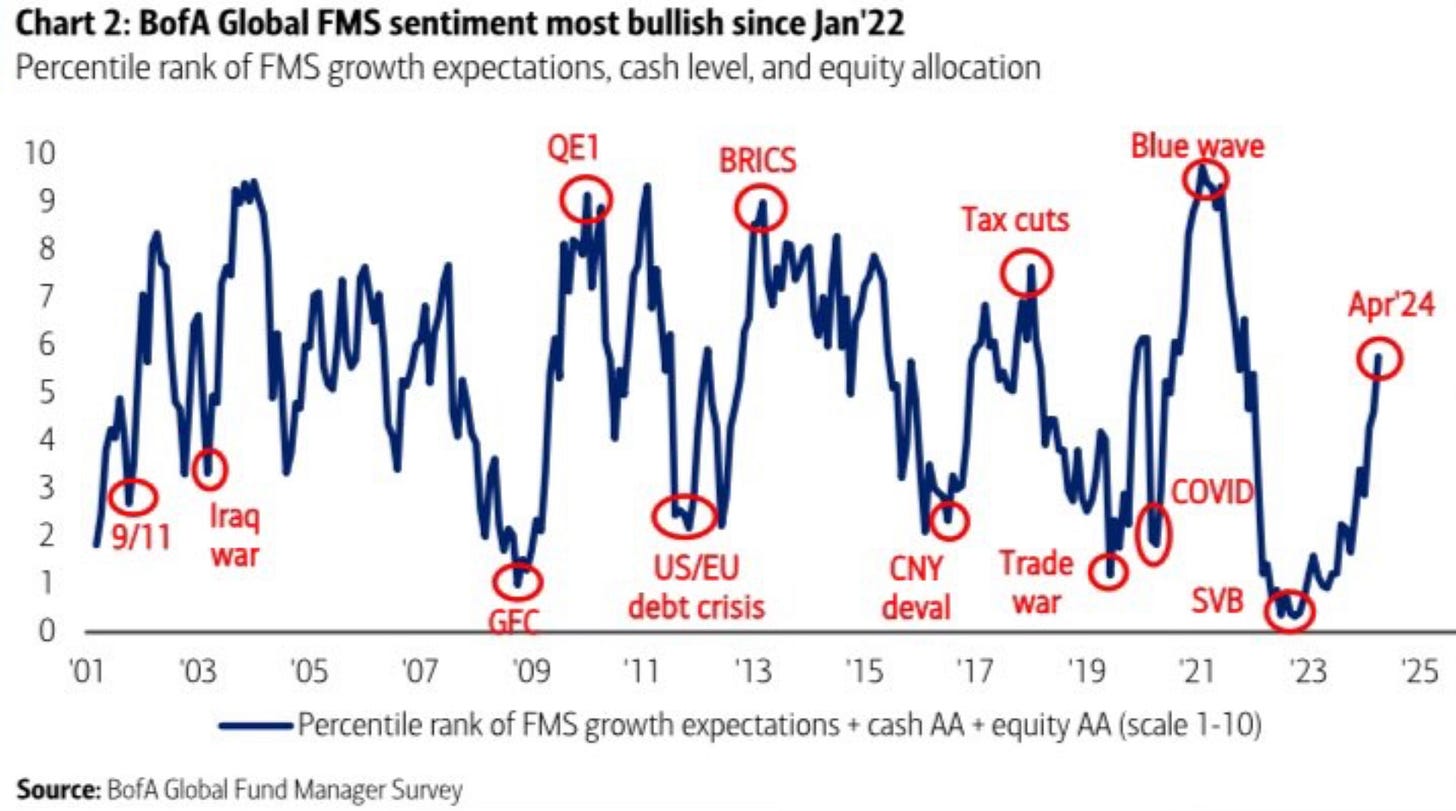
But sentiment is still overwhelmingly bullish. The BofA Fund Manager Survey indicates that sentiment is the most bullish since January 2022.
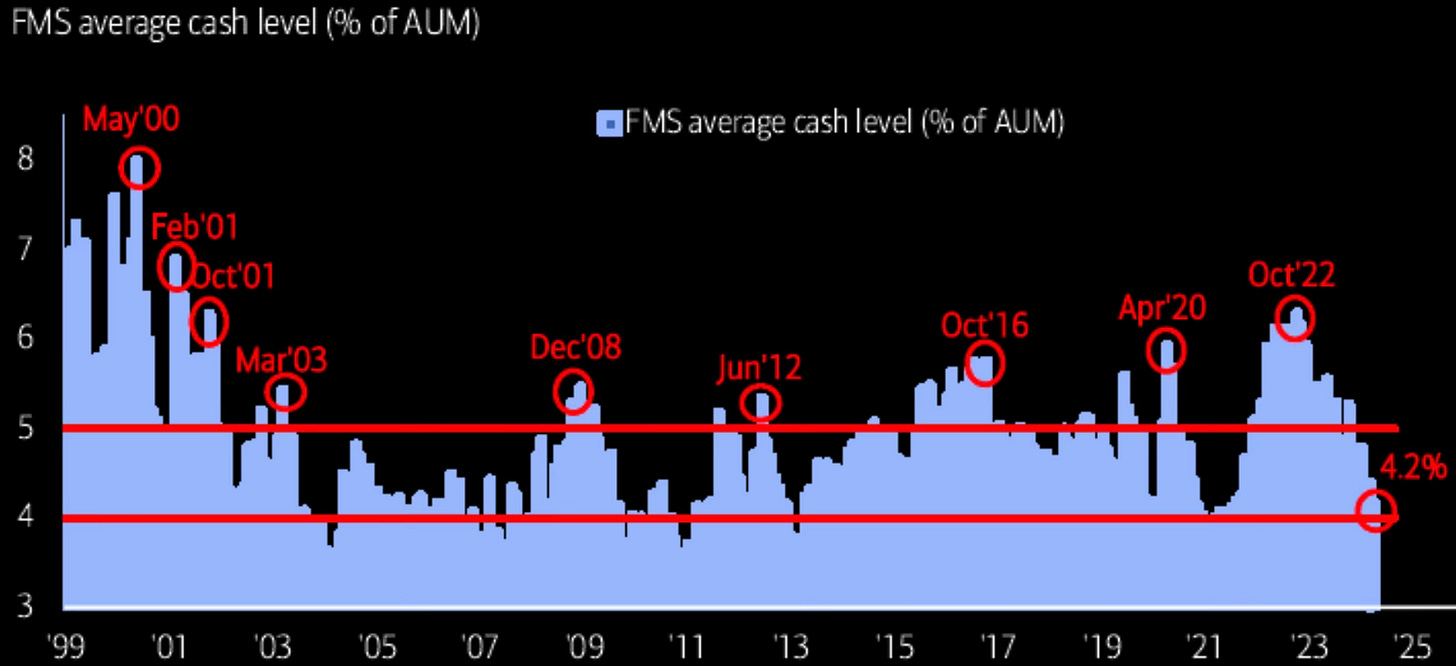
That same survey also shows that the average cash levels have come down and are now reaching the contrarian sell signal level of under 4%. Investors are fully invested with little cash to buy if there is a major pullback.
Buy The Dip?
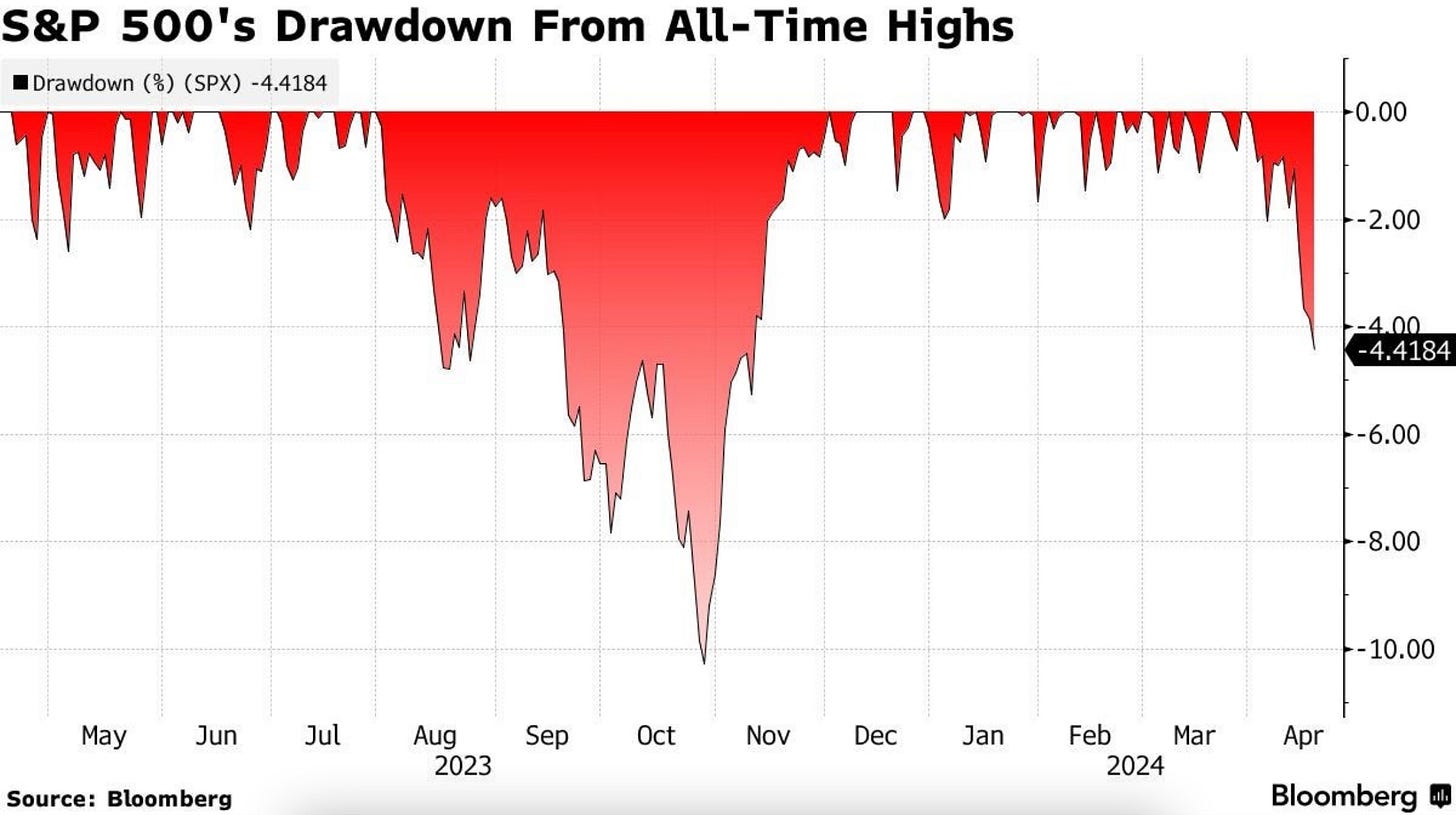
We’re in the midst of the largest drawdown of 2024. This chart shows the recent drawdowns from all-time highs. Is this a buyable dip?
I think the question to try and answer is if this is just a geopolitical selloff? Is it investors selling to raise money to pay their taxes? Or is this the start of something more?
My feeling is this is geopolitical related pullback and I don’t believe there is much more downside from here. That’s why I’ve added and am still looking to add to my positions.
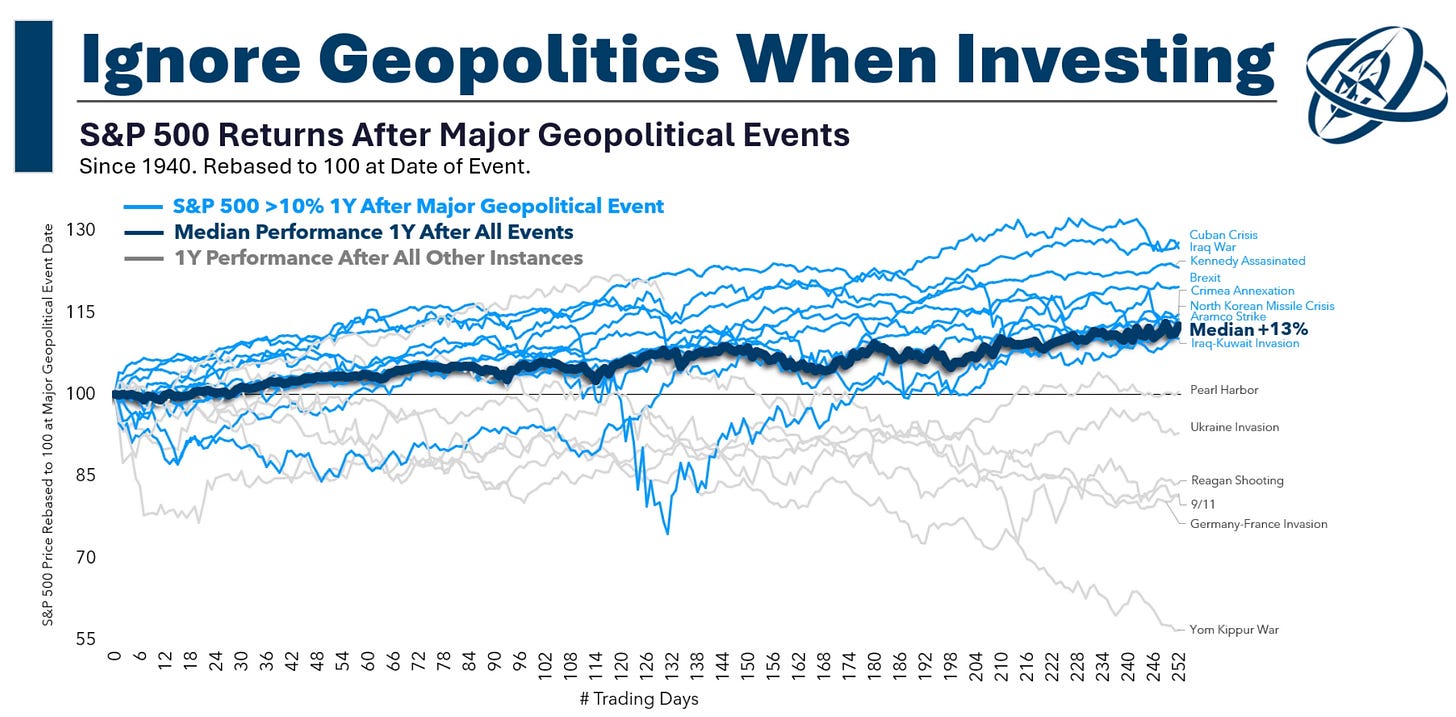
Michael Batnick had a great chart this week illustrating how you should avoid the geopolitics in investing. He shows each of these events in the chart below. The median return 1 year later is 13%. Don’t let geopolitical events throw you off your long term investing path.
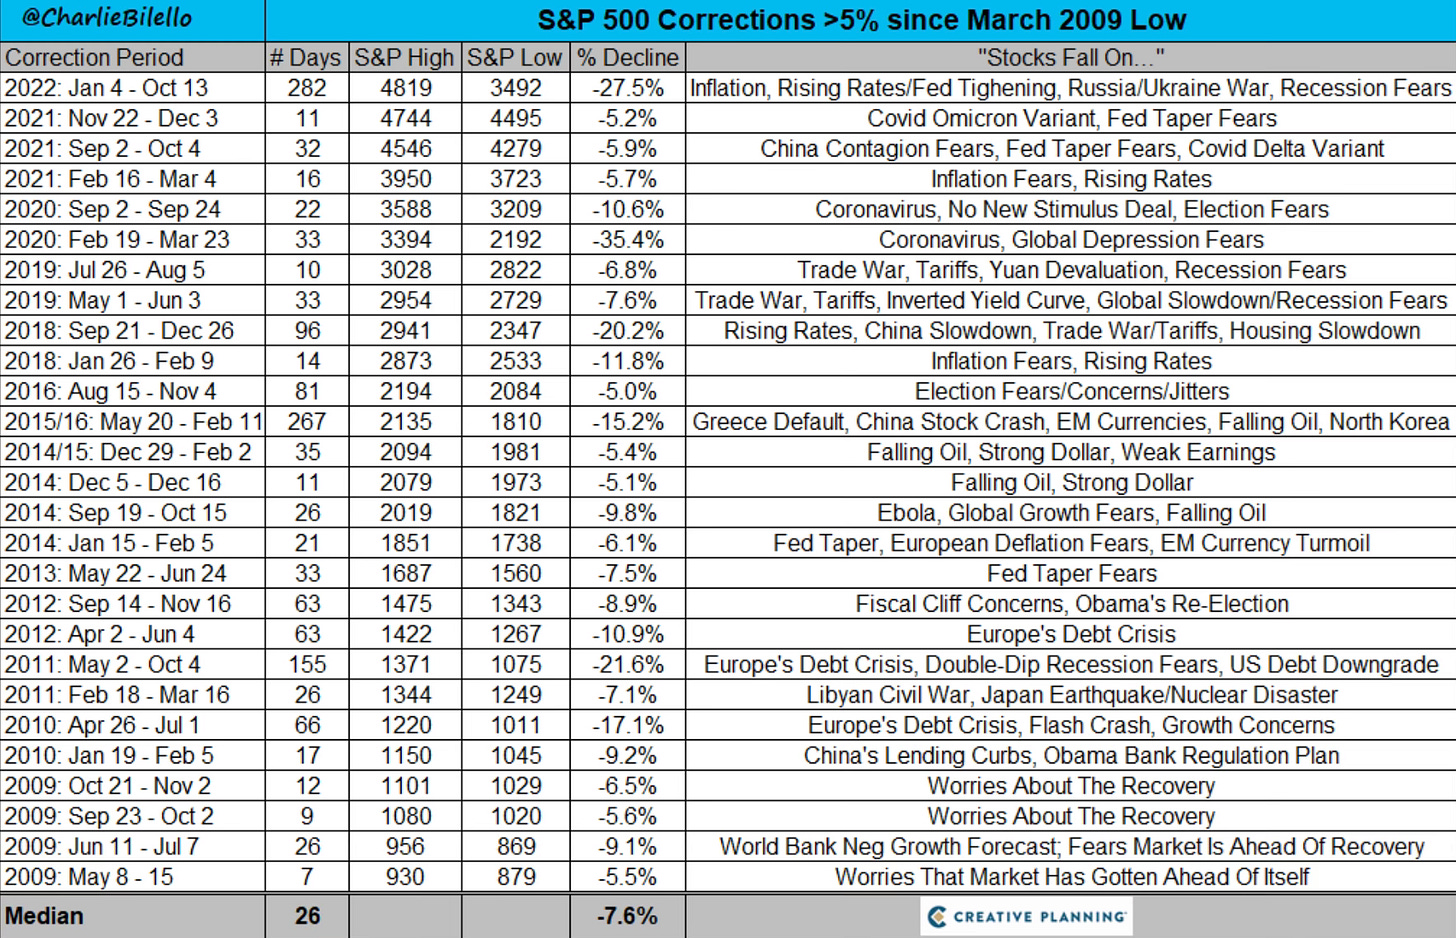
This chart looks back to the low of March 2009 and records all the S&P 500 corrections over 5% and why stocks fell. Such a wonderful reminder of what happens over the long term and how short term selloffs presented buying opportunities.
Don’t Sell In May & Go Away
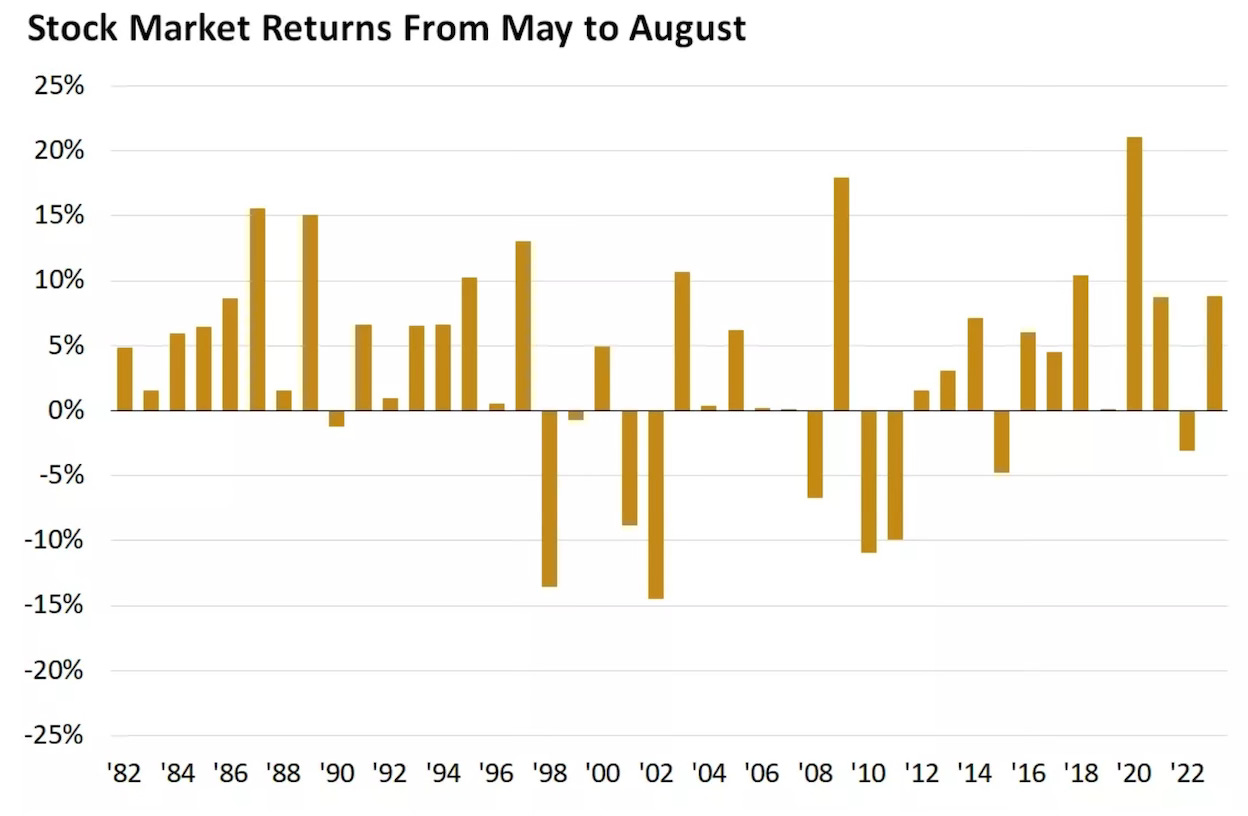
Sell In May and go away is a popular adage that we will hear as we enter May. We do every year. It more or less says the stock market is weaker in the summer. Investors prefer to go away on summer vacations and enjoy their cottages. But historically this summer stretch has actually been one of the better four month stretches of the year. One you don’t want to miss out on.
Insider Buying Isn’t Happening
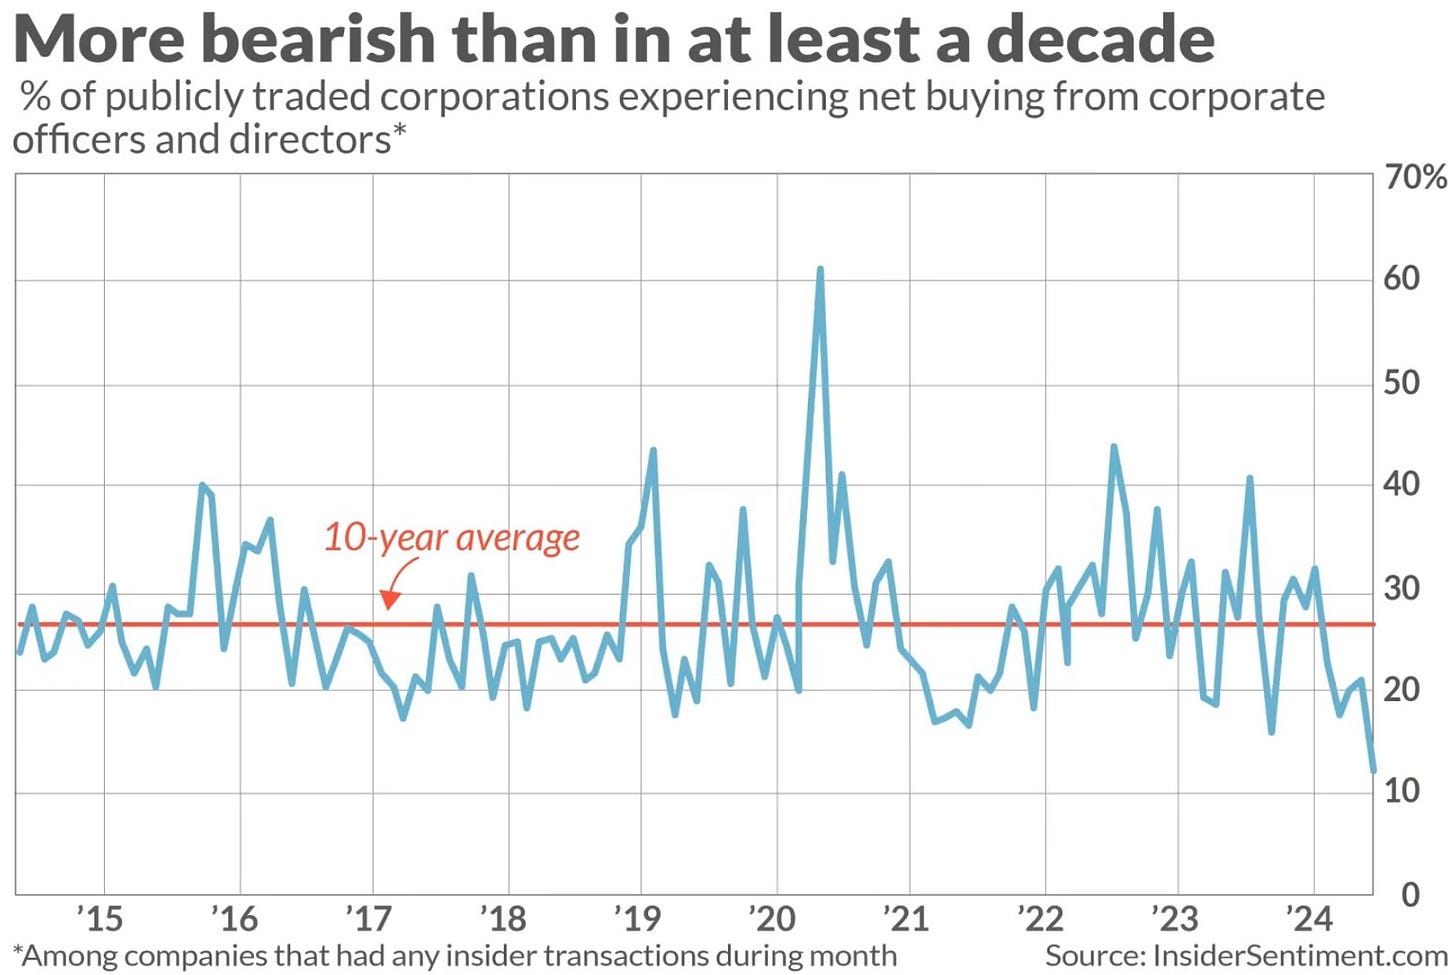
An insider indicator that has shown zero movement is insider buying. Insiders (corporate officers and directors) of public companies have bought nothing. In fact, it’s at the lowest level in over a decade.
A Small Business Sentiment Answer
I’ve talked multiple times of late on the falling sentiment among small businesses via the NFIB Small Business Survey. (What Small Businesses Are Telling Us & Investing Update: Data That’s Sticking Out)
I even asked the following in last weeks post.
Since this has now really been something that has been deteriorating for multiple months now, it’s really worth asking what does this mean? Is this a leading indicator of more trouble ahead? Or is this just a rough patch for small businesses and it won’t have an affect on the broader economy and stock market. Time will tell.
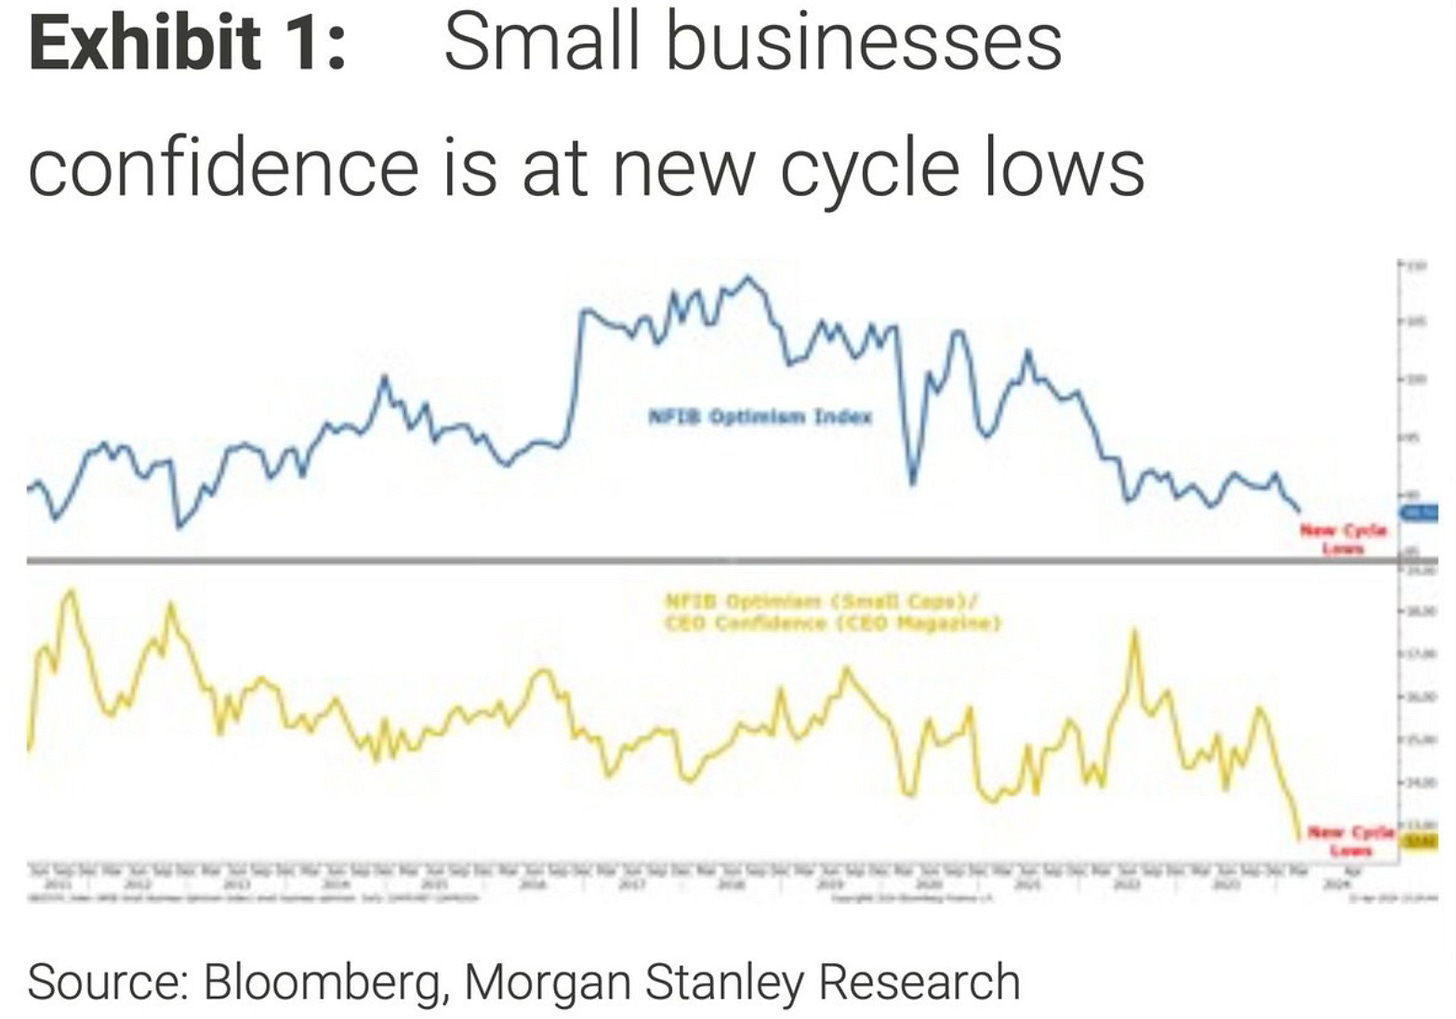
This week, Morgan Stanley CIO Mike Wilson’s note tackled the question of why small business confidence is at new cycle lows. It was an interesting perspective.
We continue to believe that much of the upside in economic growth over the past year has been the result of government spending ... This has led to a 'crowding out' of many smaller and lower-quality businesses and the lowest small business sentiment since 2012.
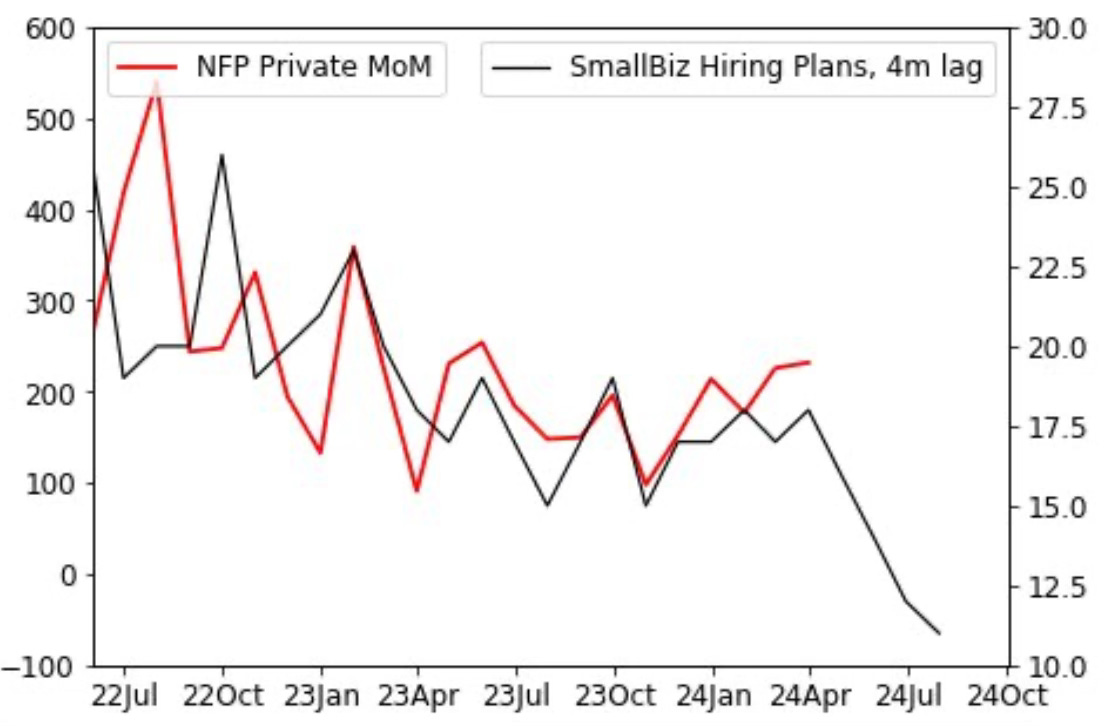
This then leads me to question what happens to jobs as we move ahead. Small businesses account for roughly 70% of the job market.
Right now the private nonfarm payrolls show nothing to be alarmed about. But it does tend to follow small business hiring plans, which as you can see aren’t very promising. Main Street isn’t Wall Street, but they’re both just as important to the overall economy.
Moves I’ve Made
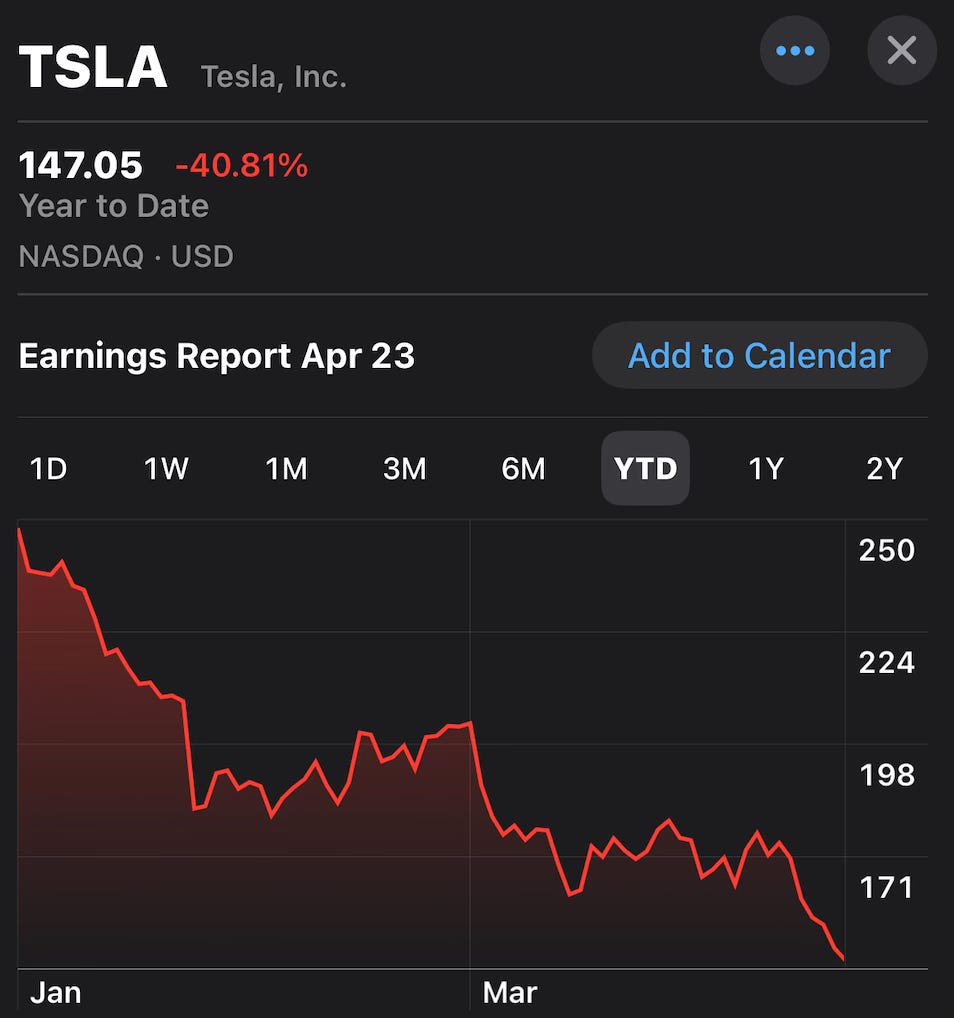
Tesla On Thursday I made a significant addition to my position in Tesla at $150 a share. Yes, it’s in the midst of one of its worst drawdowns in history. YTD it’s down over 40%, at a 52-week low and the worst performer in the S&P 500. It fell below Walmart and Exxon in market cap. I may be trying to catch a falling knife and it could go even lower. Or maybe the news can’t get much worse and it offers significant upside from these levels.
If you want to read Adam Jonas of Morgan Stanley’s note this week on Tesla, it’s linked here by Sawyer Merritt. There is one analyst who I follow and read on Tesla and the auto industry and it’s Adam. That’s how much I respect his work on this sector.
Upcoming Earnings & Data
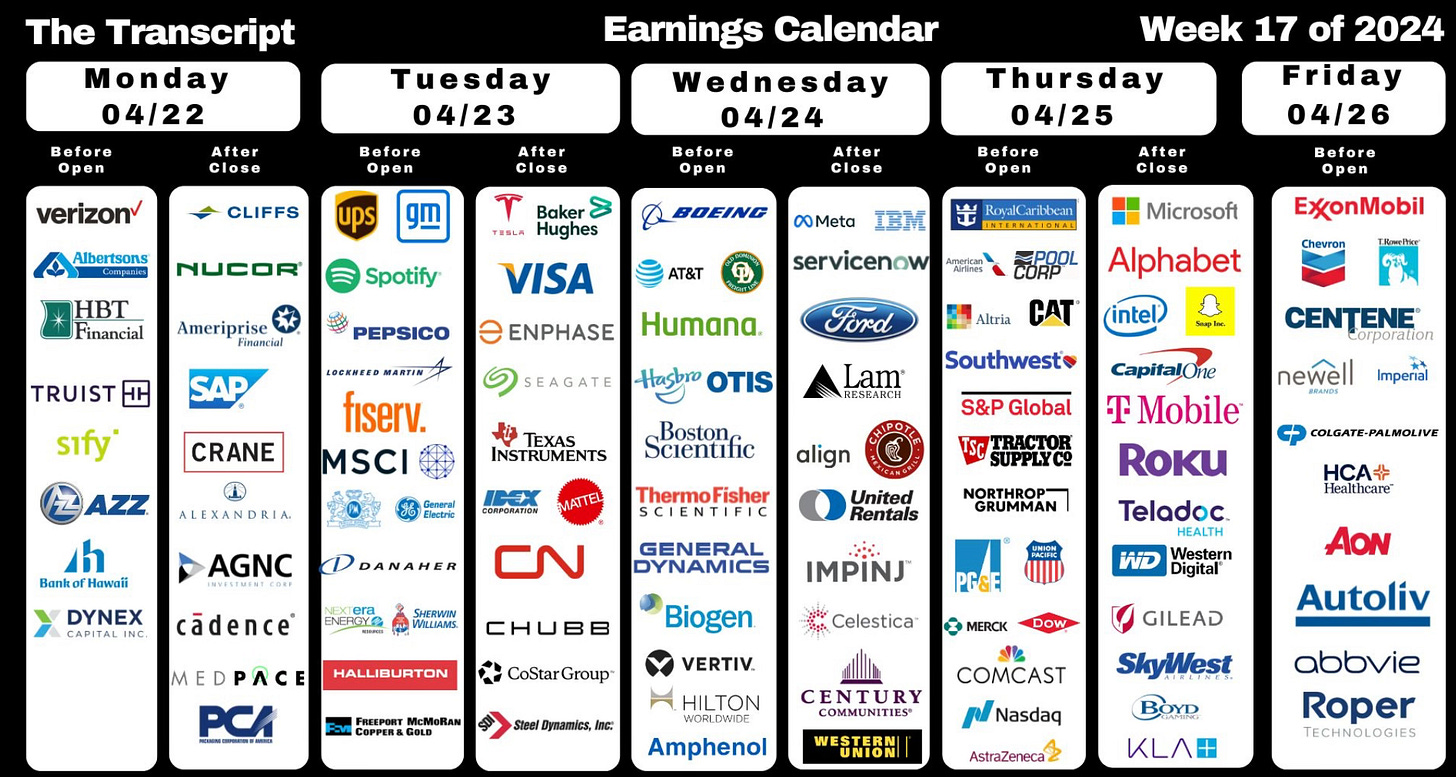
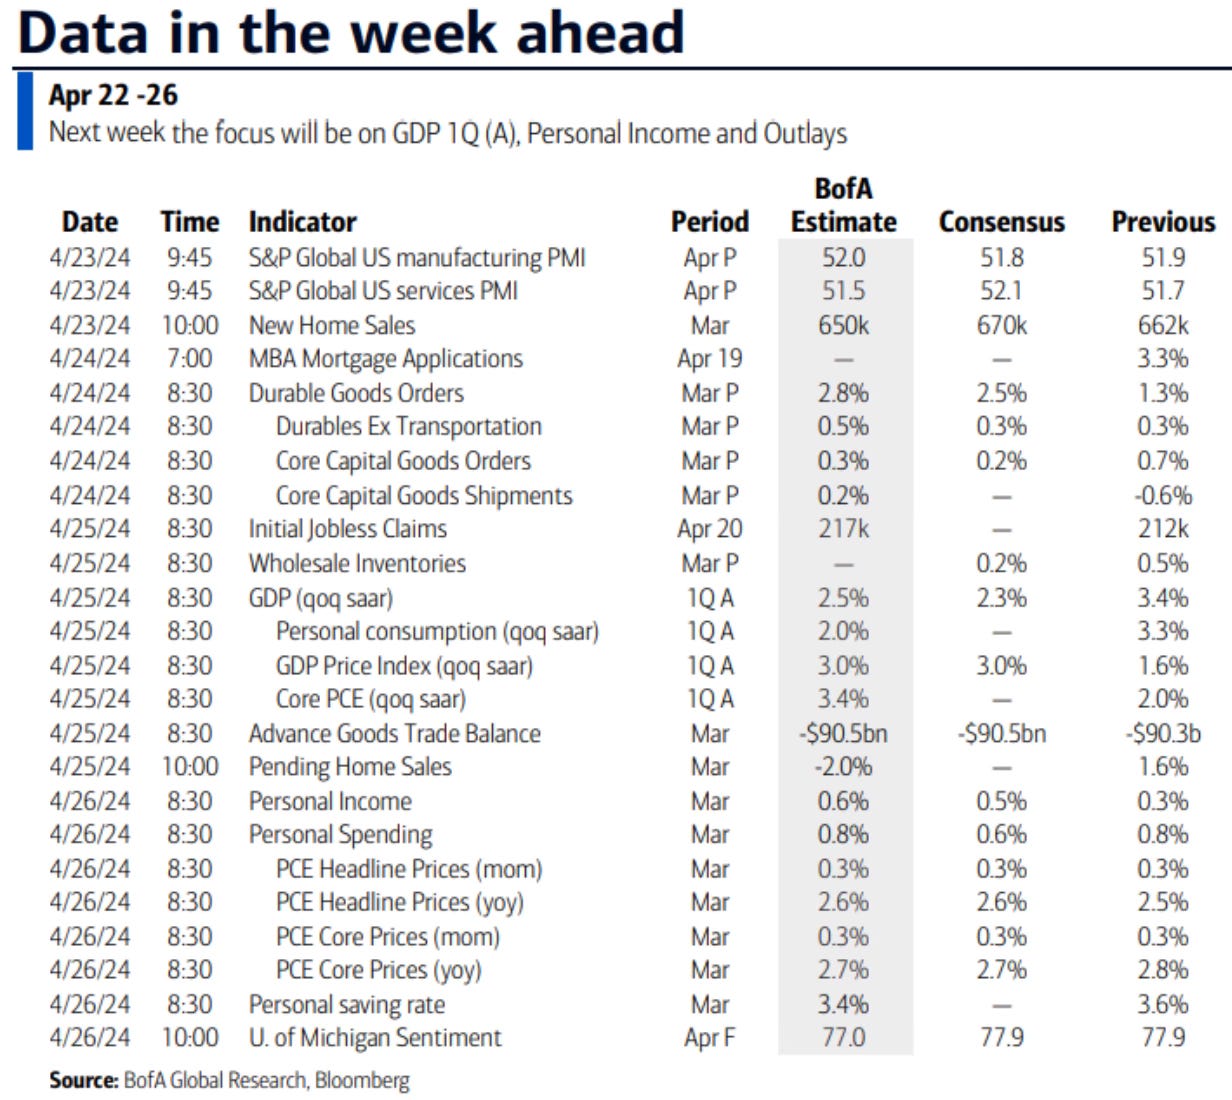
It’s big tech earnings week. 159 of the 500 S&P companies will be reporting earnings.
The Coffee Table ☕
Claudia Sahm had a very good post on inflation called Sticky is not stuck: inflation in Stay-At-Home Macro (SAHM). This is the best review and outlook on inflation I have read in a while. After reading this post you feel like you better understand what’s happening with inflation.
This week I had two people stop to ask me how I keep my white sneakers so white. I figured I would share with you. The only actual shoe cleaner I have ever found to do an ok job is, The Original Shoe Cleaner by Pink Miracle. But the thing that cleans them no matter what is a Mr Clean Magic Eraser. Happy whiter shoes.
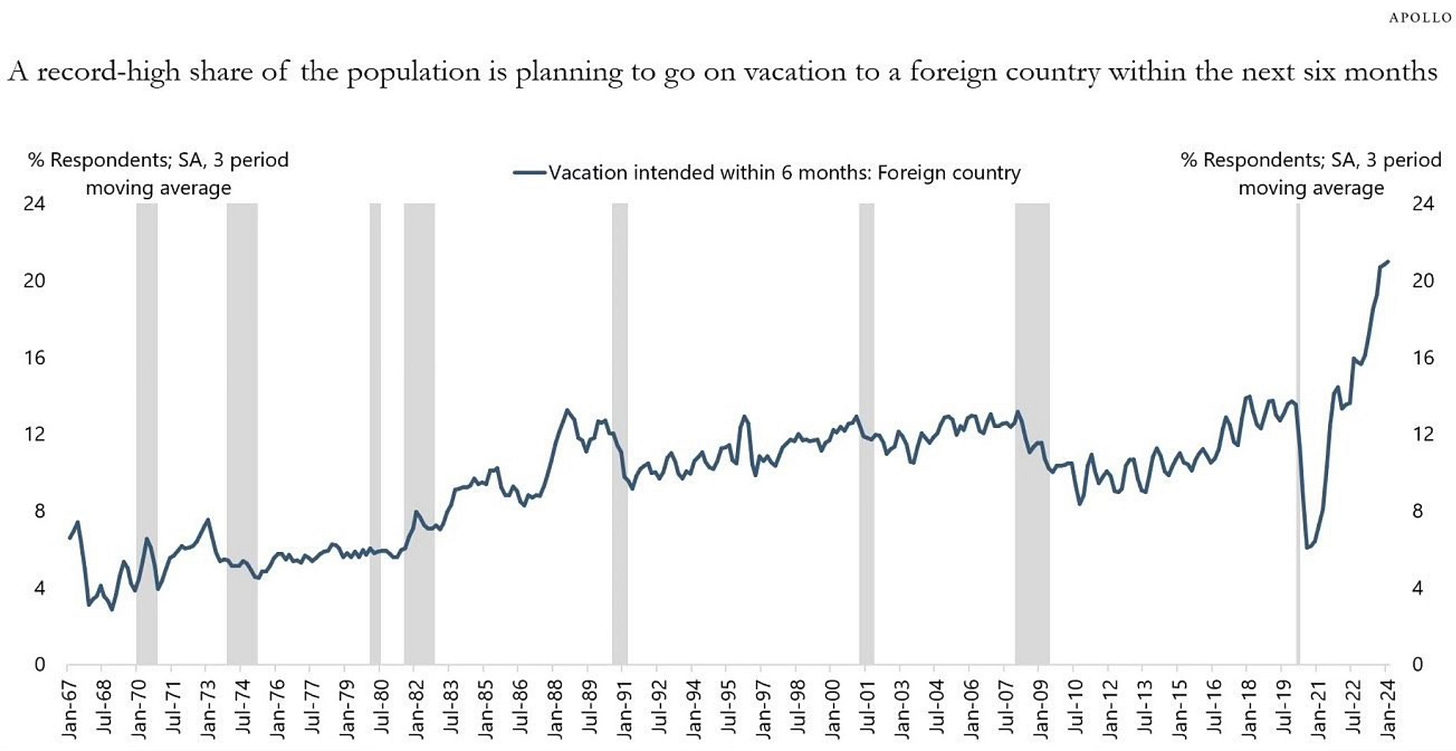
People still want to vacation! This chart shows that a record number of people are planning to go on a foreign vacation in the next 6 months.
Thank you for reading! If you enjoyed Spilled Coffee, please subscribe.
Spilled Coffee grows through word of mouth. Please consider sharing this post with someone who might appreciate it.
Order my book, Two-Way Street below.

