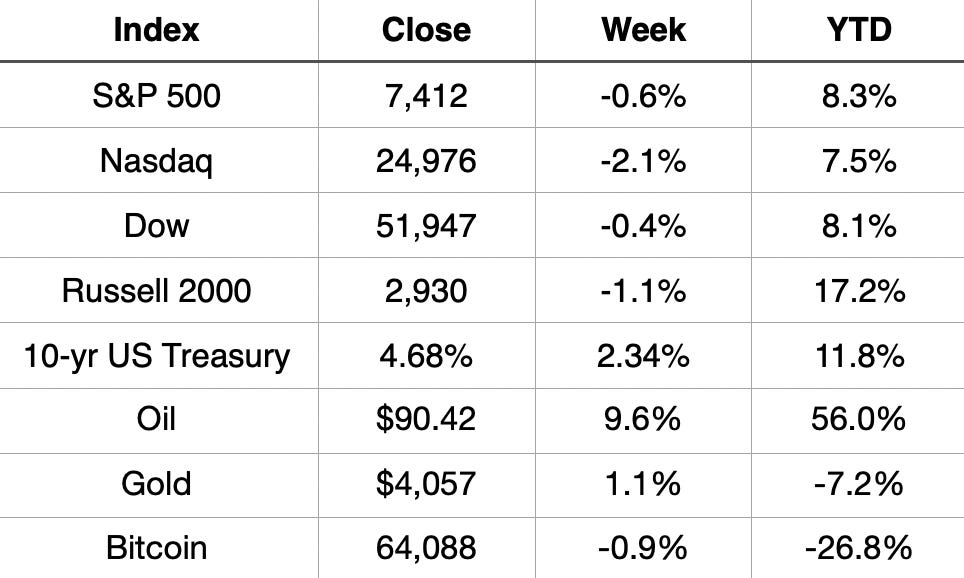
The S&P 500 and Nasdaq finished negative for the second straight week. The Nasdaq took the biggest hit, down 2.1% on the week. Small caps held up better, with the Russell only down 1.1% and still the leader among the major indices up 17.2% on the year.
Oil remains the main story. Up 9.6% on the week and now up 56% on the year. A hard number to ignore. Treasury yields moved higher too, with the 10-year jumping over 2% for the week alone.
Market Recap
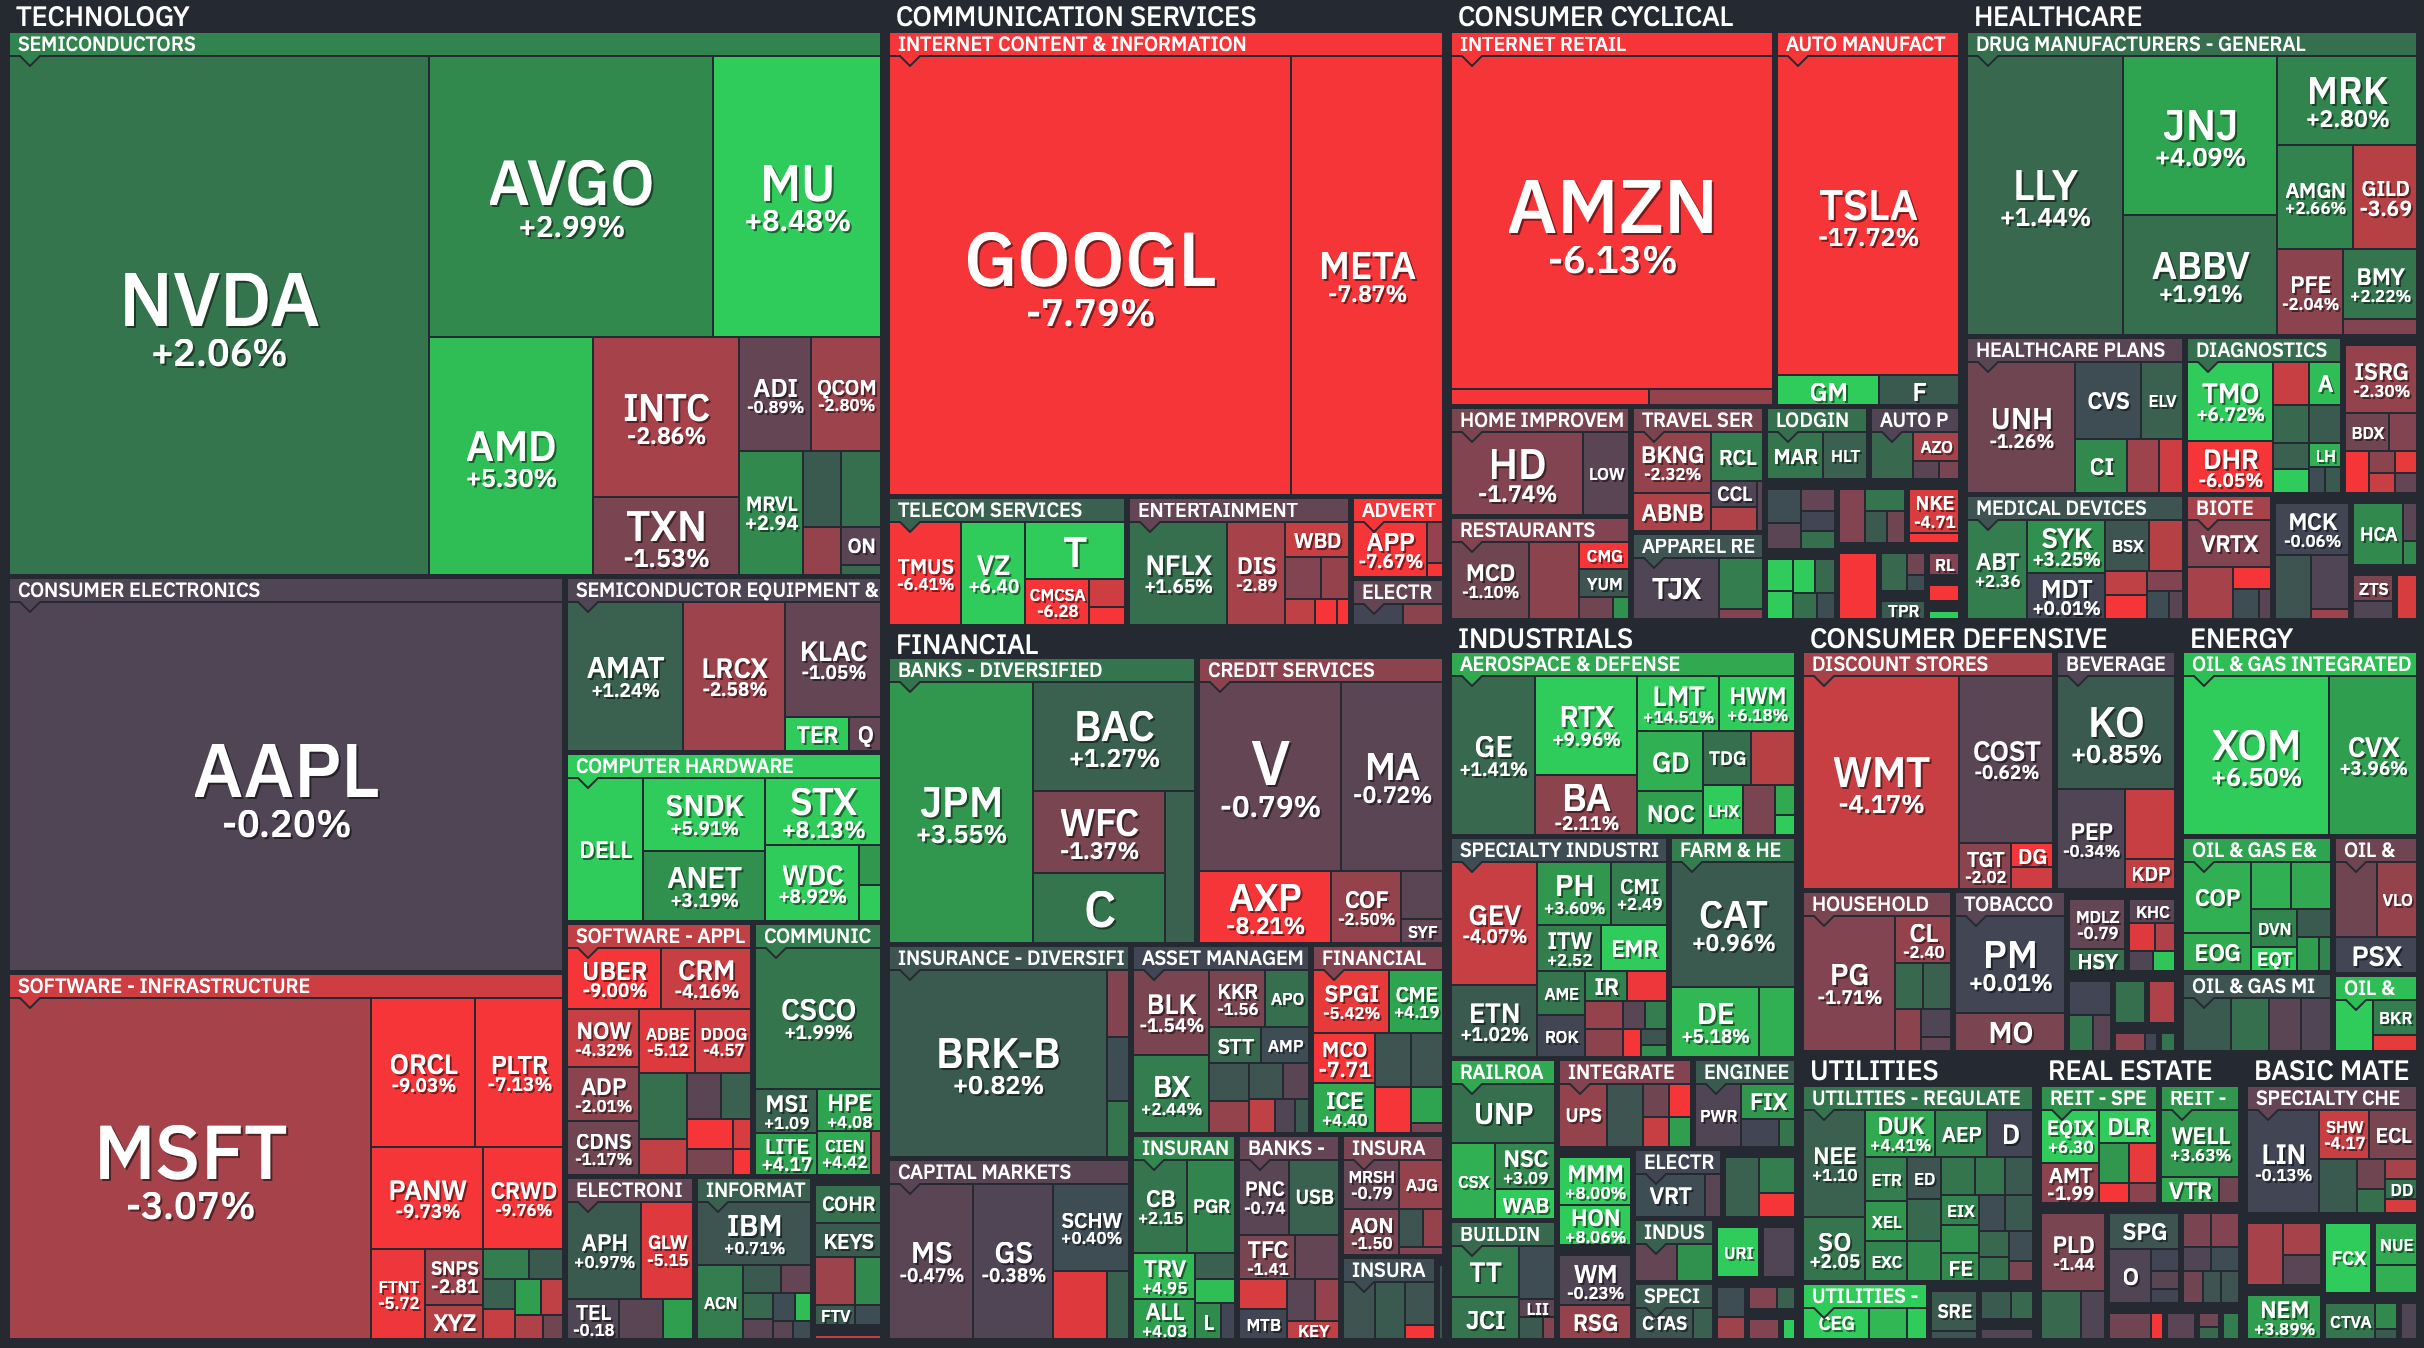
Weekly Heat Map Of Stocks
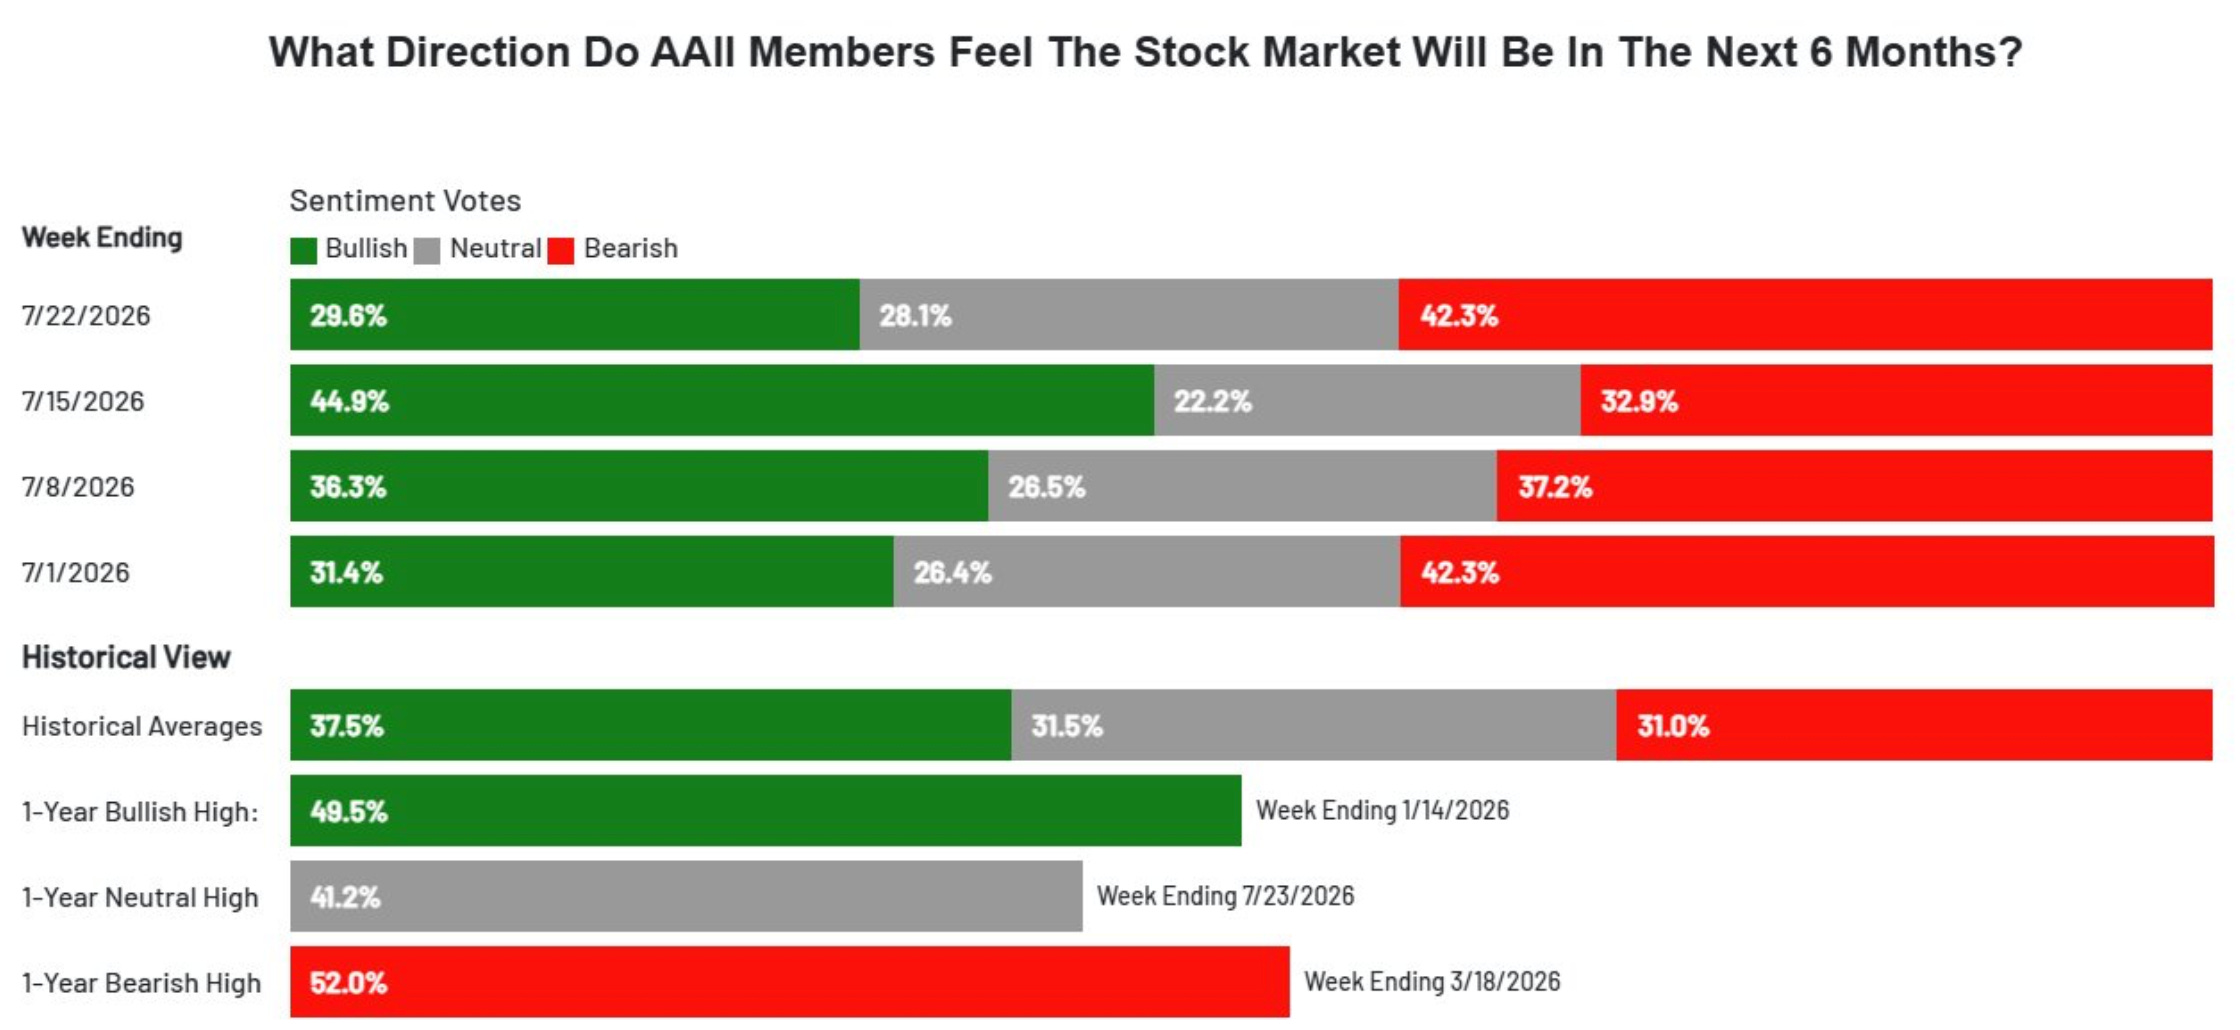
Sentiment Check
Bullish sentiment fell 15%. That’s the lowest bull reading since September.
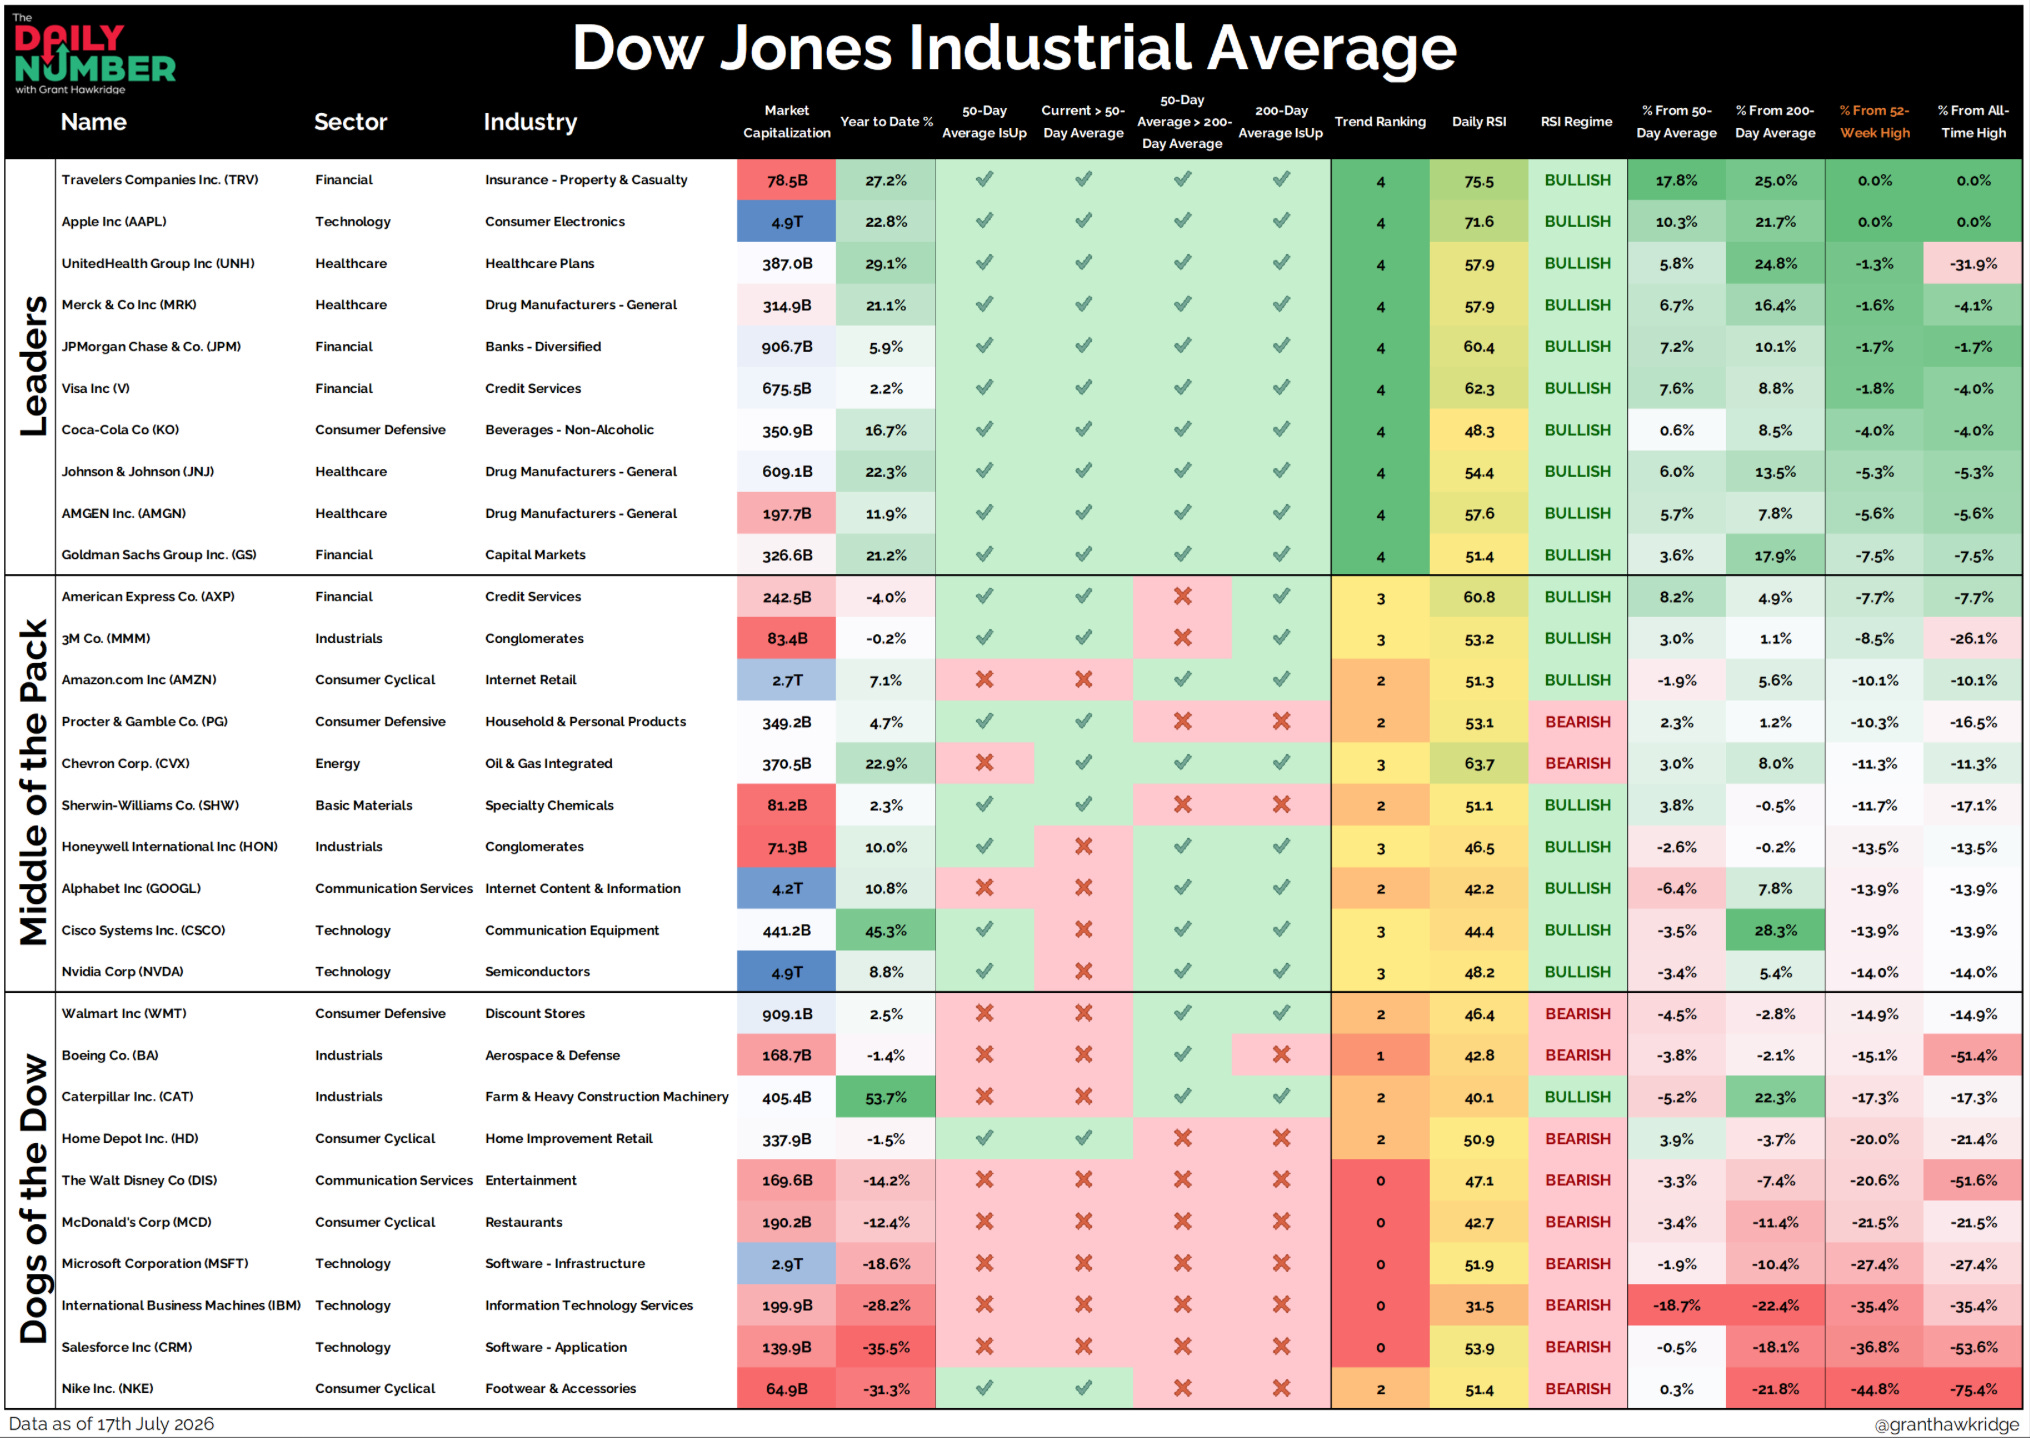
The Dow Components Update
The Bigger Picture
If you zoom out, the market is still sending some rather bullish signals.
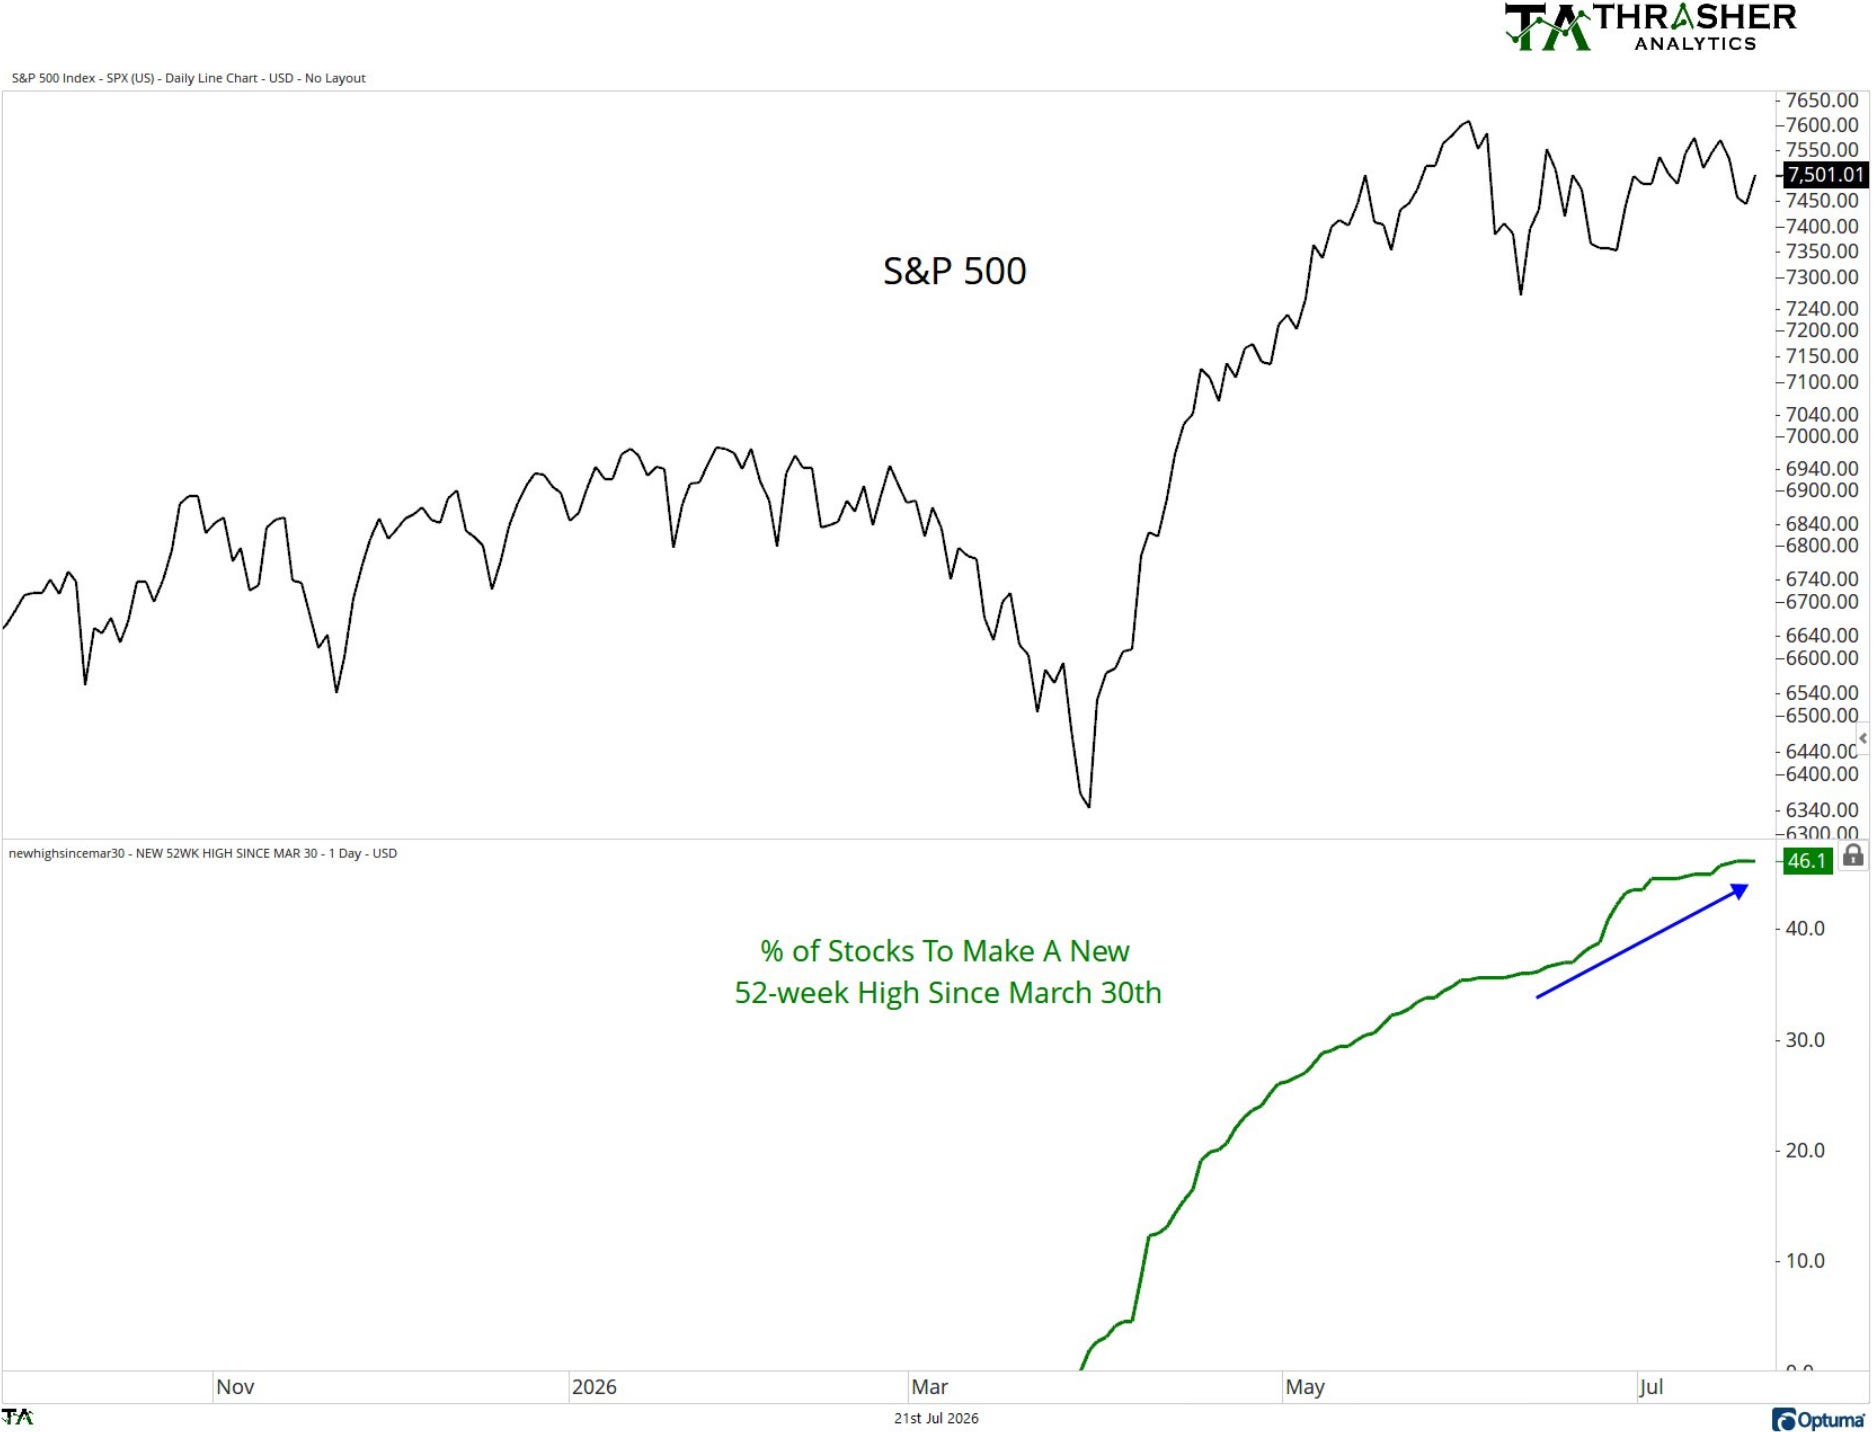
Since March 30th, 46% of S&P 500 companies have made a new 52-week high. That number has risen from a recent 35%.
That’s a huge chunk of the index participating in this rally, not just a handful of names. That would explain why the S&P 500 is still only a few percentage points away from all-time highs.
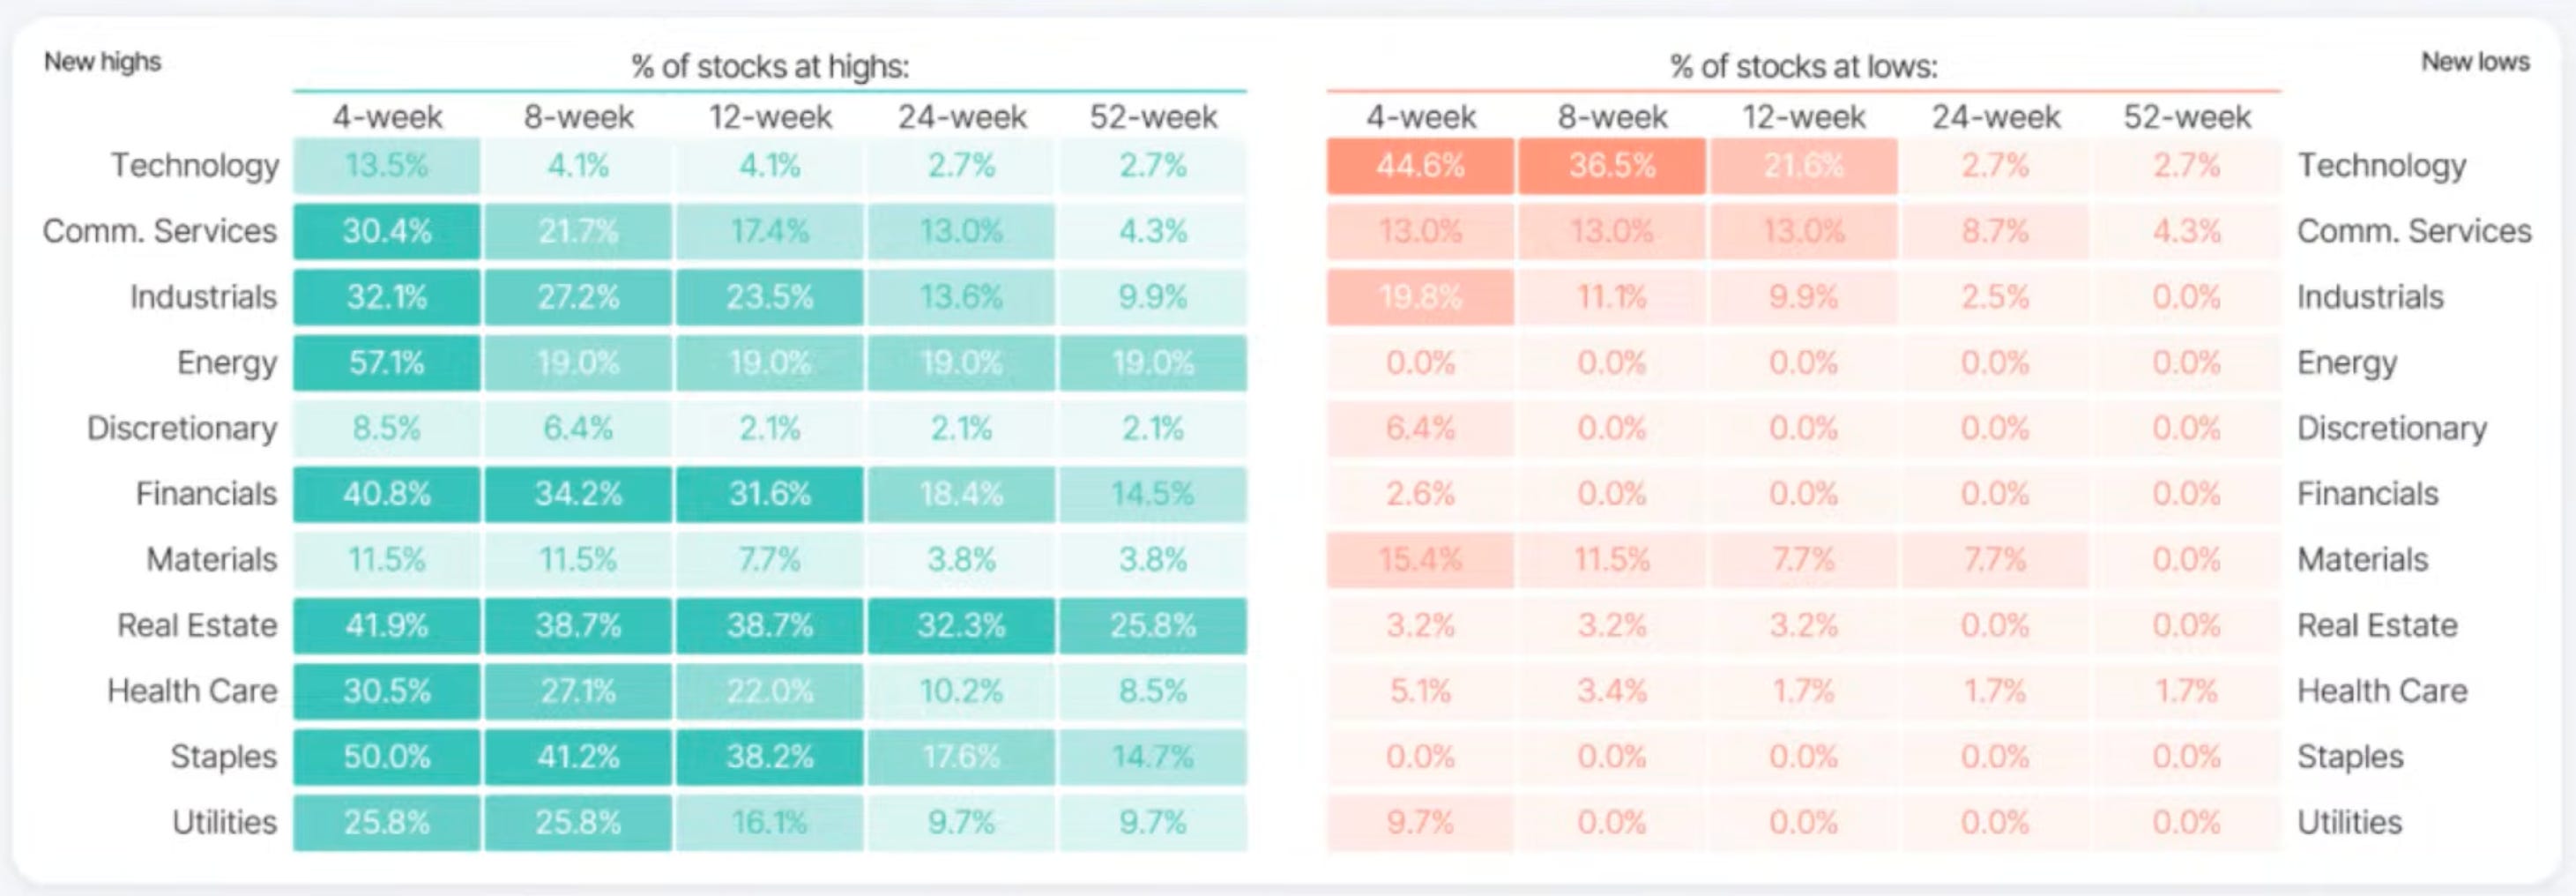
Let’s break it down by sector and it gets even more interesting.
Energy, staples and real estate lead on the high side. Energy really stands out, zero percent of energy stocks are at lows across any single timeline. Not one. I’ll discuss energy more in a bit.
Technology tells a different story. Only 13.5% of tech stocks are at a 4-week high, but 44.6% are at 4-week lows. That’s the highest reading on the entire lows table. This is important and worth watching given how much tech drives the market, sentiment and the news headlines.
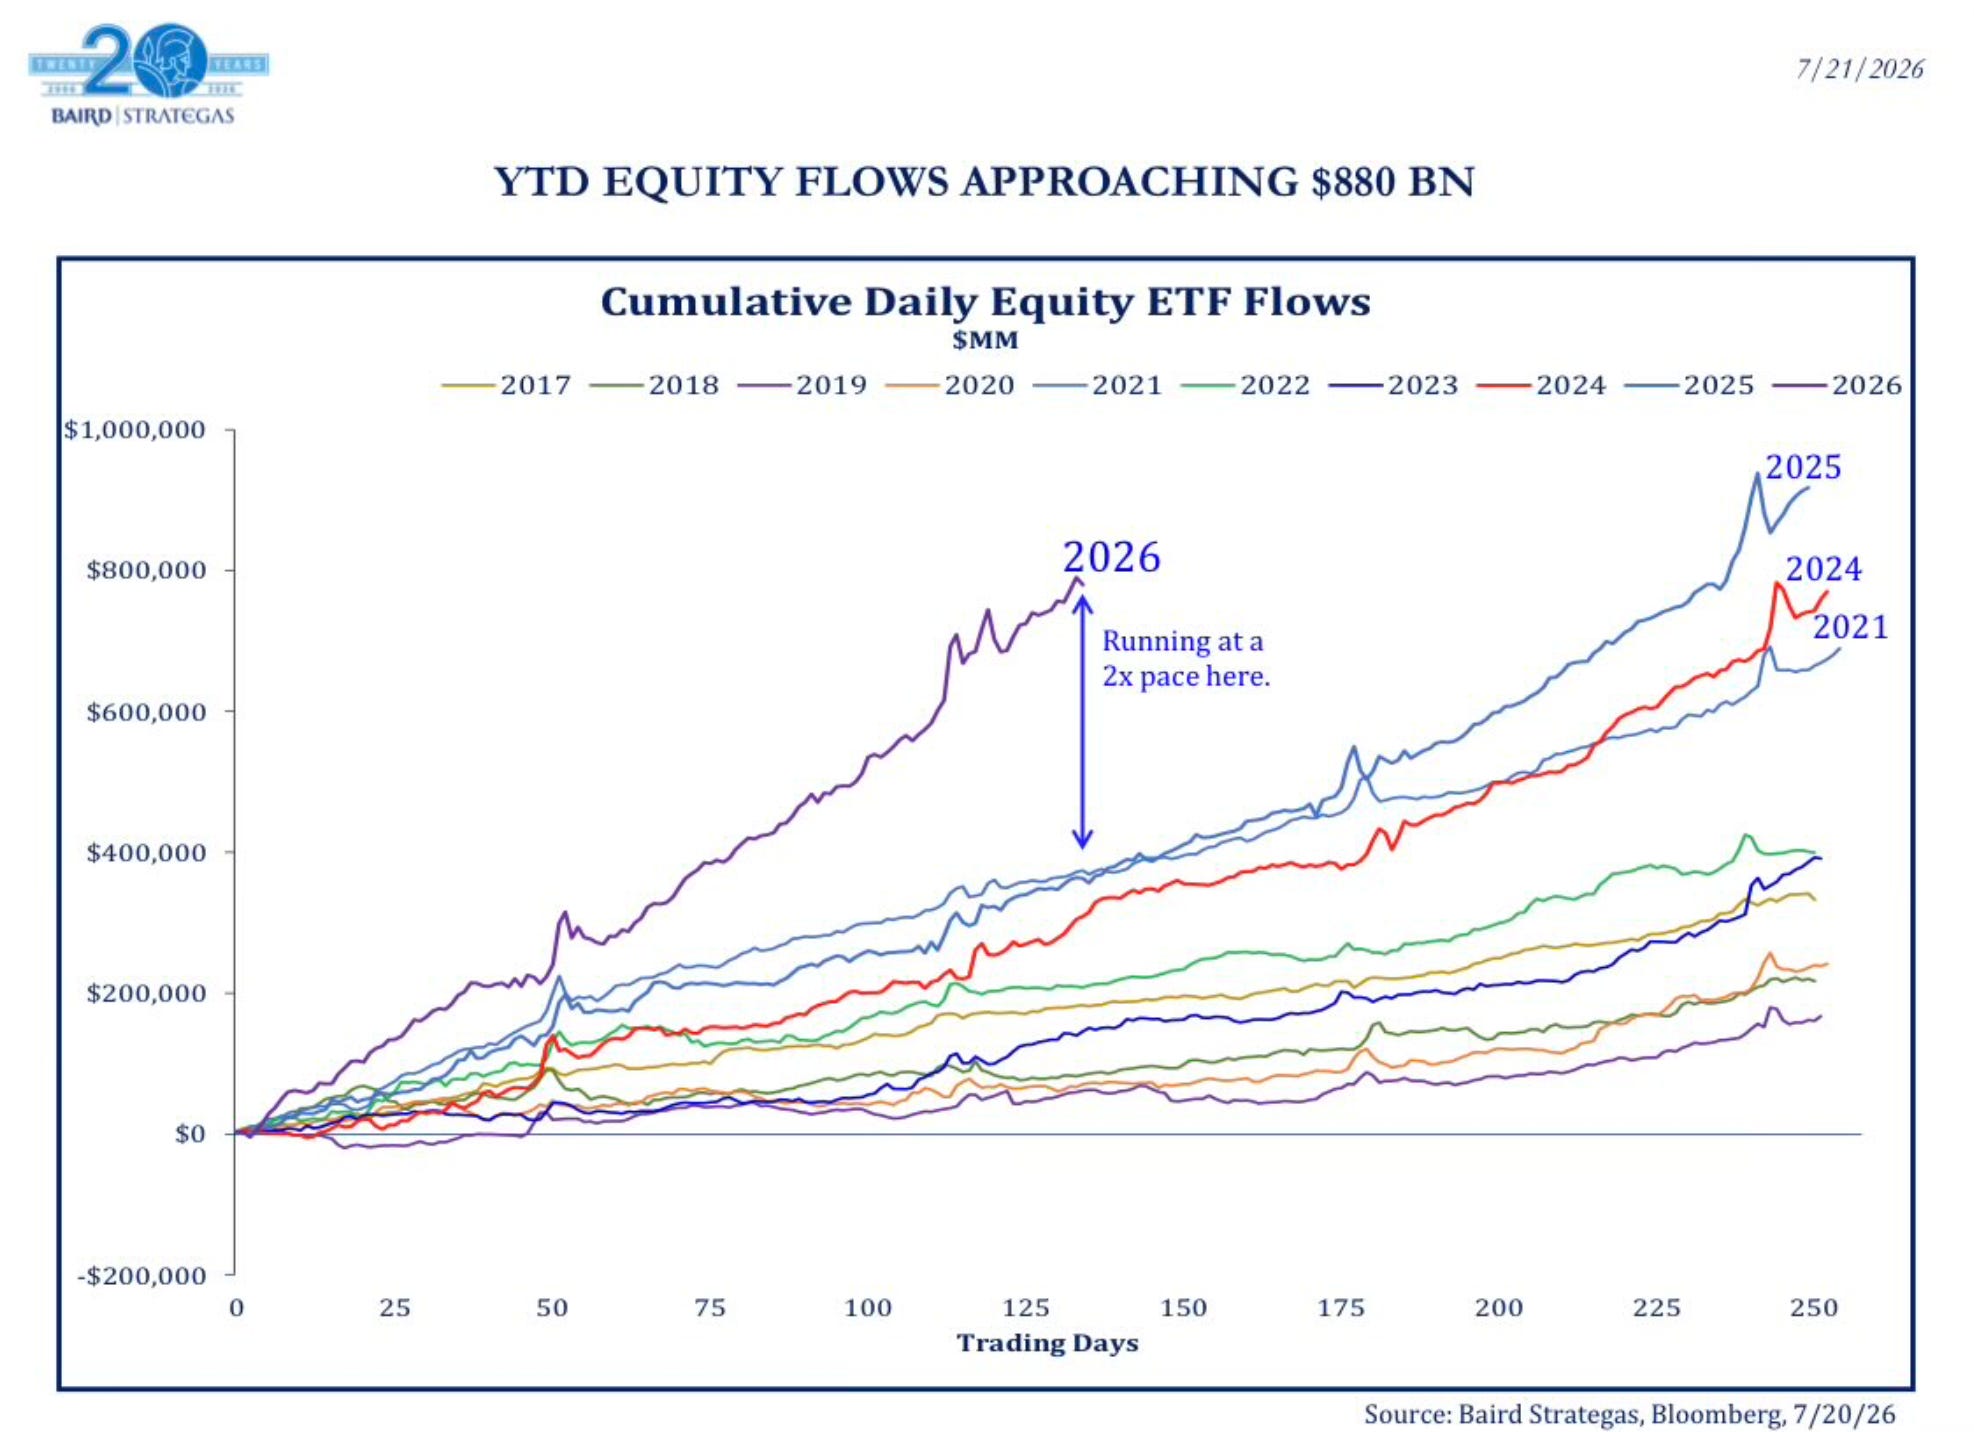
Money also continues to pour into equities at a pace that’s hard to wrap your head around. YTD equity flows are blowing away every historical comparison, running at more than double the pace of 2021 and 2025 at this same point. This year isn’t close to any other year on record.