
Investing Update: An Updated Look At My Portfolio
What I'm buying, selling & watching
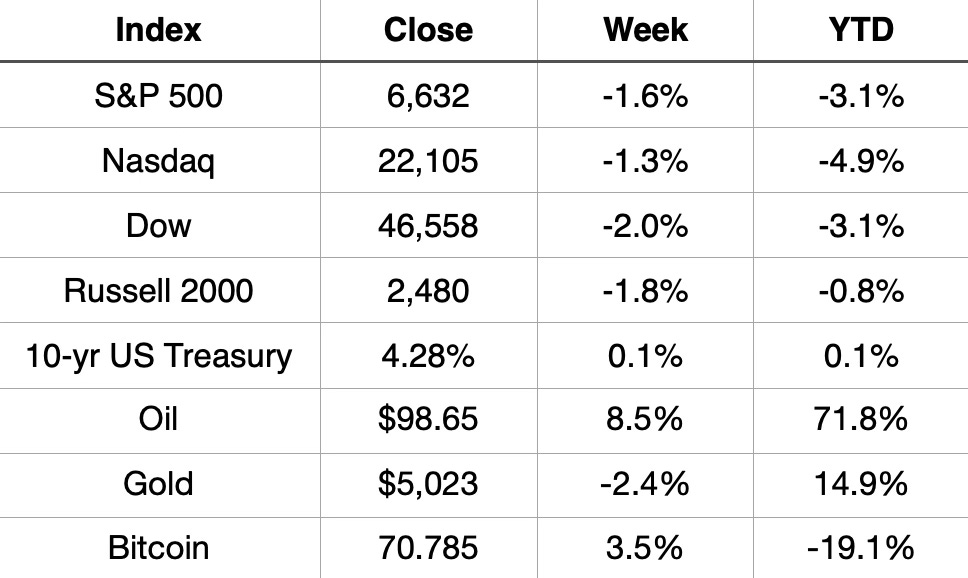
The selling pressure didn’t let up this week. All four major U.S. equity indices finished lower for the third straight week, with the Dow and S&P 500 closing in the red for four consecutive sessions. The S&P 500’s close at 6,632 marked its lowest level since November 21st.
The Nasdaq continues to bear the most YTD damage, now down nearly 5% on the year as growth and tech names absorb the brunt of the rotation. Small caps, despite their relative insulation so far, slipped again this week.
The real story, however, continues to play out in commodities. Oil surged 8.5% on the week and is now up a stunning 71.8% YTD. It’s a move that should be front of mind for anyone watching inflation dynamics. Gold pulled back modestly but remains up nearly 15% on the year. Bitcoin managed a bounce but it sits in deeply negative territory YTD.
Market Recap
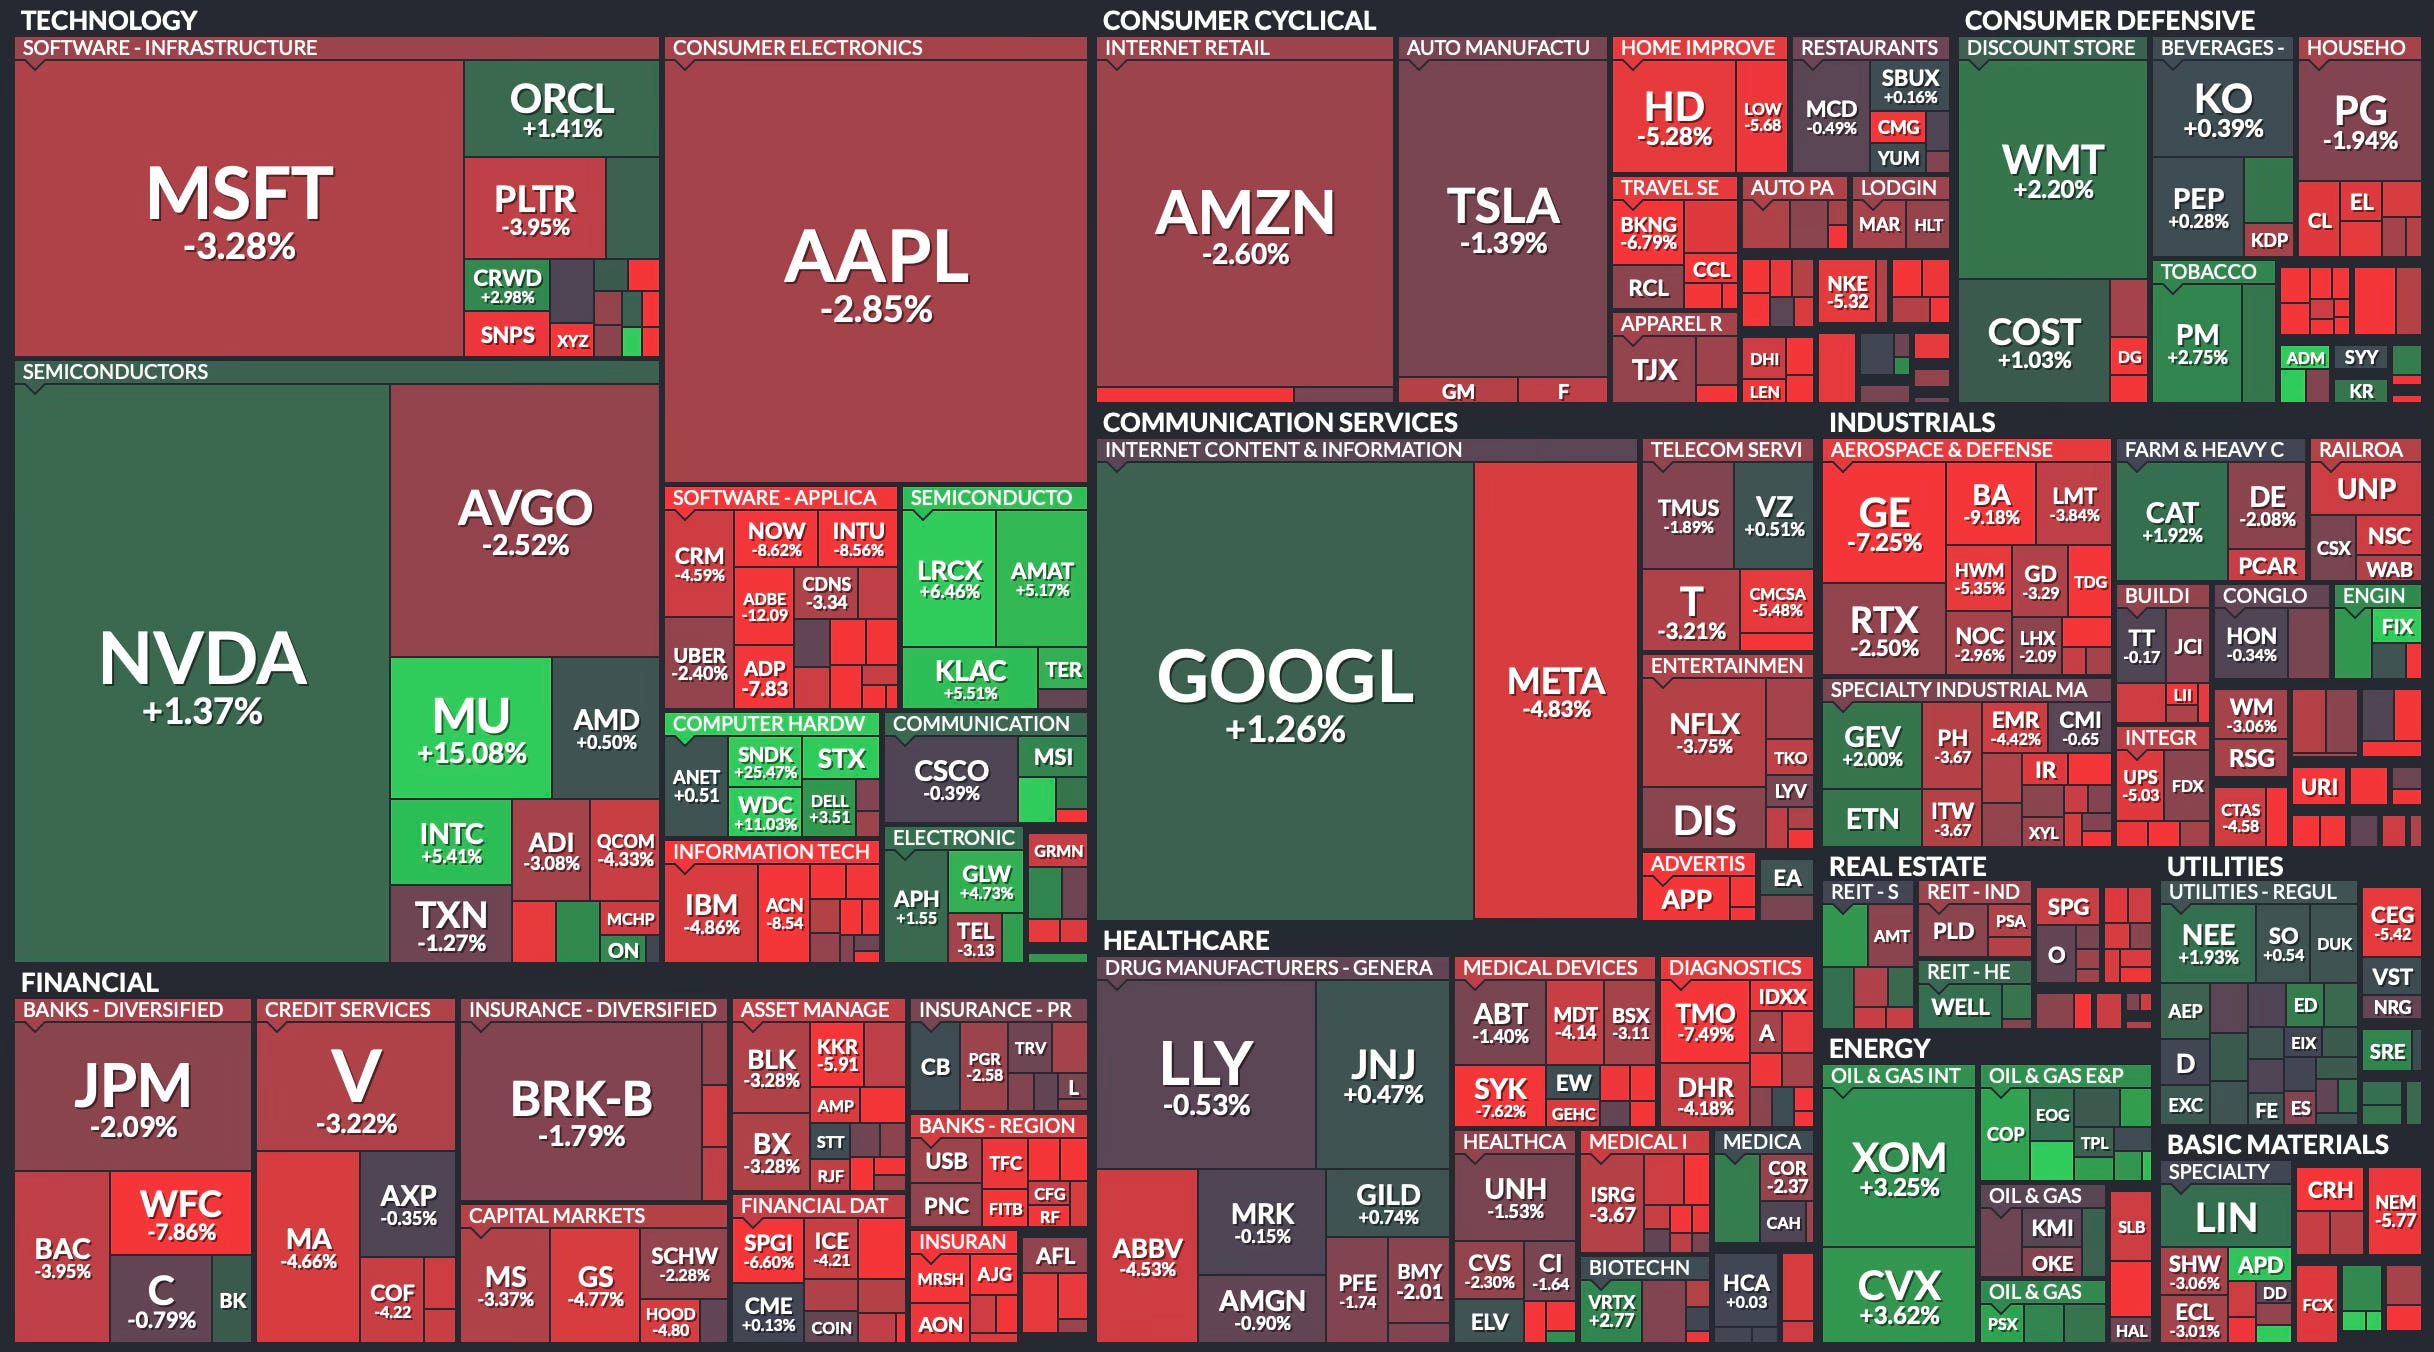
Weekly Heat Map Of Stocks
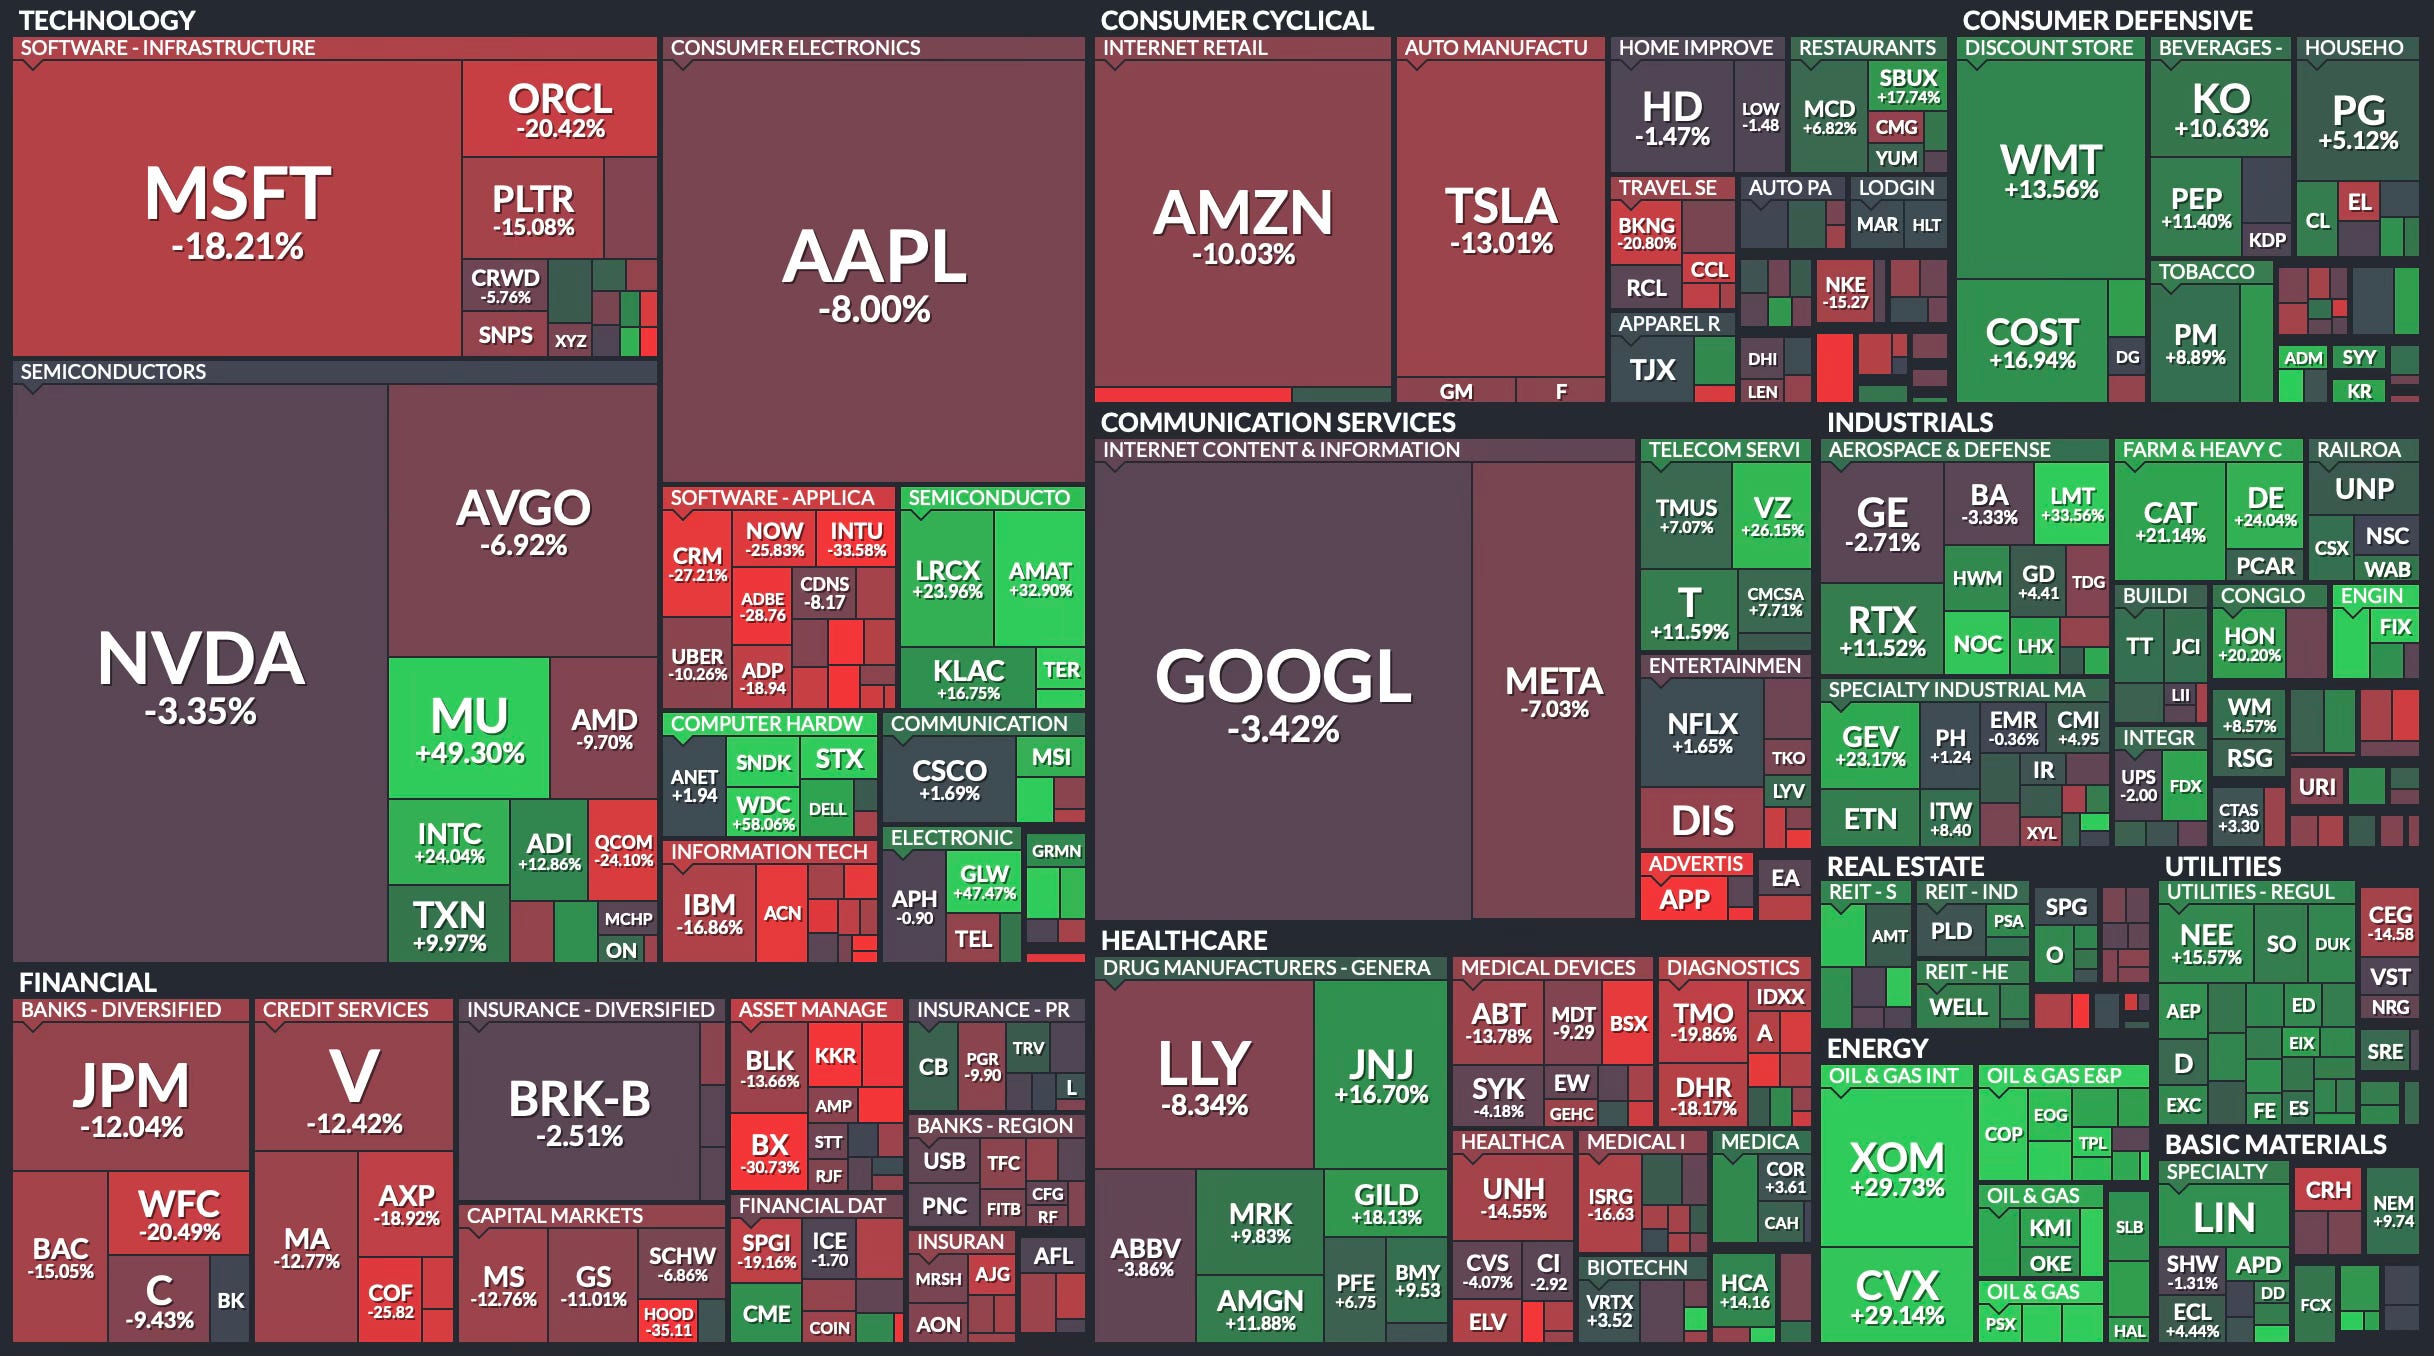
YTD Heat Map Of Stocks
Consider everything the market has absorbed over the past several months, geopolitical flare-ups, an oil shock, inflation fears, a Magnificent 7 selloff, and a chorus of recession warnings. And yet the S&P 500 sits less than 5% from its all-time high. Peak pessimism has done surprisingly little to derail the underlying bull market.
That context matters when reading this week’s sentiment data. Bearish readings among individual investors jumped again, with nearly half of AAII respondents now expecting stocks to fall over the next six months. That’s the fourth consecutive week where bears outnumber bulls. That’s a lot of pessimism for a market that hasn’t actually broken down.
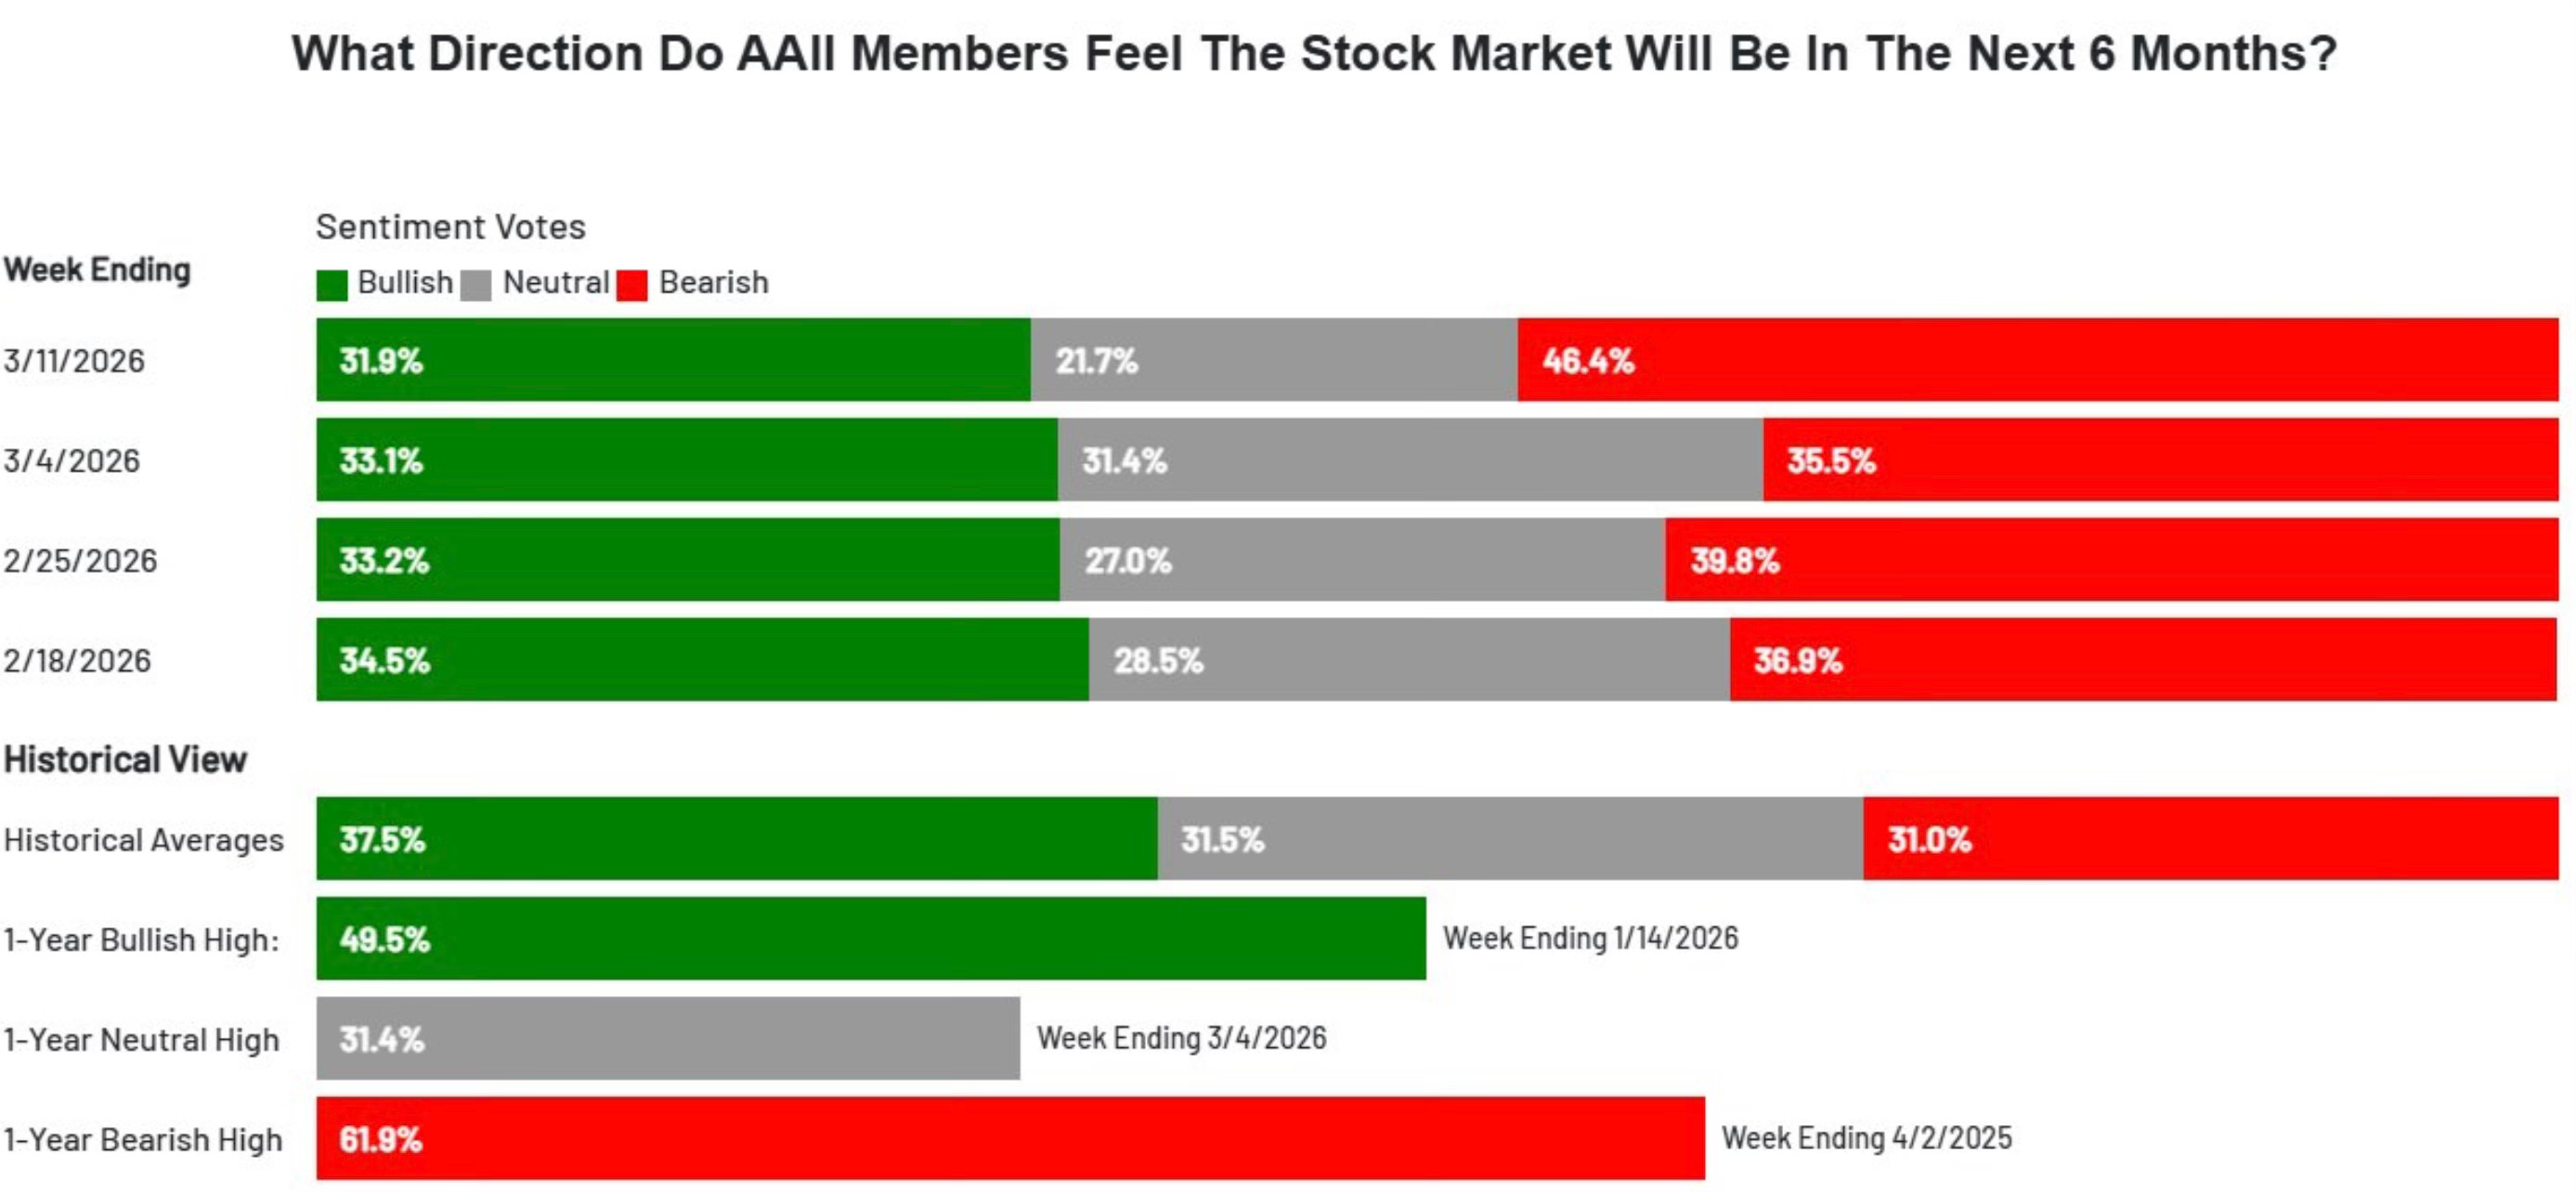
Here's the thing though, the majority of stocks haven't gone down. The index is off, but it hasn't collapsed. Which brings us to the technical picture.