
Investing Update: An Opportunity In Software?
What I'm buying, selling & watching
It was a high-drama week on Wall Street, shaped by megacap earnings, a meaningful shift in Federal Reserve leadership, and historic volatility in the precious metals market.
Major indices delivered mixed results, punctuated by a milestone moment on Wednesday when the S&P 500 briefly touched 7,000 for the first time before retreating.
The S&P 500 eked out a weekly gain and finished January up about 2 percent, its strongest month since October, while the Dow and Nasdaq posted their third straight weekly declines.
Market Recap
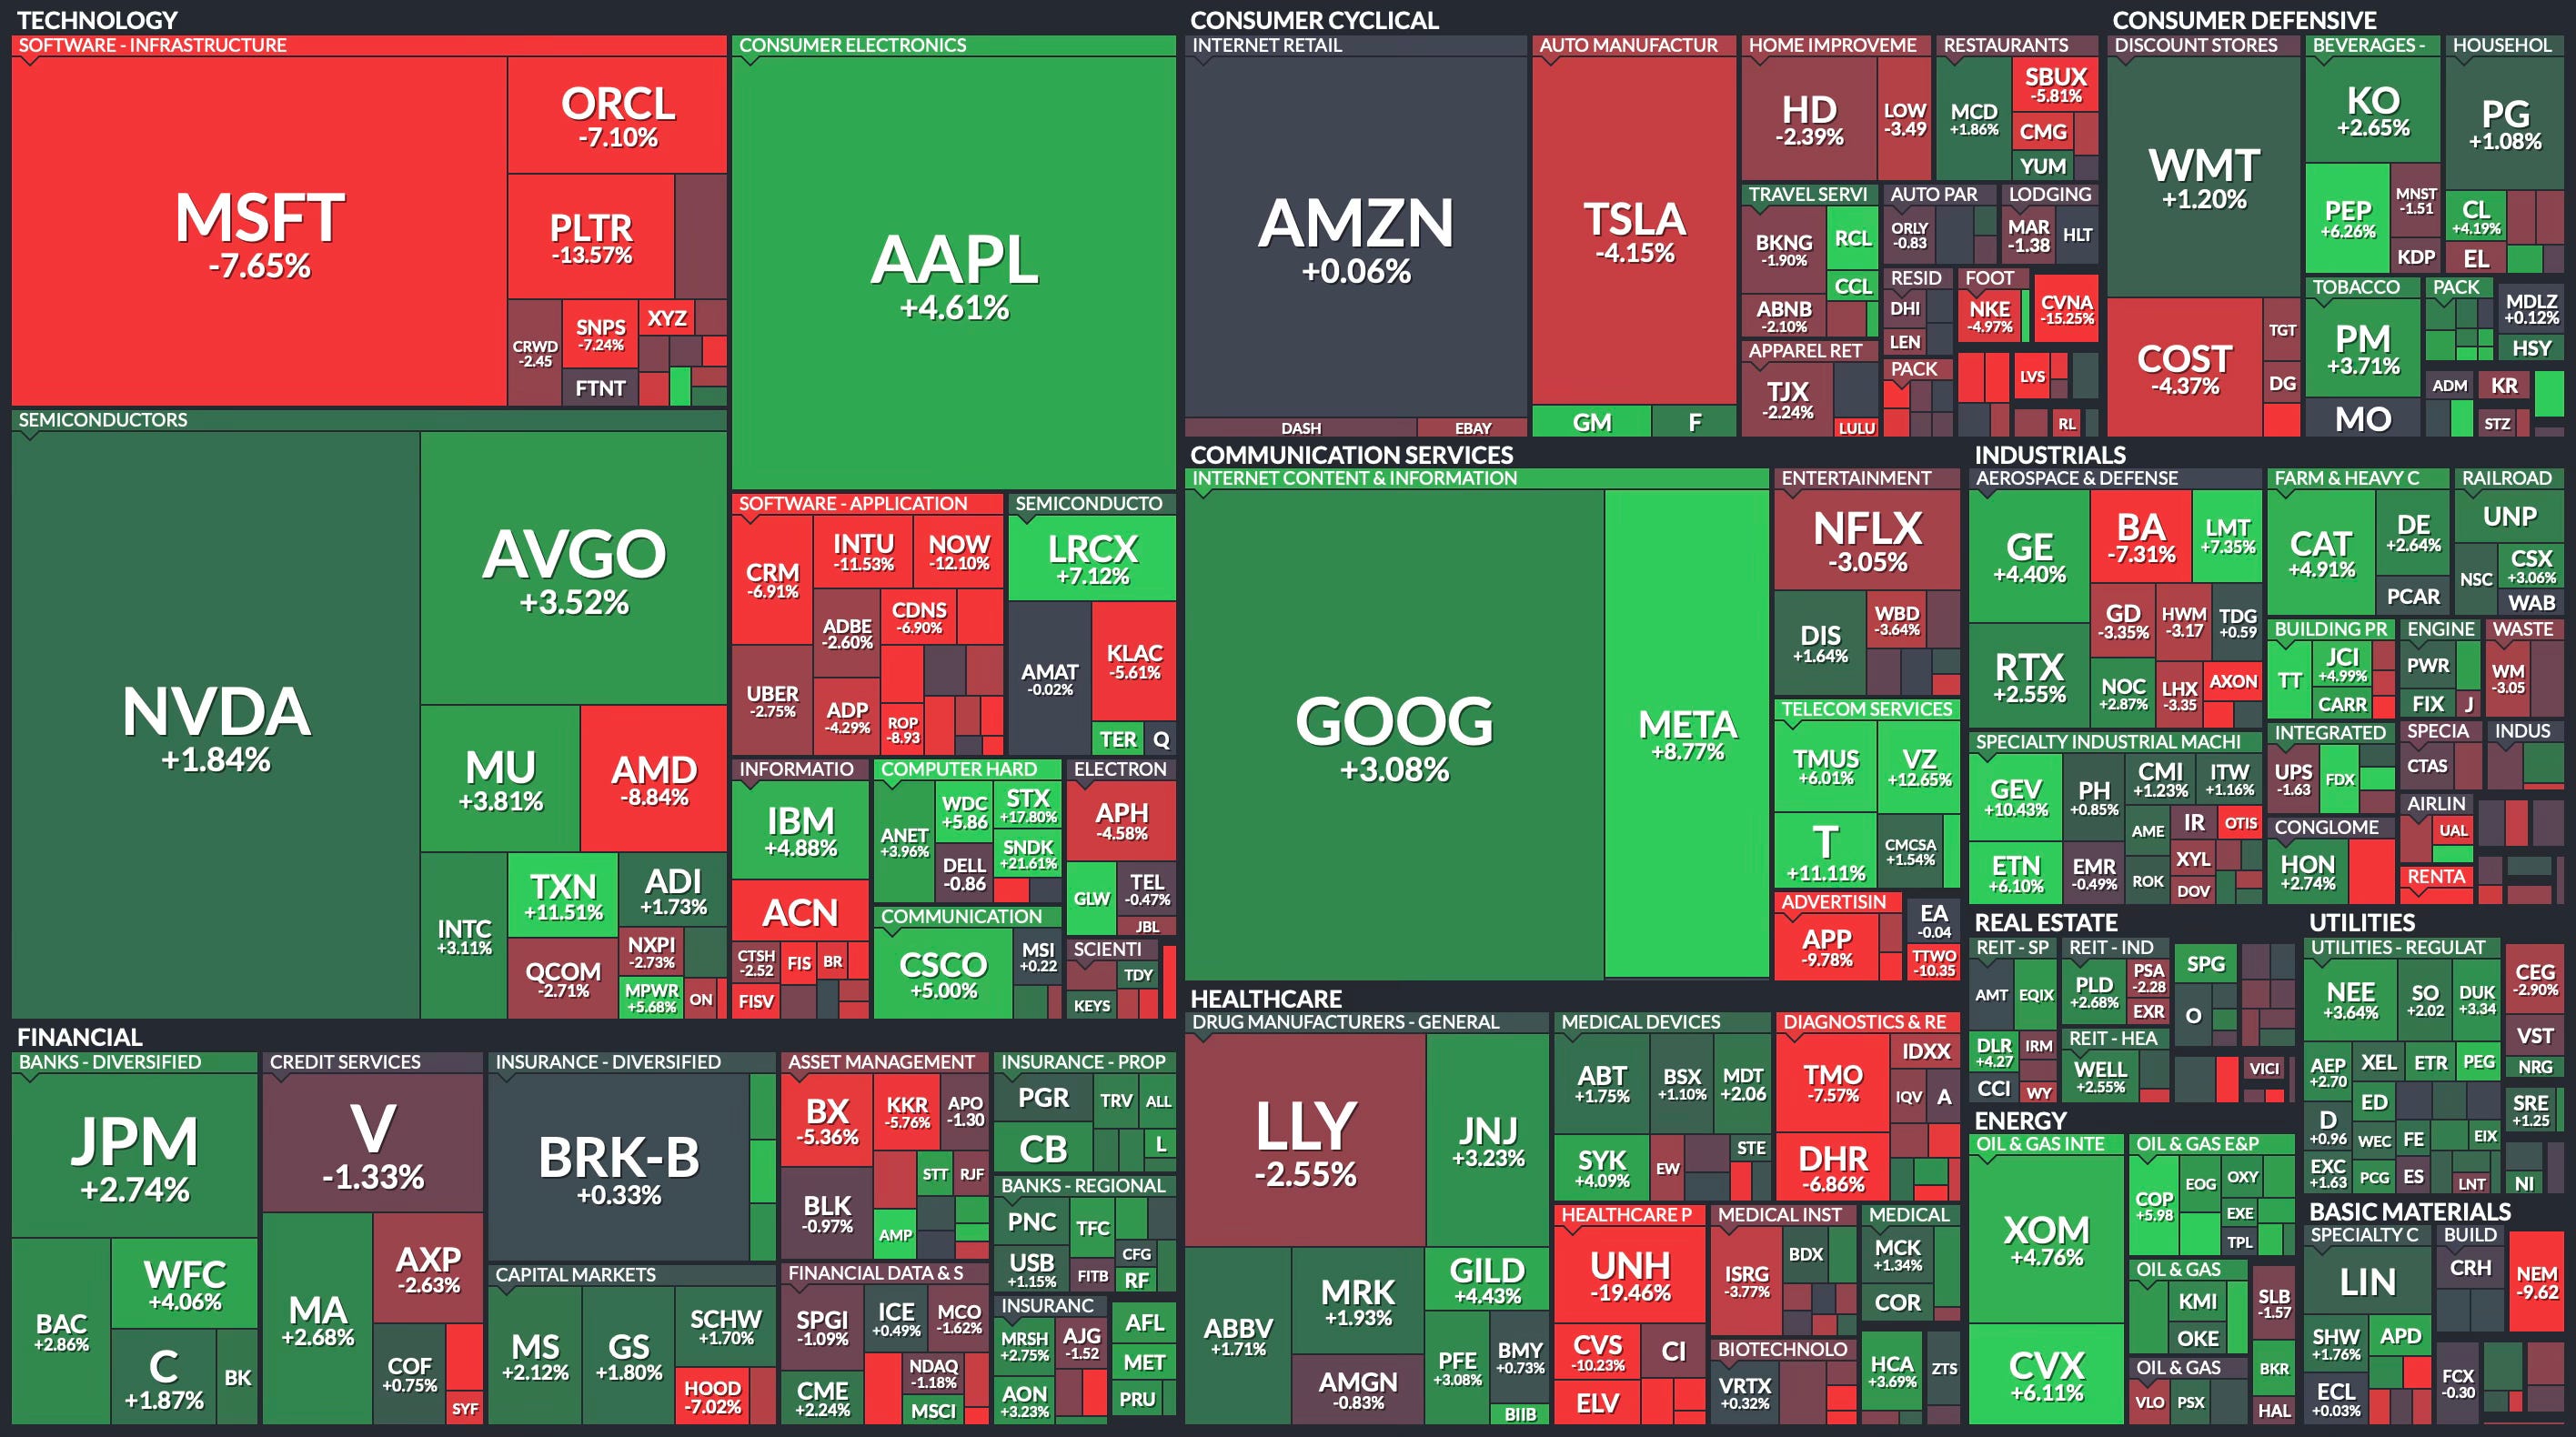
Weekly Heat Map Of Stocks
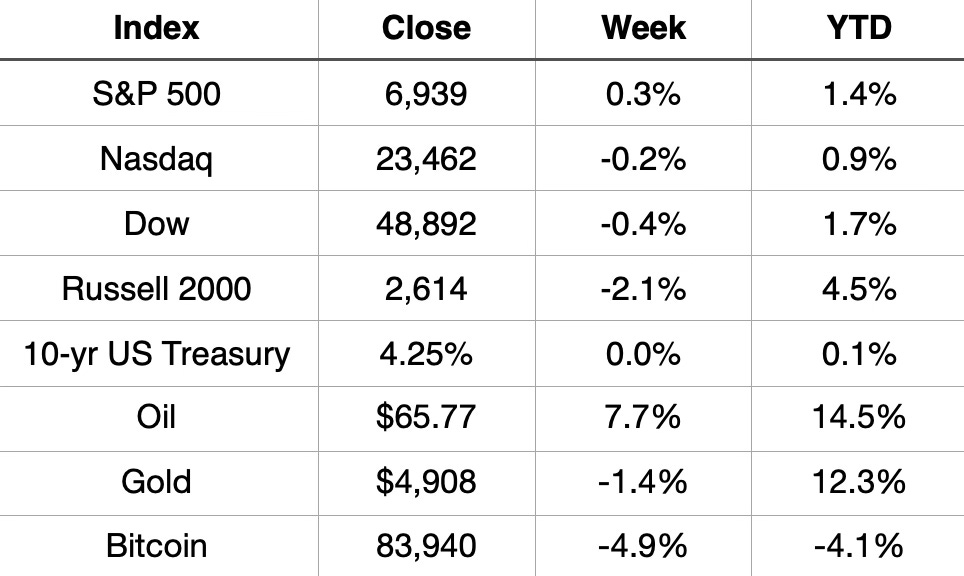
January delivered modest but positive returns across the board, with all three major indices finishing the month in the green despite significant late-month volatility. The S&P 500 gained 1.4%, the Dow rose 1.7%, and the Nasdaq advanced 0.9%
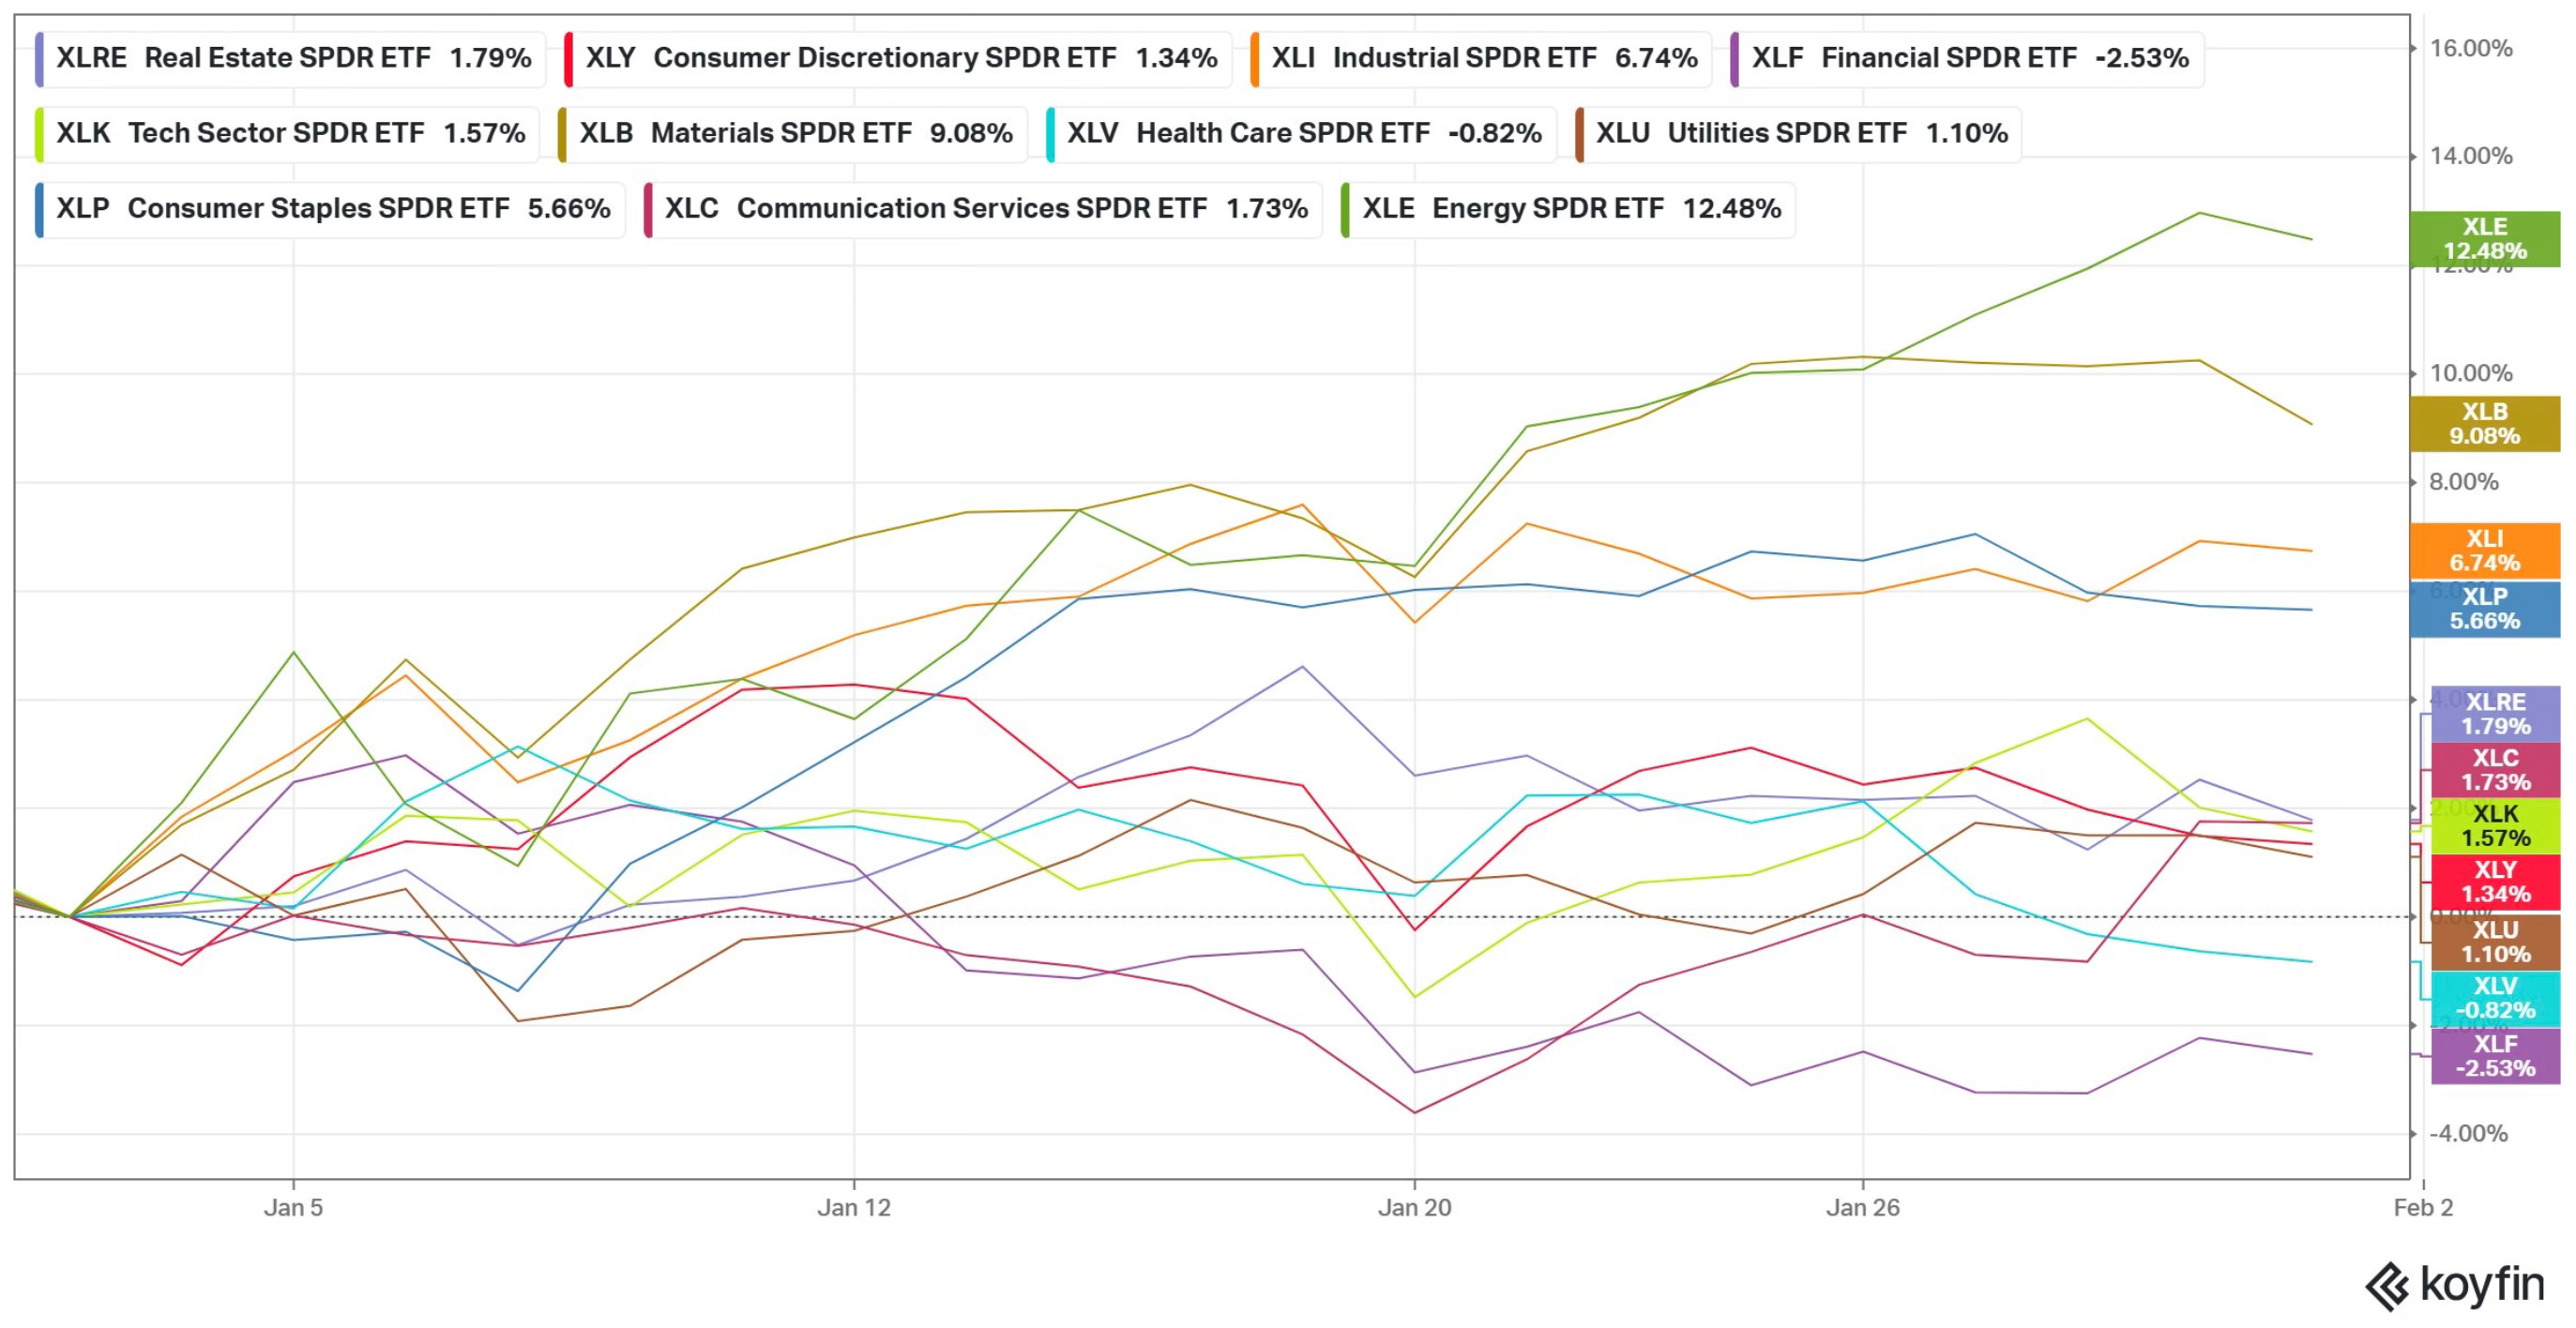
The weakest S&P 500 sector ETFs in January were financials and health care, while energy led the market by a wide margin.
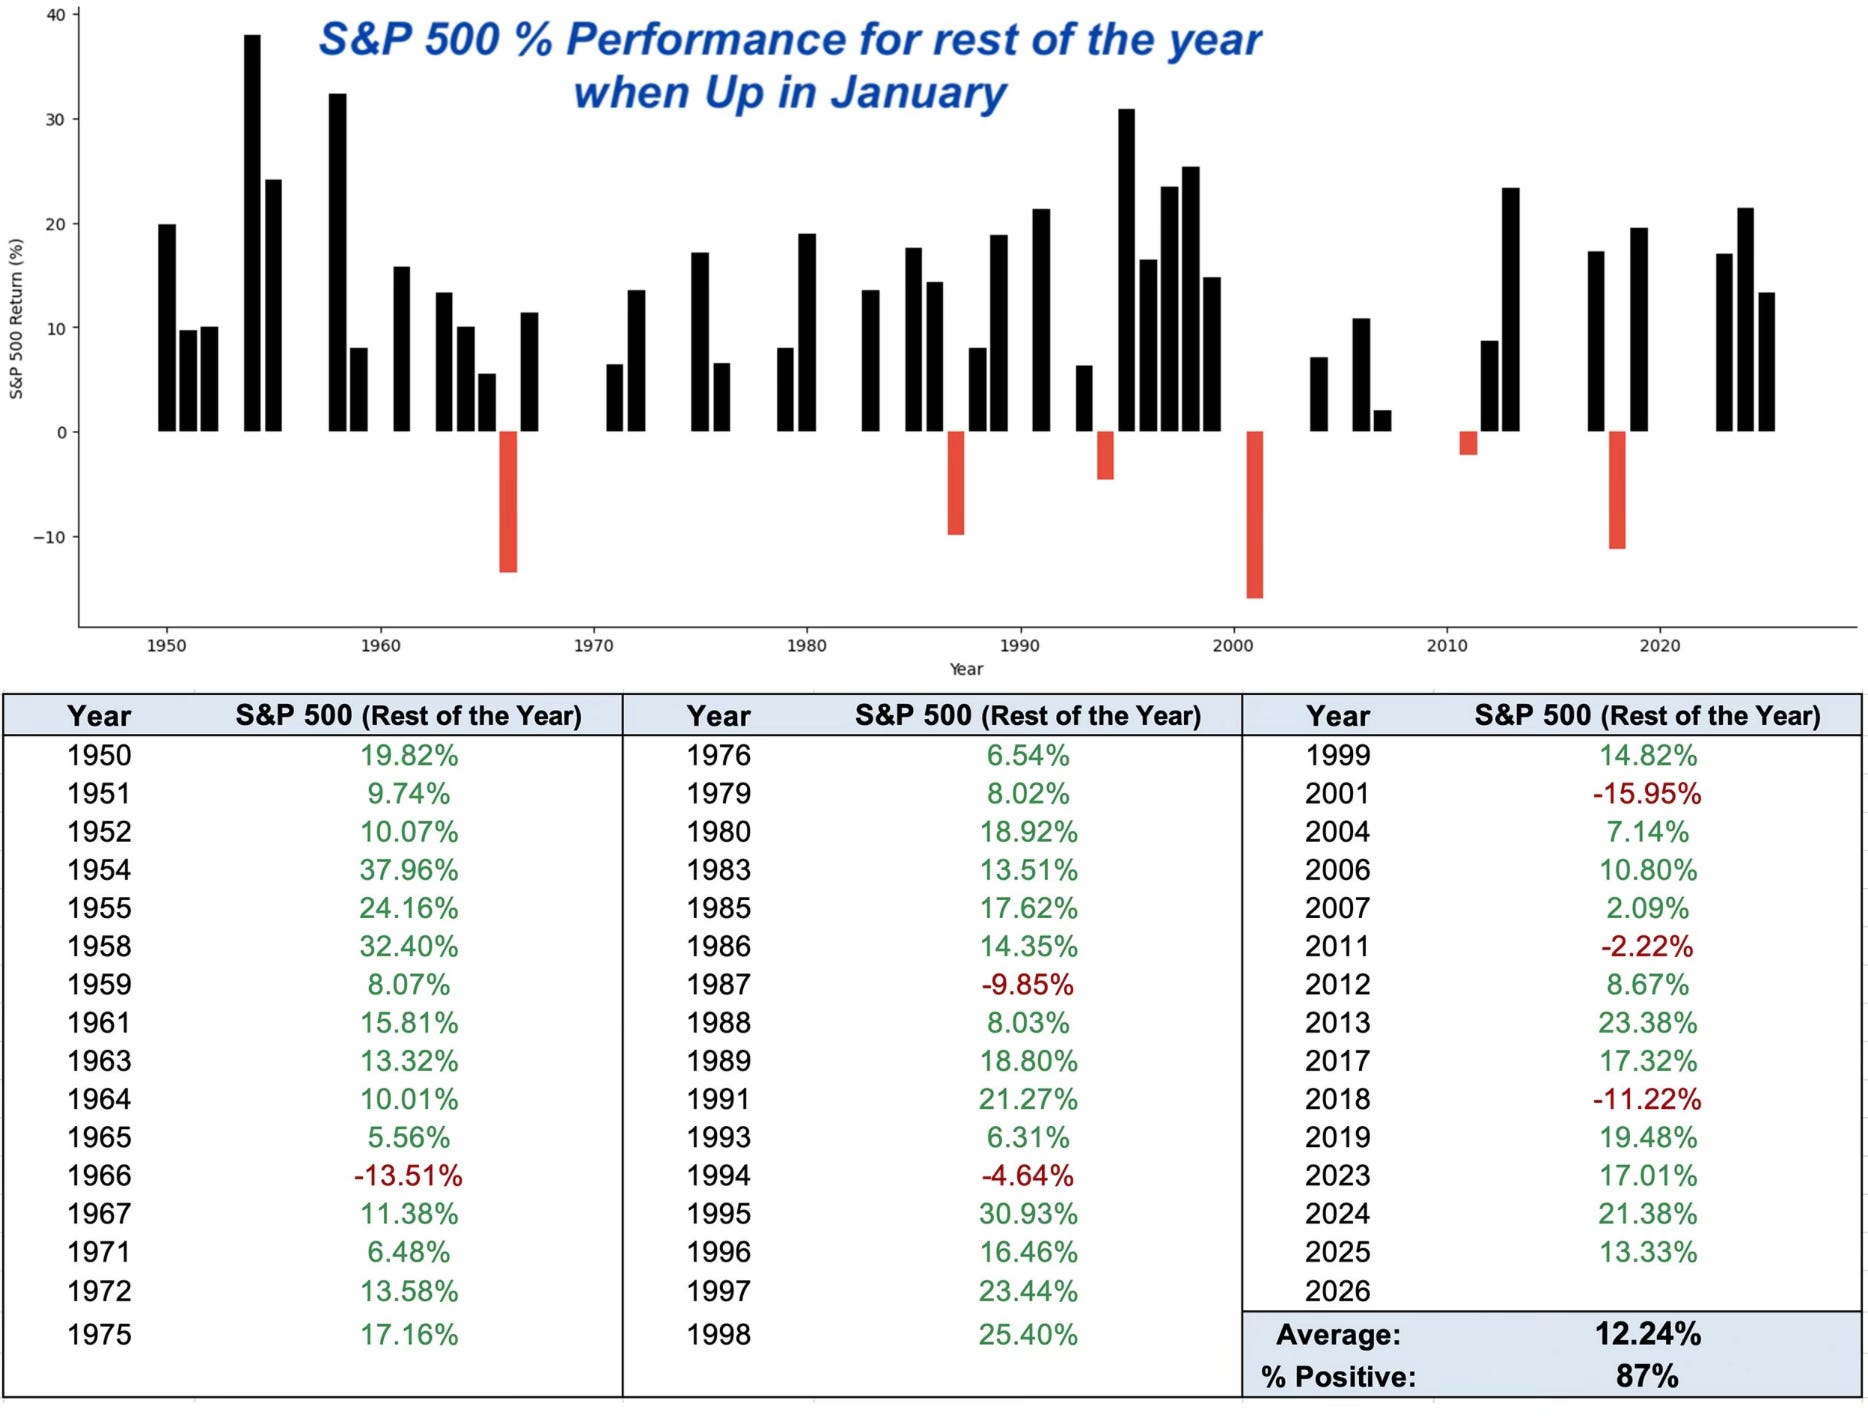
A positive January has historically been a strong signal for the rest of the year.
The S&P 500 finished January up 1.4%, and when January ends higher, the market has gone on to post gains for the rest of the year roughly 87% of the time going back to 1950, with an average return of 12.24%.
The calendar now flips to February, one of the two worst months of the year historically. The only month with a poorer track record is September. In fact, February and September are the only months that have averaged negative returns going back to 1950, including over the past 10- and 20-year periods.
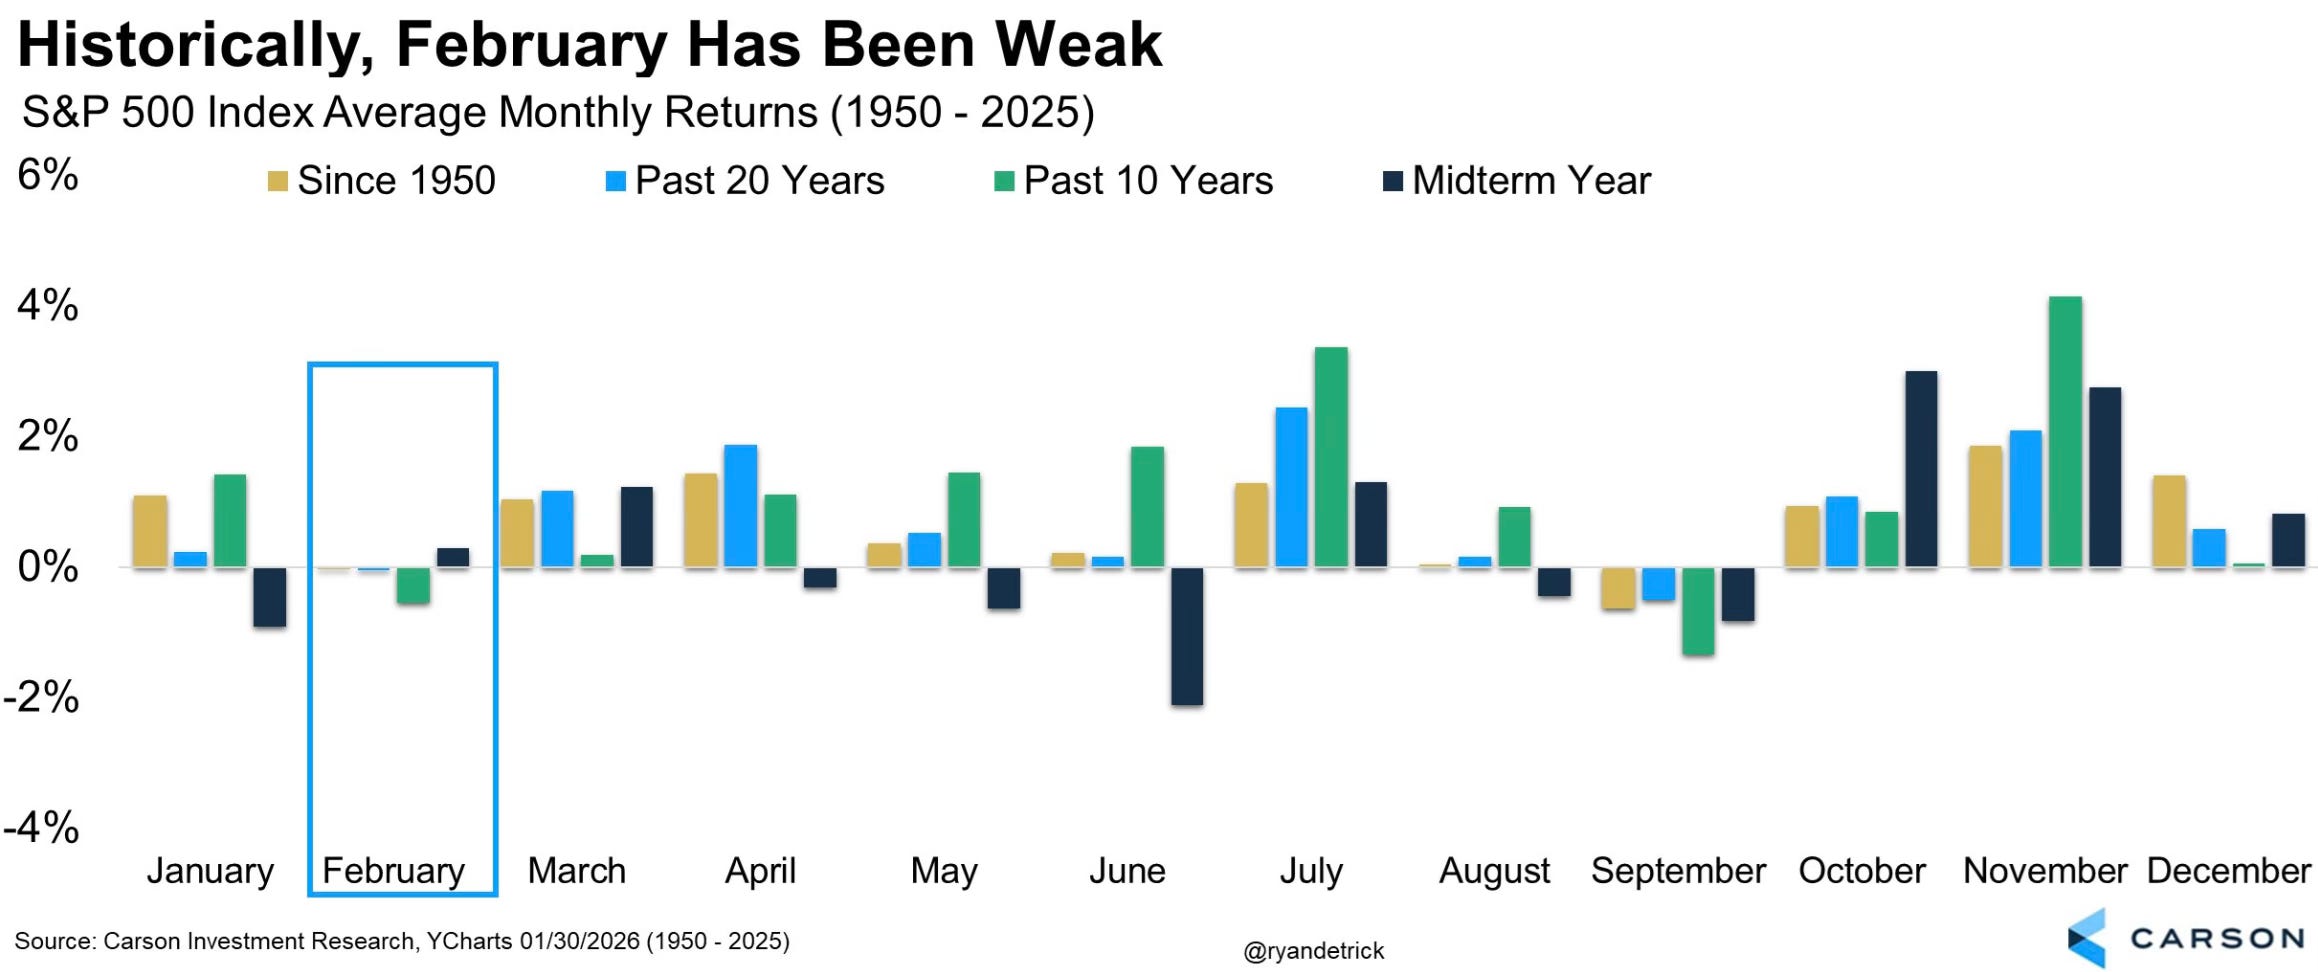
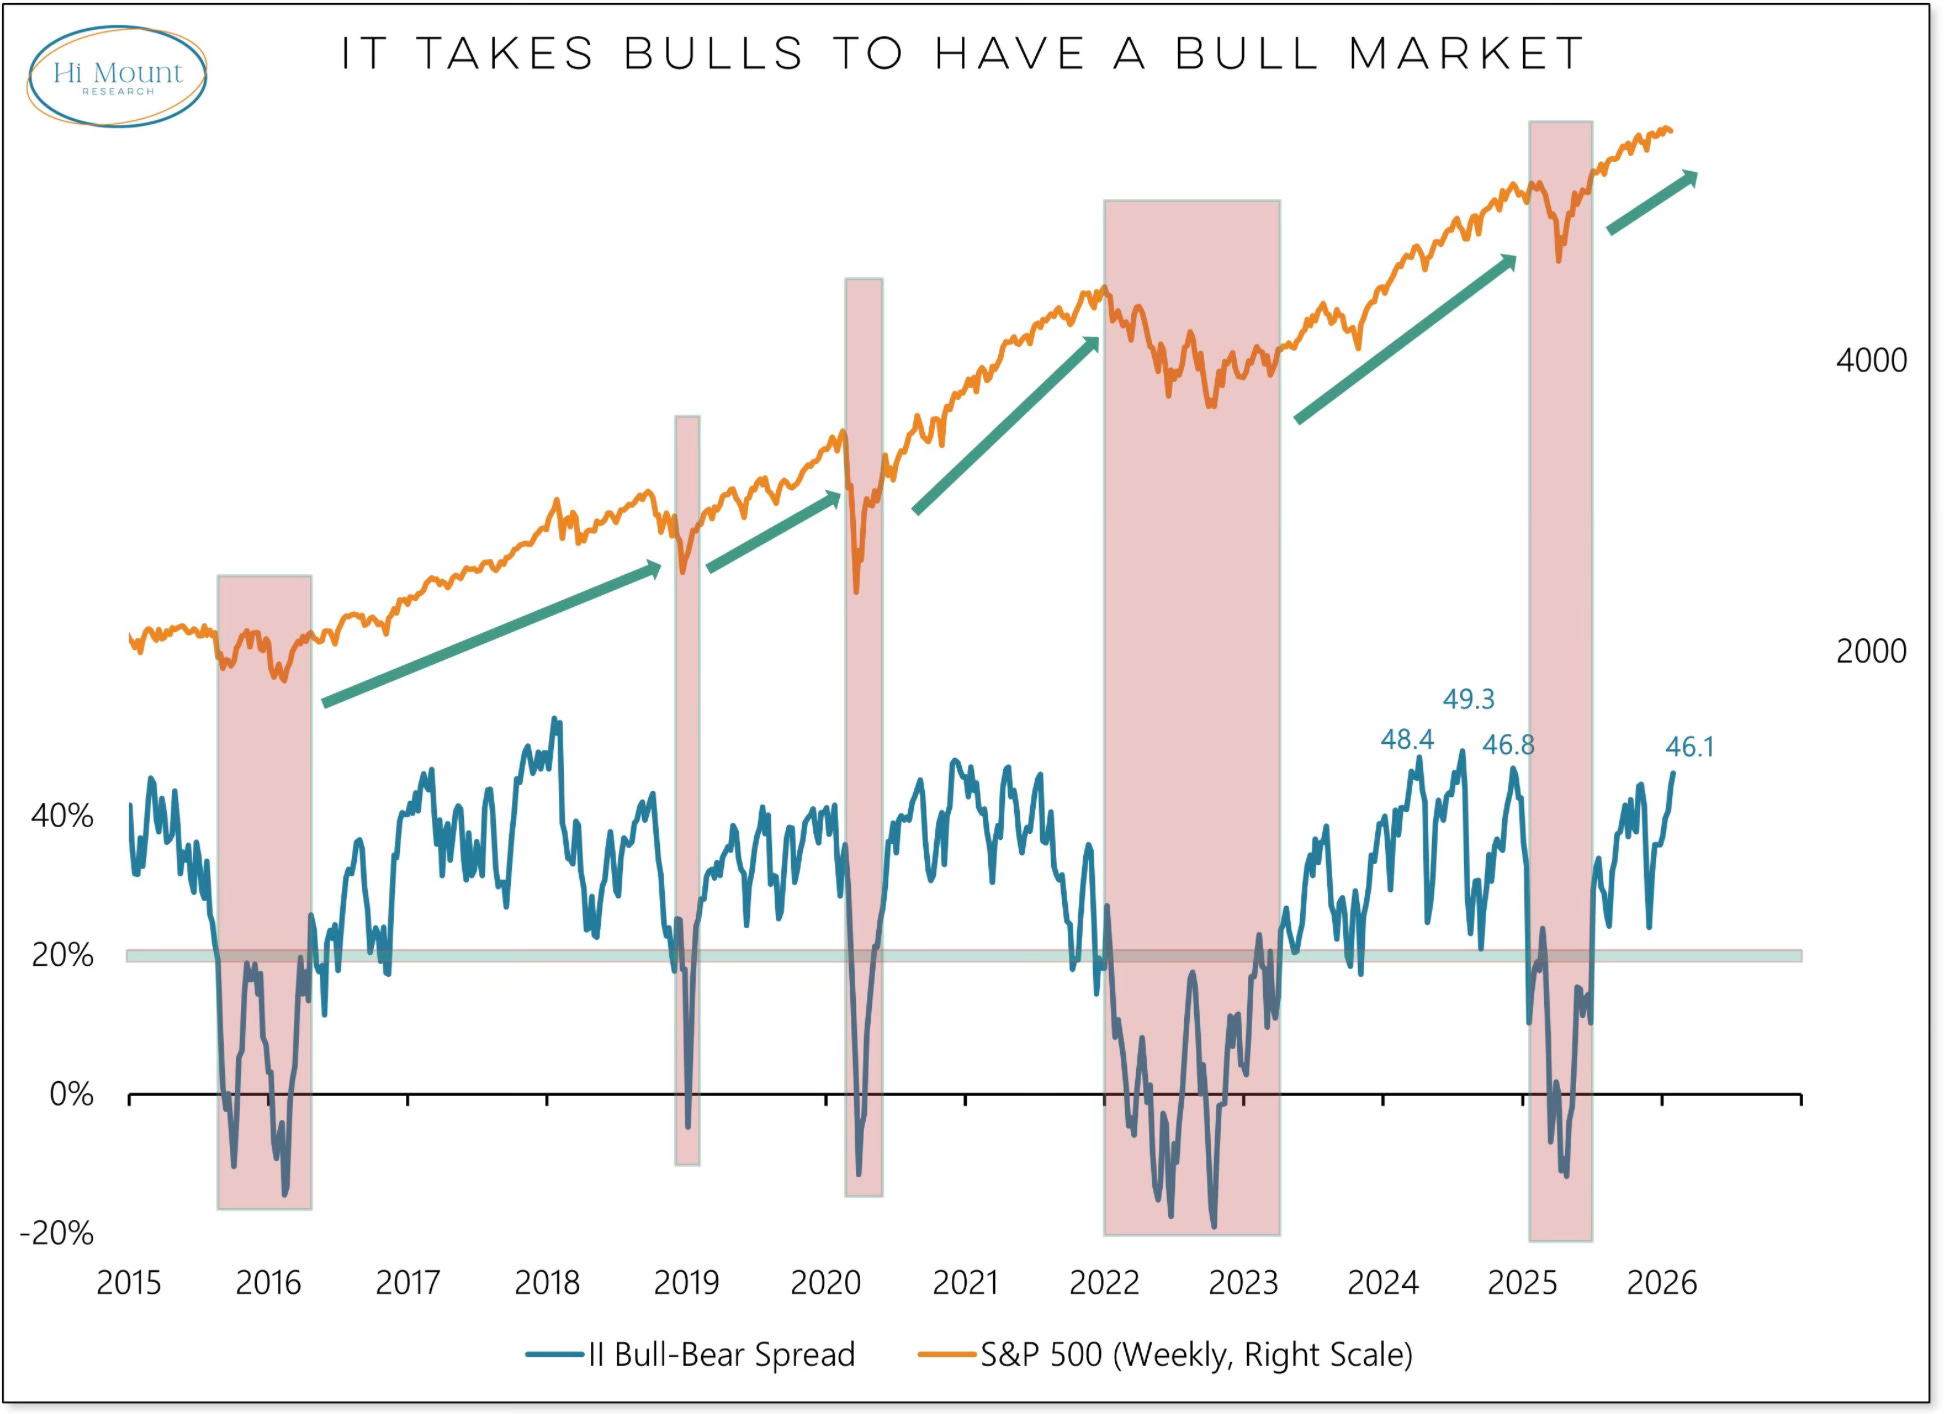
A historically weak February now meets a strengthening bull market.
The Investors Intelligence bull-bear spread has pushed to a new cycle high, climbing above 45% for the first time since December 2024.
Which force wins out in February remains to be seen.
Two Sectors Breaking Out
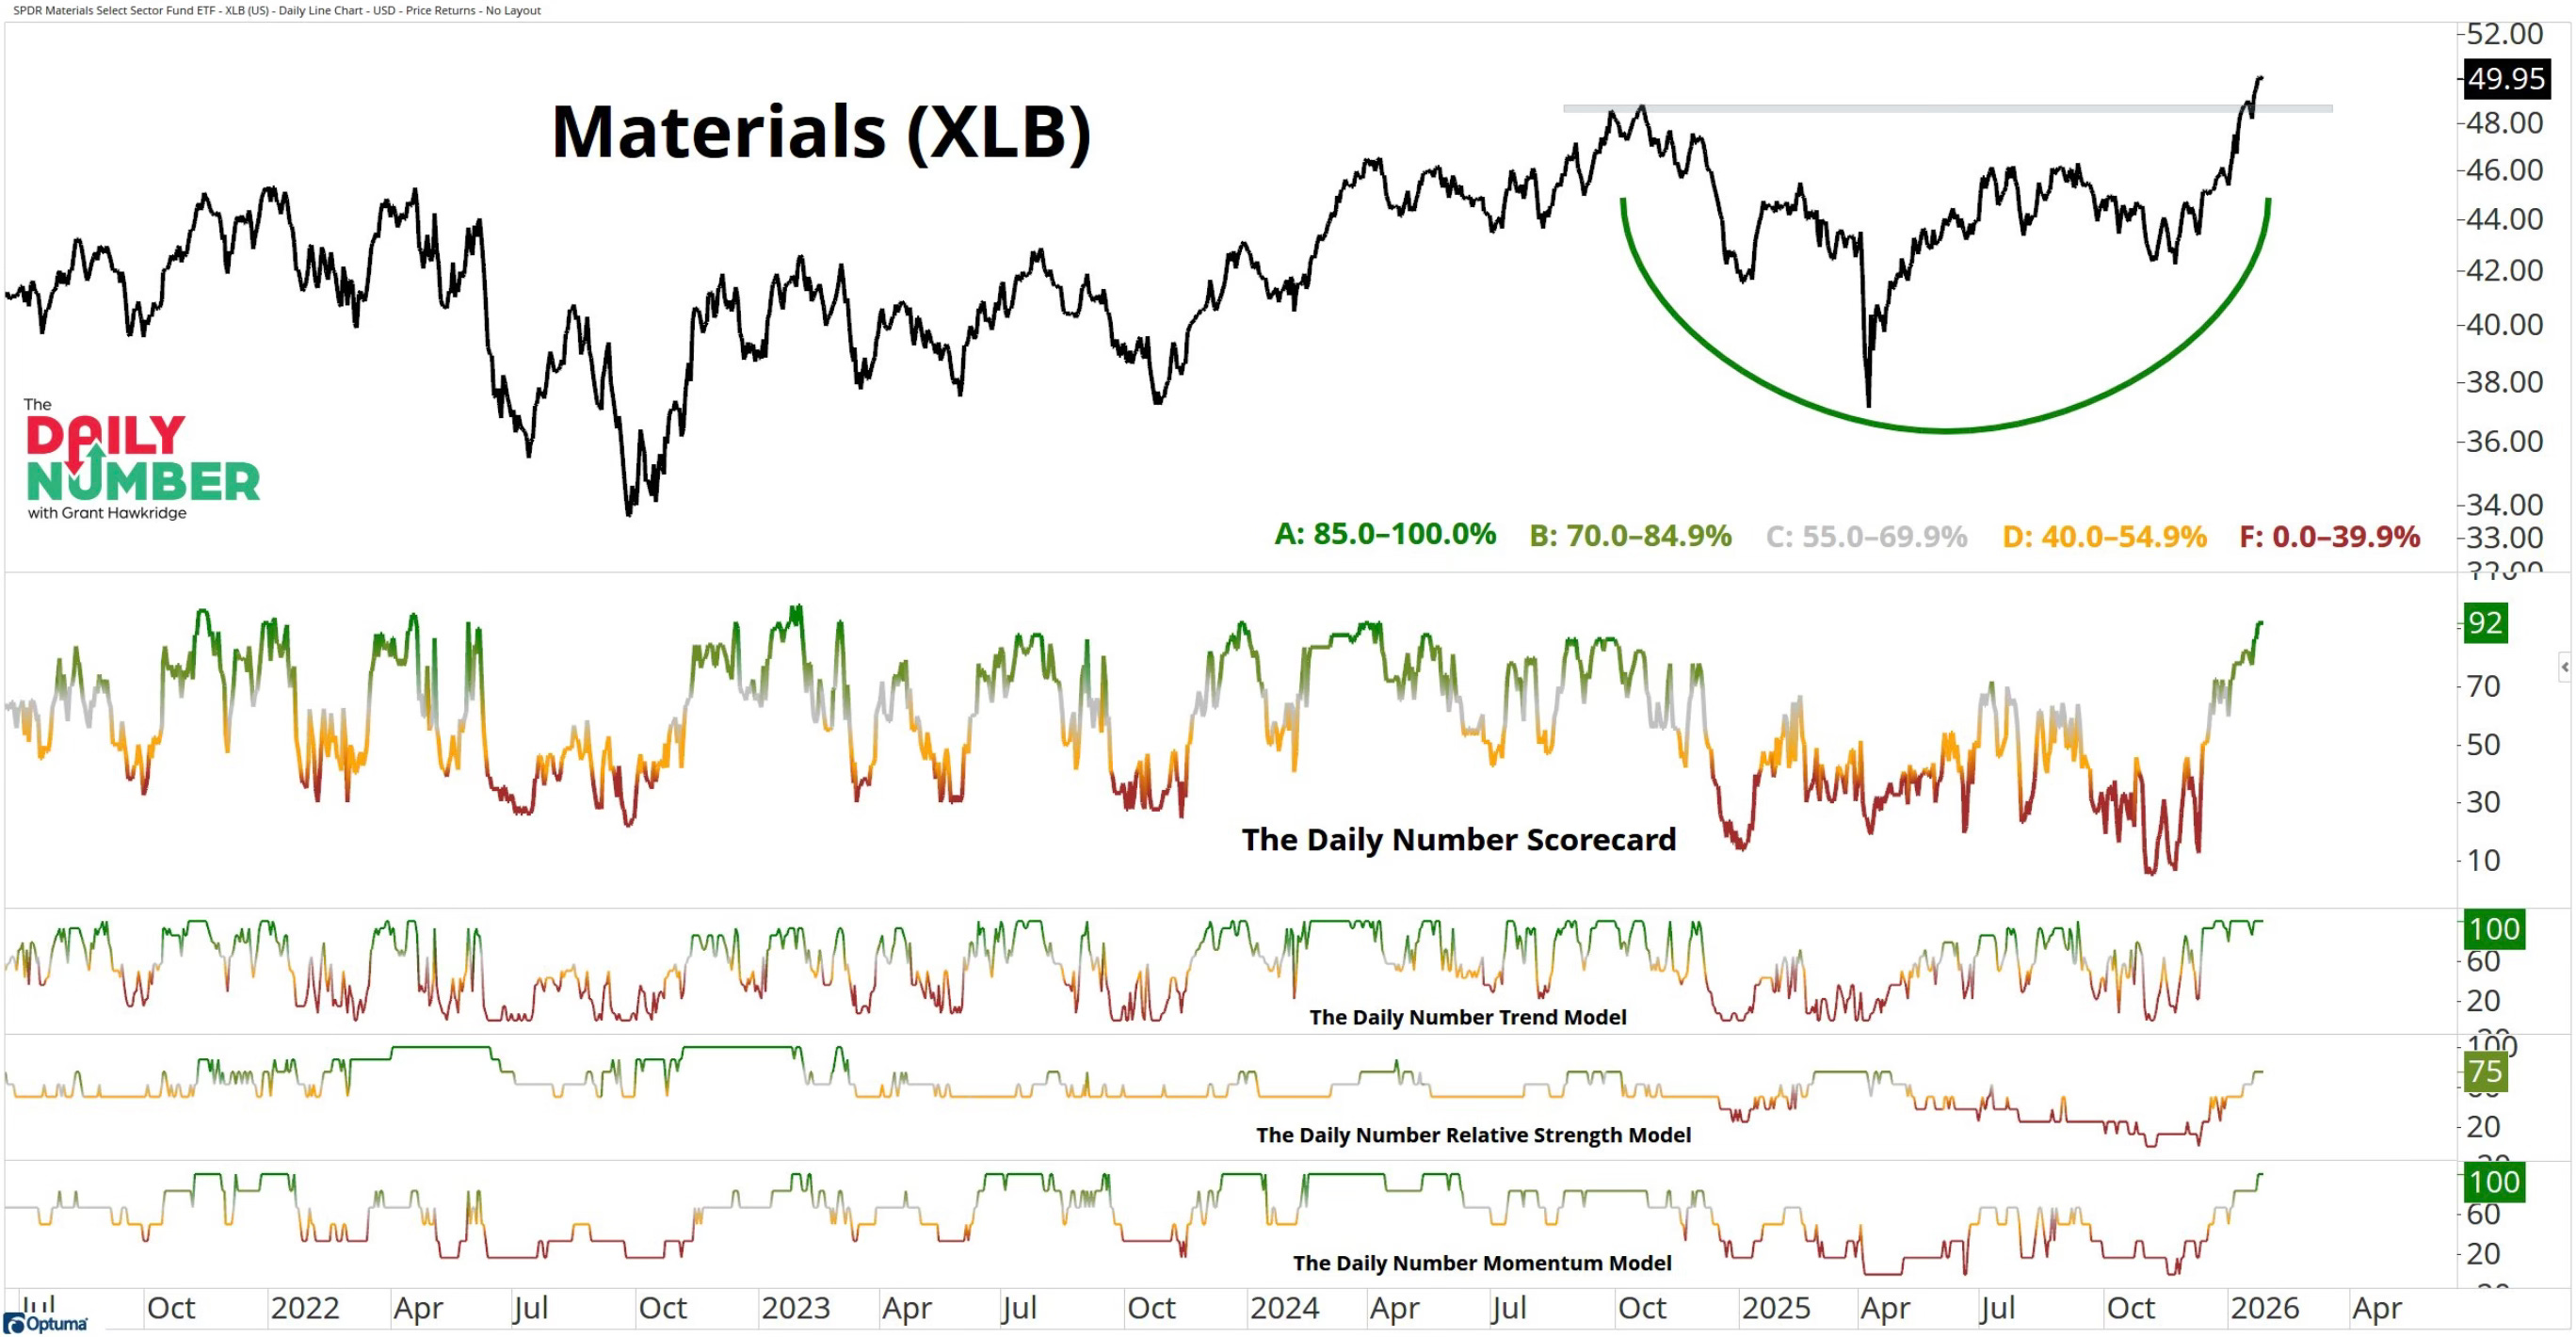
There are two sectors that are catching my eye and prime to breakout.
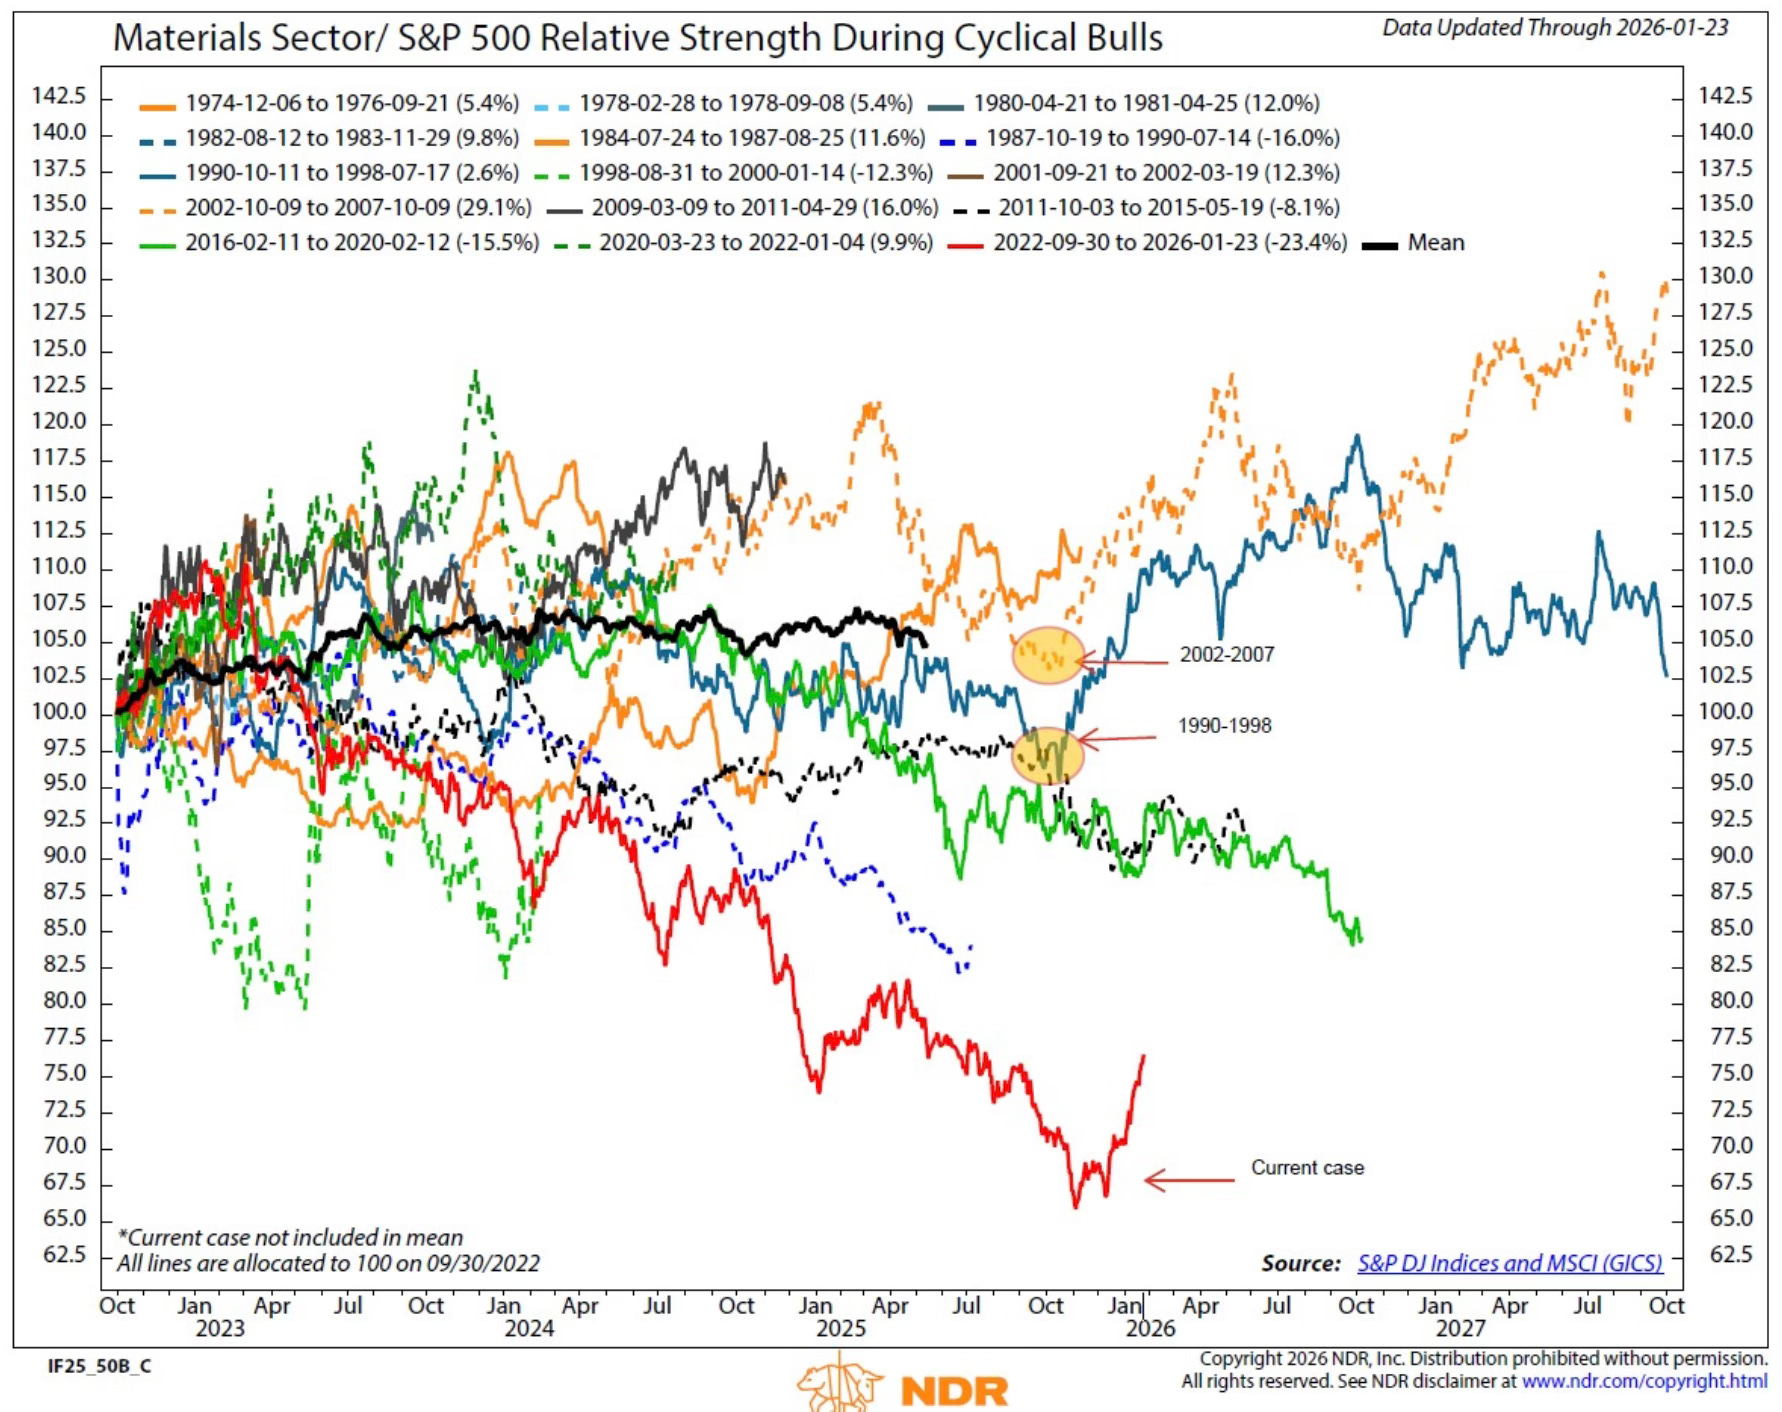
The first is materials and you can see that last week saw a record inflow to materials.
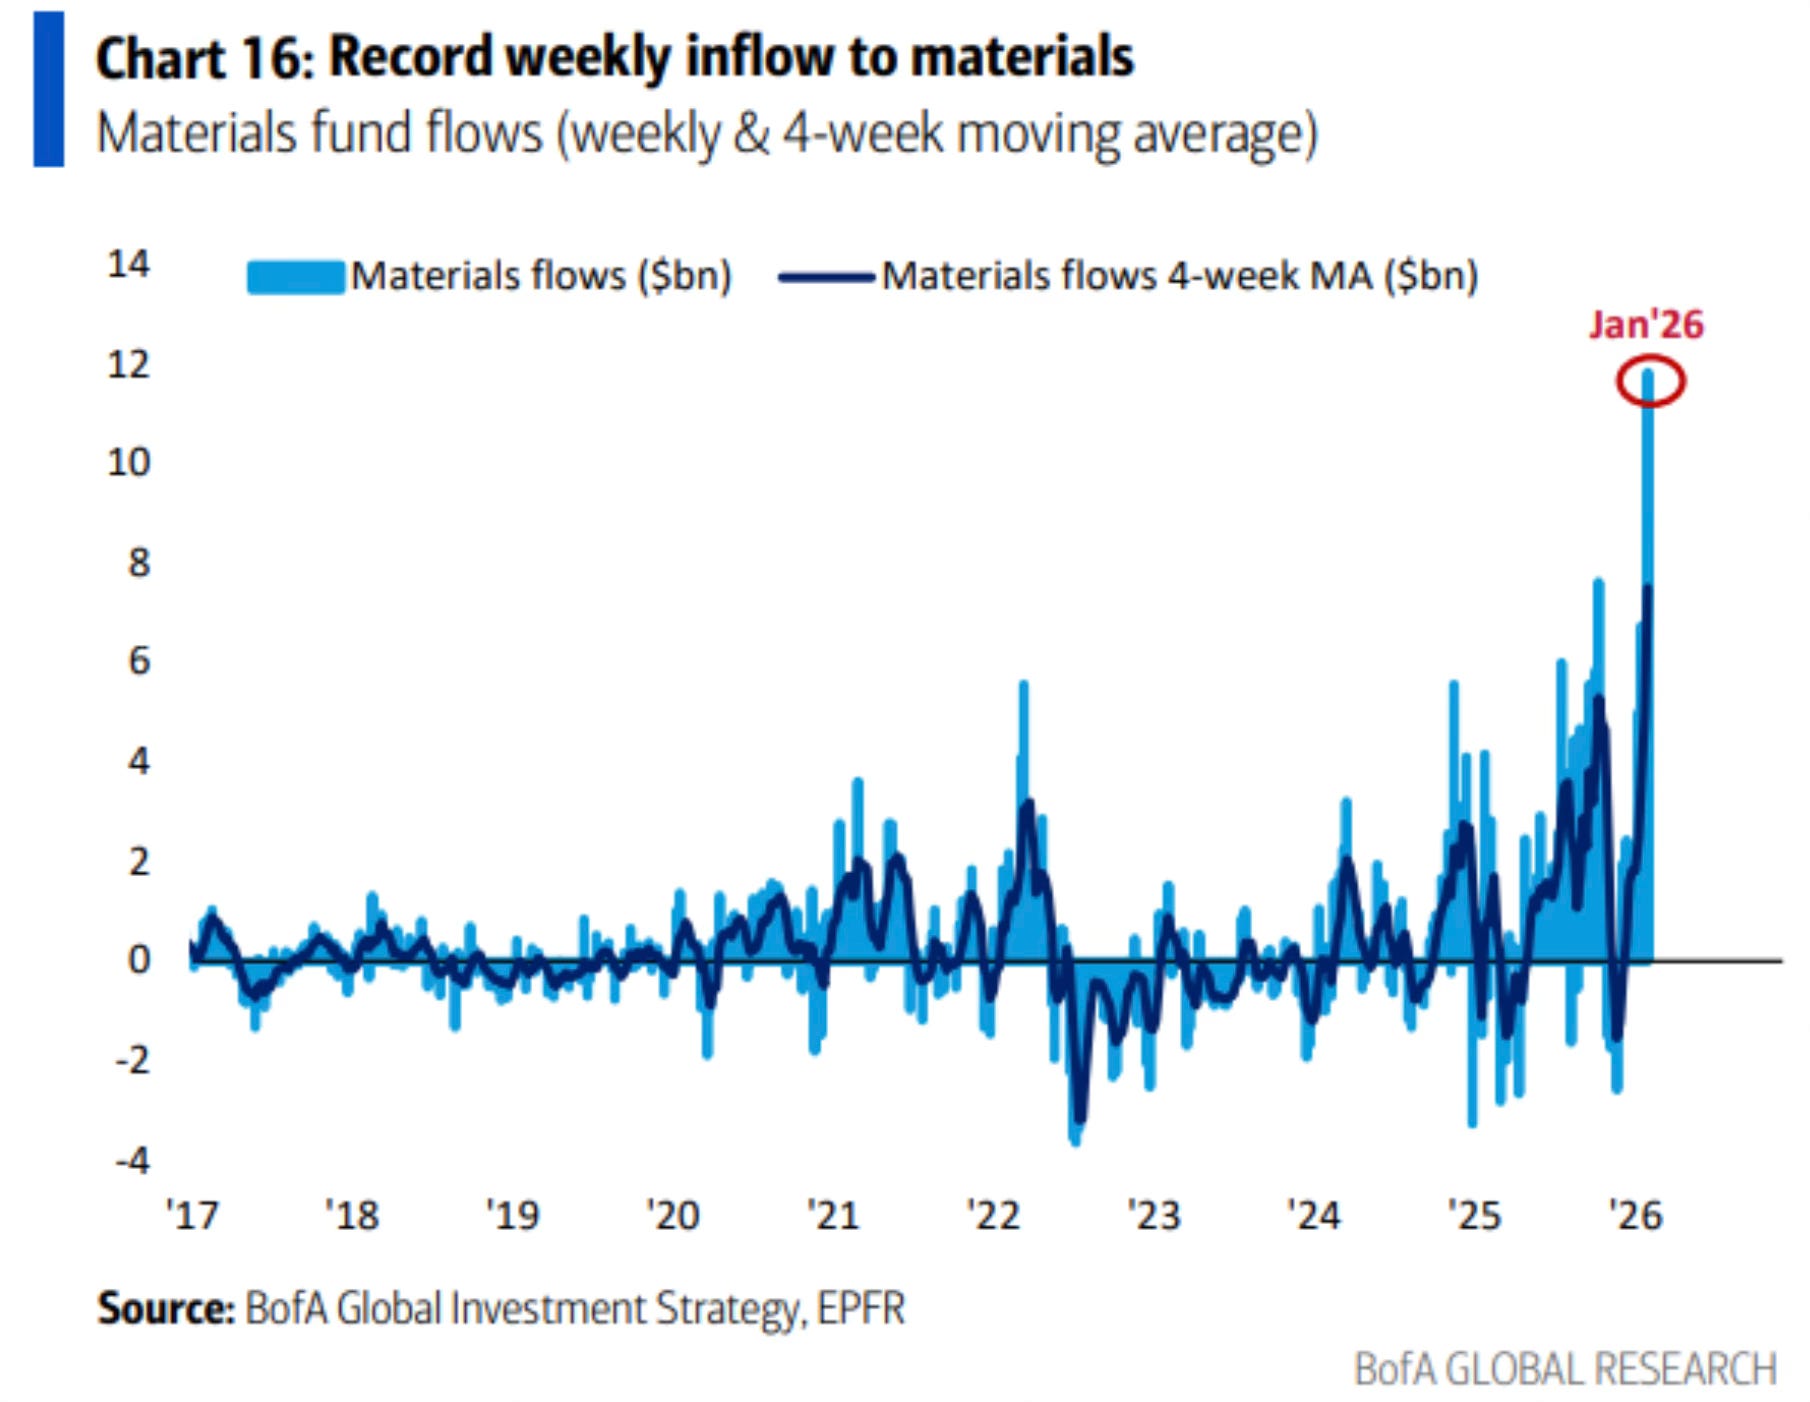
This setup is like a coiled spring.
This point by Rob Anderson even furthers the point.
Late-cycle leadership rotations into Materials have not been uncommon. Of the four prior bull markets since 1974 that lasted into year four, two cases (1990 – 1998 and 2002 – 2007) saw relative strength rotations occur roughly at this point of the cycle.
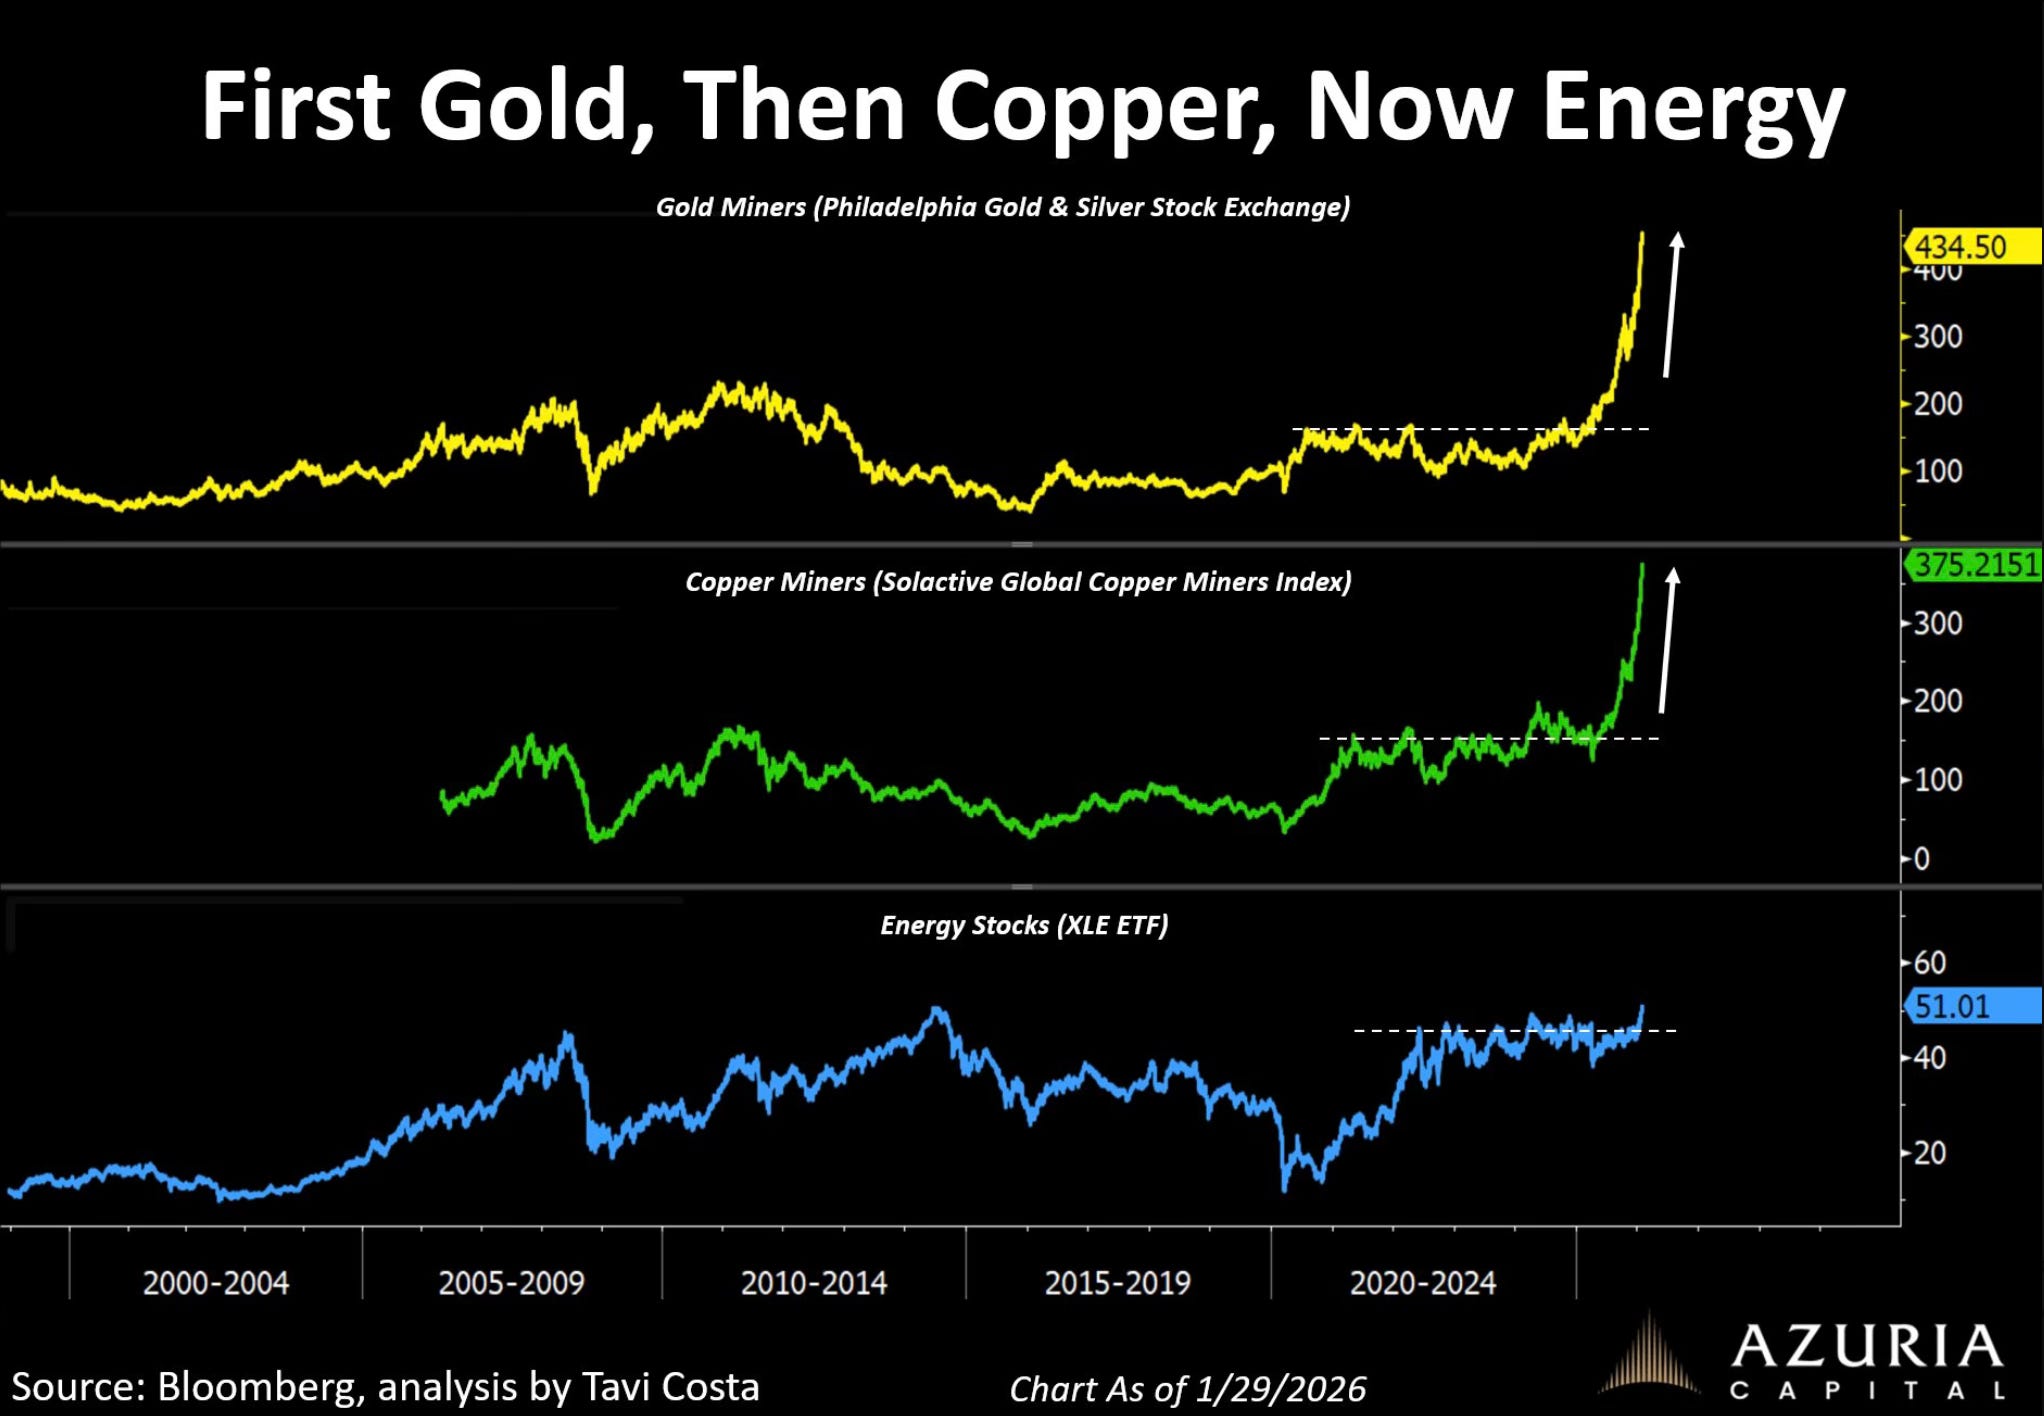
The other is a sector I have talked about the last few weeks, energy. It just keeps strengthening.
Last week energy fund flows were the biggest since October 2023.
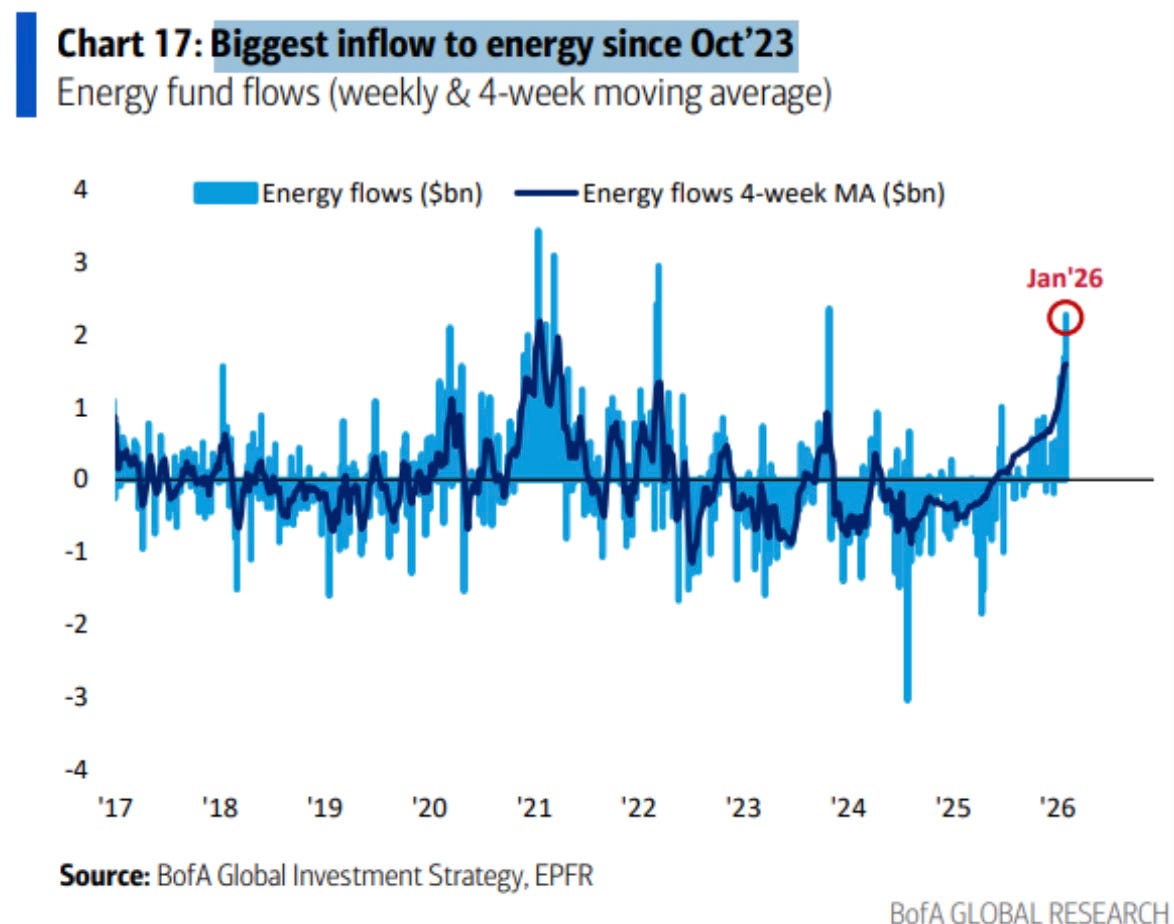
Energy looks poised for a breakout.
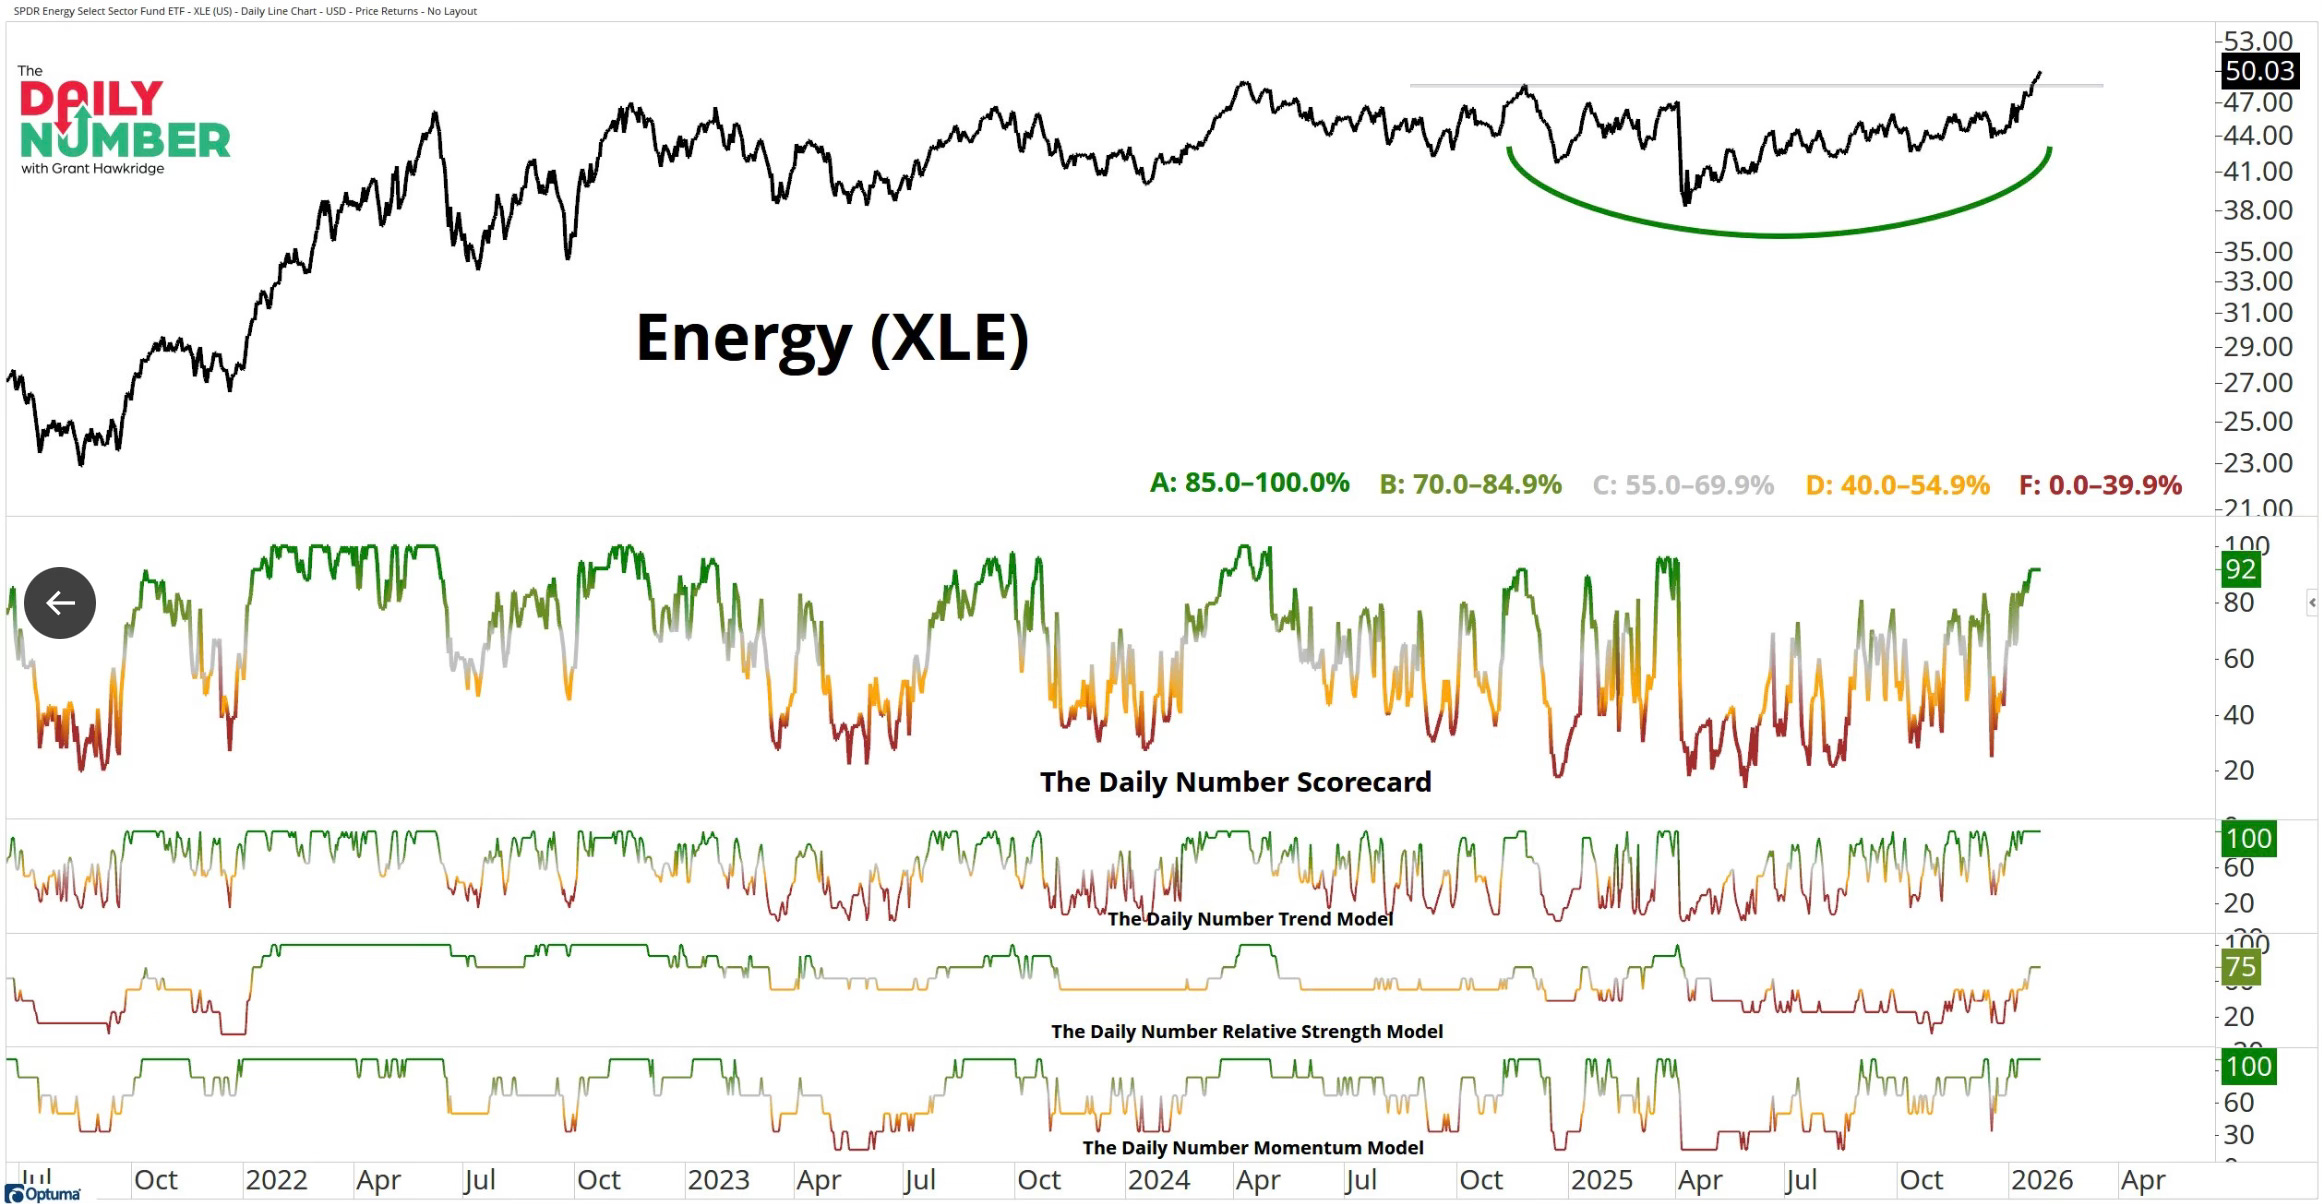
In fact, every member of the S&P 500 energy sector is above their 200-day.
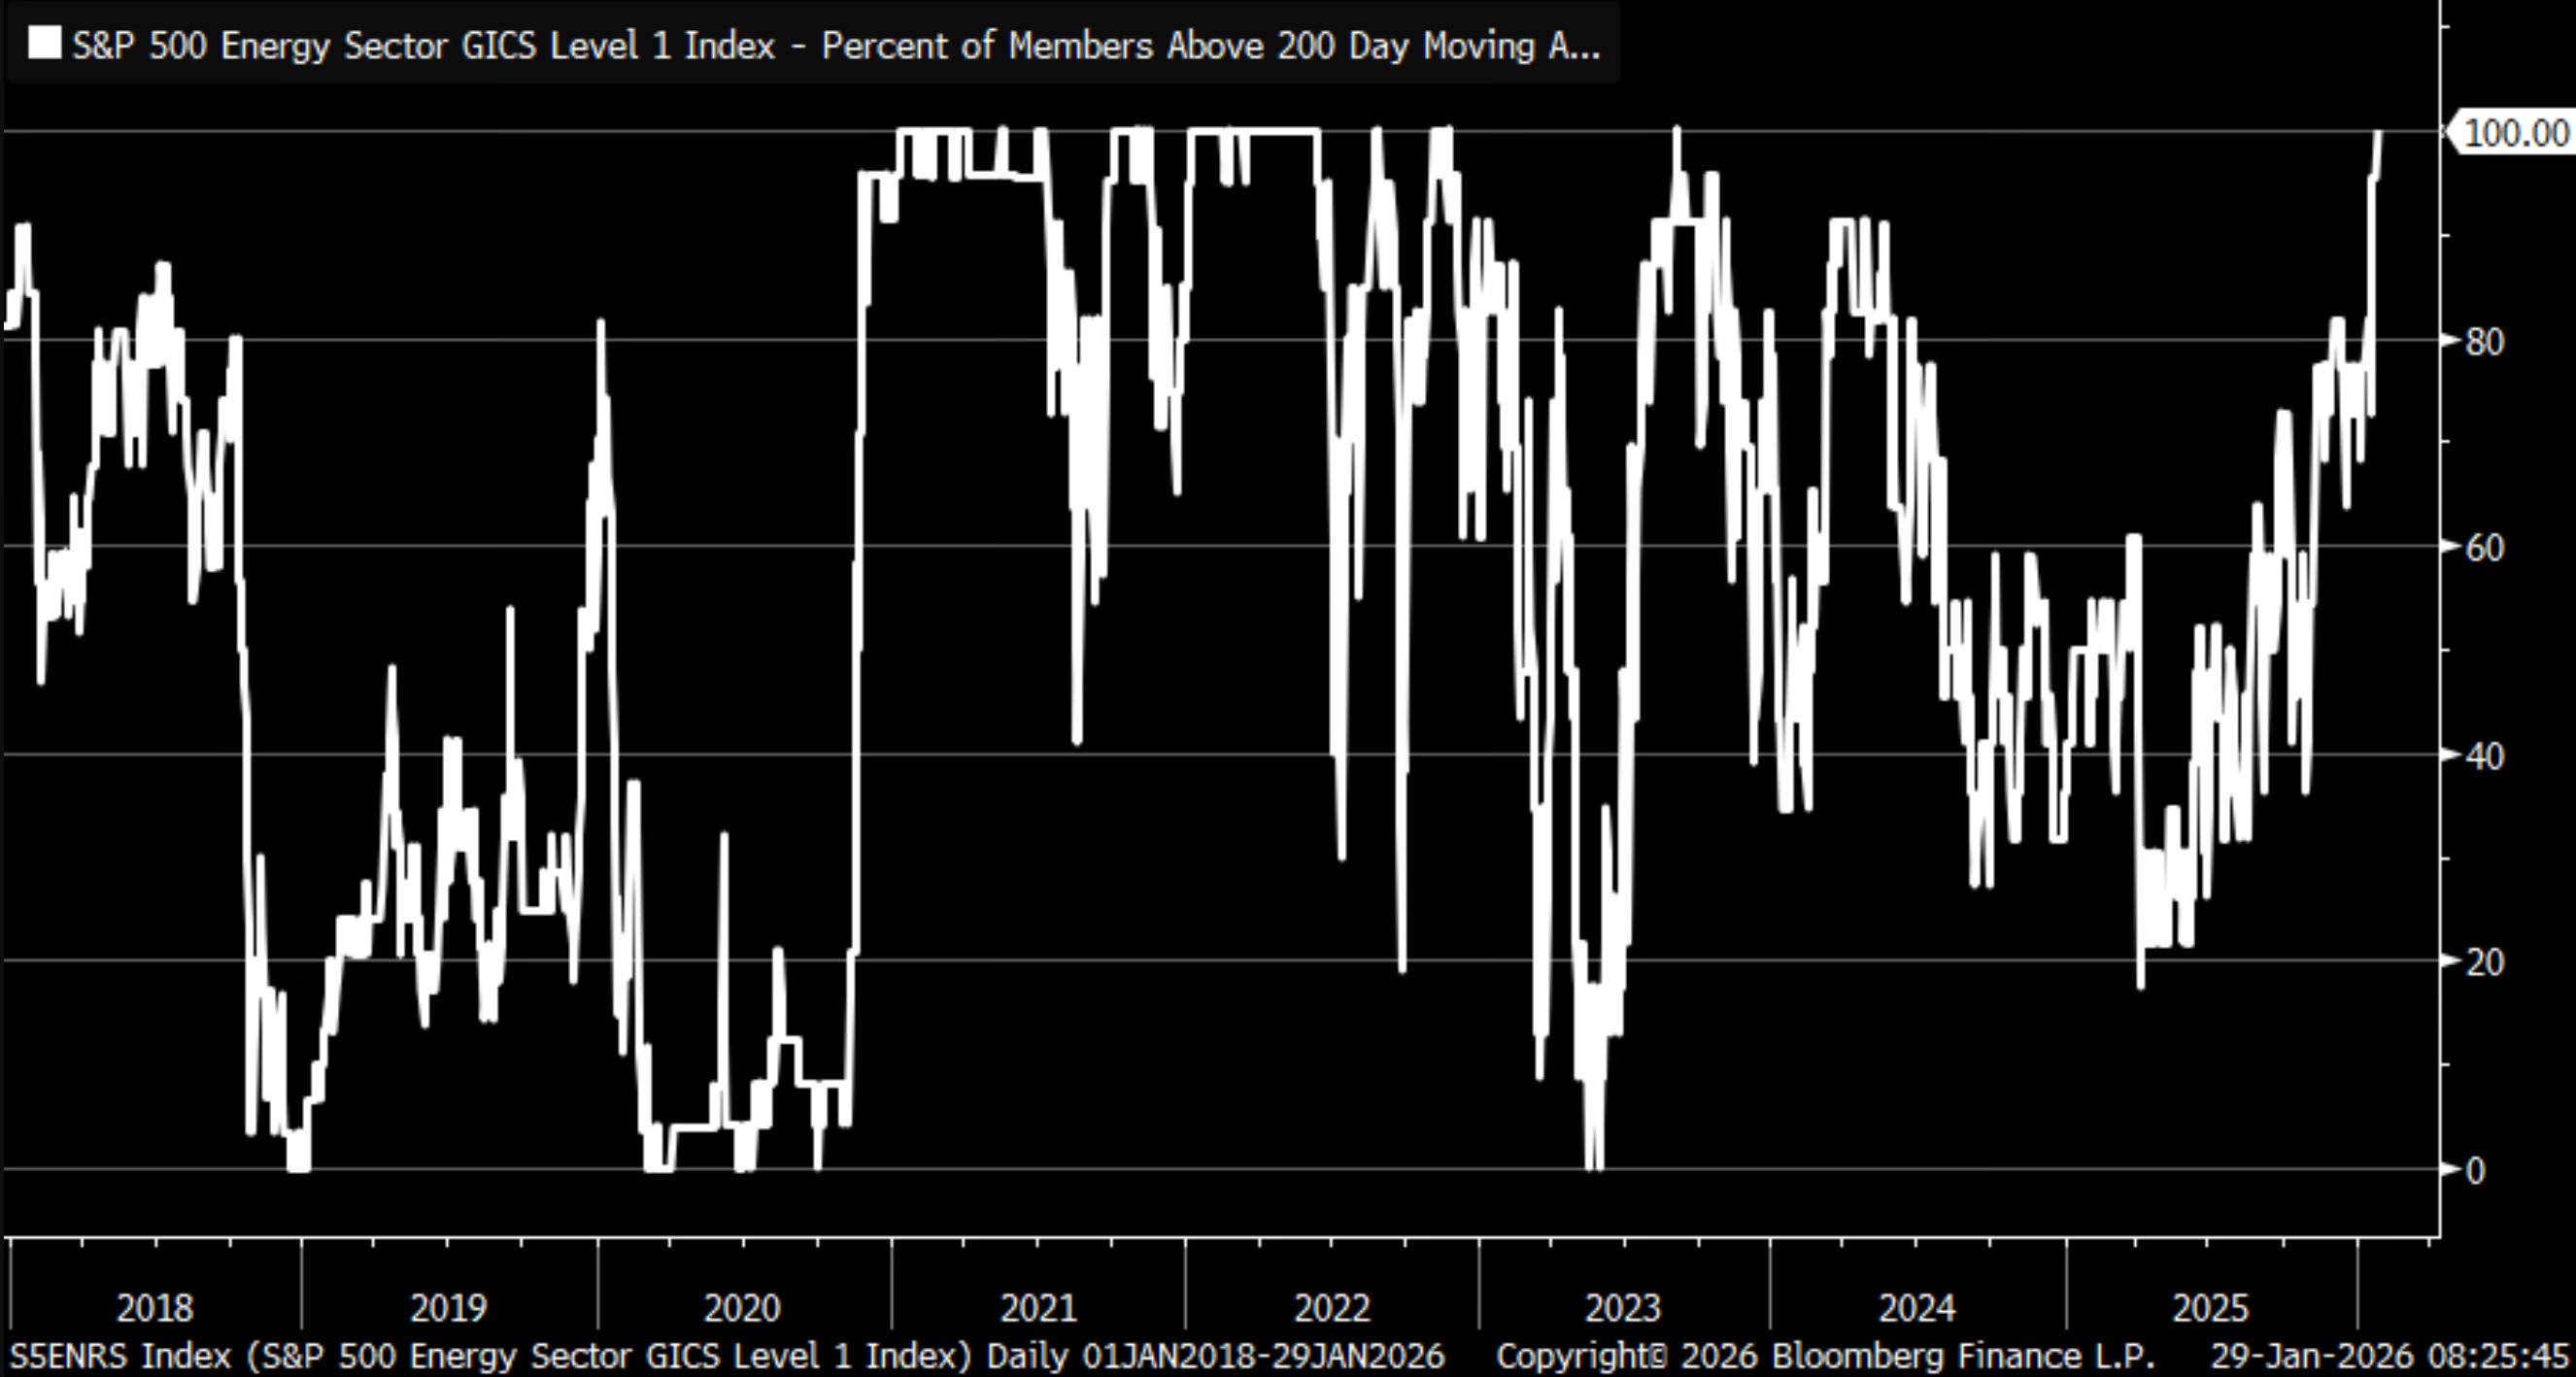
I mean first it was gold, then copper and now it’s looking like energy. This is such a great chart showing the setup from Tavi Costa.
Semiconductors Tell The Story
I’ve been saying that the Mag 7 and tech have been taking a breather. I expect it to resume leadership in this bull market.
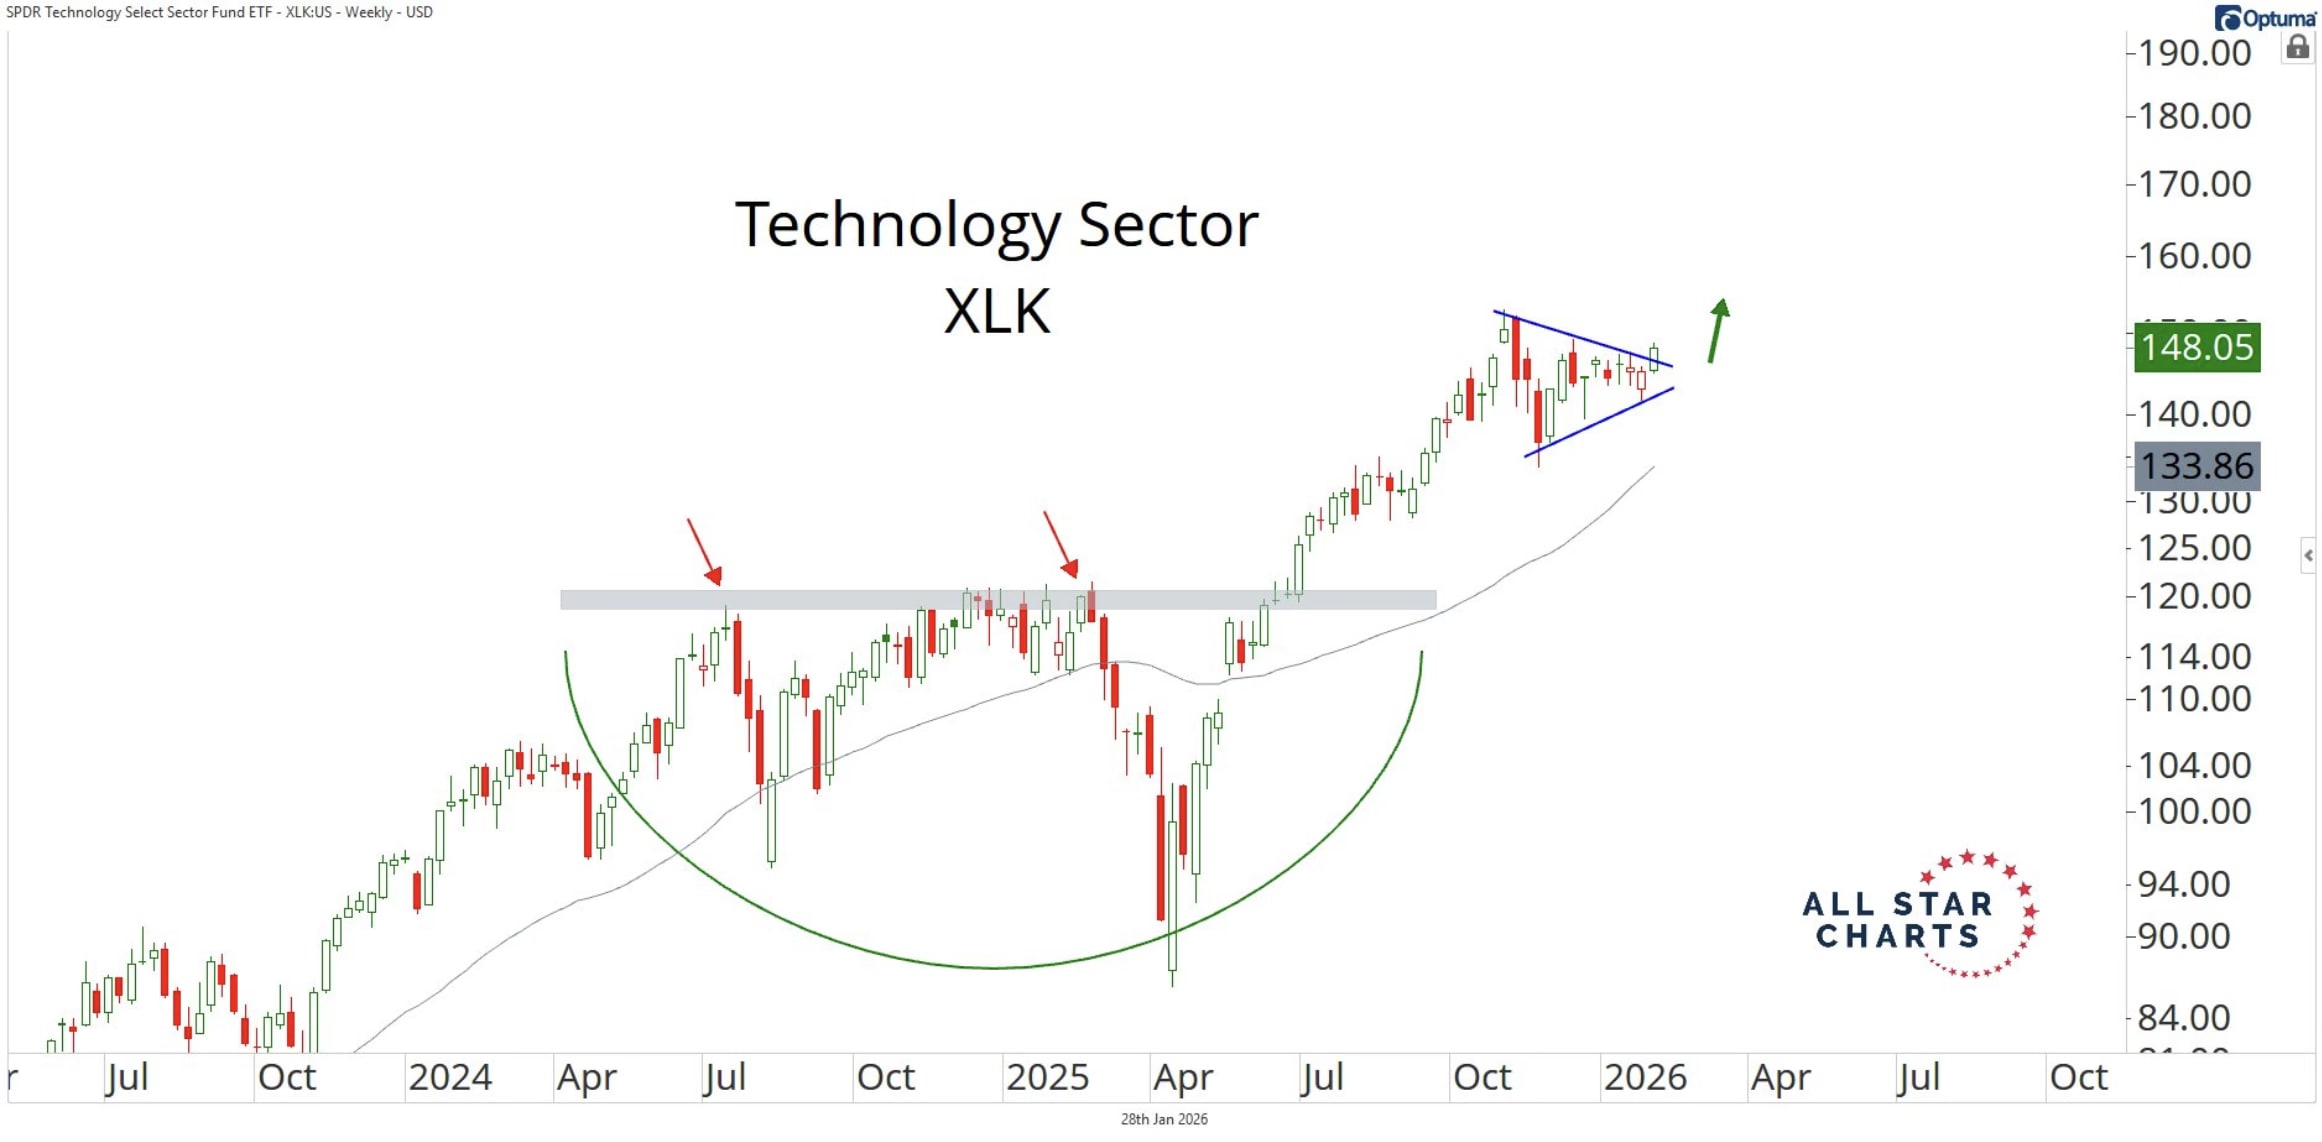
I like this chart from Alfonso De Pablos.
Here we’re looking at a base breakout followed by a continuation pattern that is resolving in the direction of the underlying trend in large-cap tech.
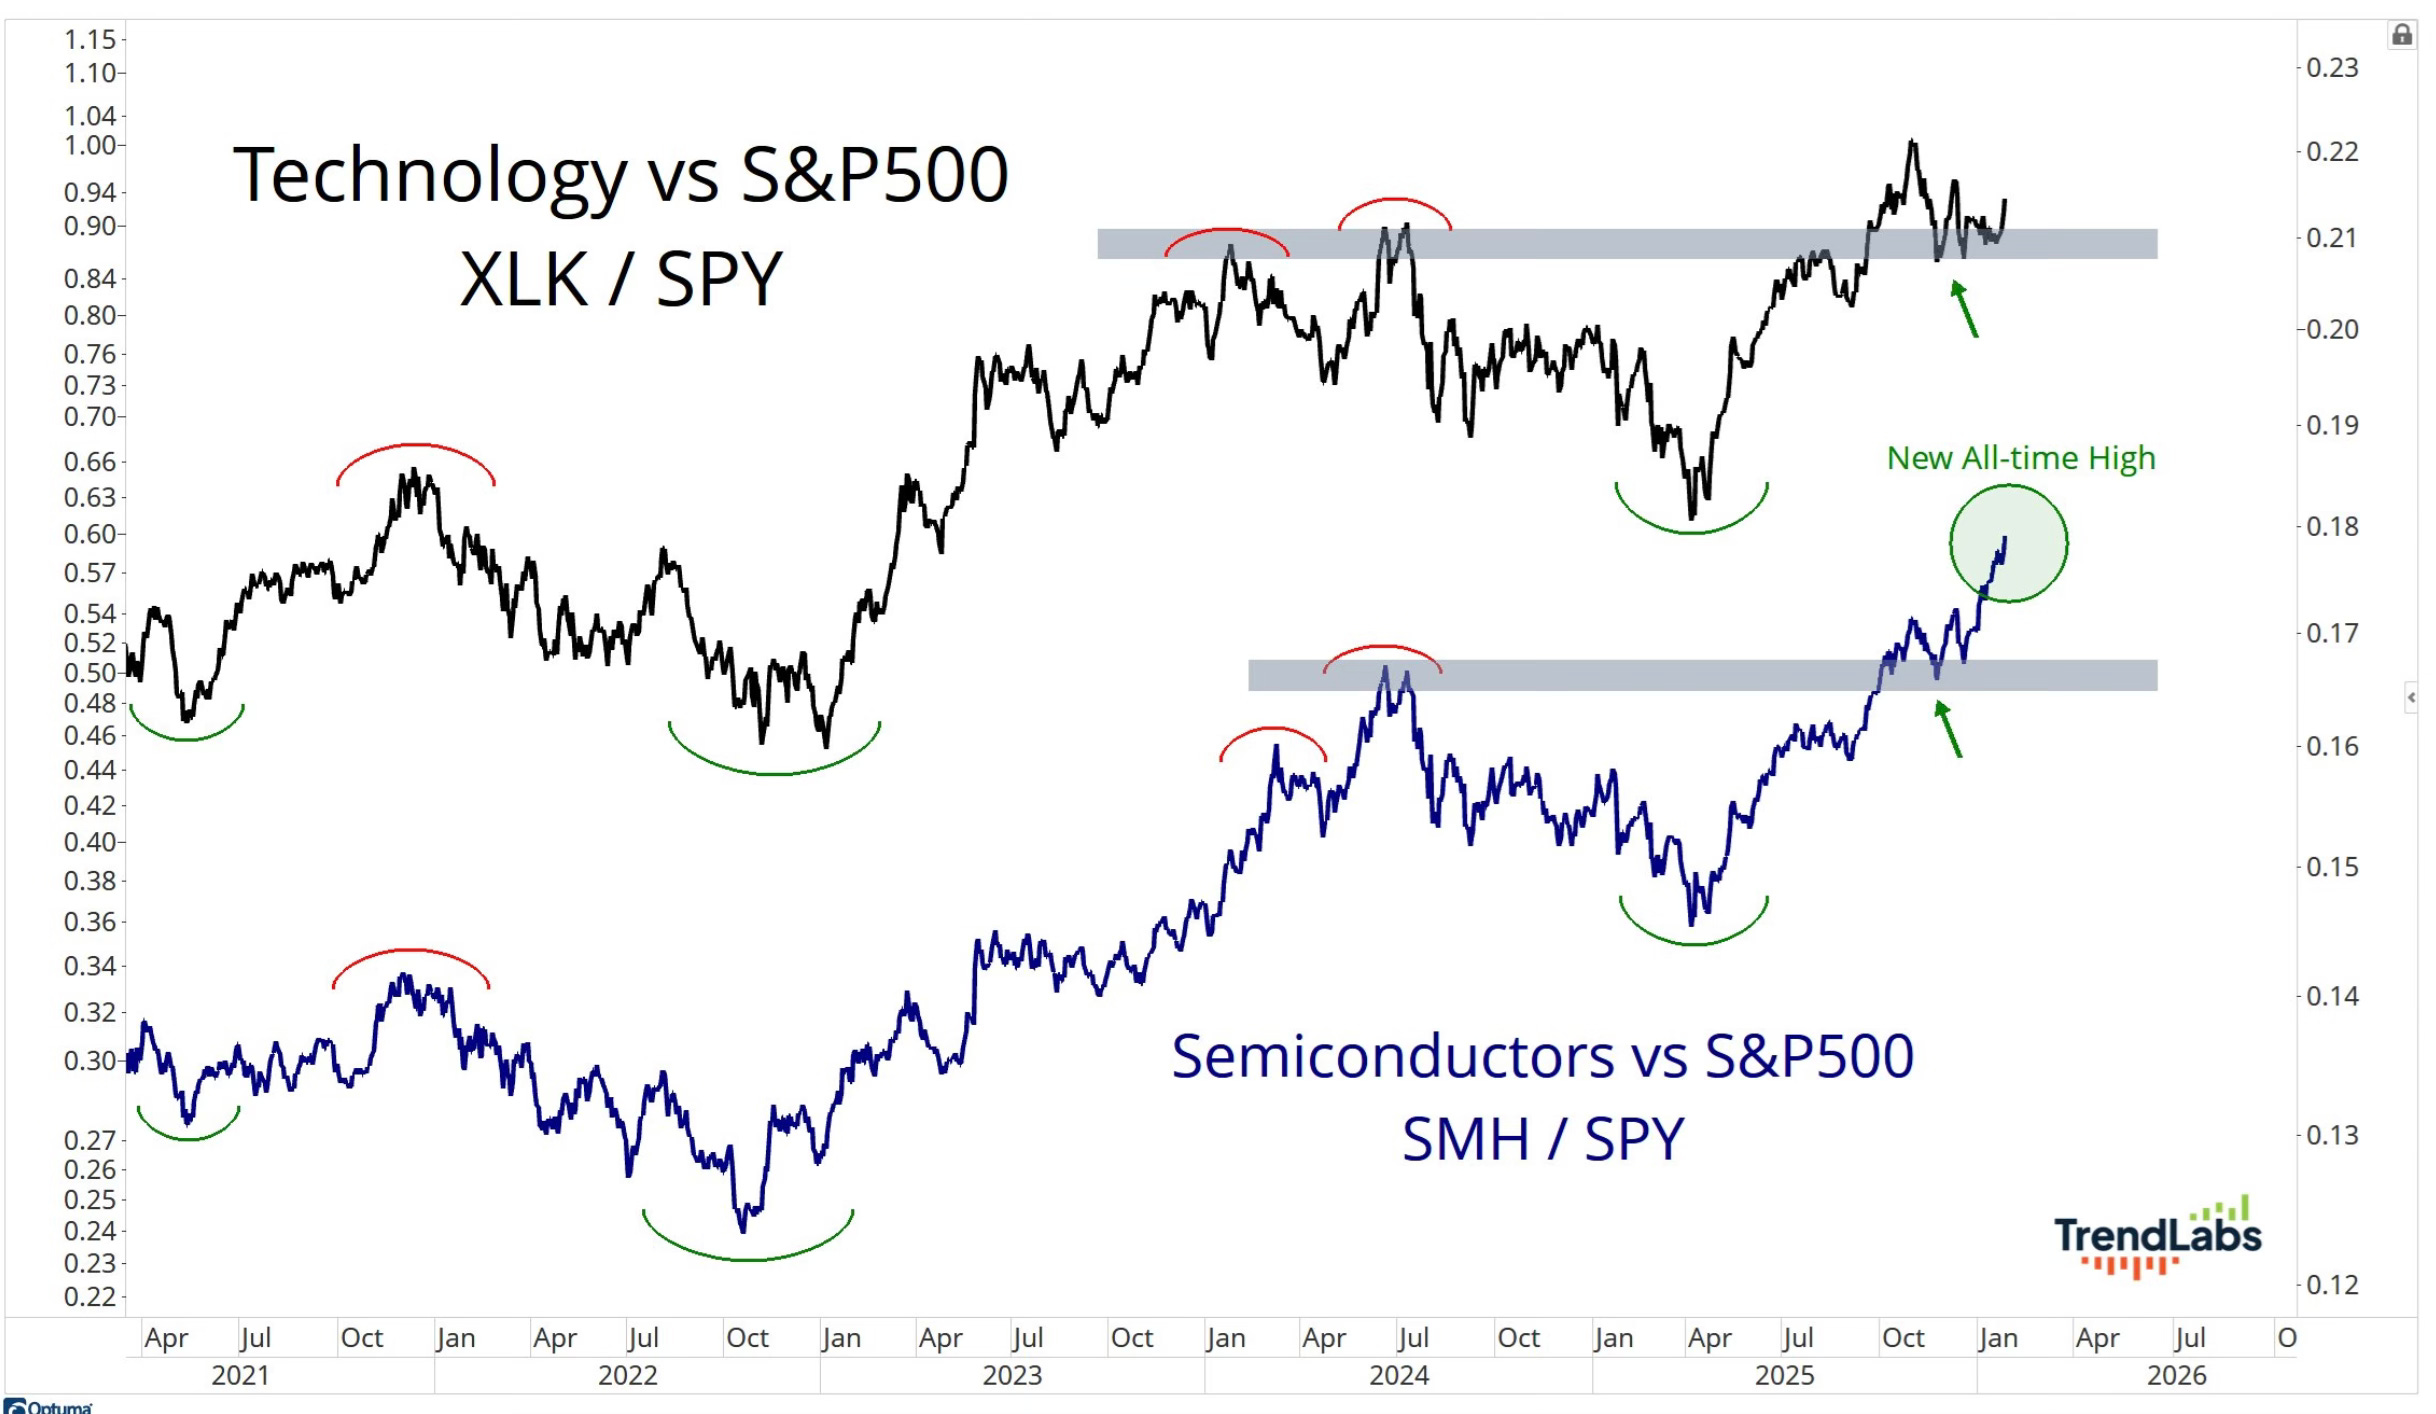
Here you can see the comparison of technology and semiconductors to the S&P 500. Look what semiconductors have been doing. I find it very hard to believe that we don’t see technology play catchup to what semiconductors have been doing.
Semiconductors have long been the leading market indicator for me. If I’m looking at one spot for market direction, the semis are the place to look.
Why do I say this? Because semiconductors sit at the heart of technology and industrial demand. They’re essential components for everything from computers and smartphones to cars and data centers.
When semiconductor stocks are rising, it usually signals broad business investment, strong tech demand, and overall economic confidence. Historically, the semiconductor sector often leads the broader market, making it a useful early indicator for market direction. They’re the primary raw material for the entire global economy. Chips are the new oil.
Is Consumer Sentiment Worth Worrying About?
On Tuesday, two of the oddest headlines were in the news.
Consumer Confidence Hits 12 Year Lows
Stocks At All-Time Highs
Seems odd doesn’t it?
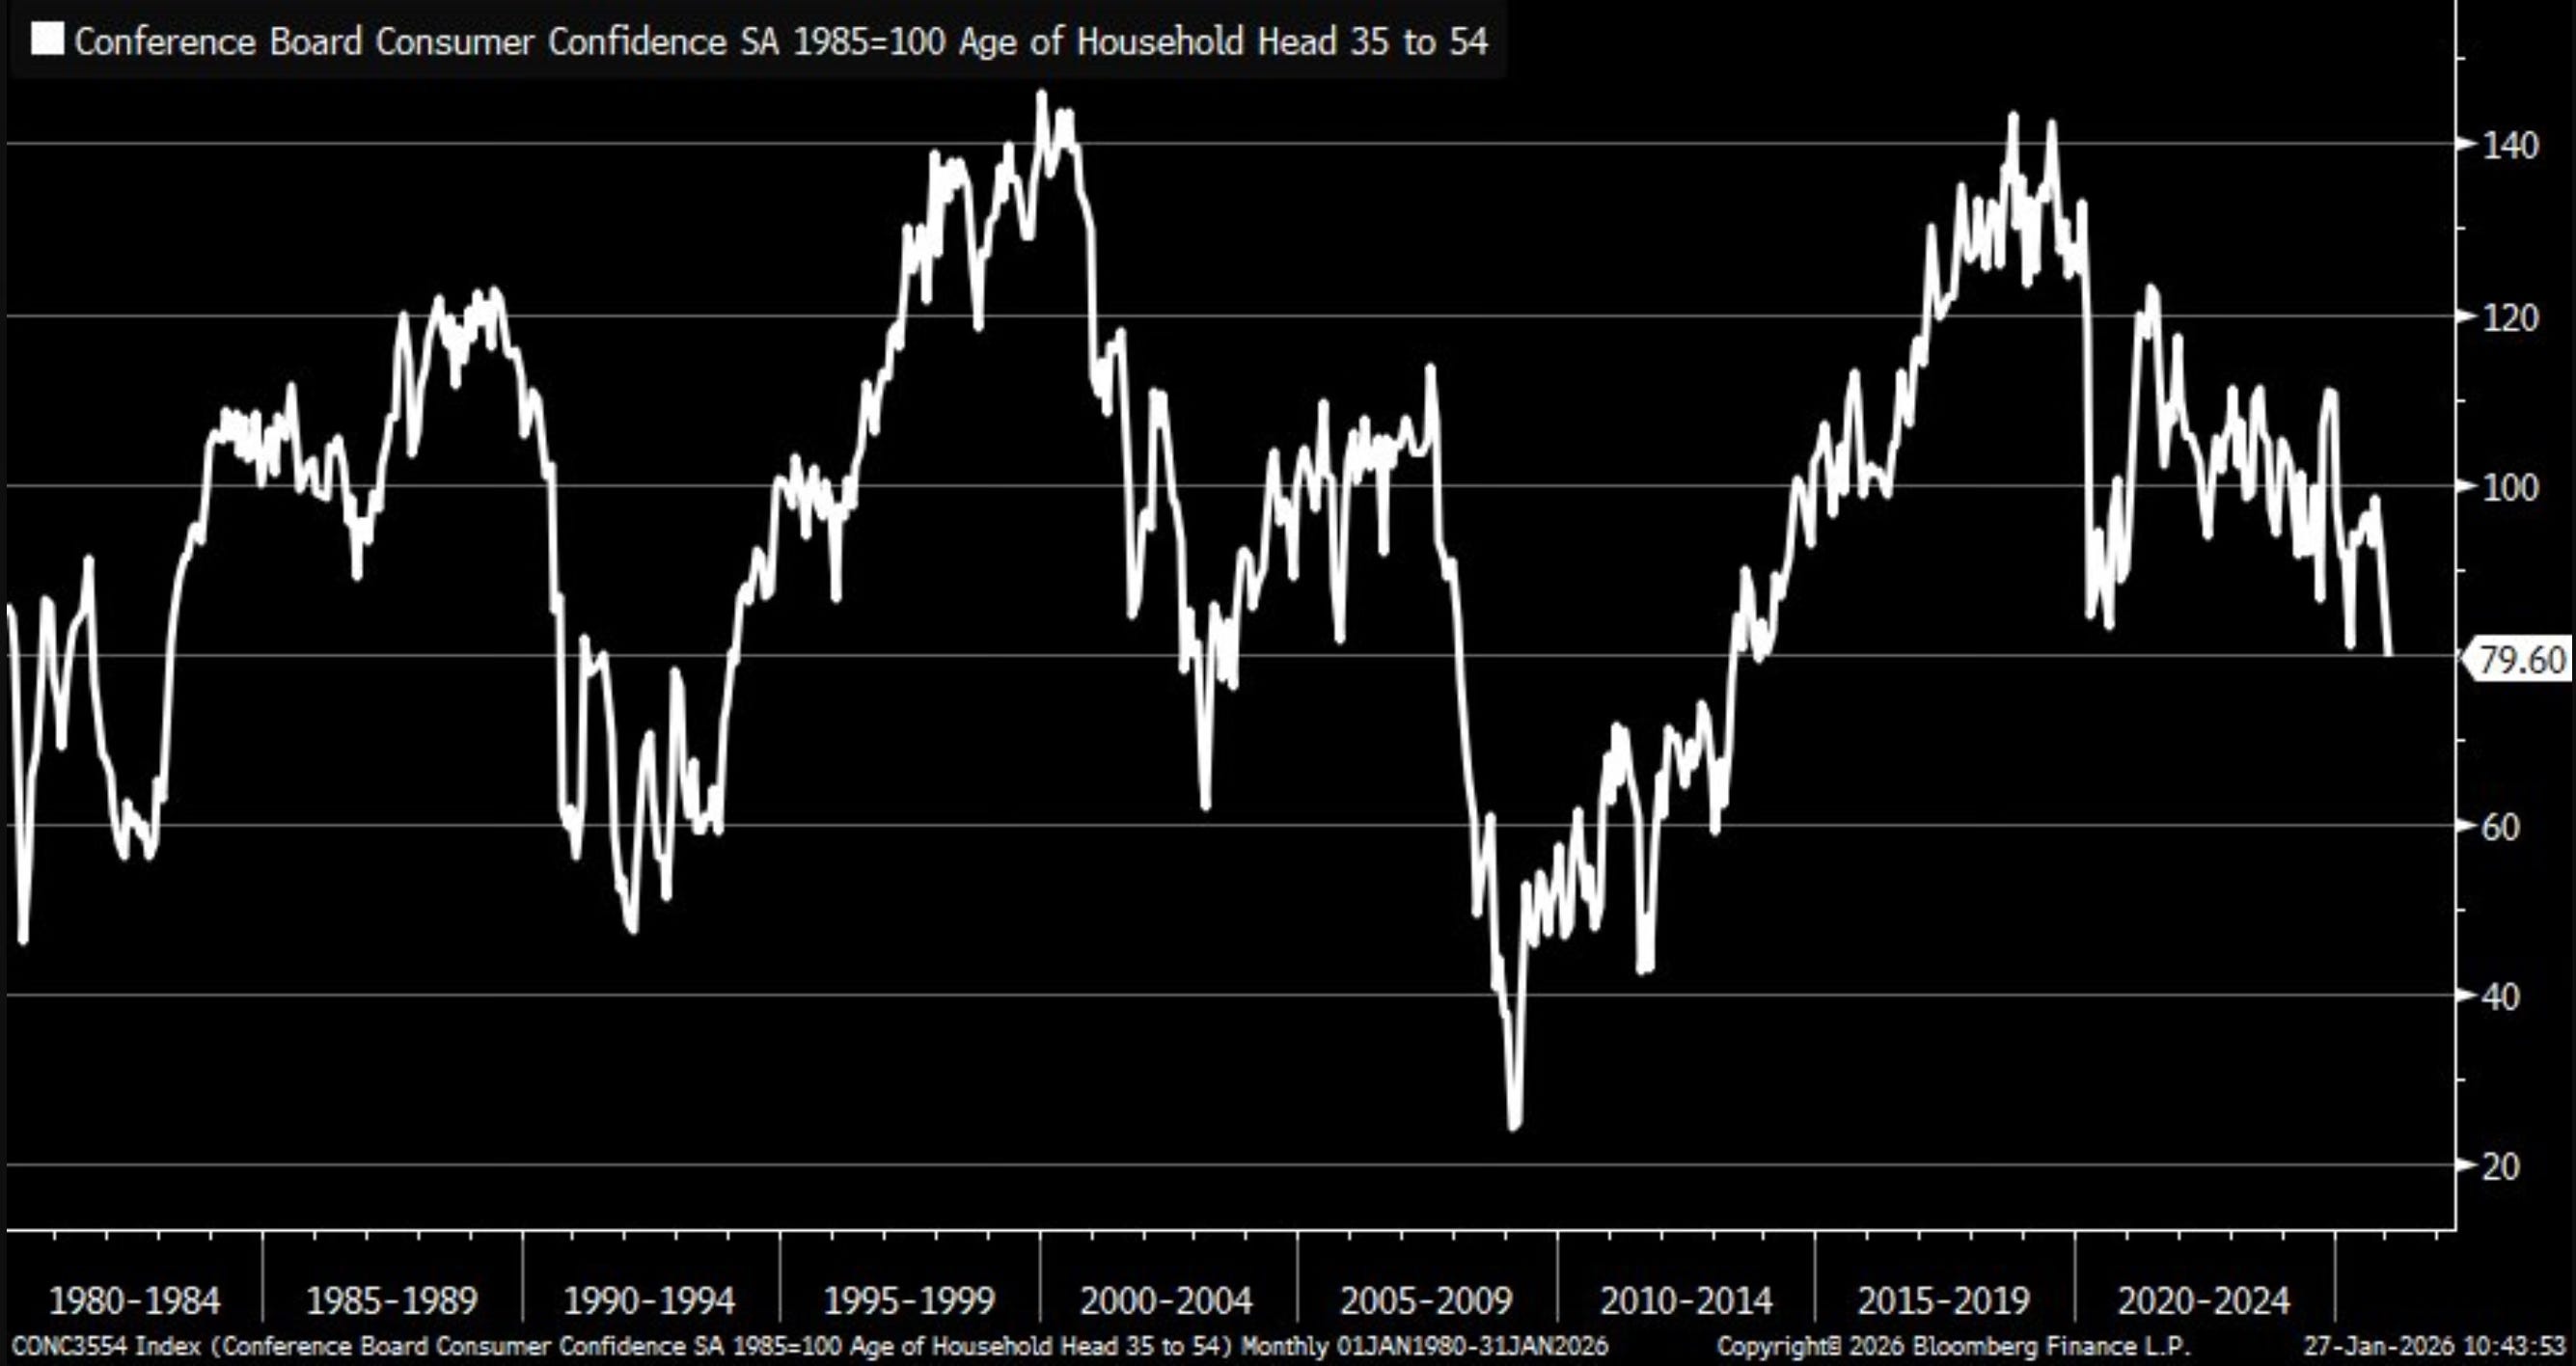
U.S. consumer confidence declined in January to the lowest level since 2014. Both the present situation and expectations for the future tumbled. This even surpasses the depth of the COVID-19 pandemic.
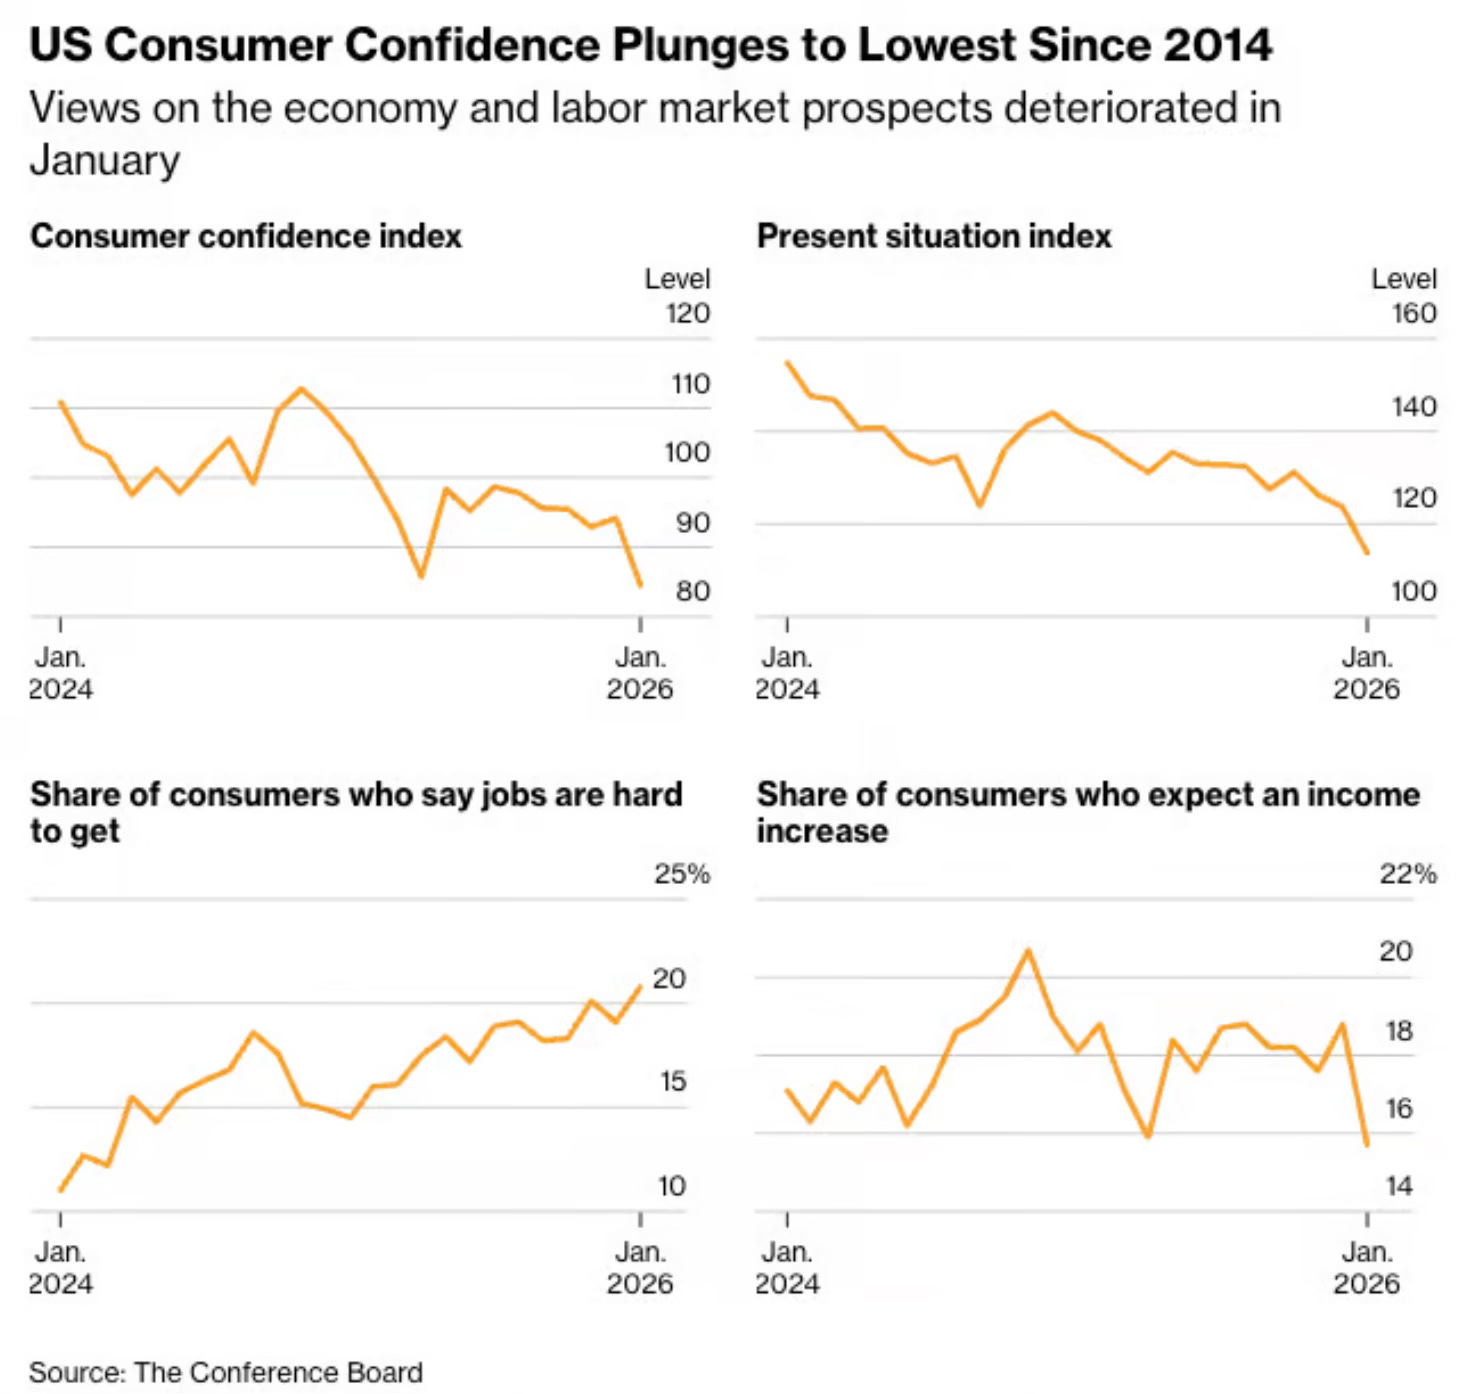
The part that stood out most to me was the 35–54 age group, where consumer confidence dropped to its lowest level since November 2013.
I really think that this all circles back to the labor market. The fact is, the labor market just isn’t in the best shape right now.
We’re seeing proof of this in a number of areas.
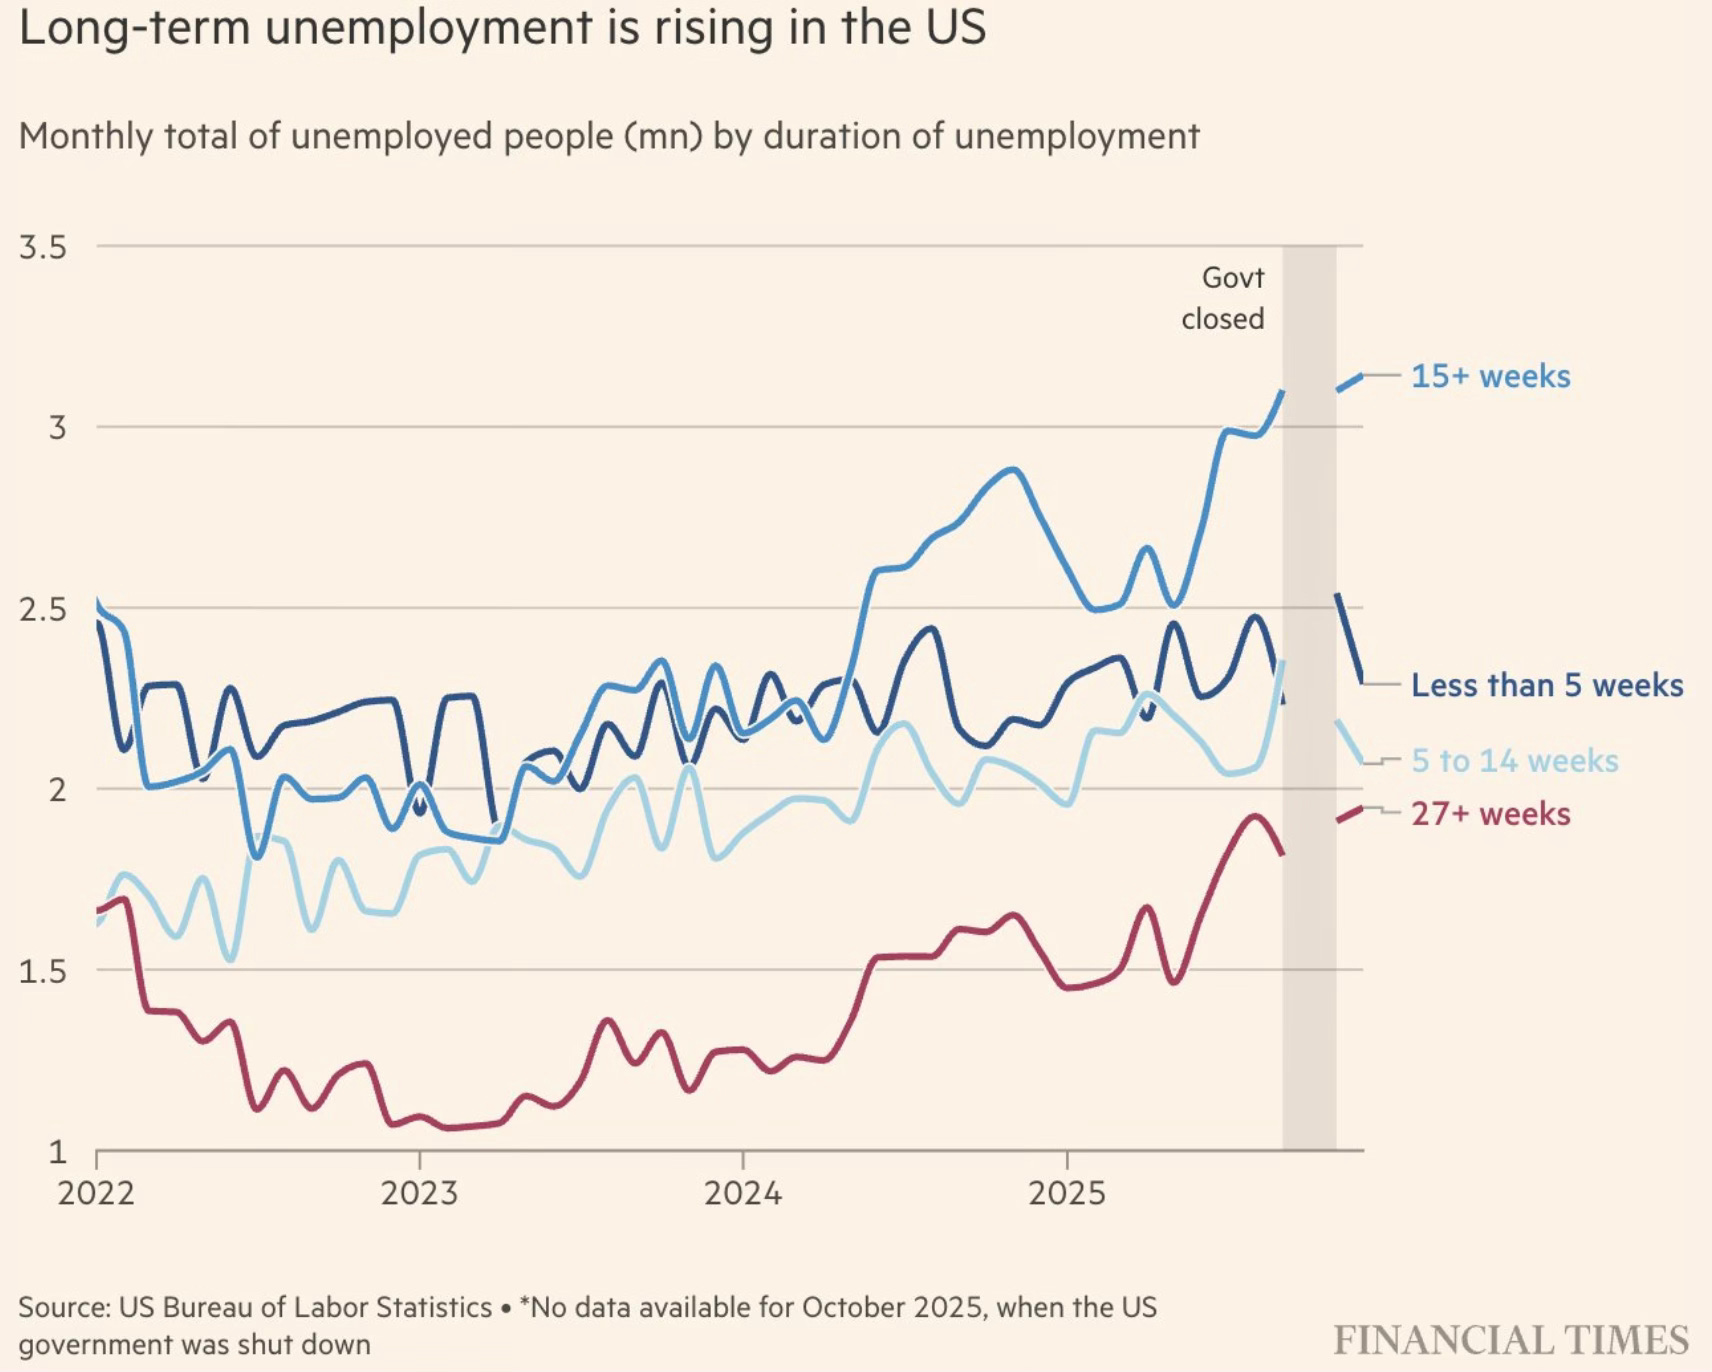
Long-term unemployment is rising.
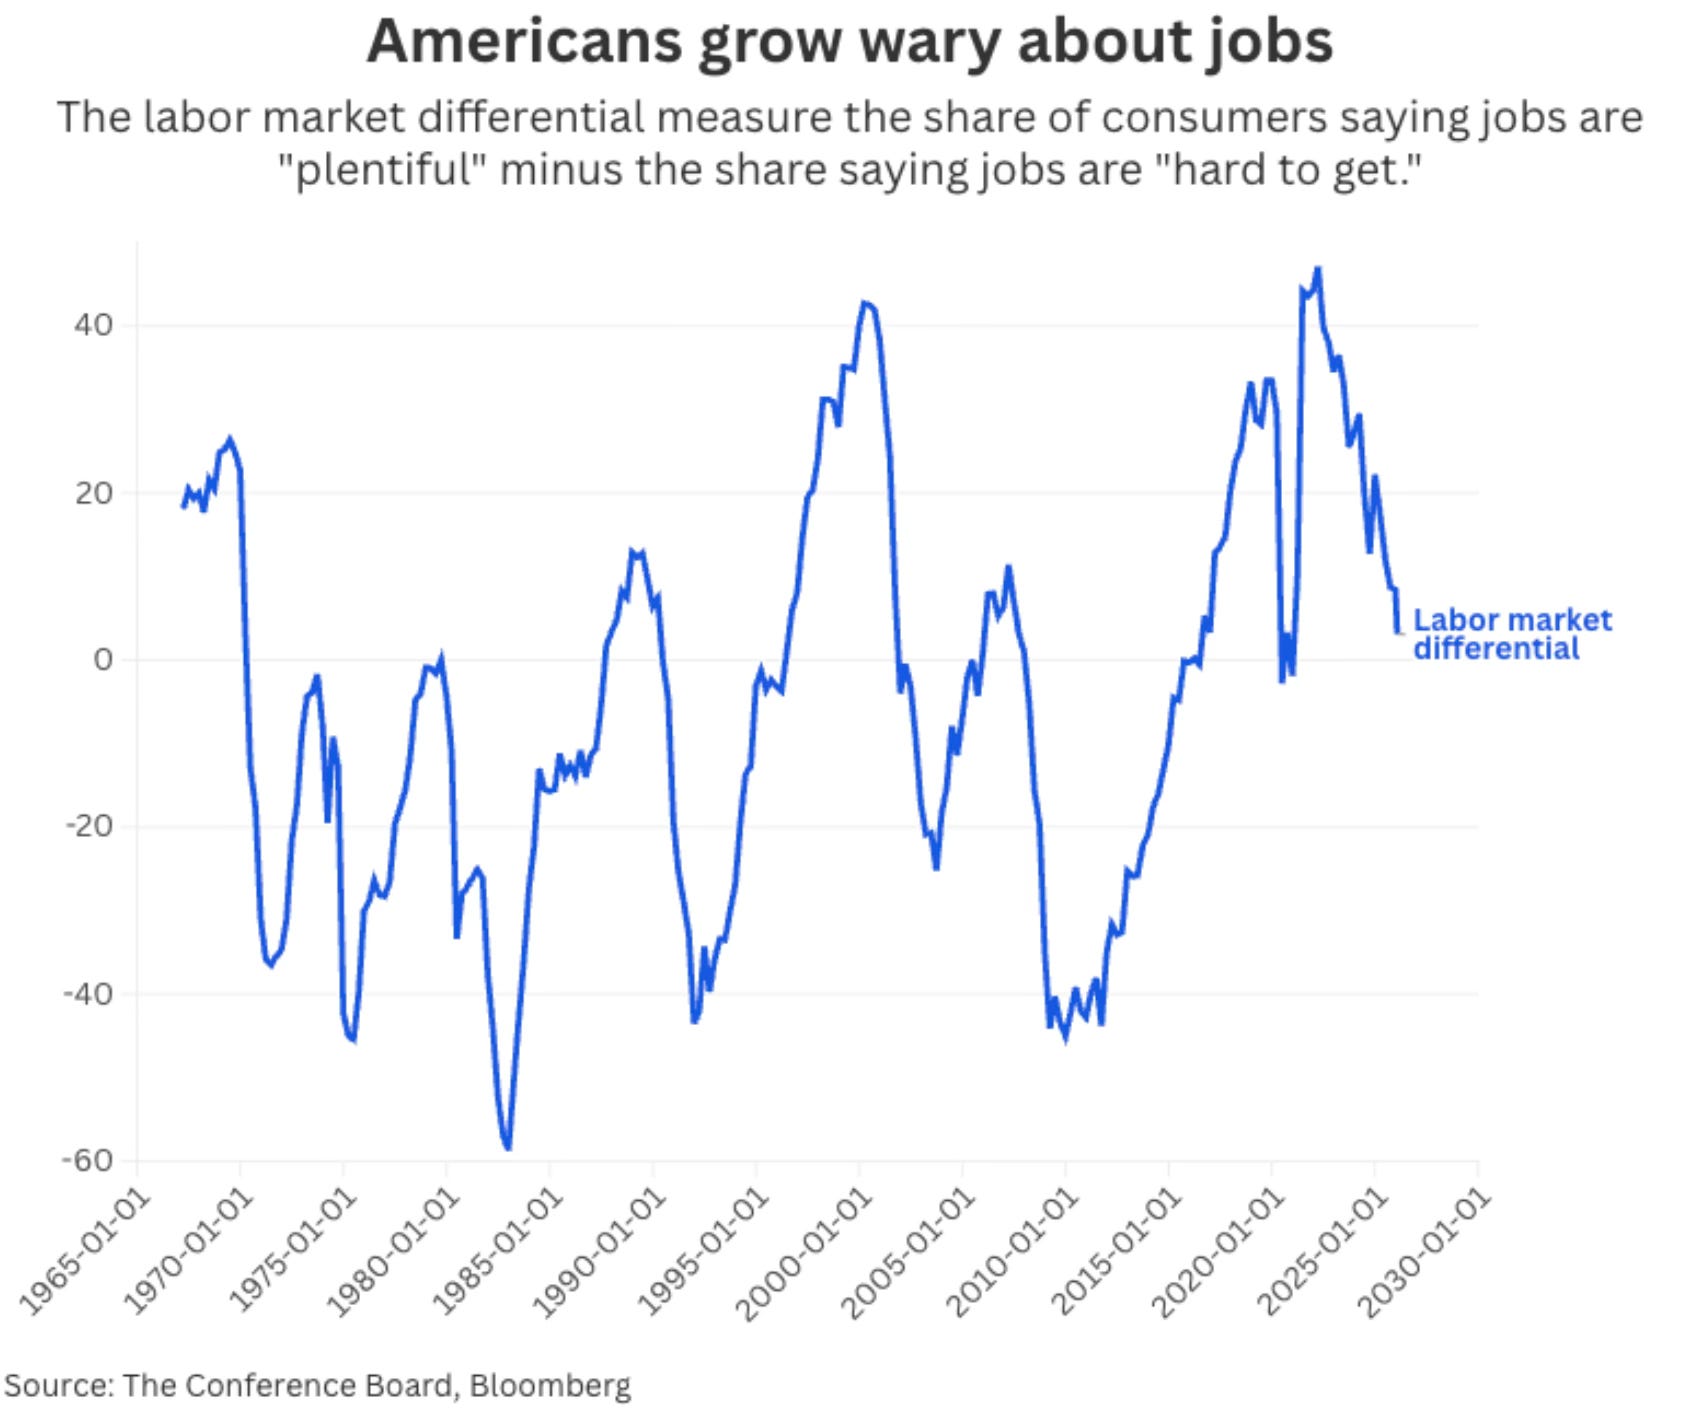
The labor market differential (jobs “plentiful” minus jobs “hard to get”) keeps hitting new cycle lows and is nearly in negative territory.
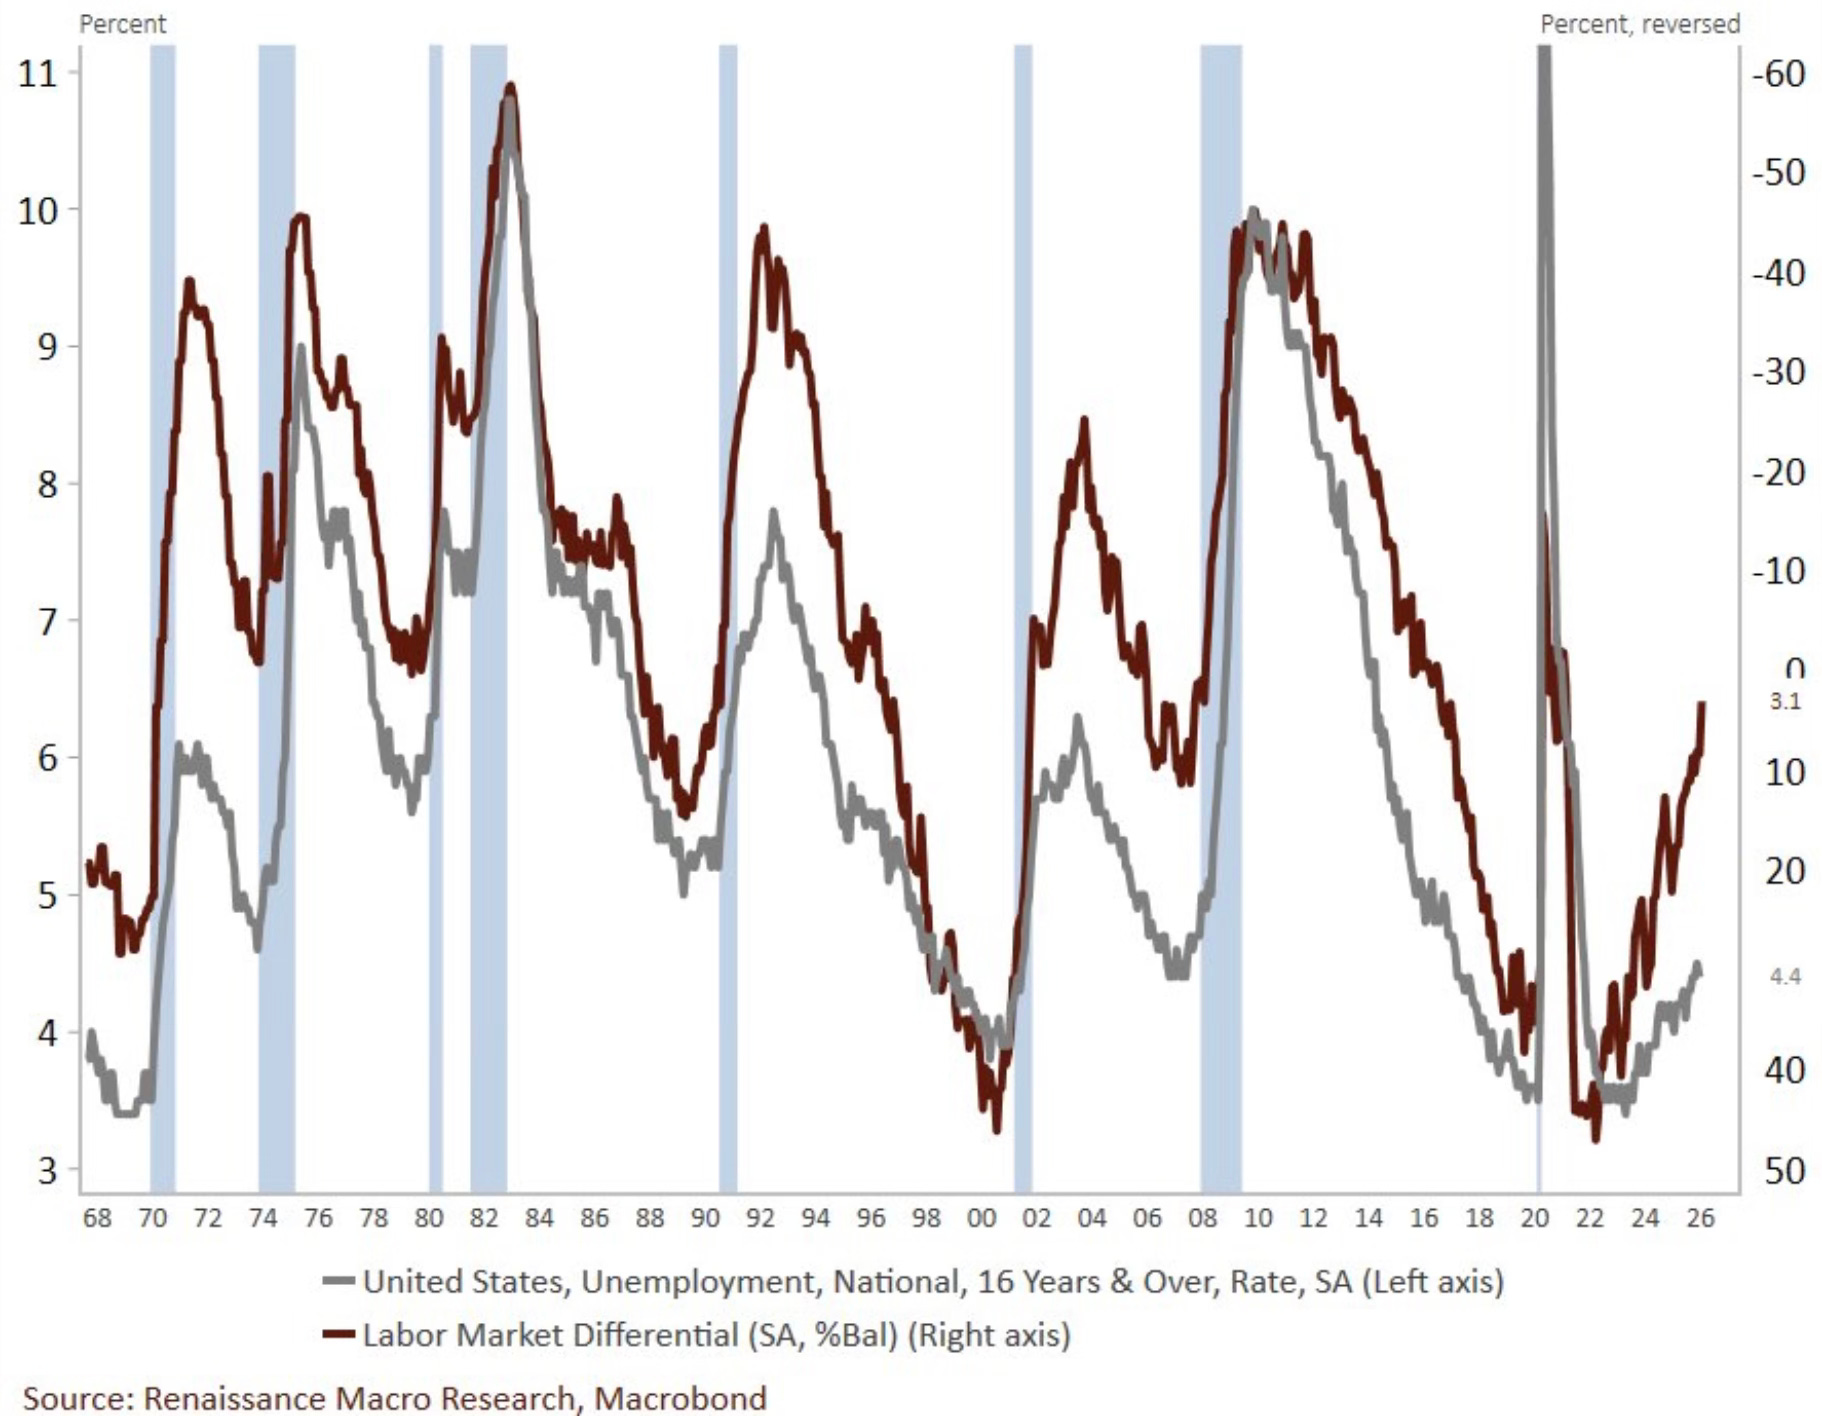
Here they are as one where it looks back historically and where the recessions happened.
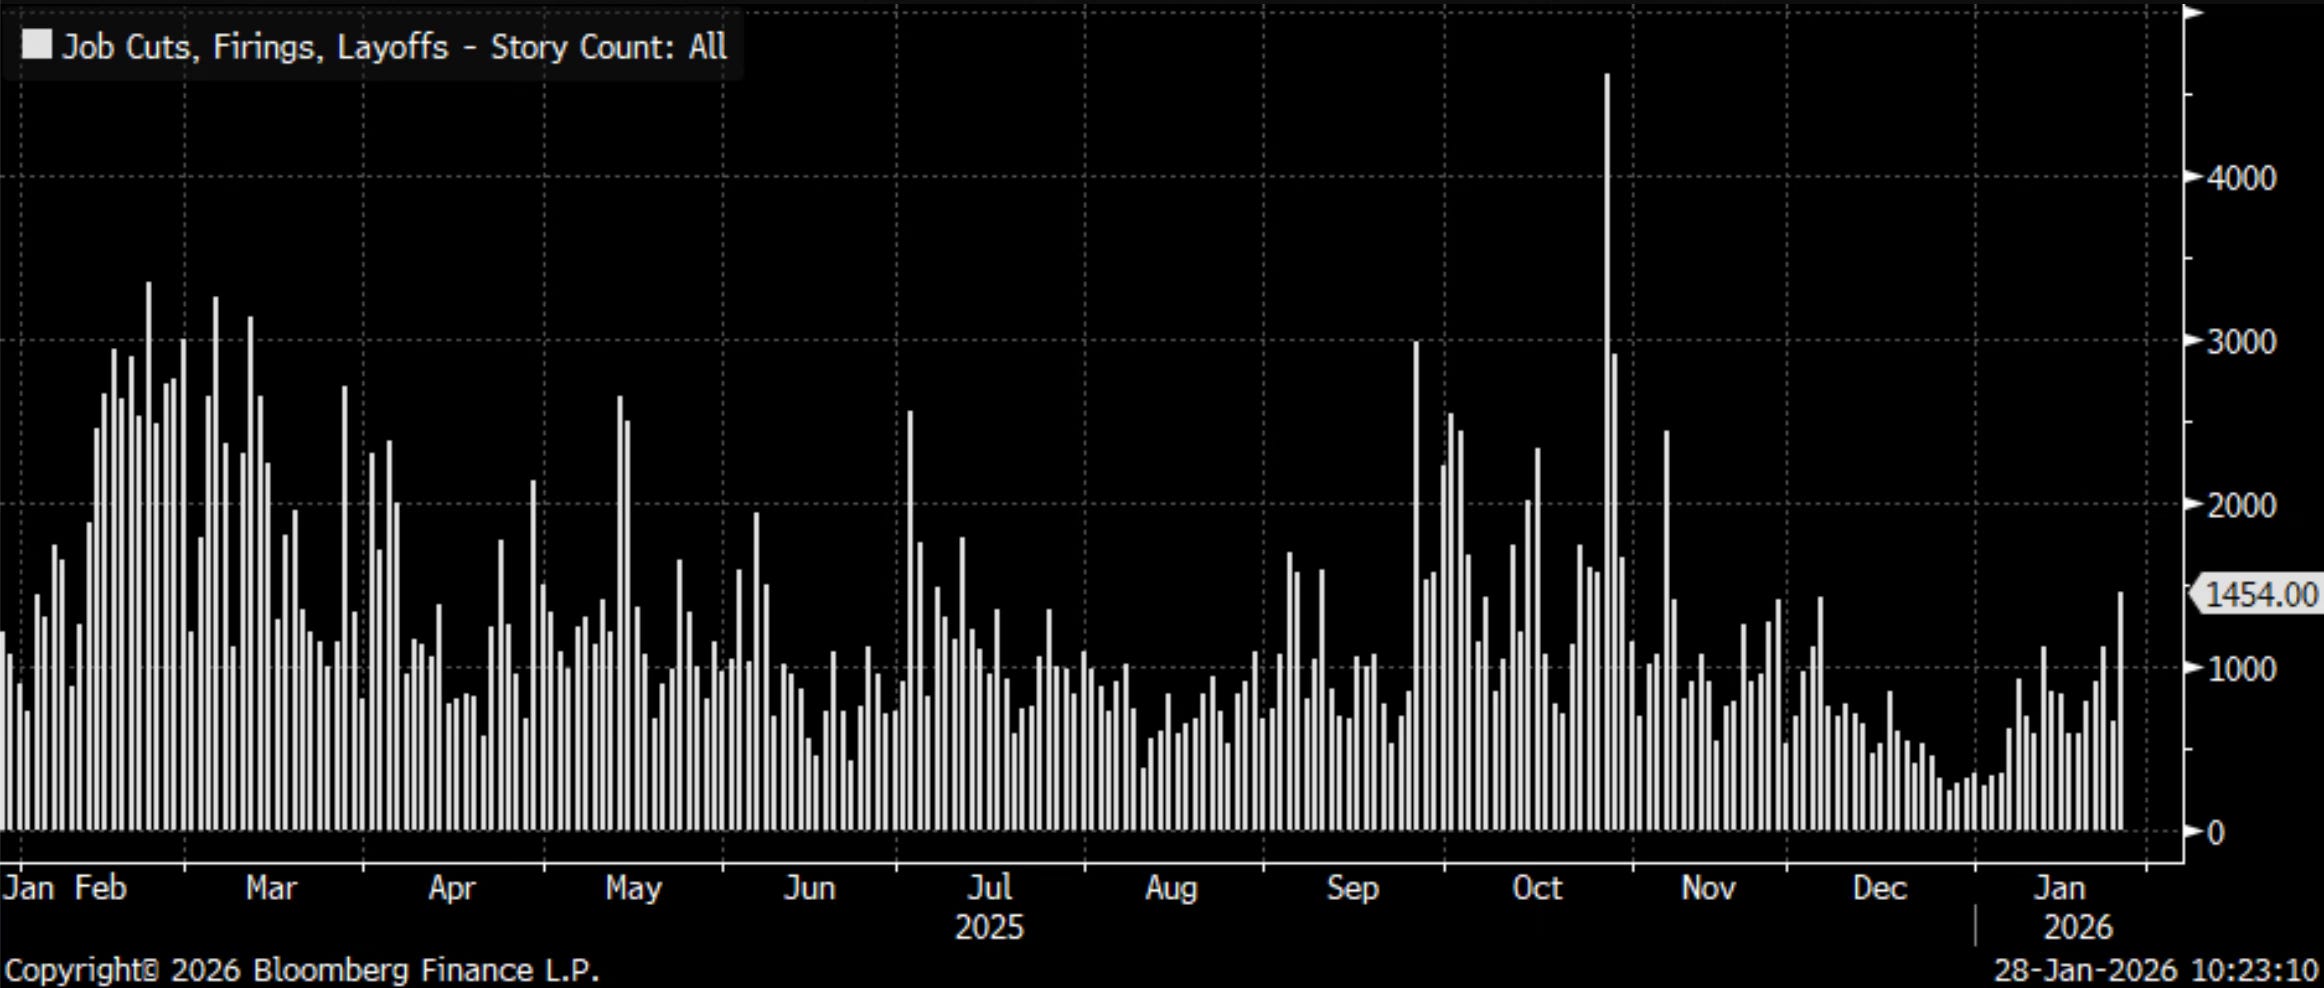
We’re also seeing the number of layoff mentions in news articles starting to spike again.
Now the labor market hasn’t been good for a while. But combined with that is a housing market that’s currently frozen. The housing market also hasn’t been good for a while.
Neither has had much impact on the stock market, which continues grinding higher. Until these factors begin to affect the U.S. consumer, they’re unlikely to move stocks lower.
If conditions persist or worsen, we could eventually see an impact, but for now, it mostly just makes for attention-grabbing headlines.
An Opportunity In Software?
My friends at Duality Research sent this over to me this week.
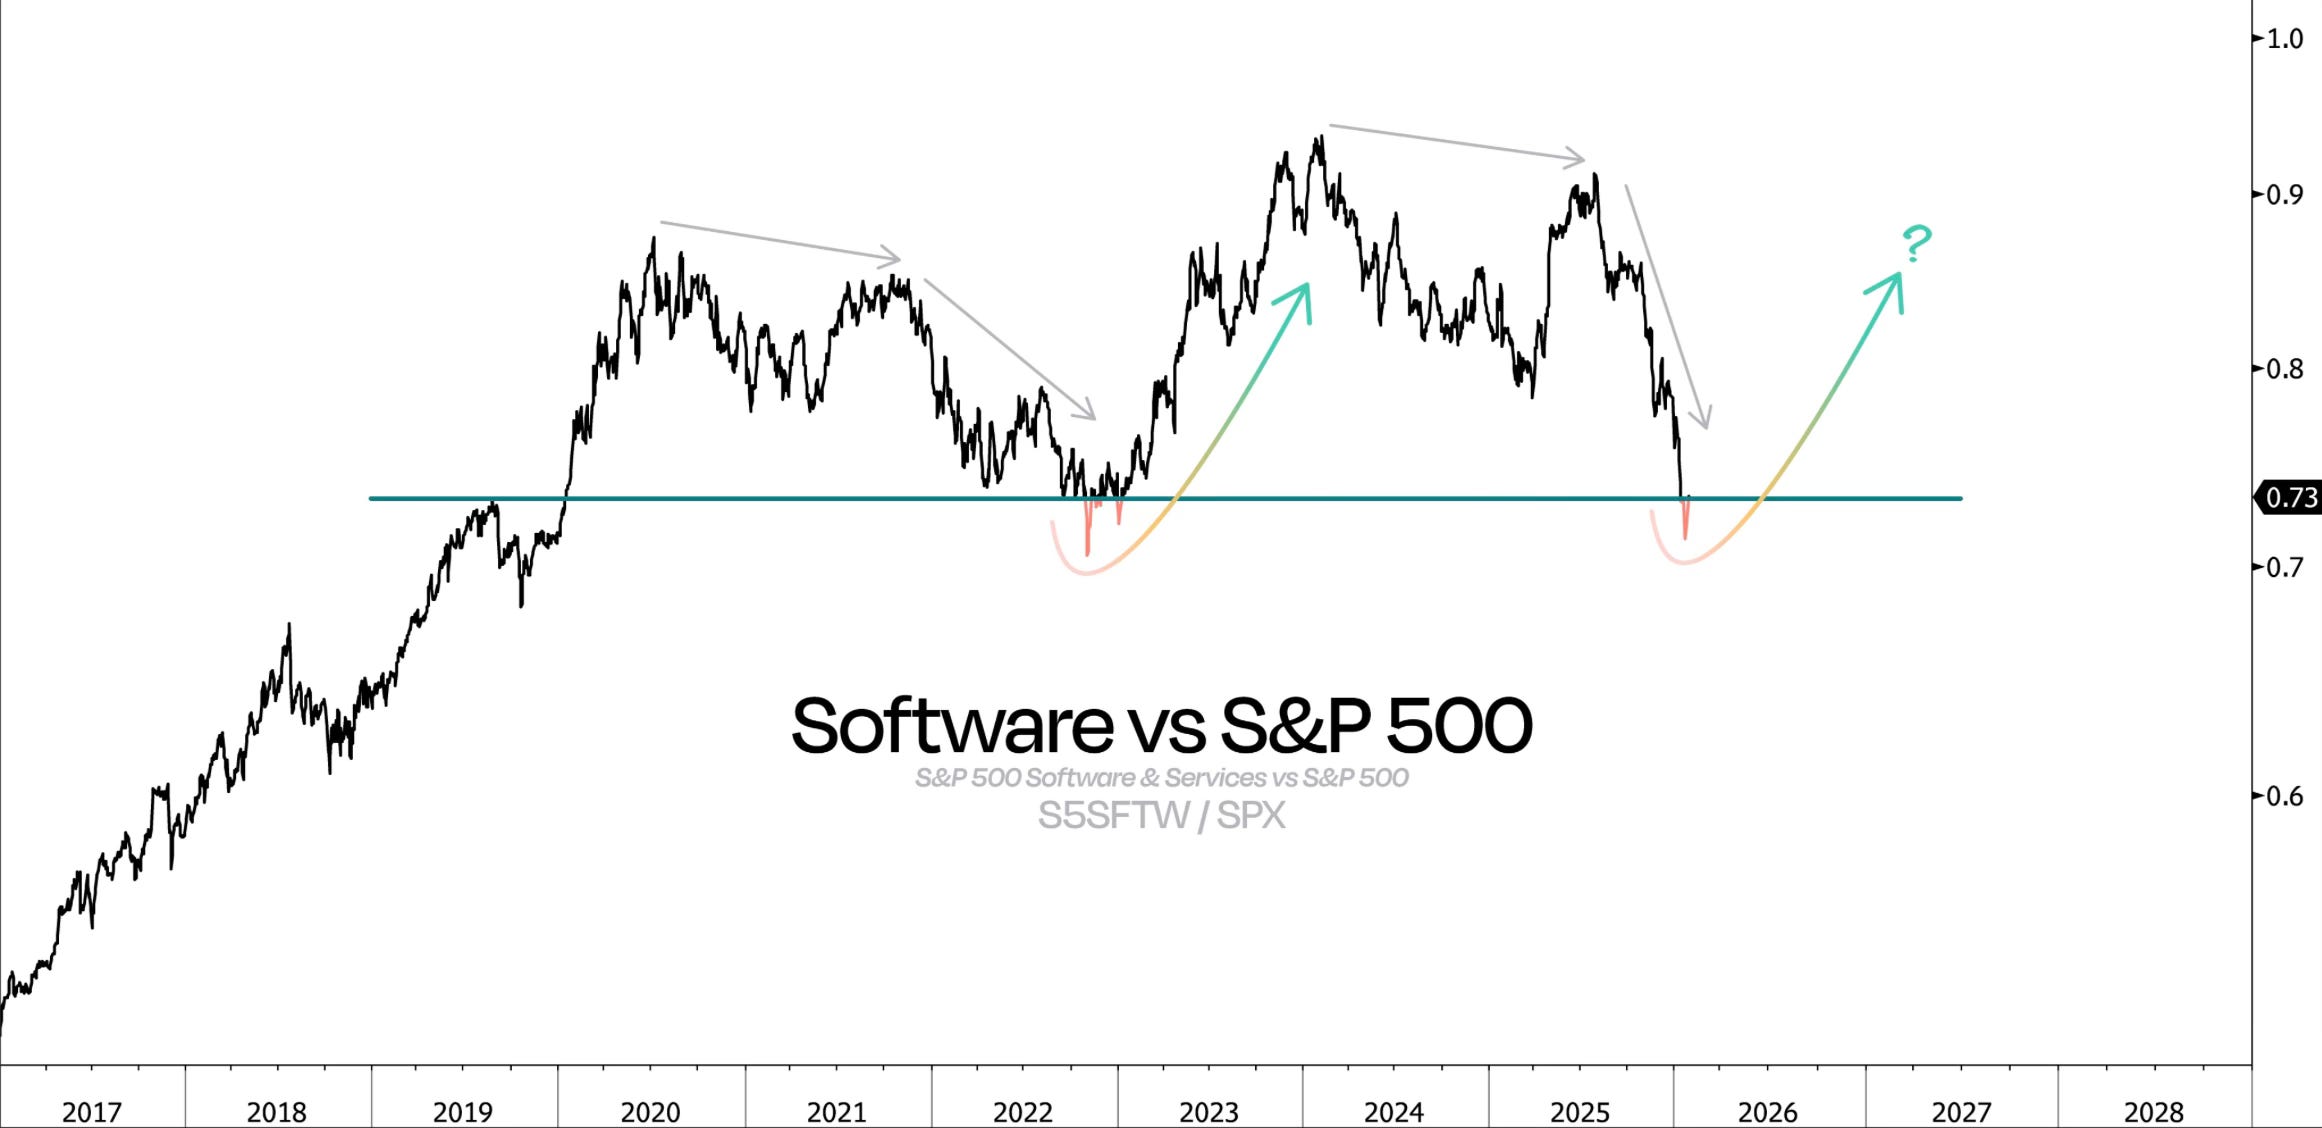
Will Software pull off a similar rebound to what we saw three years ago?
Right now, the ratio vs the S&P 500 has already undercut the 2019 highs — just like it did in late 2022 — and the good news is that it has since moved back above that key risk-level. For now, this is shaping up to look like a classic bear trap, very similar to the one we saw three years ago.
It got me to thinking.
I’ve already had my eye on the selling that has persisted in the software names. I just didn’t realize that this many names have been punished as much as they have. So I went a step deeper.
The software net exposure and long/short ratios are at the lowest levels on record.
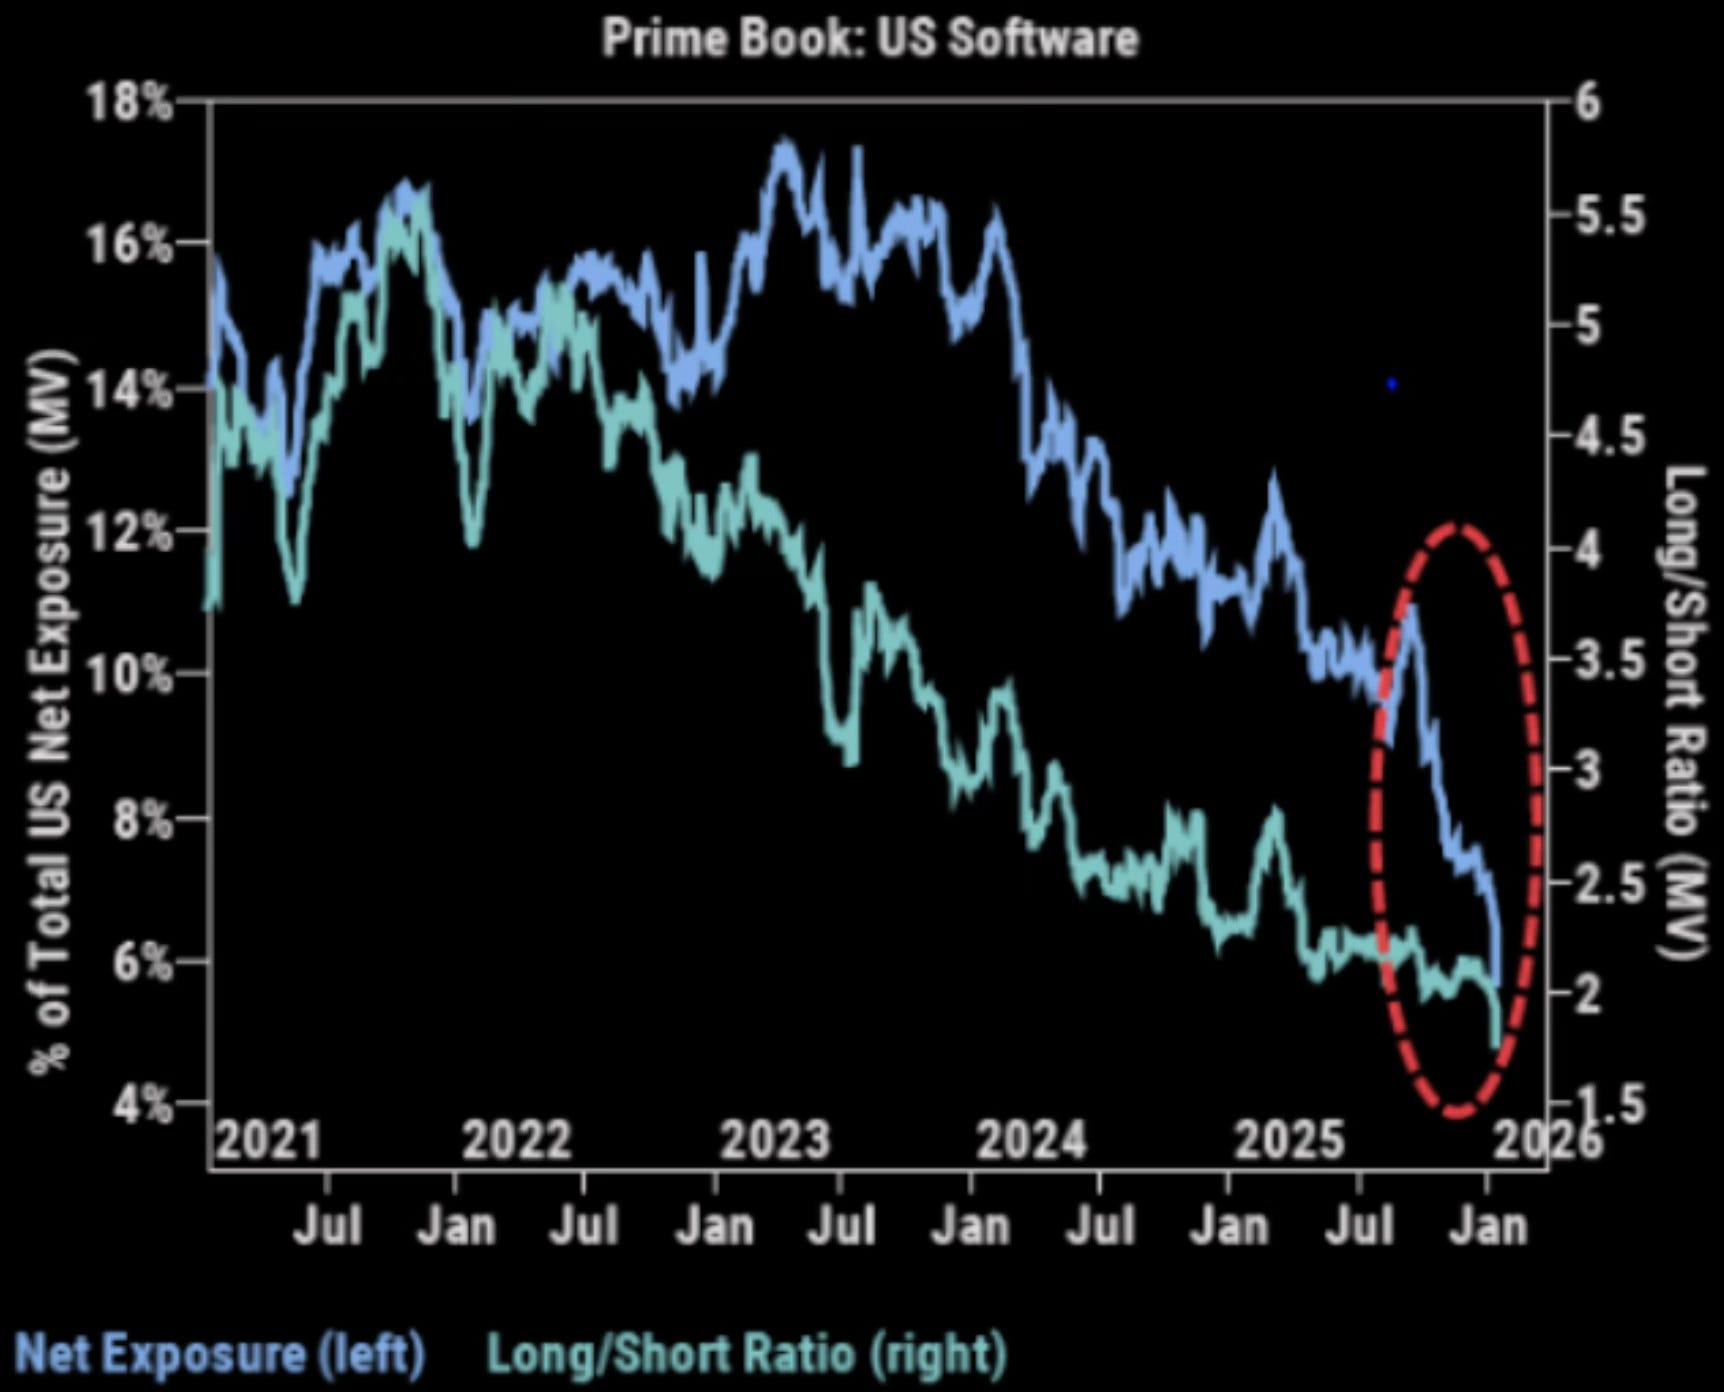
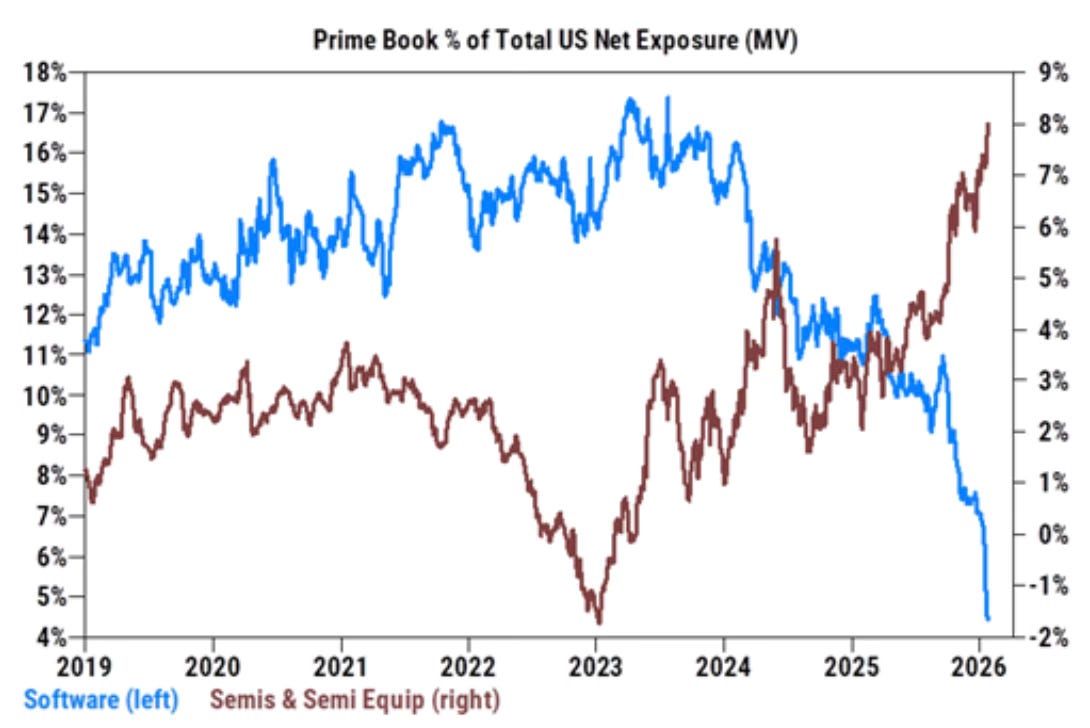
Hedge funds have taken their net exposure to software down to 4.5%. That’s the lowest since at least 2019 for as far back as their data goes. (You can show how they’ve done the opposite with semiconductors.)
Take a look at where some of these software stocks are currently at off their highs.
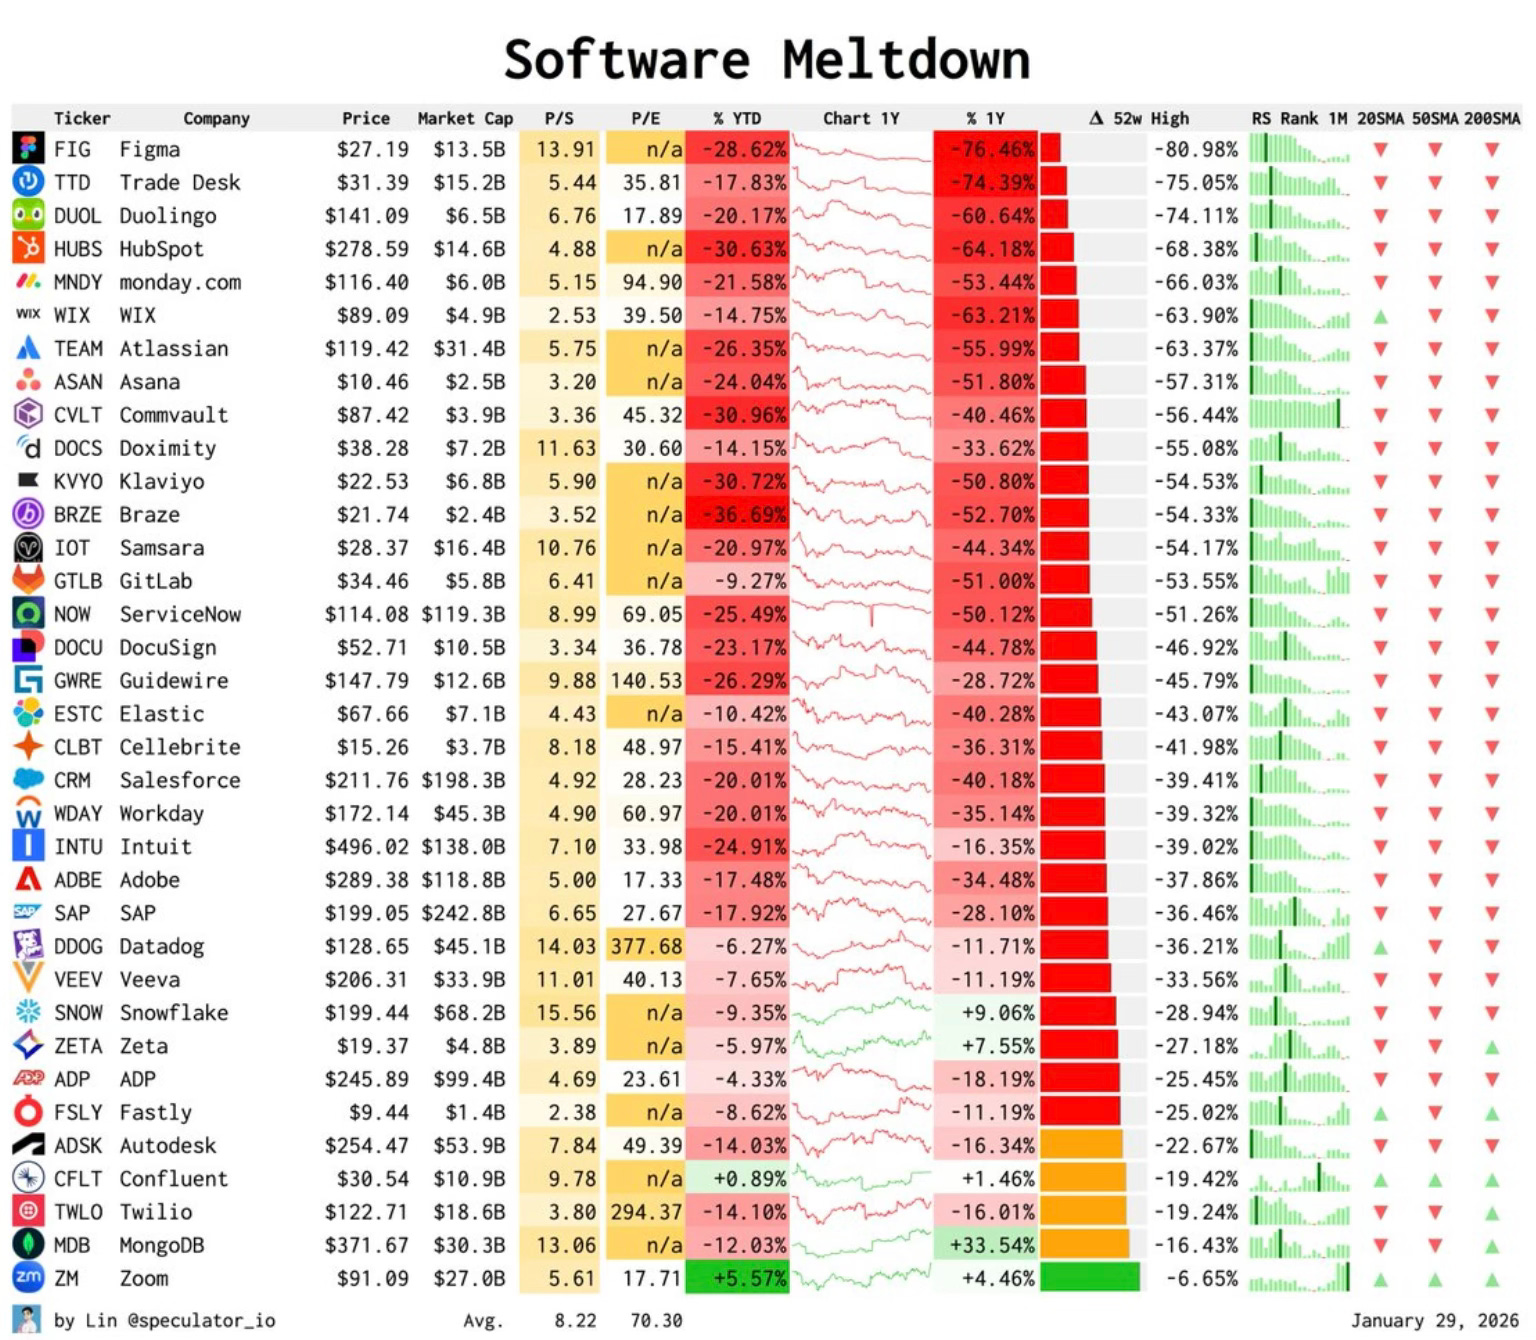
The software sector is currently 21% off its highs.
On Thursday, Microsoft had its worst day since 2020. Just think of that. The worst day since COVID in 2020 and during the GFC in 2008.
It’s now also down 21% from its high.
Microsoft and the software sector is now technically in a bear market.
Software is oversold and really hated right now.
But is it dead?
If AI does truly disrupt software like investors currently think, then the selling is likely not over.
AI has the momentum and as the real-life use cases come out, the hate for software stocks isn’t going to end.
But again, anytime you write about a sector being this disliked, hated and avoided by investors. It’s likely already bottom bouncing.
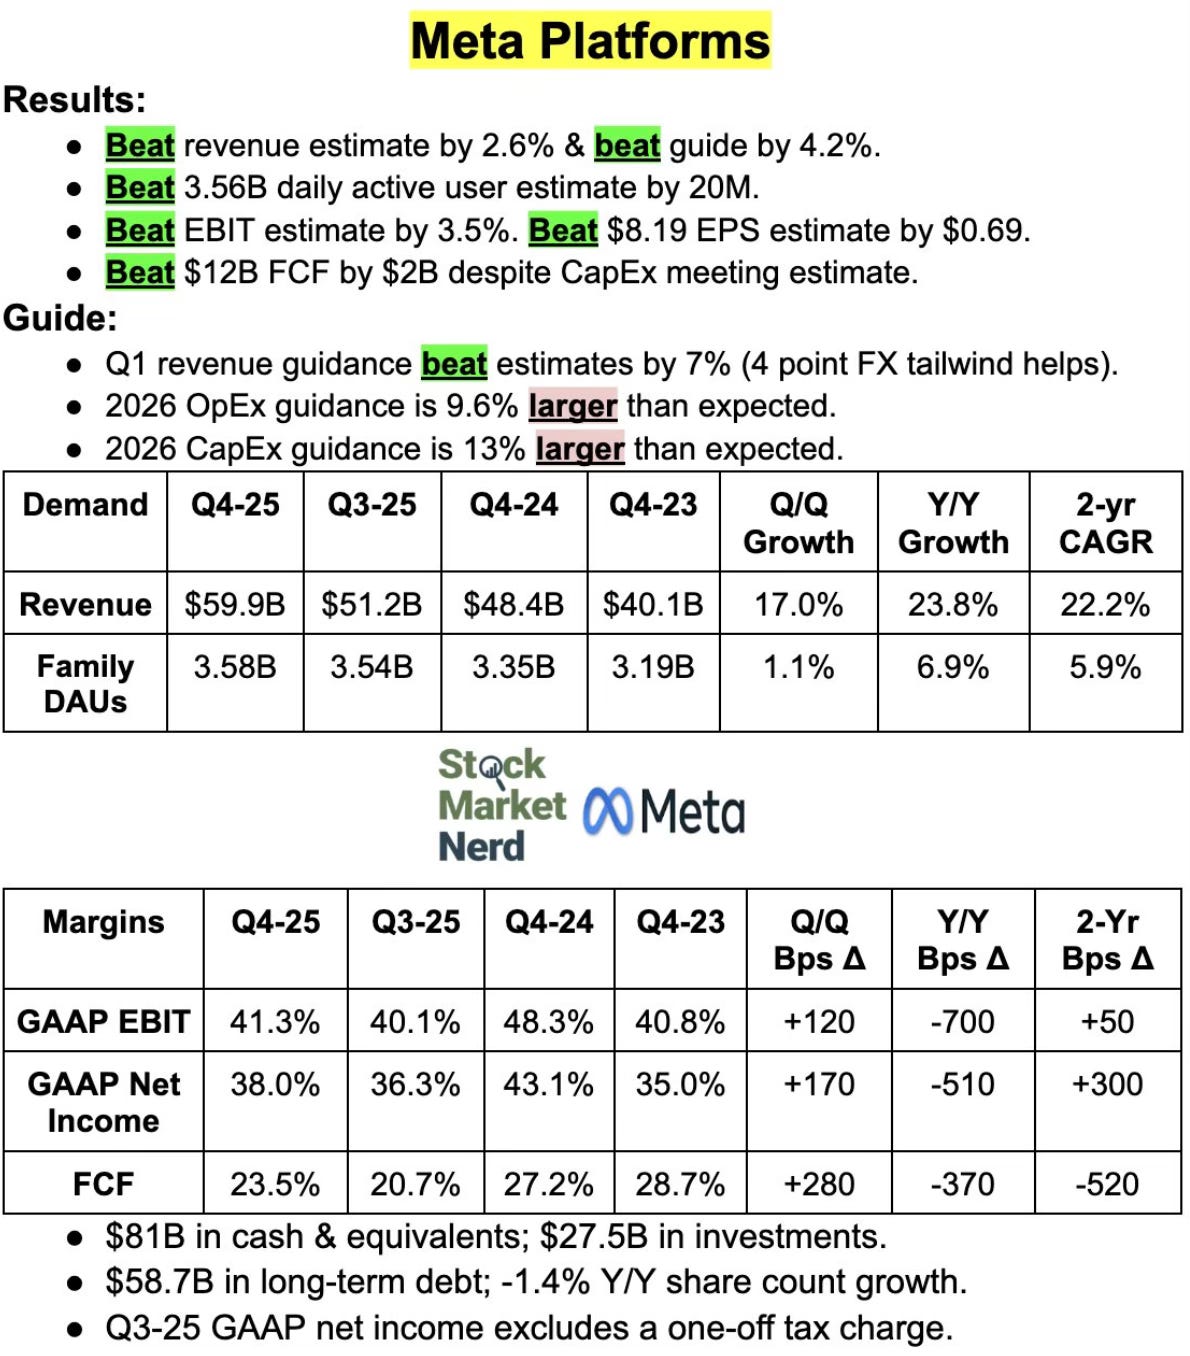
Is Meta Set to Lead in 2026?
To start 2026, I’ve talked a lot about how much I liked the setup with Meta.
On January 10th, in my Investing Update: 3 Stocks For 2026 I talked about why it was my top stock for 2026.
On January 20th, I added to my position at $605 a share and discussed that move in my Investing Update: Are Tech Stocks Rested & Ready?
In that piece I indicated that I expected it to have a positive reaction to earnings and climb back over the $700 mark.
Meta reports earnings on Wednesday. Don’t be surprised if next week at this time I’m writing about Meta being over $700.
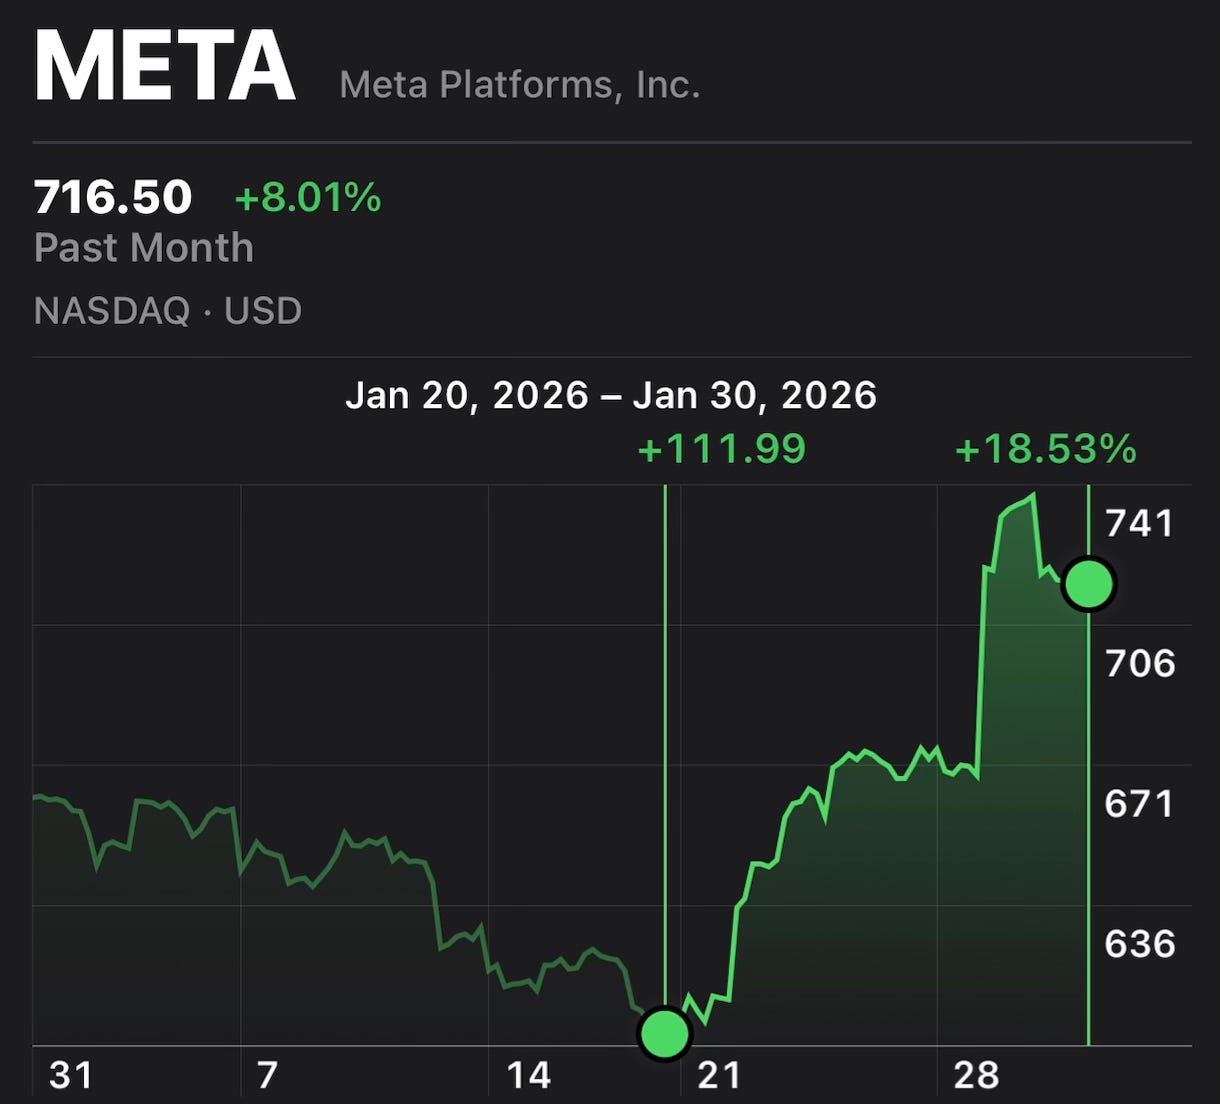
Well they did crush earnings. My $700 number wasn’t positive enough. It actually got up to $738 a share on Wednesday.
Since I bought on the 20th, ten days ago, Meta is up 18.53%.
Now we’re seeing the price targets raises come.
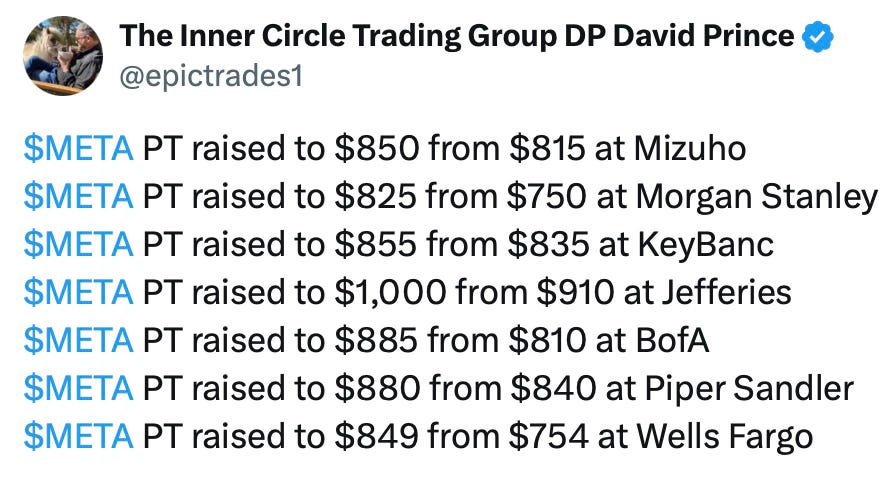
Meta was too cheap when you considered the growth that you’re getting. It’s still too cheap at under 20 time forward earnings.
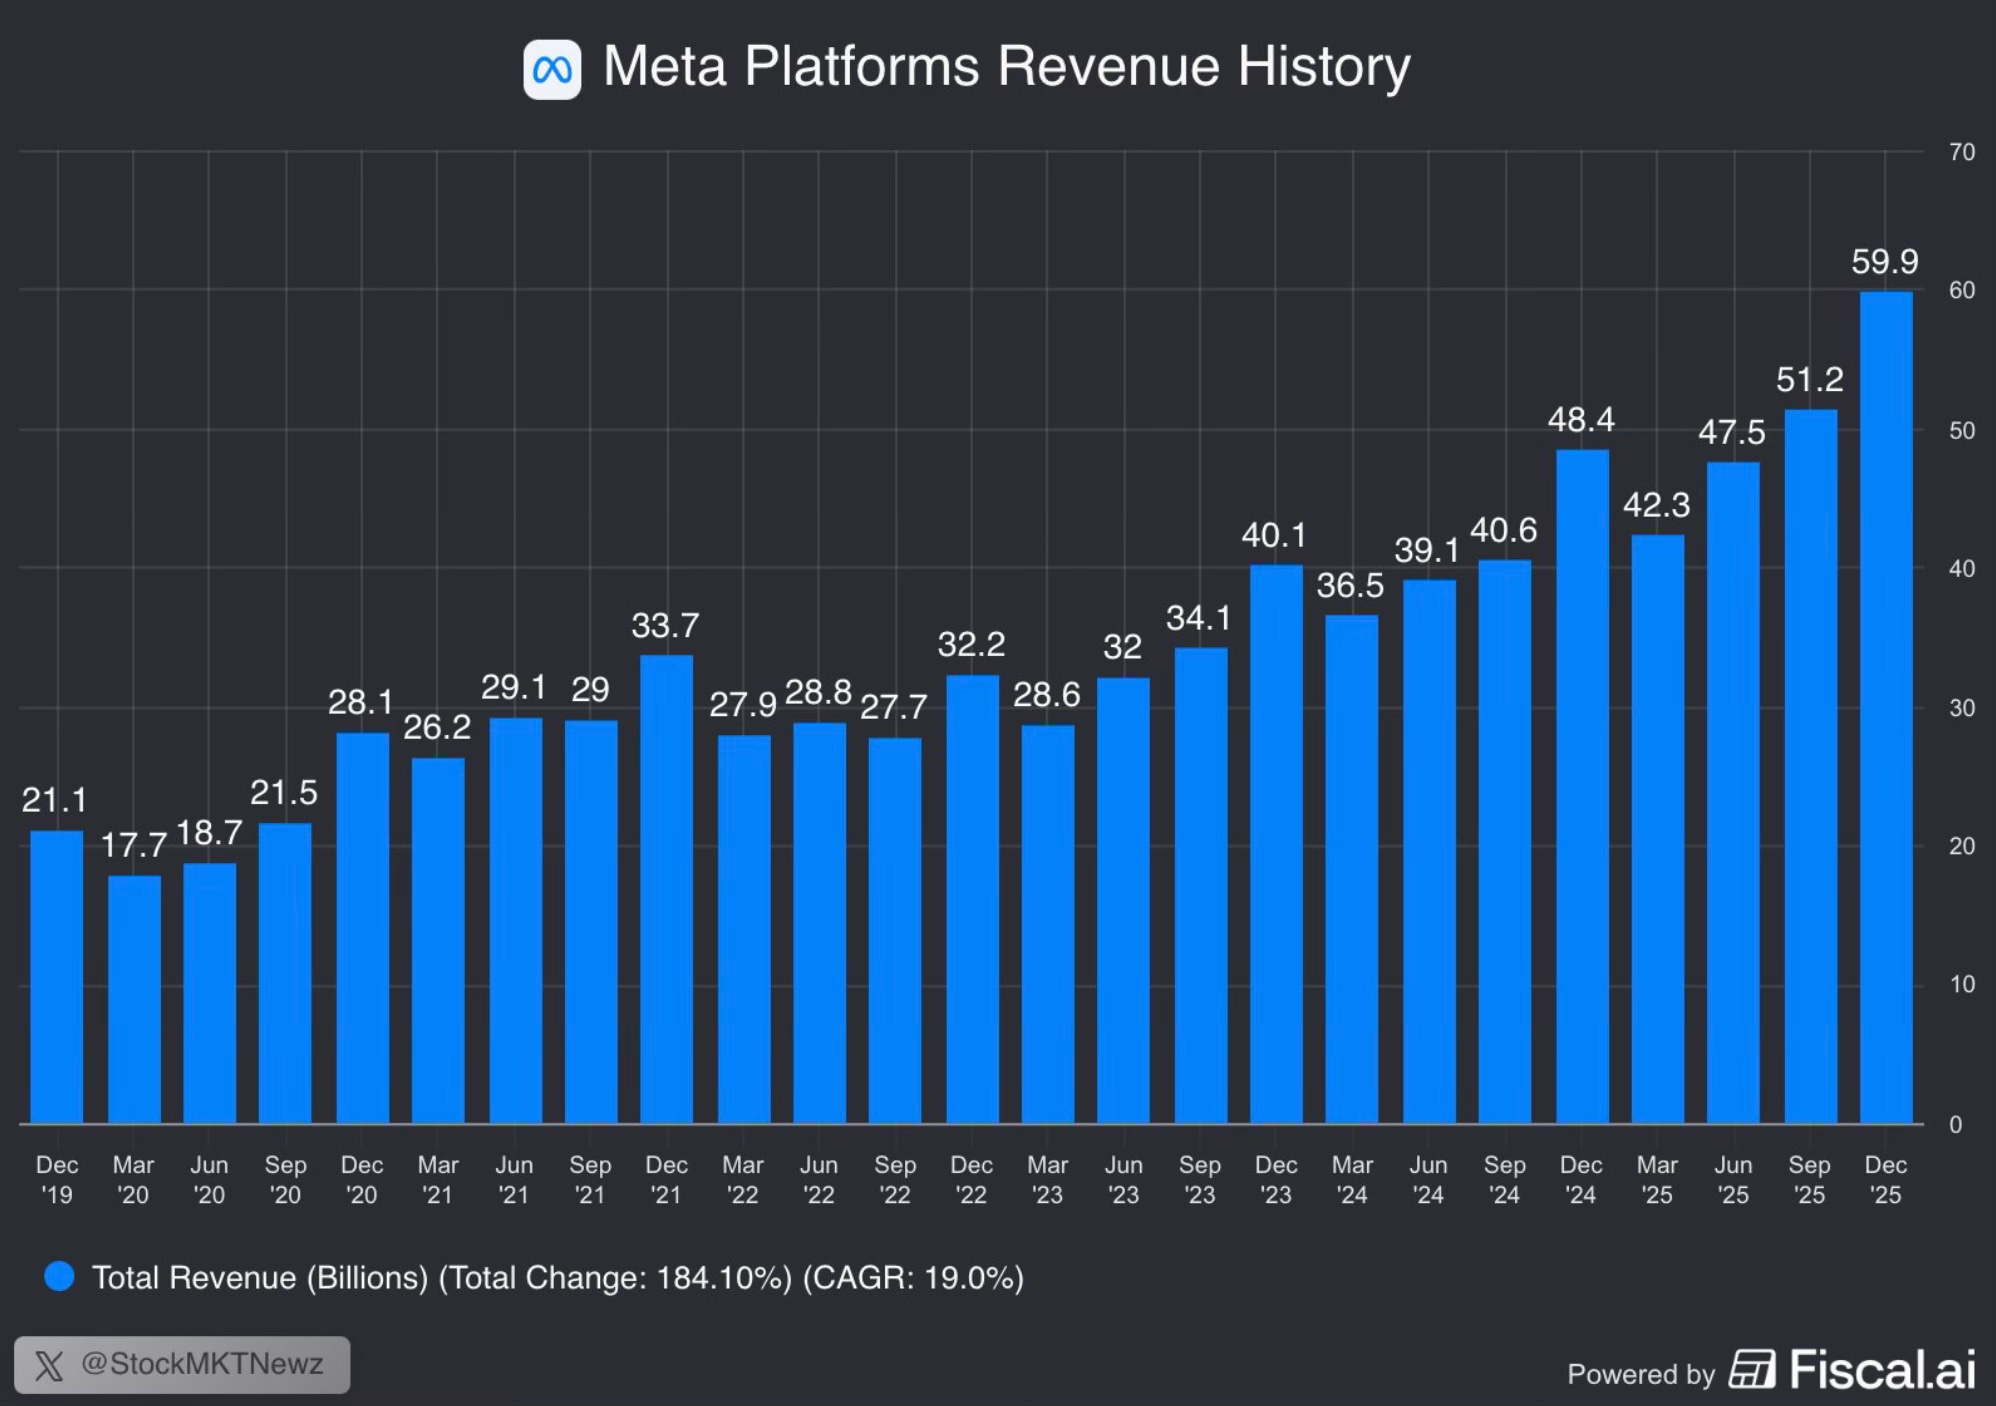
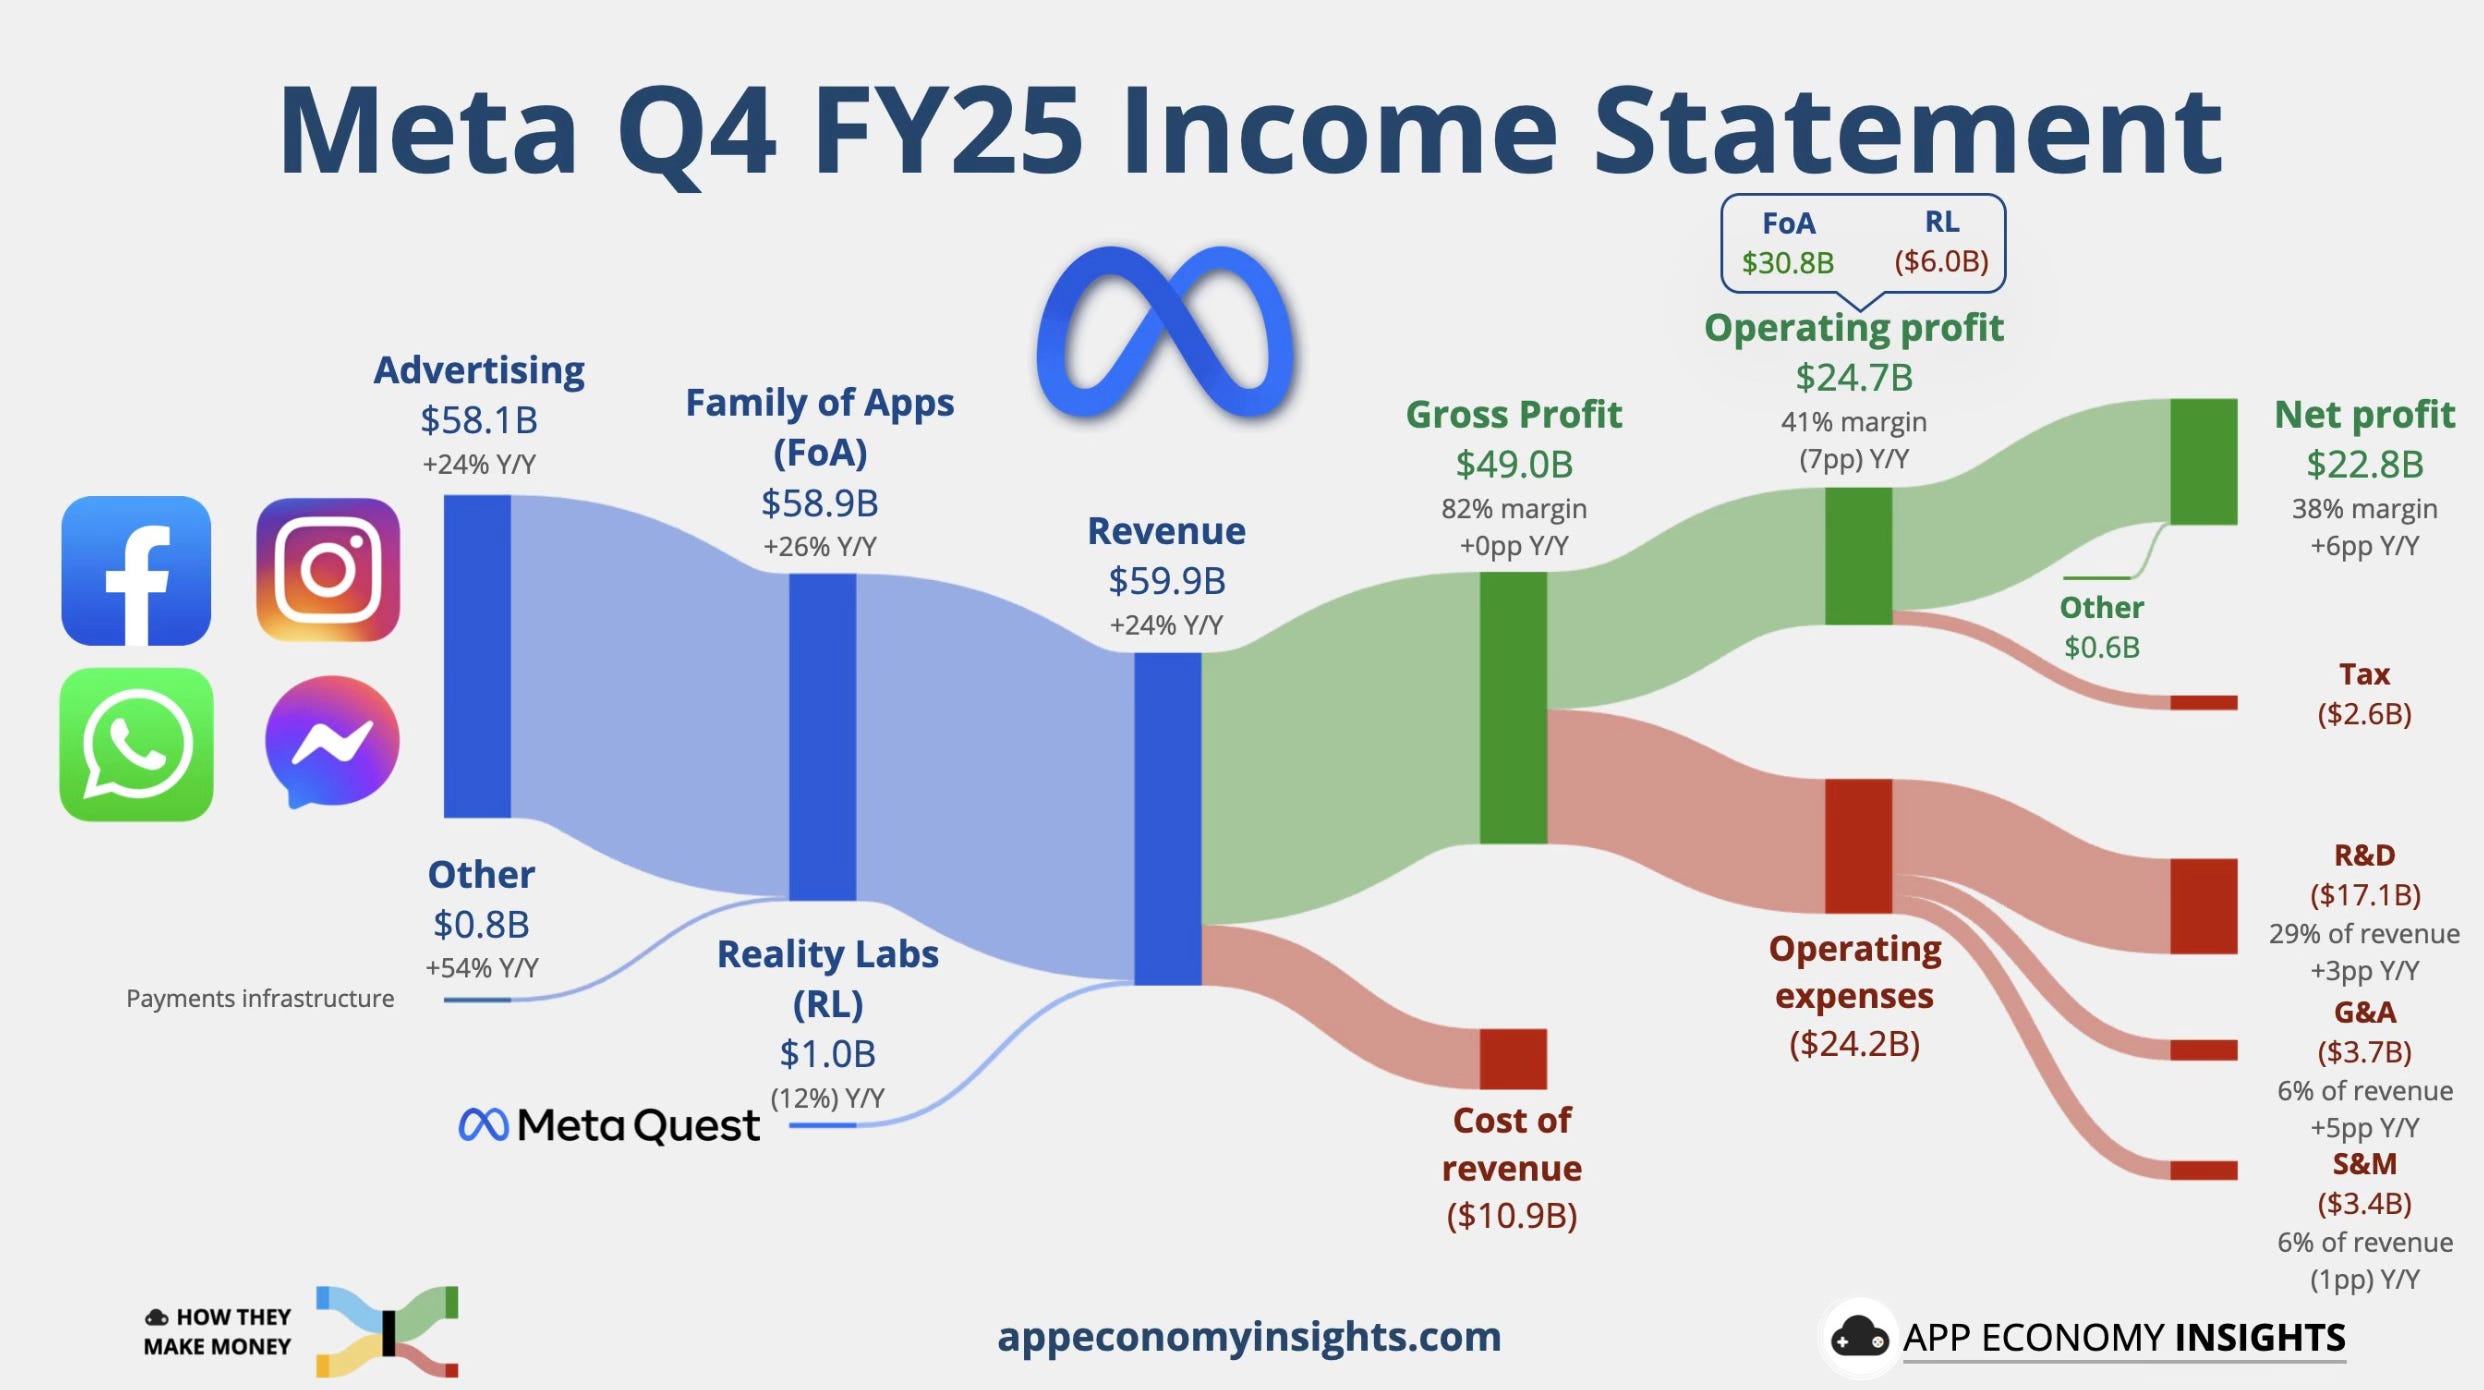
Just look at the revenue growth and big jump it took last quarter.
With Meta you really have to keep in mind that 3.58 billion people use one of their products every single day.
There are 8.3 billion people on earth.
That means that everyday over 43% of people on the planet use a Meta owned product.
The topic of adding subscriptions to all of the apps has been rumored for a while and appears to be gaining momentum. Another massive revenue opportunity.
It’s already proving to be a winner in the AI economy with AI already driving real engagement, ad performance & revenue acceleration. It plans to spend as much as $135 billion on AI build-out in 2026. They’re going at things very aggressively. The flywheel story of this stock looks to be strengthening. It’s hard to bet against Zuck in 26.
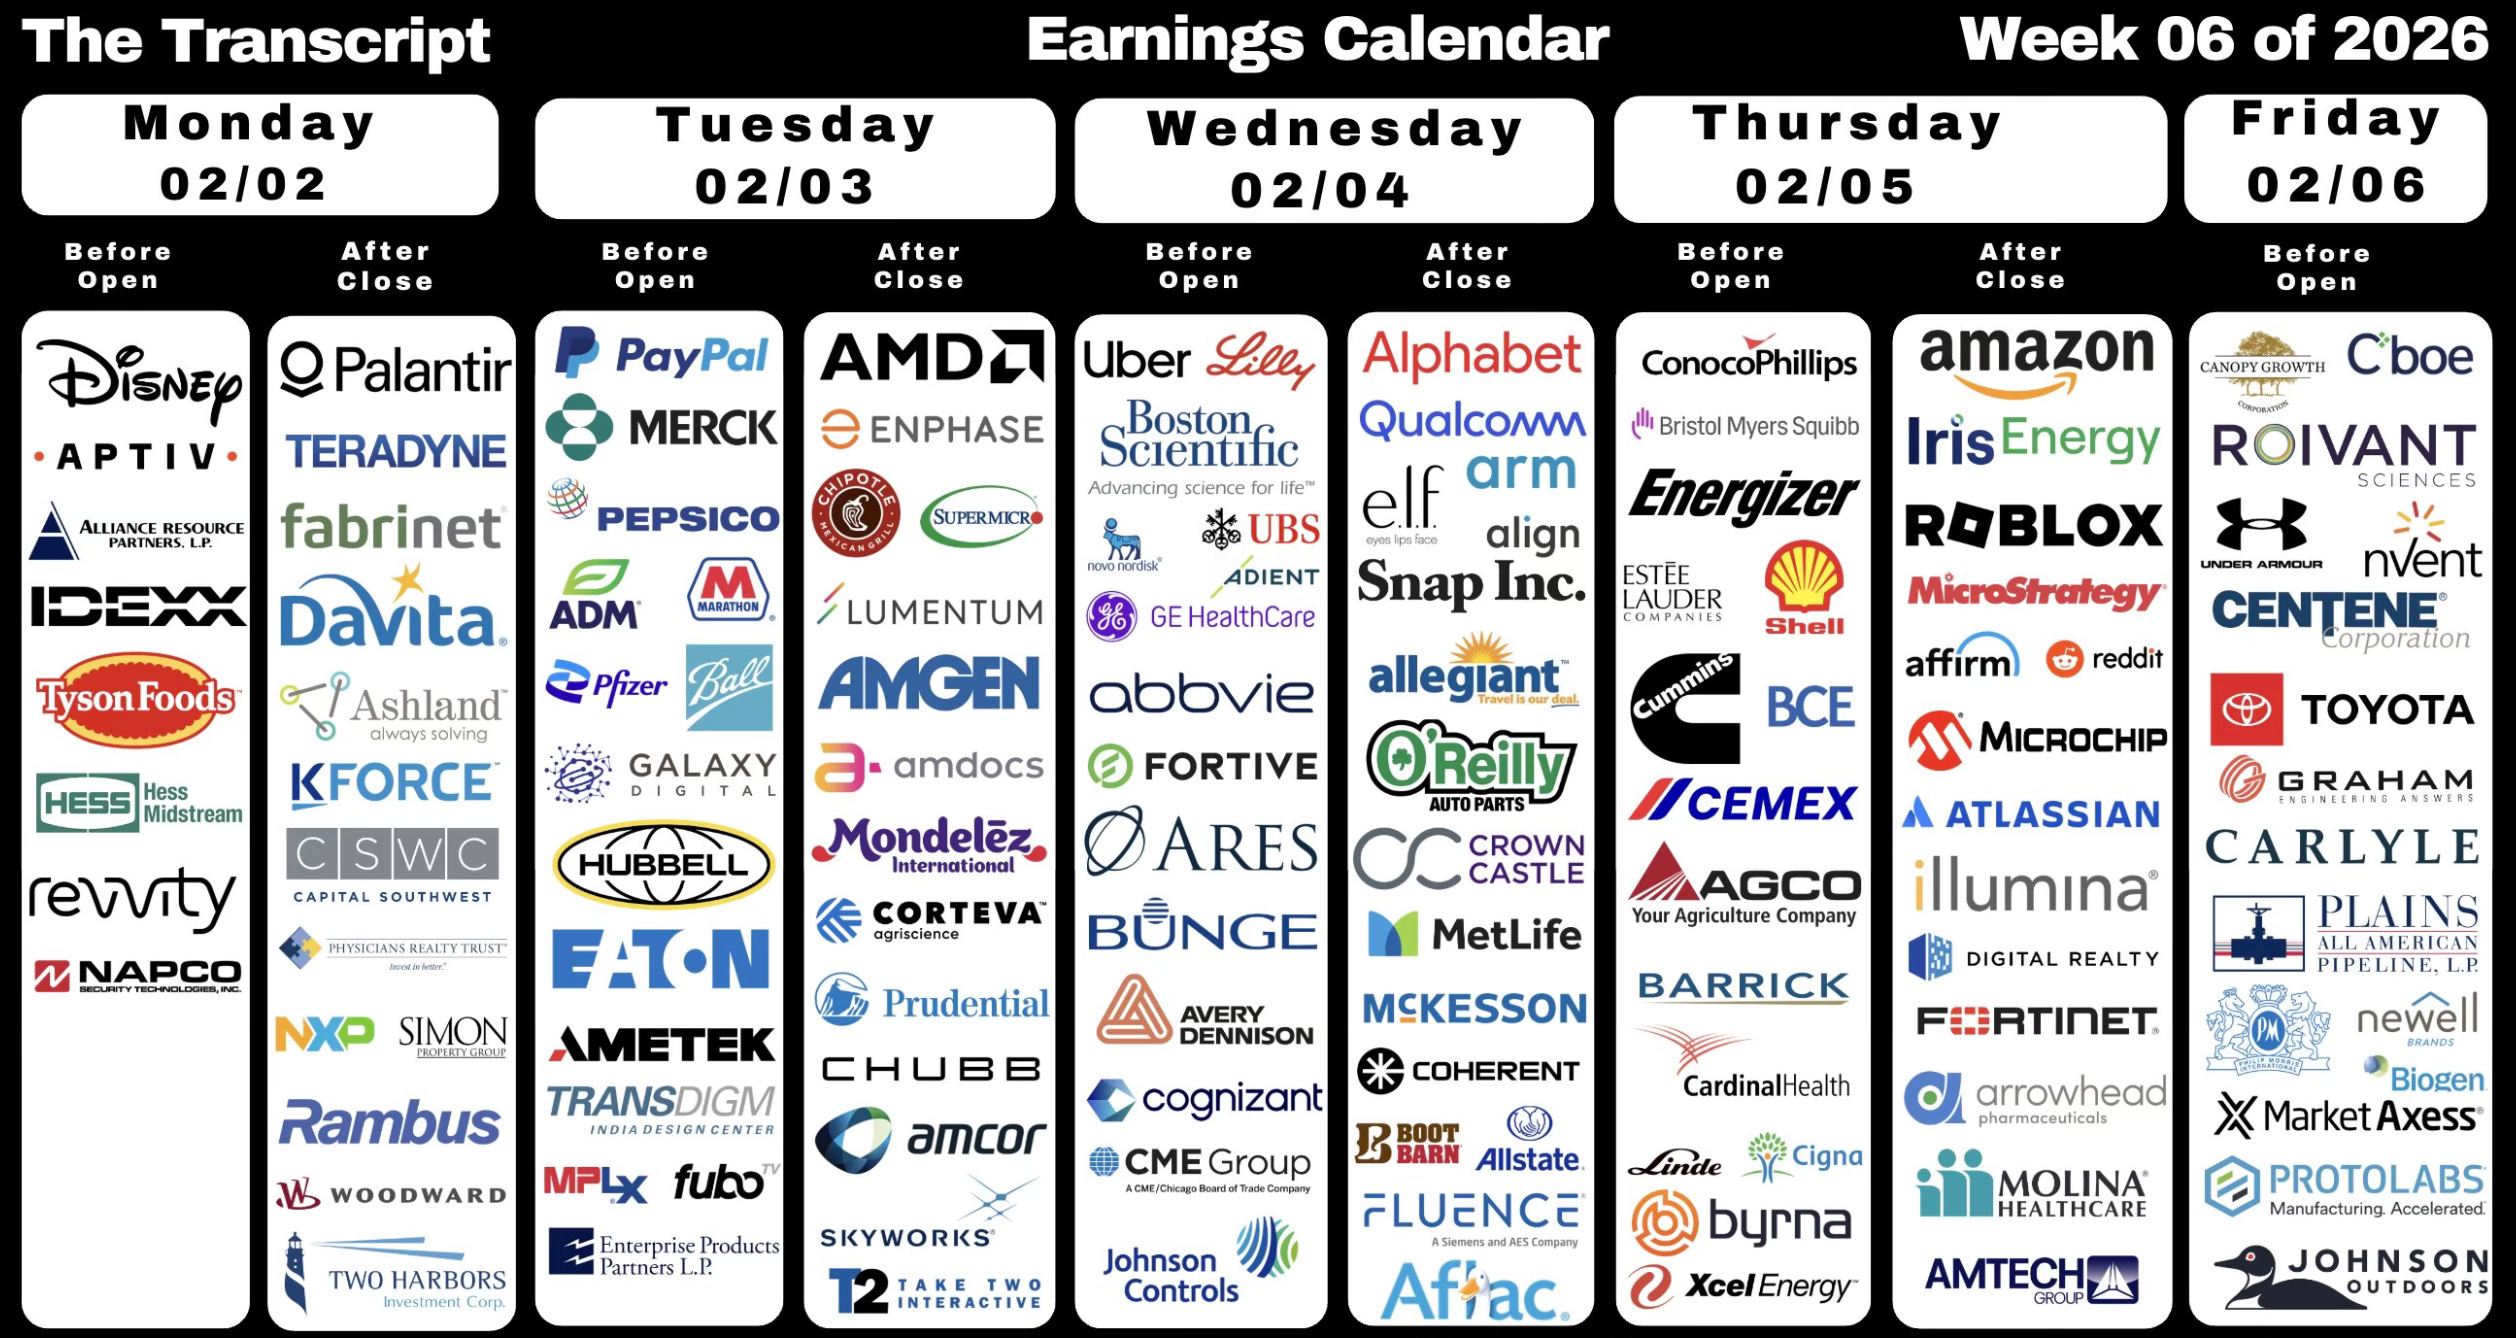
Upcoming Earnings
Get ready for another packed week of earnings.
The Coffee Table ☕
There are a few venture capitalists that I listen when they speak. Bill Gurley is one of those people. He recently talked about AI stocks being crowded and why an AI correction is inevitable. Why venture capitalist Bill Gurley said a ‘correction’ is inevitable for AI
This is an extended read in Yahoo Finance on consumer confidence tanking to the lowest level since 2014. Consumer confidence tanks to lowest level since 2014
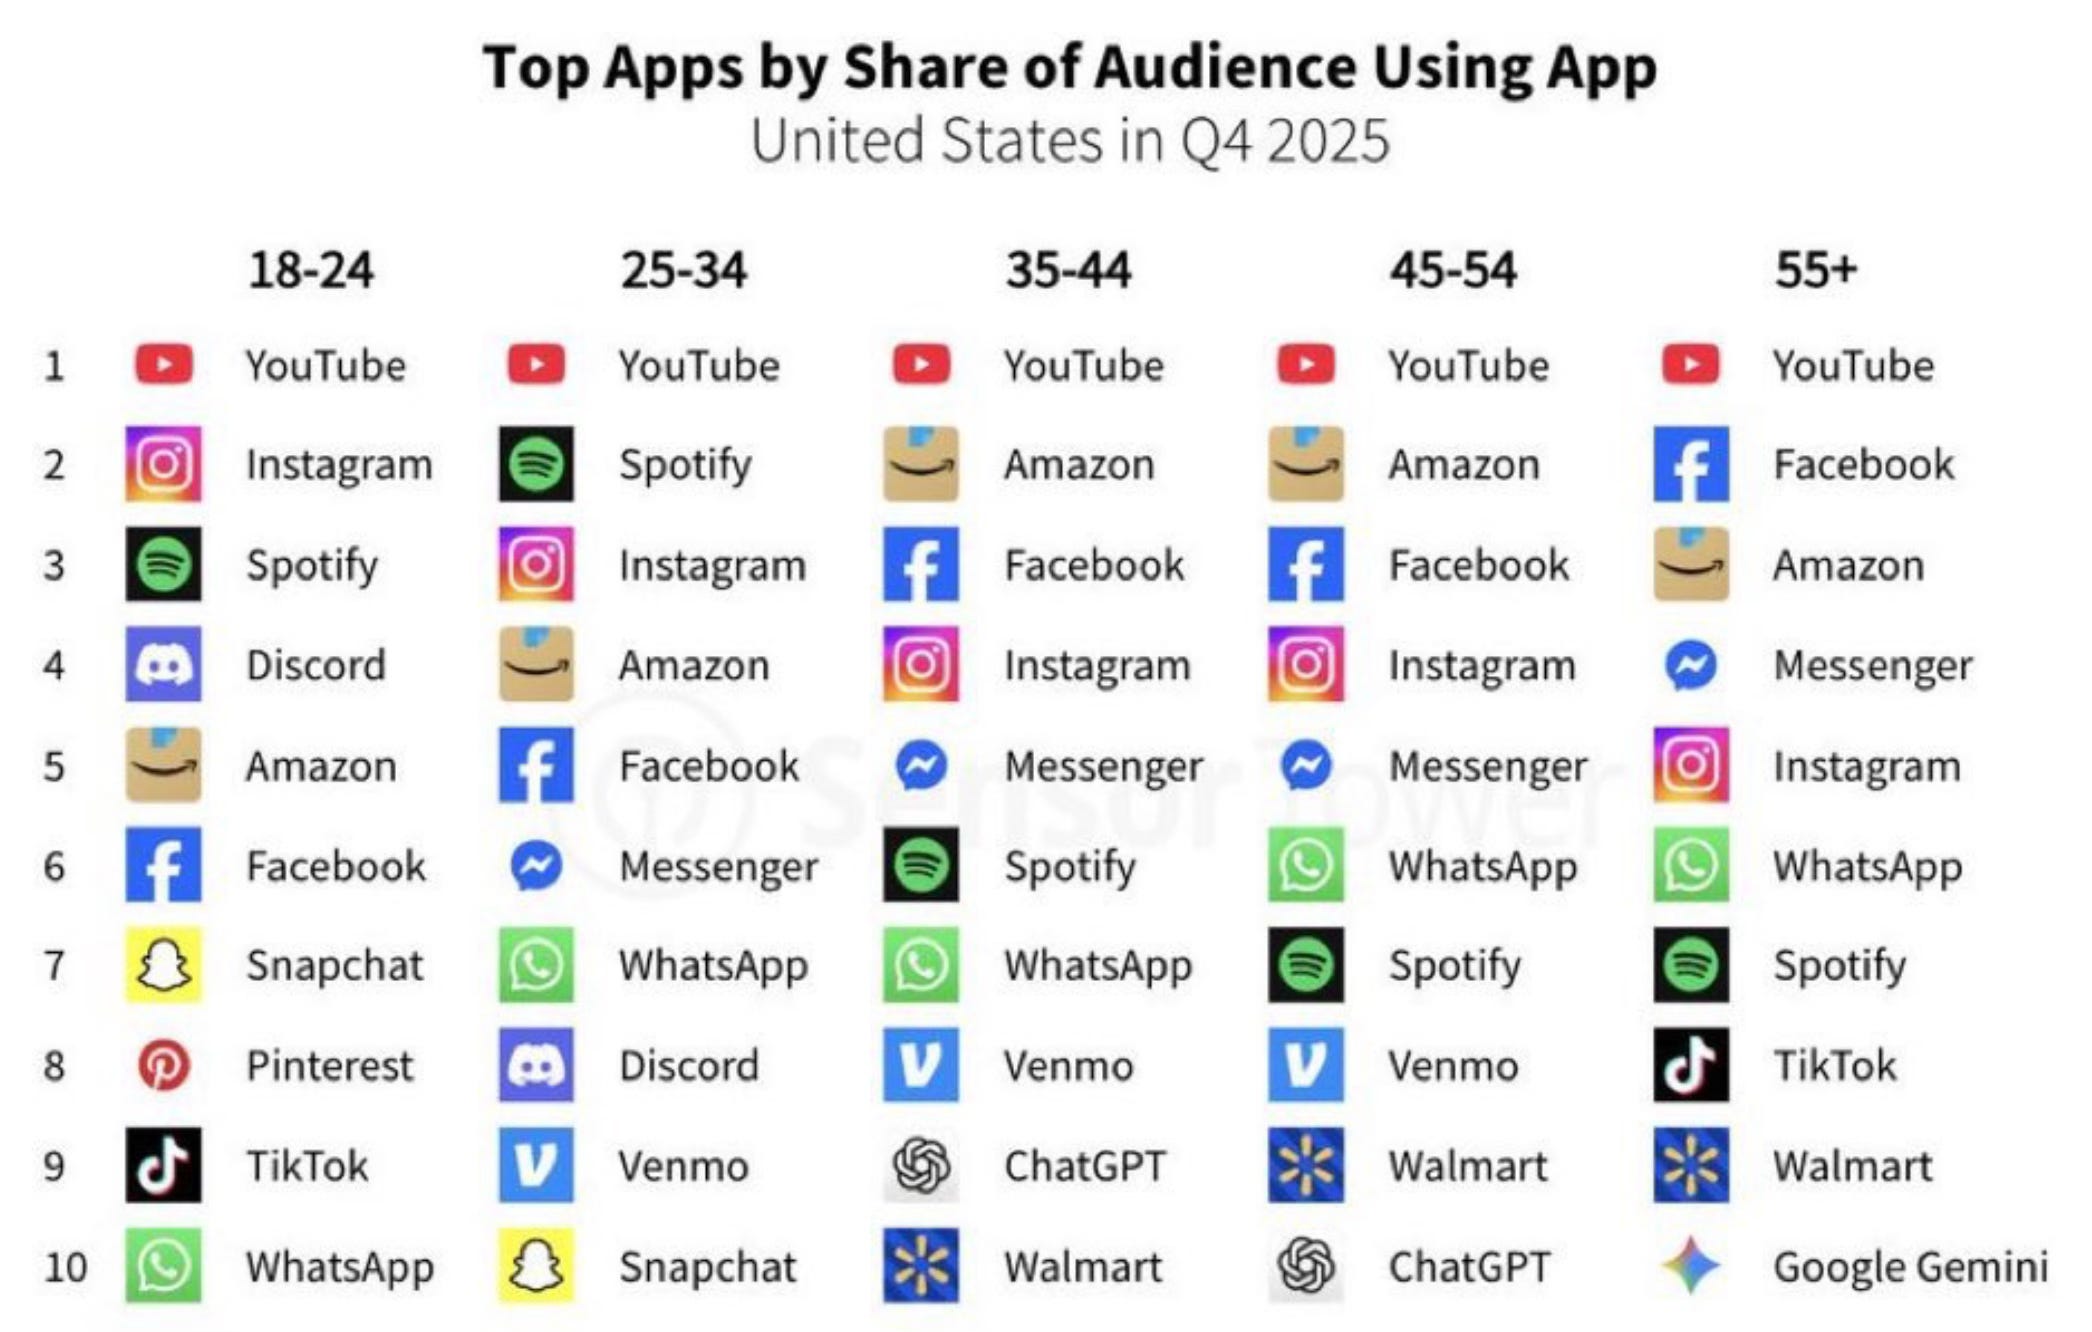
Why does big tech keep winning? This chart really says it all. From teenagers to retirees, the same names dominate attention and eyeballs.
Thank you for reading! If you enjoyed Spilled Coffee, please subscribe.
Spilled Coffee grows through word of mouth. Please consider sharing this post with someone who might appreciate it.