
Investing Update: A Summer Pause Or Plunge?
What I'm buying, selling & watching
What a week! This week started off with a rally, which sent the S&P 500 to the 38th all-time high of the 2024. That was Tuesday .
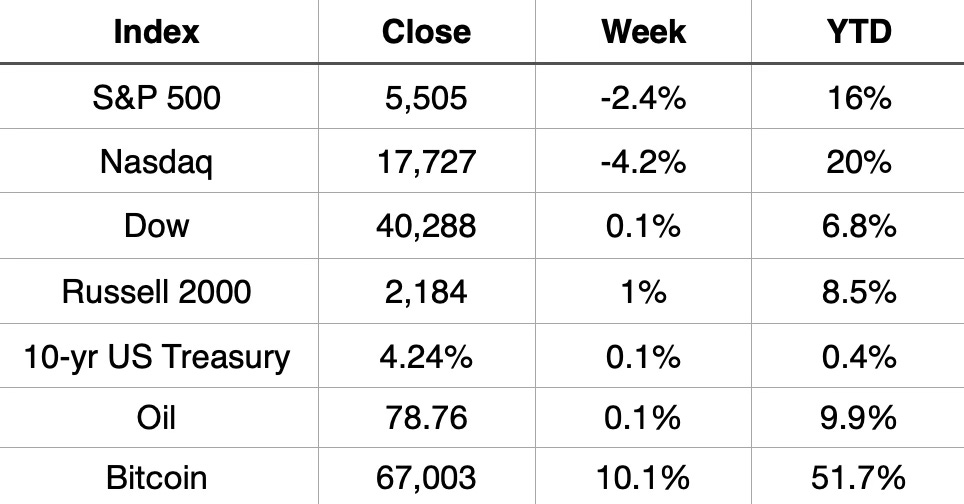
Things went downhill from there. Weakness was led by the tech sector. The Dow finished slightly higher but the S&P 500 finished the week down 2.42%.
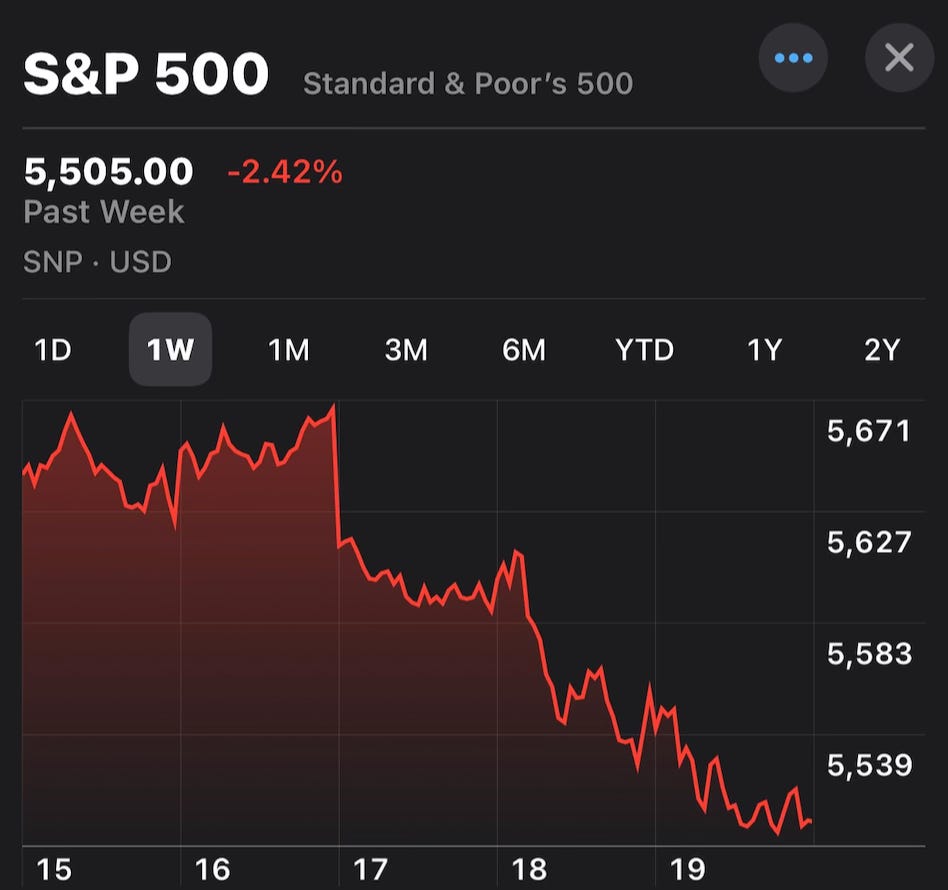
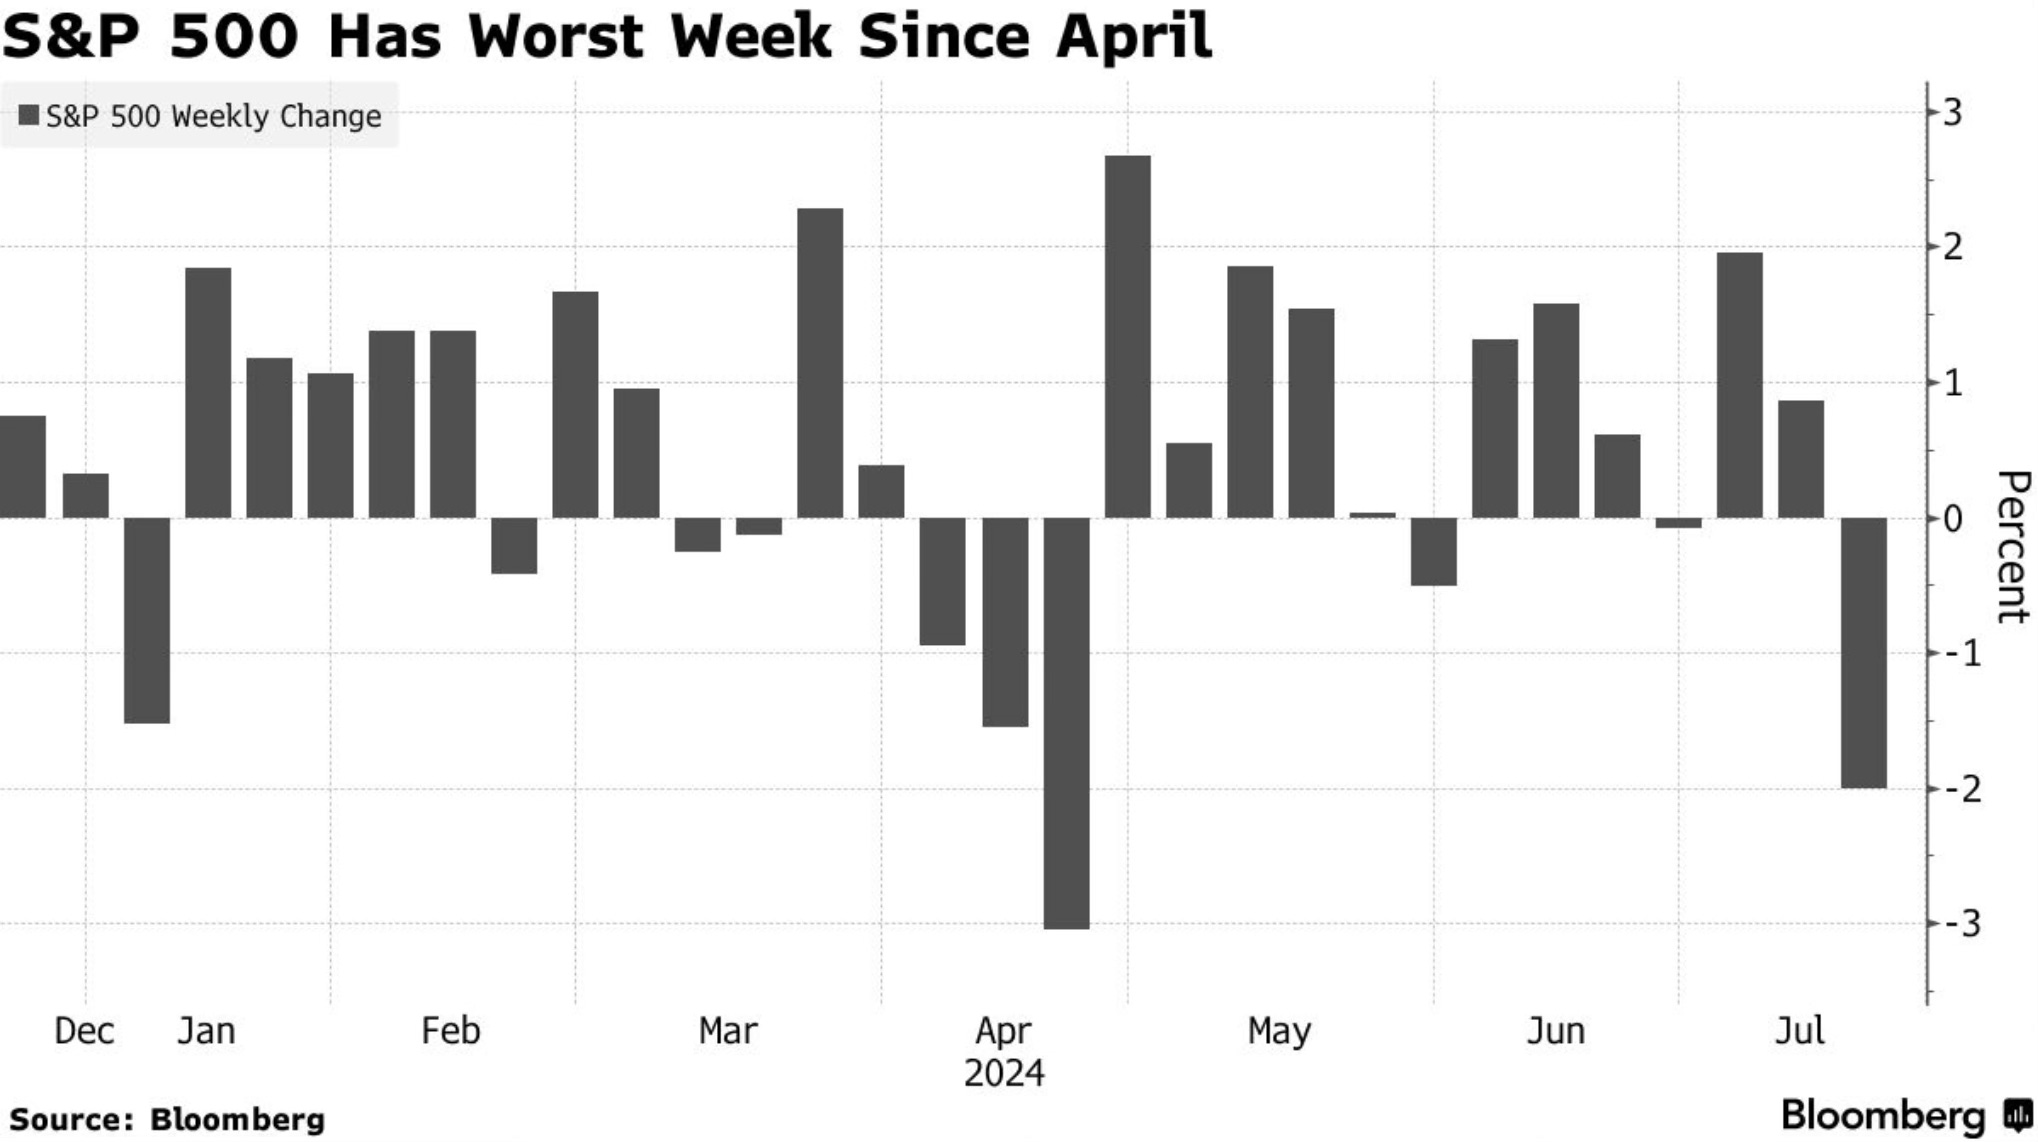
It was the worst week for the S&P 500 since April.
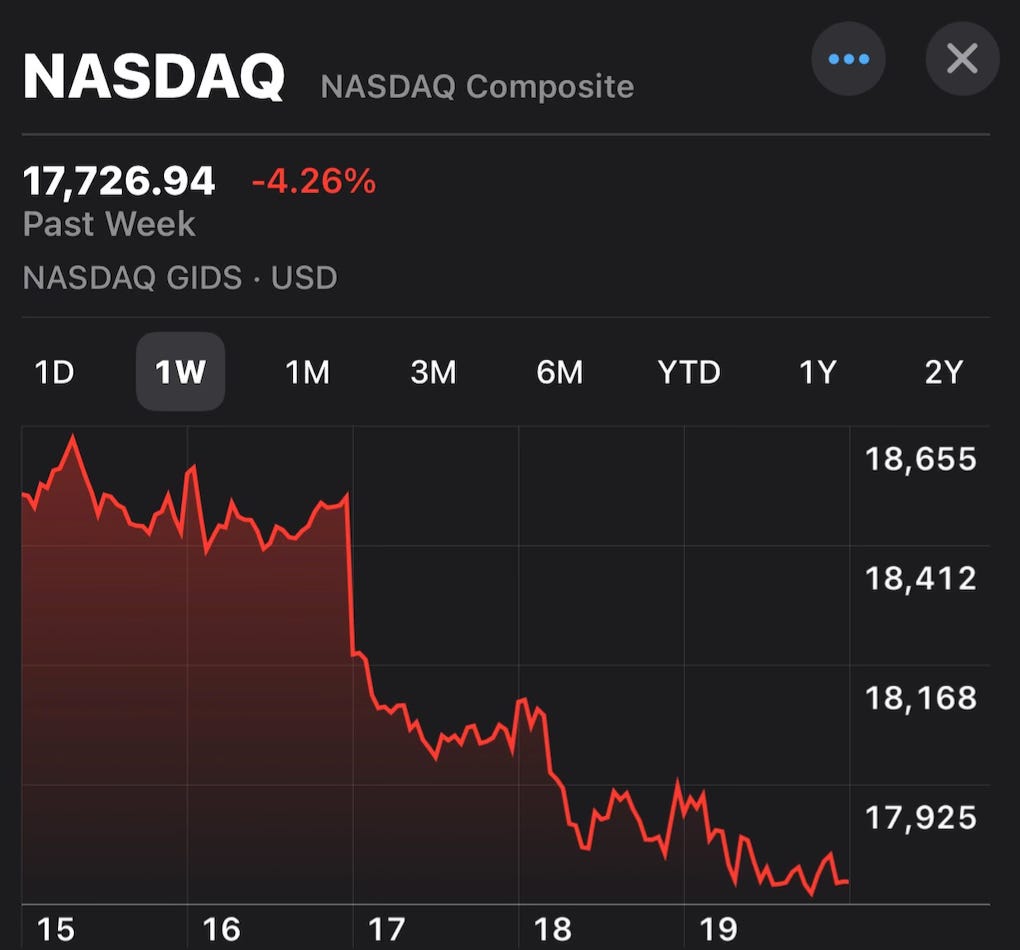
The Nasdaq finished the week down 4.26%. That snapped a six week winning streak.
Market Recap
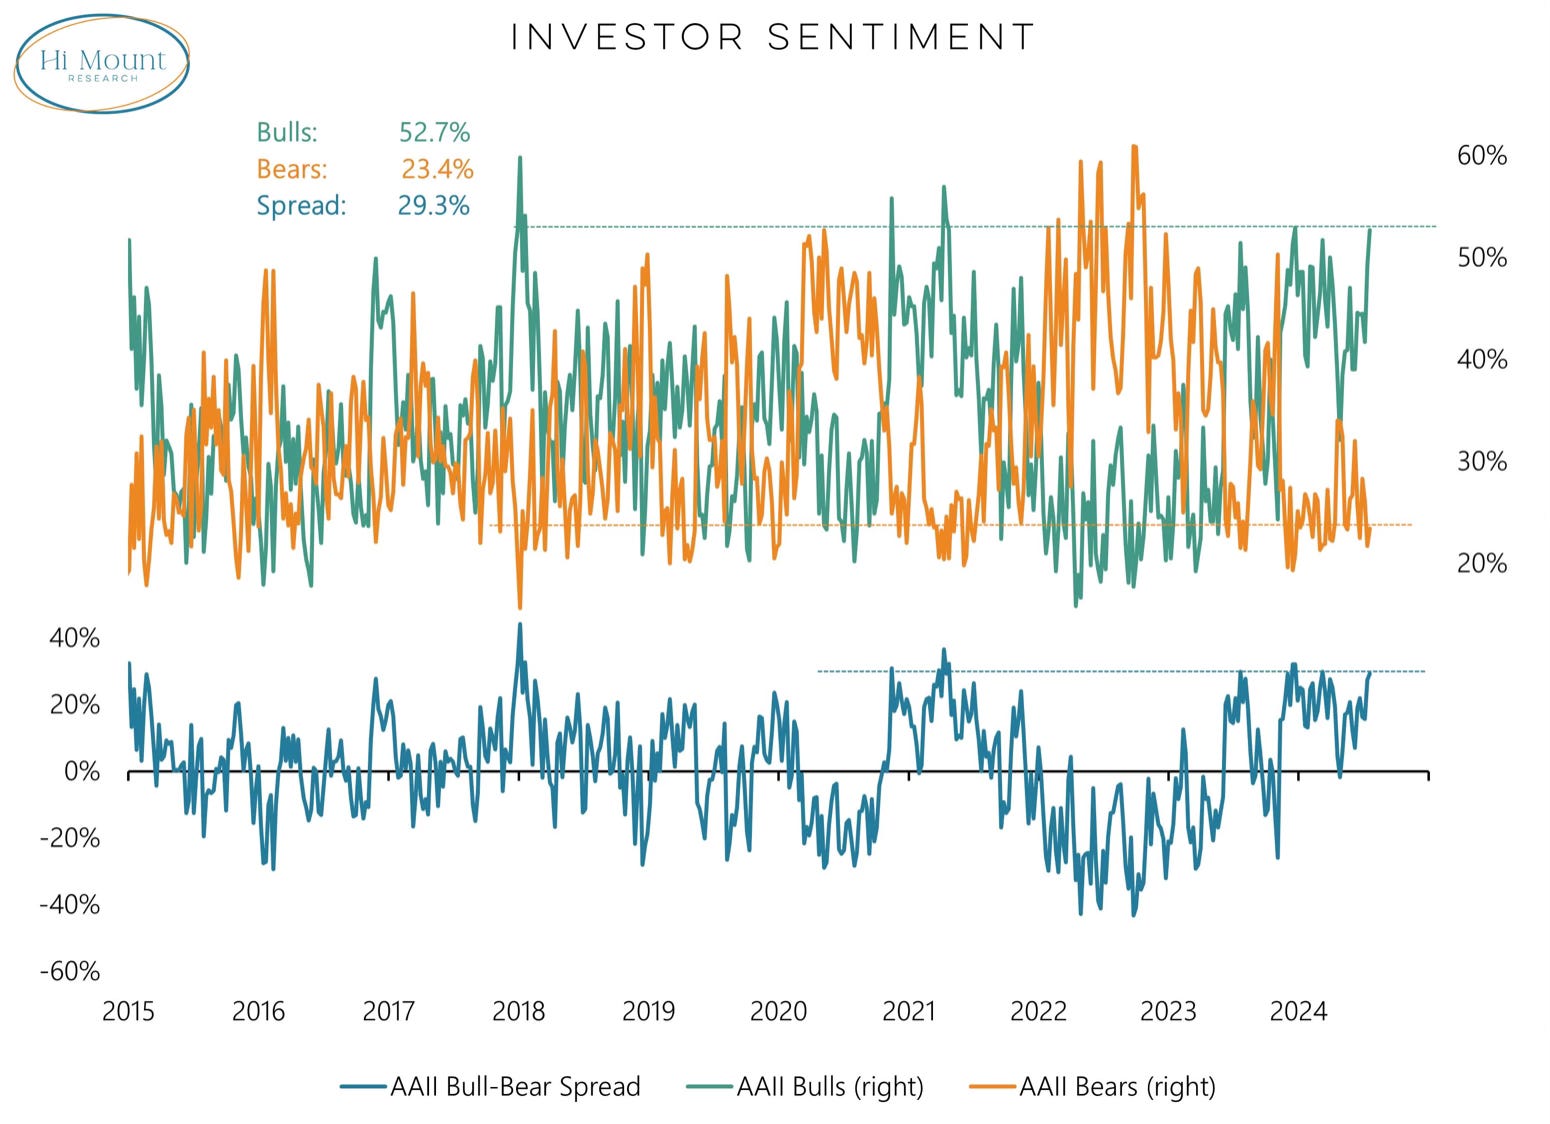
Even with a wild swing midweek, investor sentiment remains firmly bullish. 52.7% is the highest level of the year and 2nd highest level since 2021. Does this indicate that we are in a pause before more all-time highs? Quite possibly. Or could the market plunge down even farther? Also possible.
Historic Small-Cap Run
We just saw a historic run from small-caps. The Russell 2000 just had its best 5 day gain relative to the S&P 500 ever.
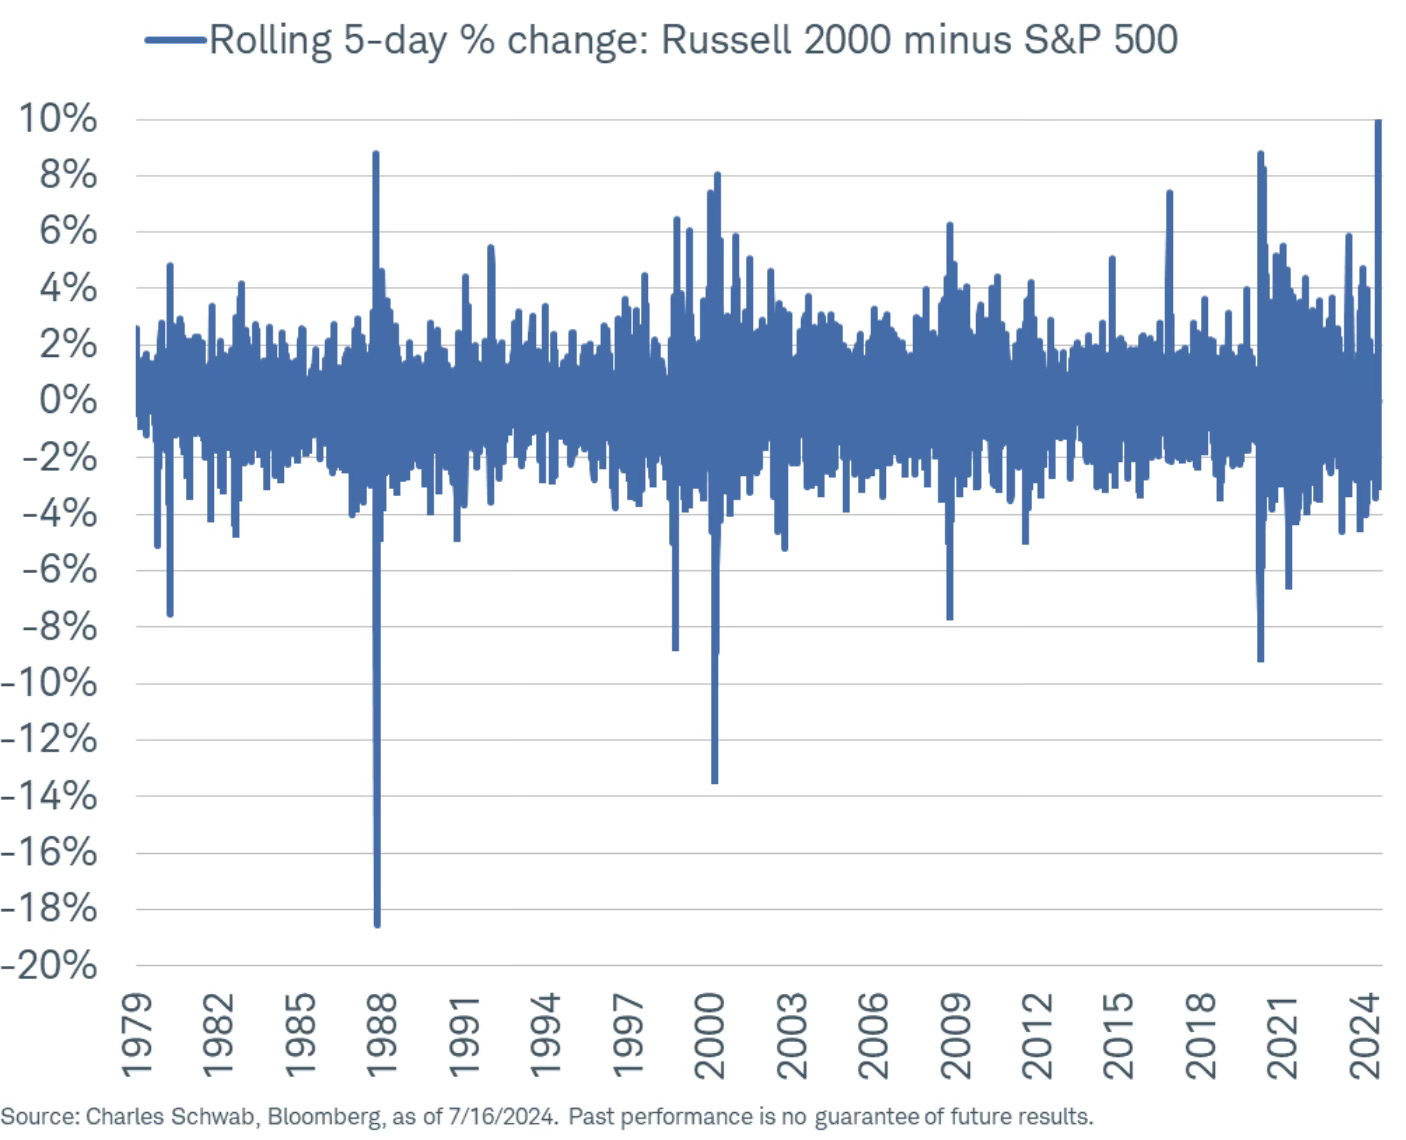
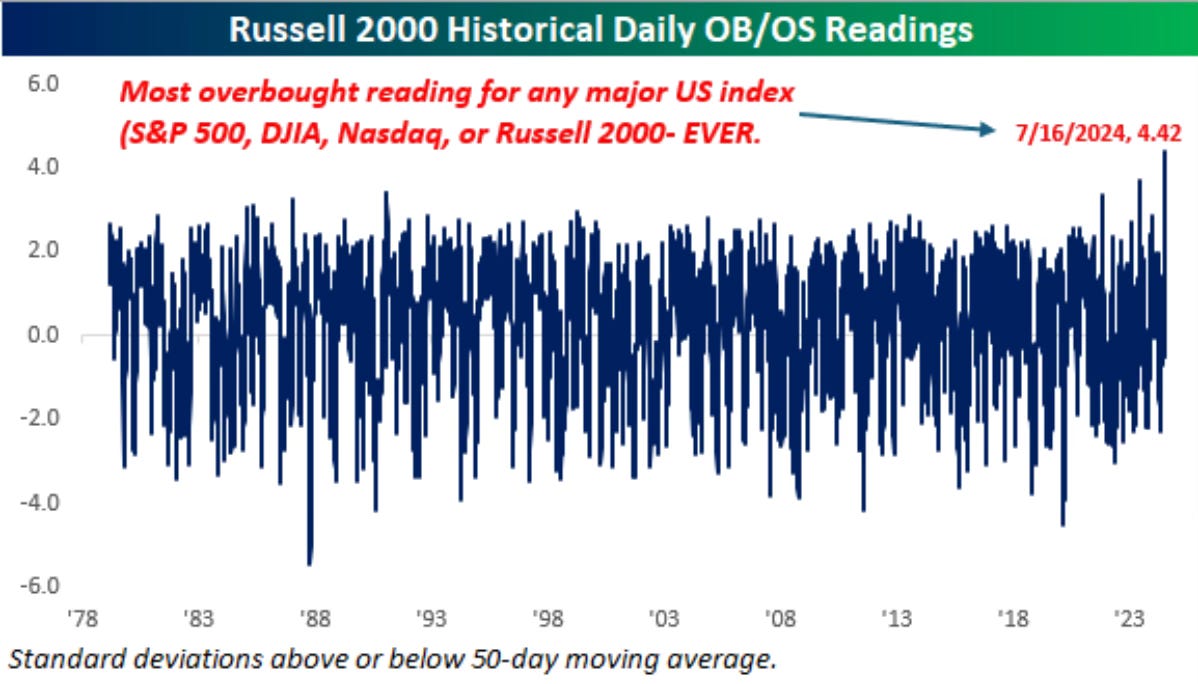
It gets even better. This is from Bespoke on just how unique this run was.
The Russell 2000 closed 4.4 standard deviations above its 50-day moving average. No other major US index (Dow since 1900, S&P 500 since 1928, and Nasdaq since 1971) has ever closed at that much of an extreme.
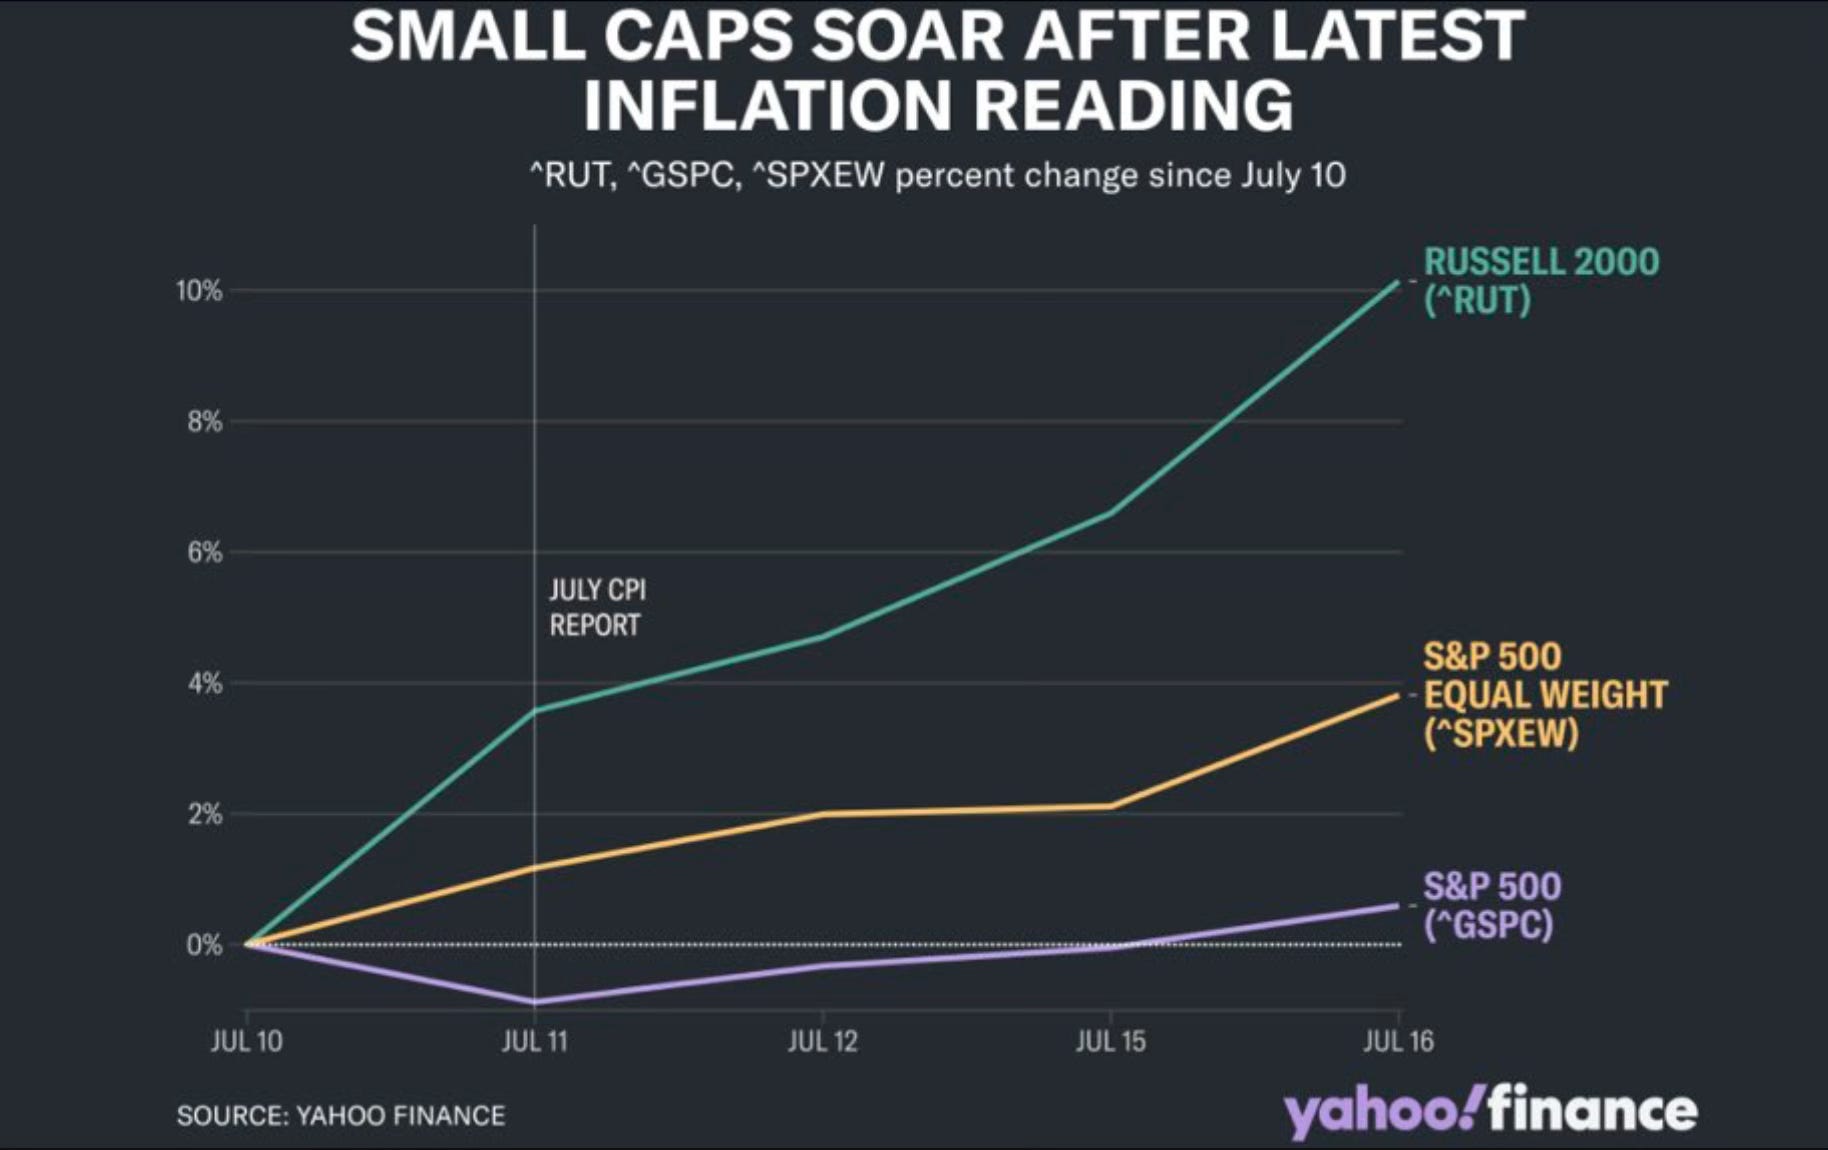
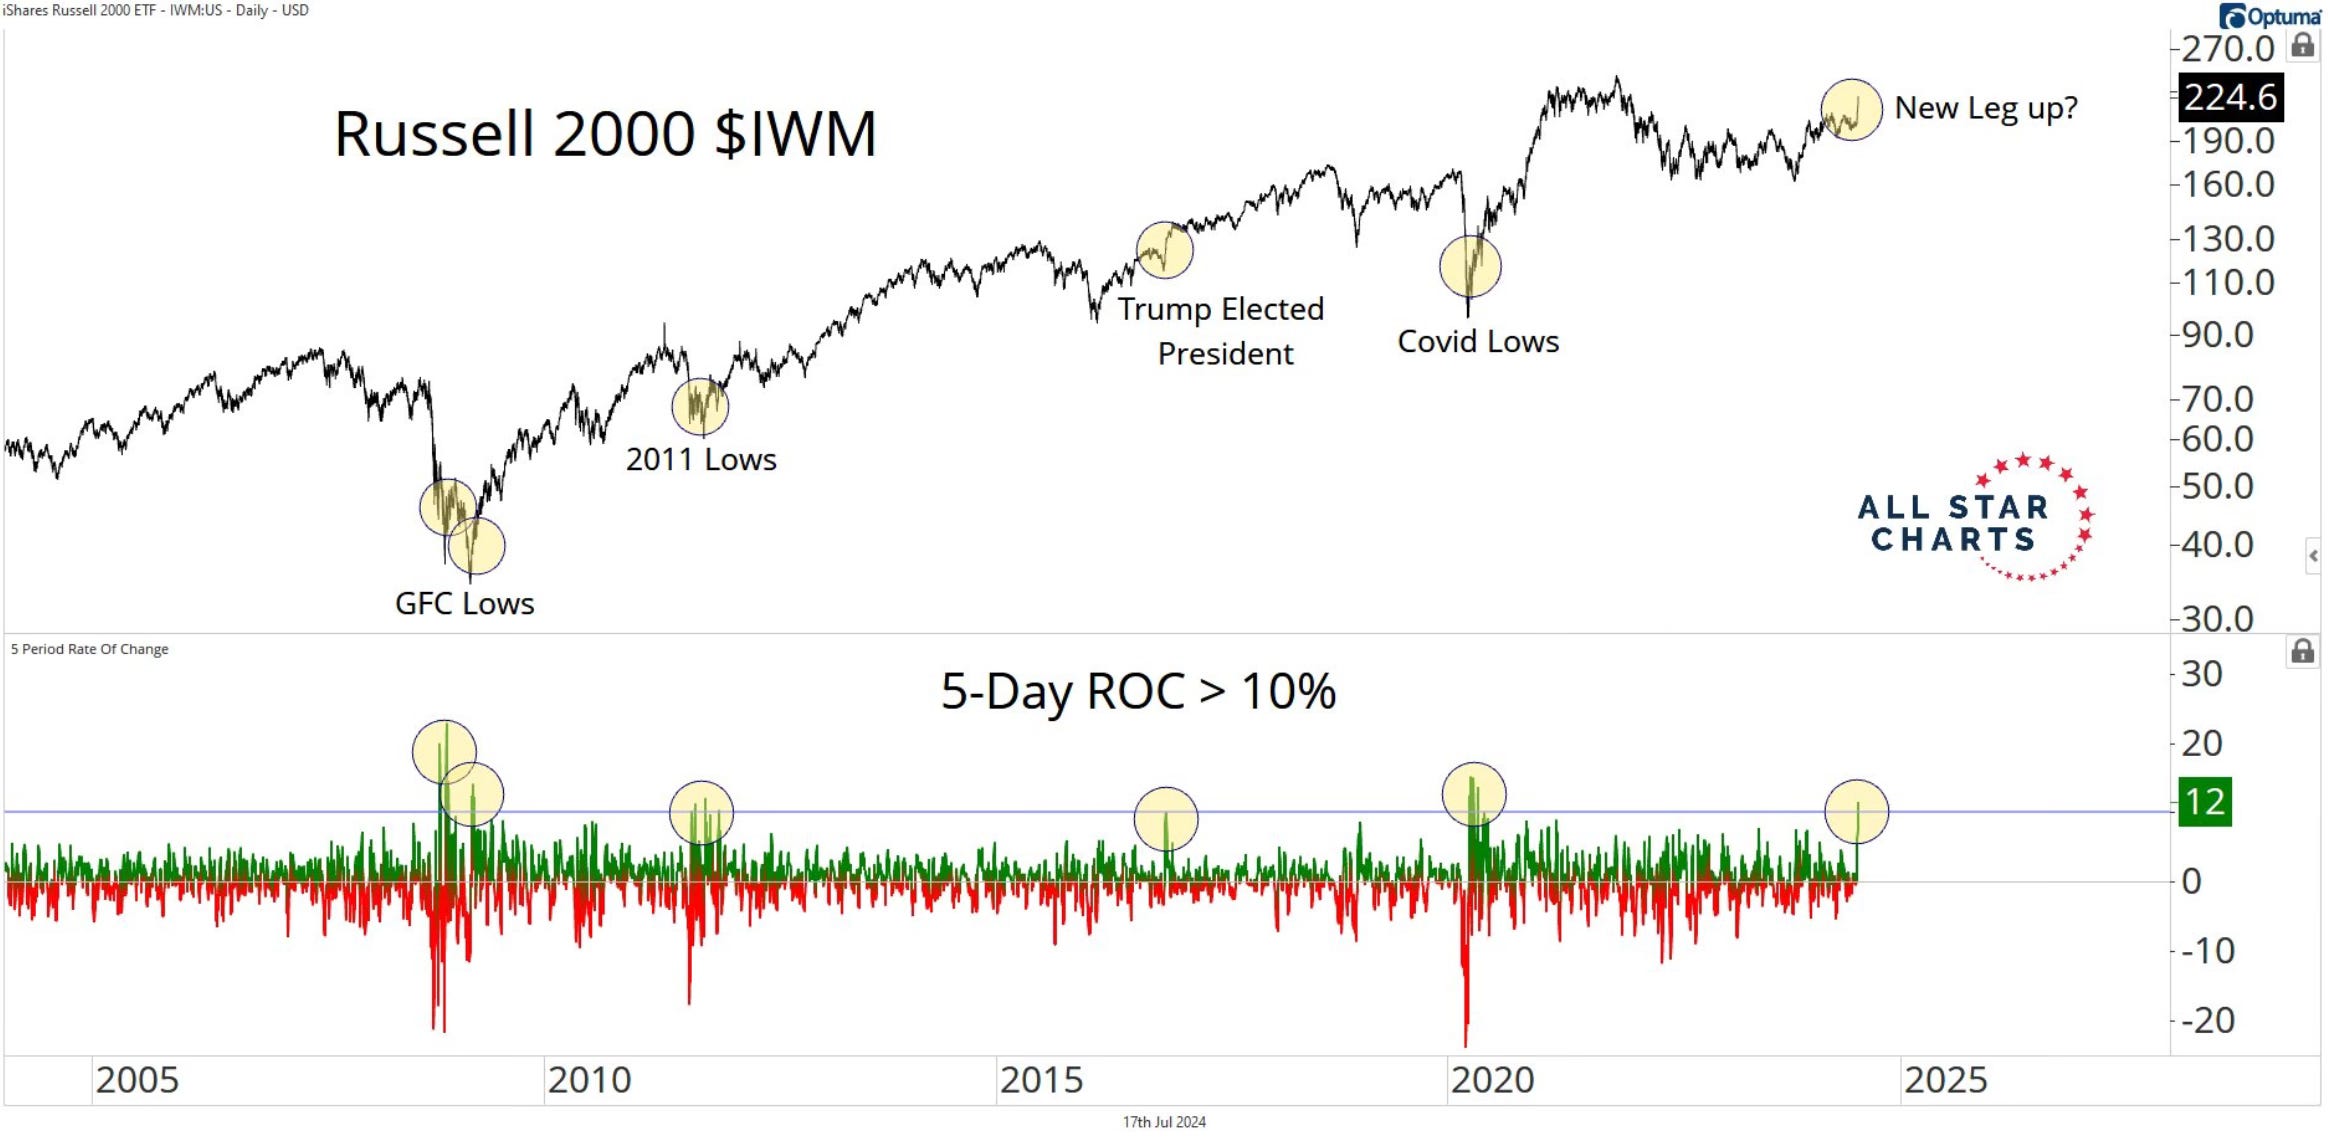
I had written multiple times how small-caps seemed like a coiled spring. They almost had to eventually move. They were up 11.5% in those 5 days following the inflation report. That much of a surge in small caps has only been seen 5 other times in the last 30 years. The LTCM crisis, dotcom bubble, great financial crisis, debt downgrade in 2011 and the pandemic.
If this is strictly a rotation, it would be quite the rotation. Alfonso Depablos points out this impressive momentum thrust and how we usually see these level of readings after significant bear market lows or early stages of a new bull run.
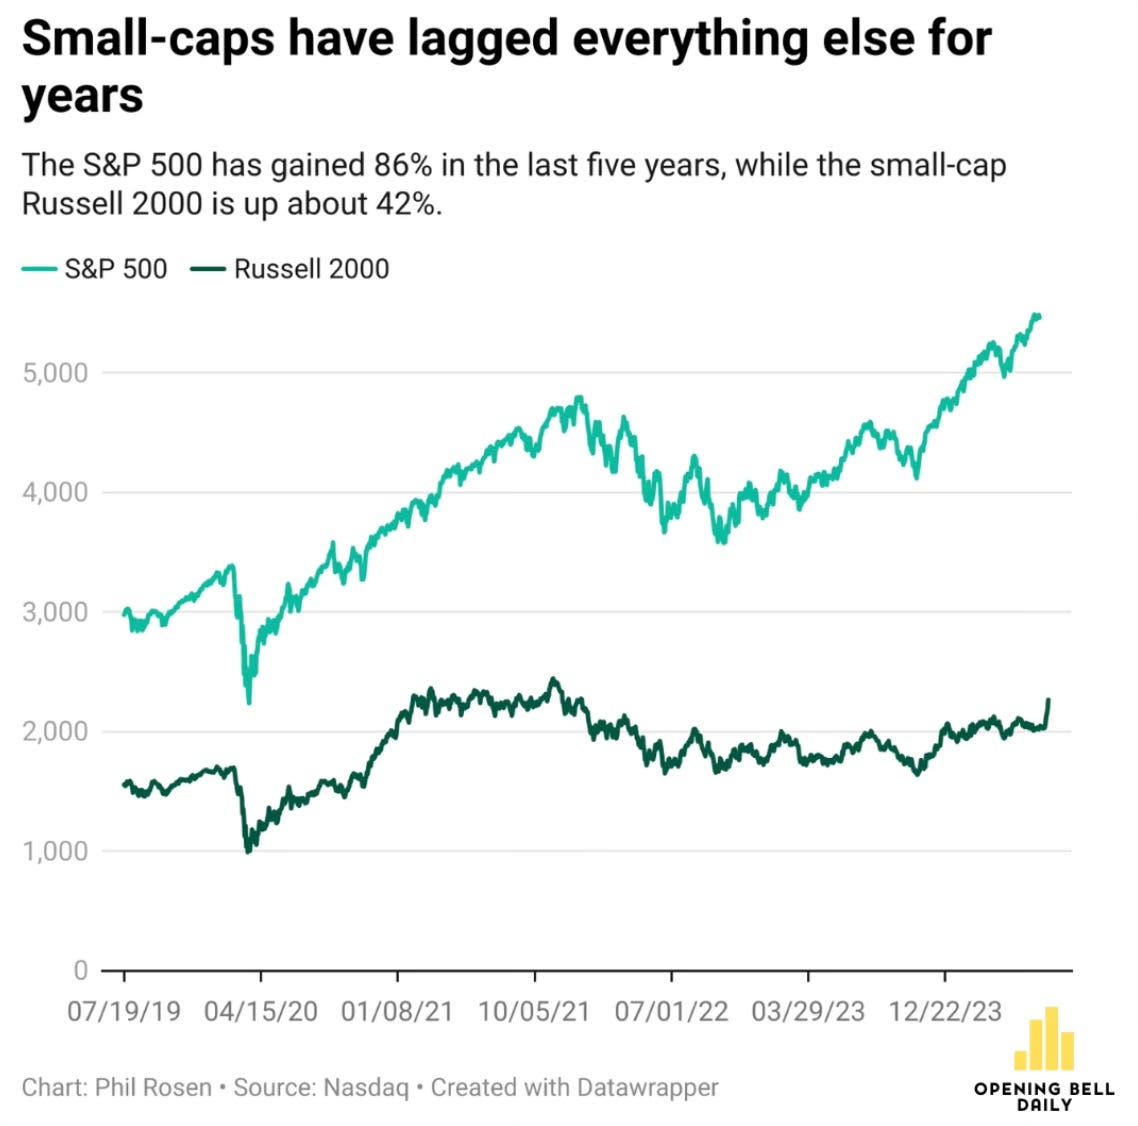
Now it does remain to be seen if small-caps can hang onto these gains. After all there is a reason that small-cap exposure is so low. It has historically not performed well at all. Over the past 5 years the S&P 500 is up 86% while the Russell 2000 is only up 42%.
A Summer Pause or Plunge?
Investors are really grappling with what exactly is going on in the stock market. Is this action due mainly to a rotation, will new leadership now lead the market, is a growth to value shift underway, a reaction to rate cuts, assumptions on a new president or something else?
This all leads to if this is just a pause with more all-time highs to come, or does the market plunge lower from here? It’s a great question that we have to ponder.
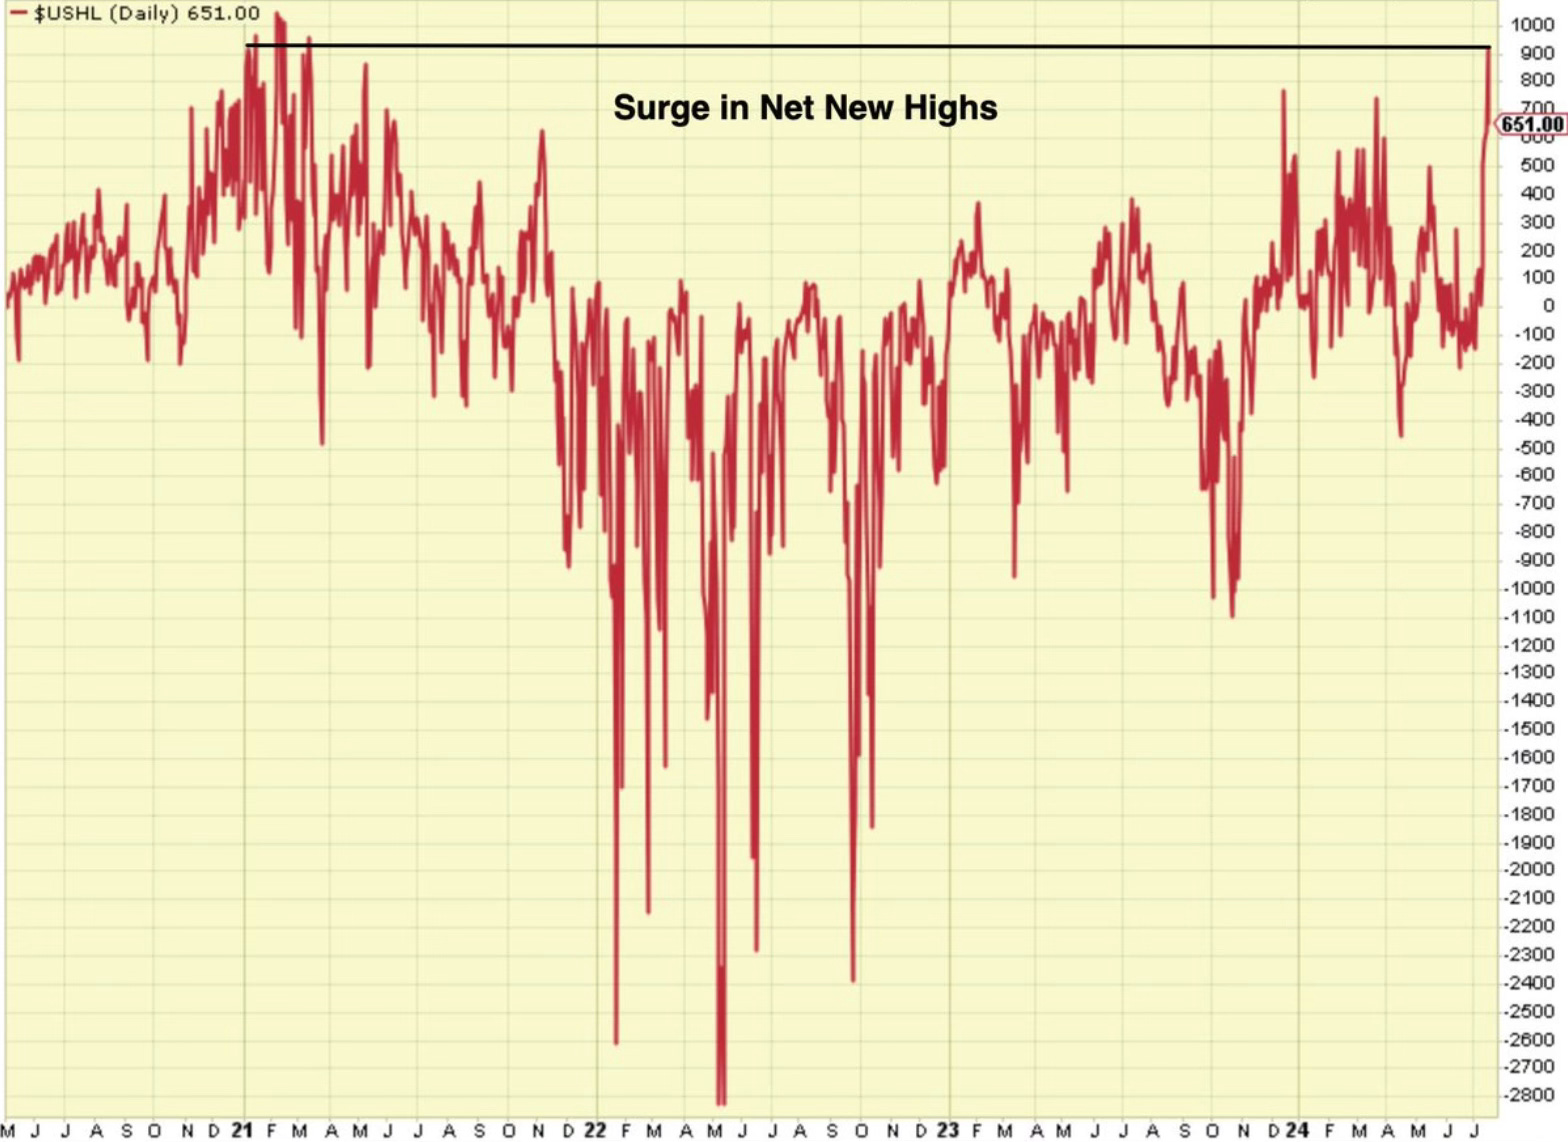
Maybe one of the most bullish signs still is the surge in the total stock market net new highs. The level of new highs is at the highest level since December 2020.
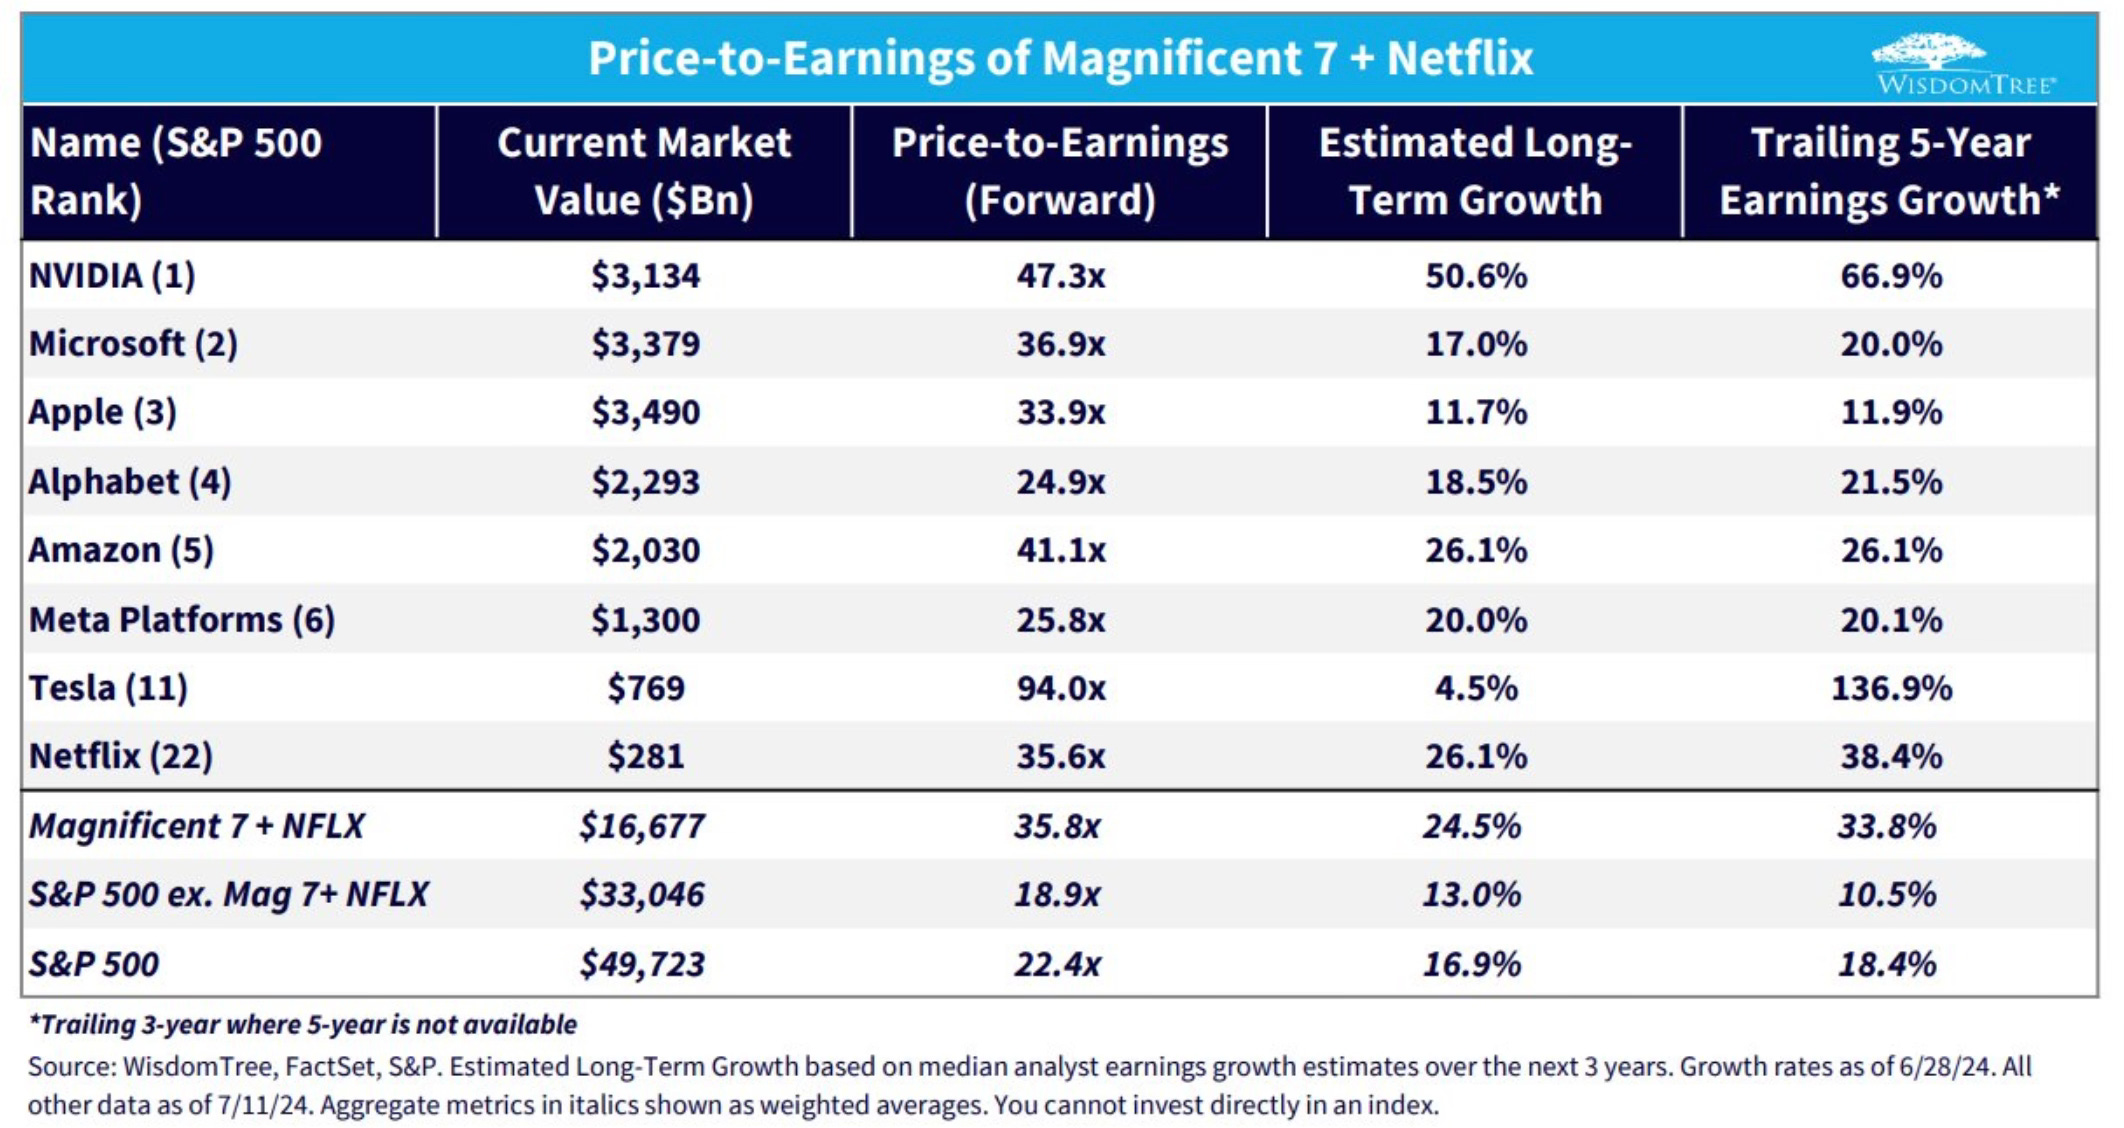
The 10 largest stocks which have been the market leaders, have had a rough go since the inflation reading. Over the last week they’re down an average of 5.6%.
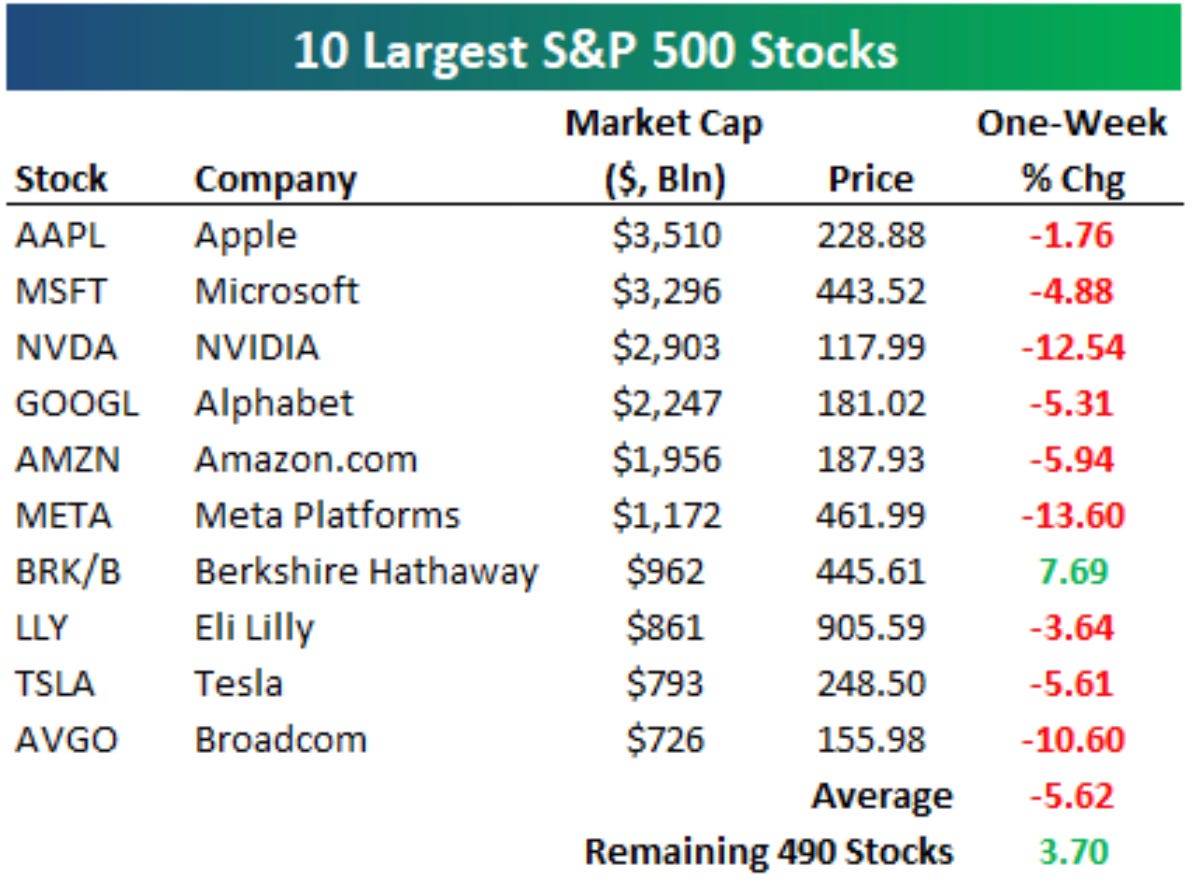
If this is a pause, then these are the names that investors will want to have exposure to going ahead. Of the Mag 8 stocks, which do you like best from these valuation levels? Nvidia obviously still sticks out. I also really like Alphabet and Amazon a lot moving forward.
Plus I’m still of the belief that there has to be some signs of a reason for the overall market to take a big leg lower. A pullback of 5% is normal. It’s healthy and expected a few times each year. Finding data to support any market plunge or crash just still isn’t present.
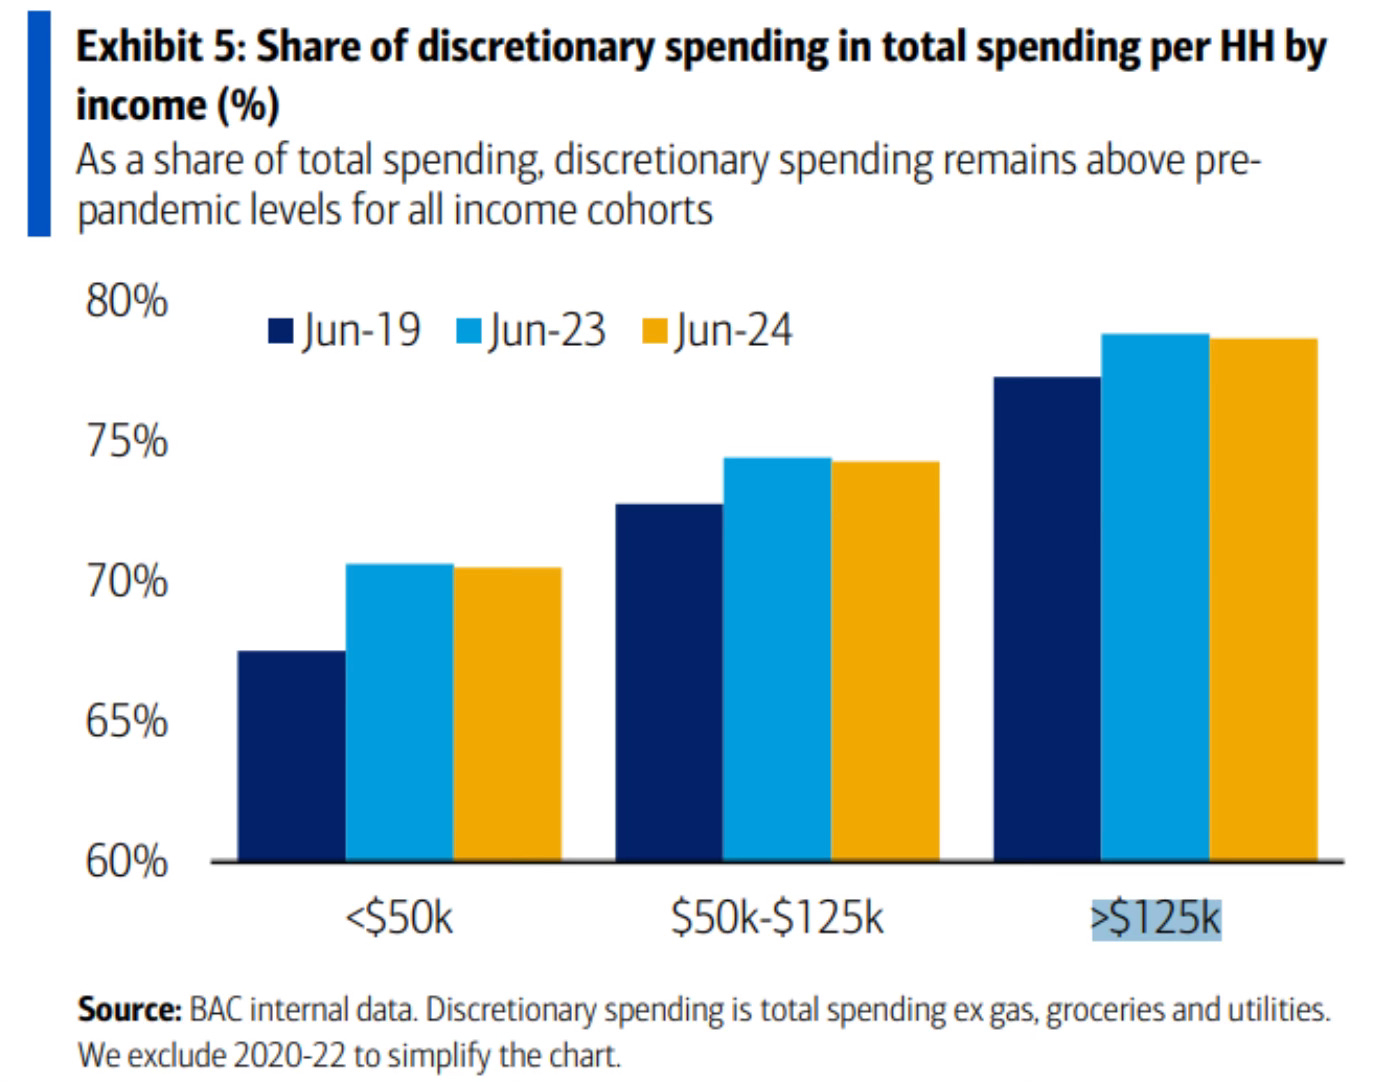
Spending still remains strong. Discretionary spending continues to be above prepandemic levels and that’s across all income cohorts.
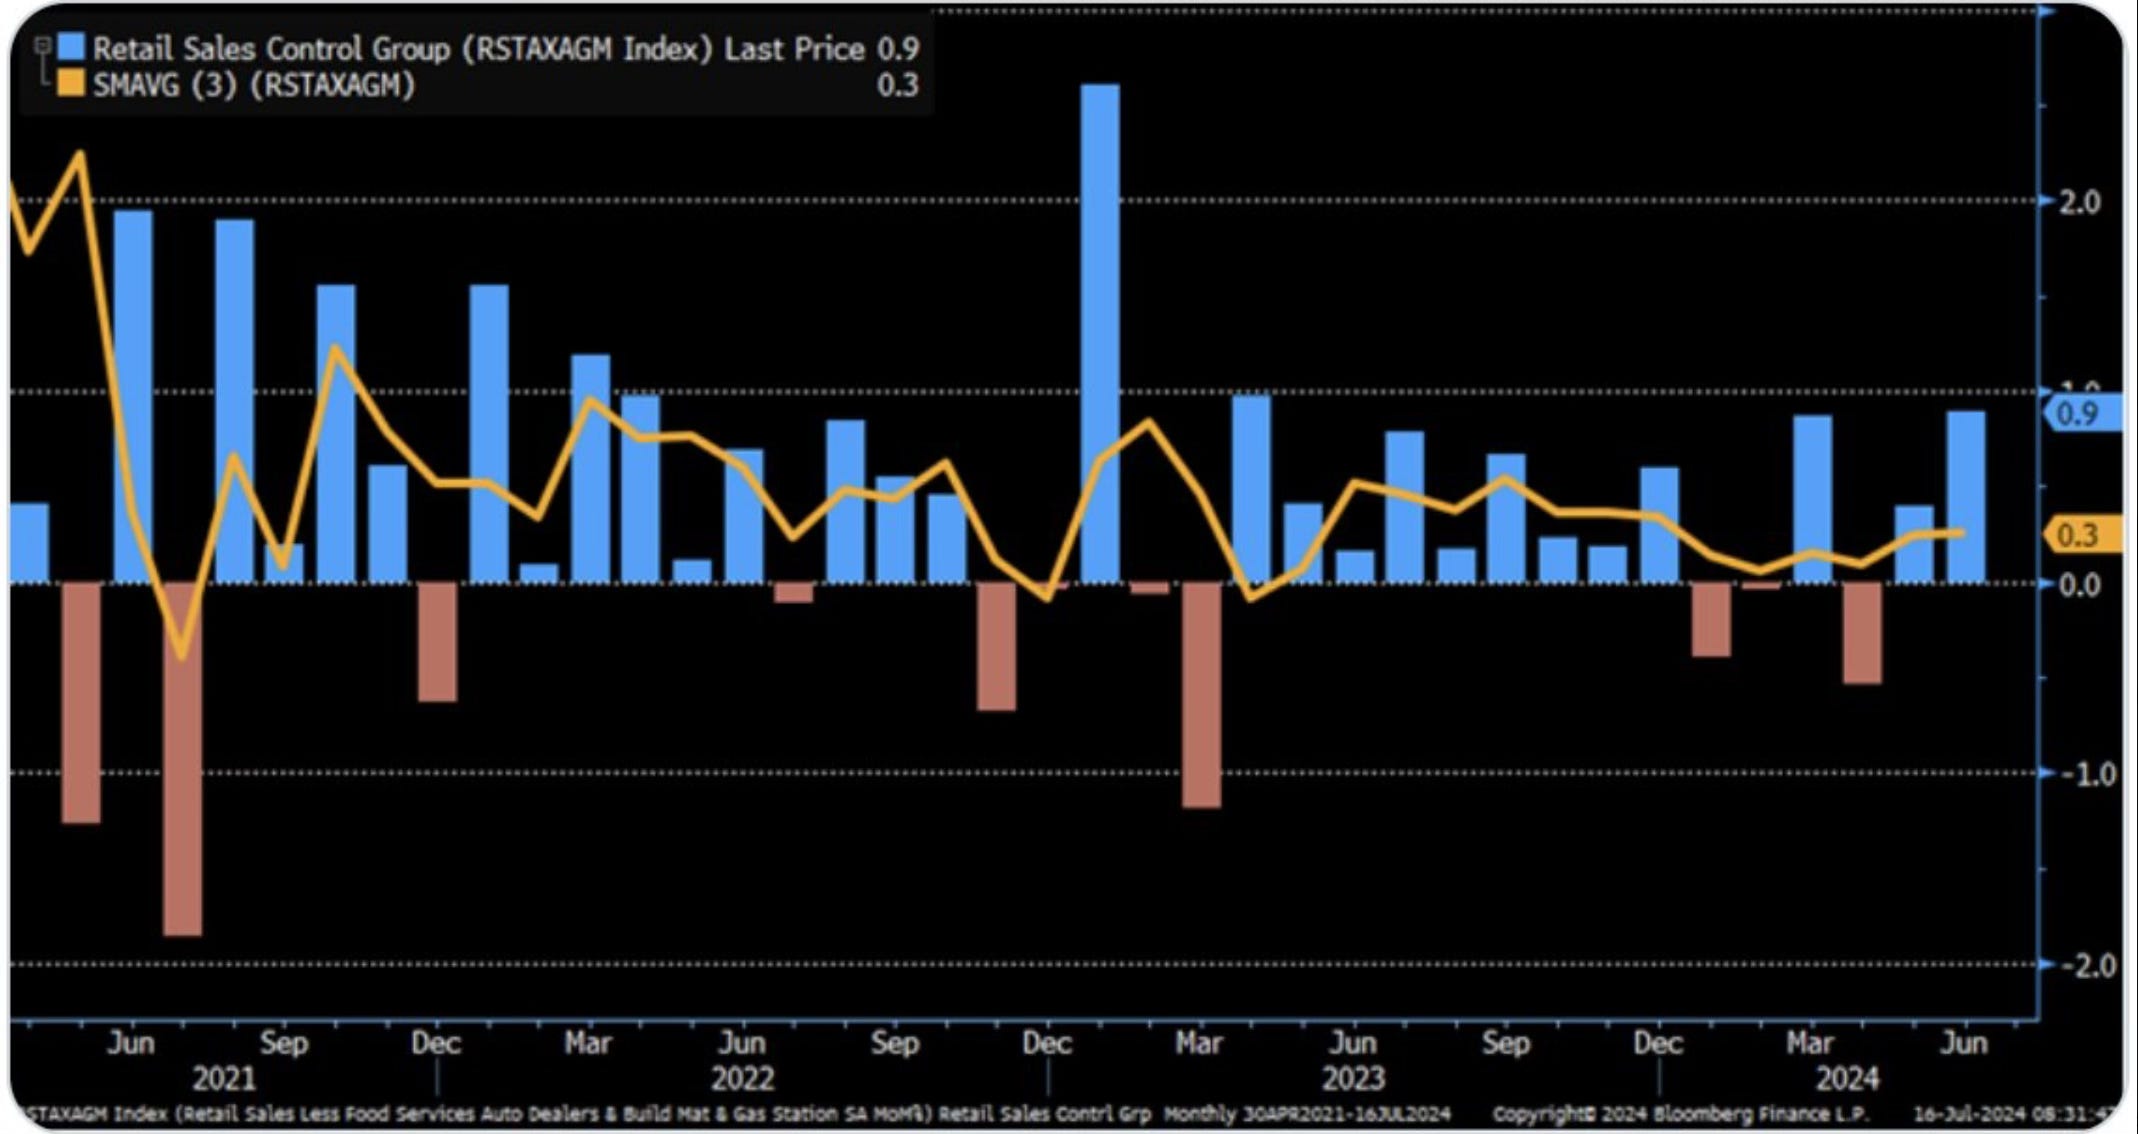
The retail sales control group gained 0.9% in June. That’s the strongest monthly performance in almost a year. We continue to hear how the consumer is weakening but I’m still not seeing it. The data is telling us otherwise.
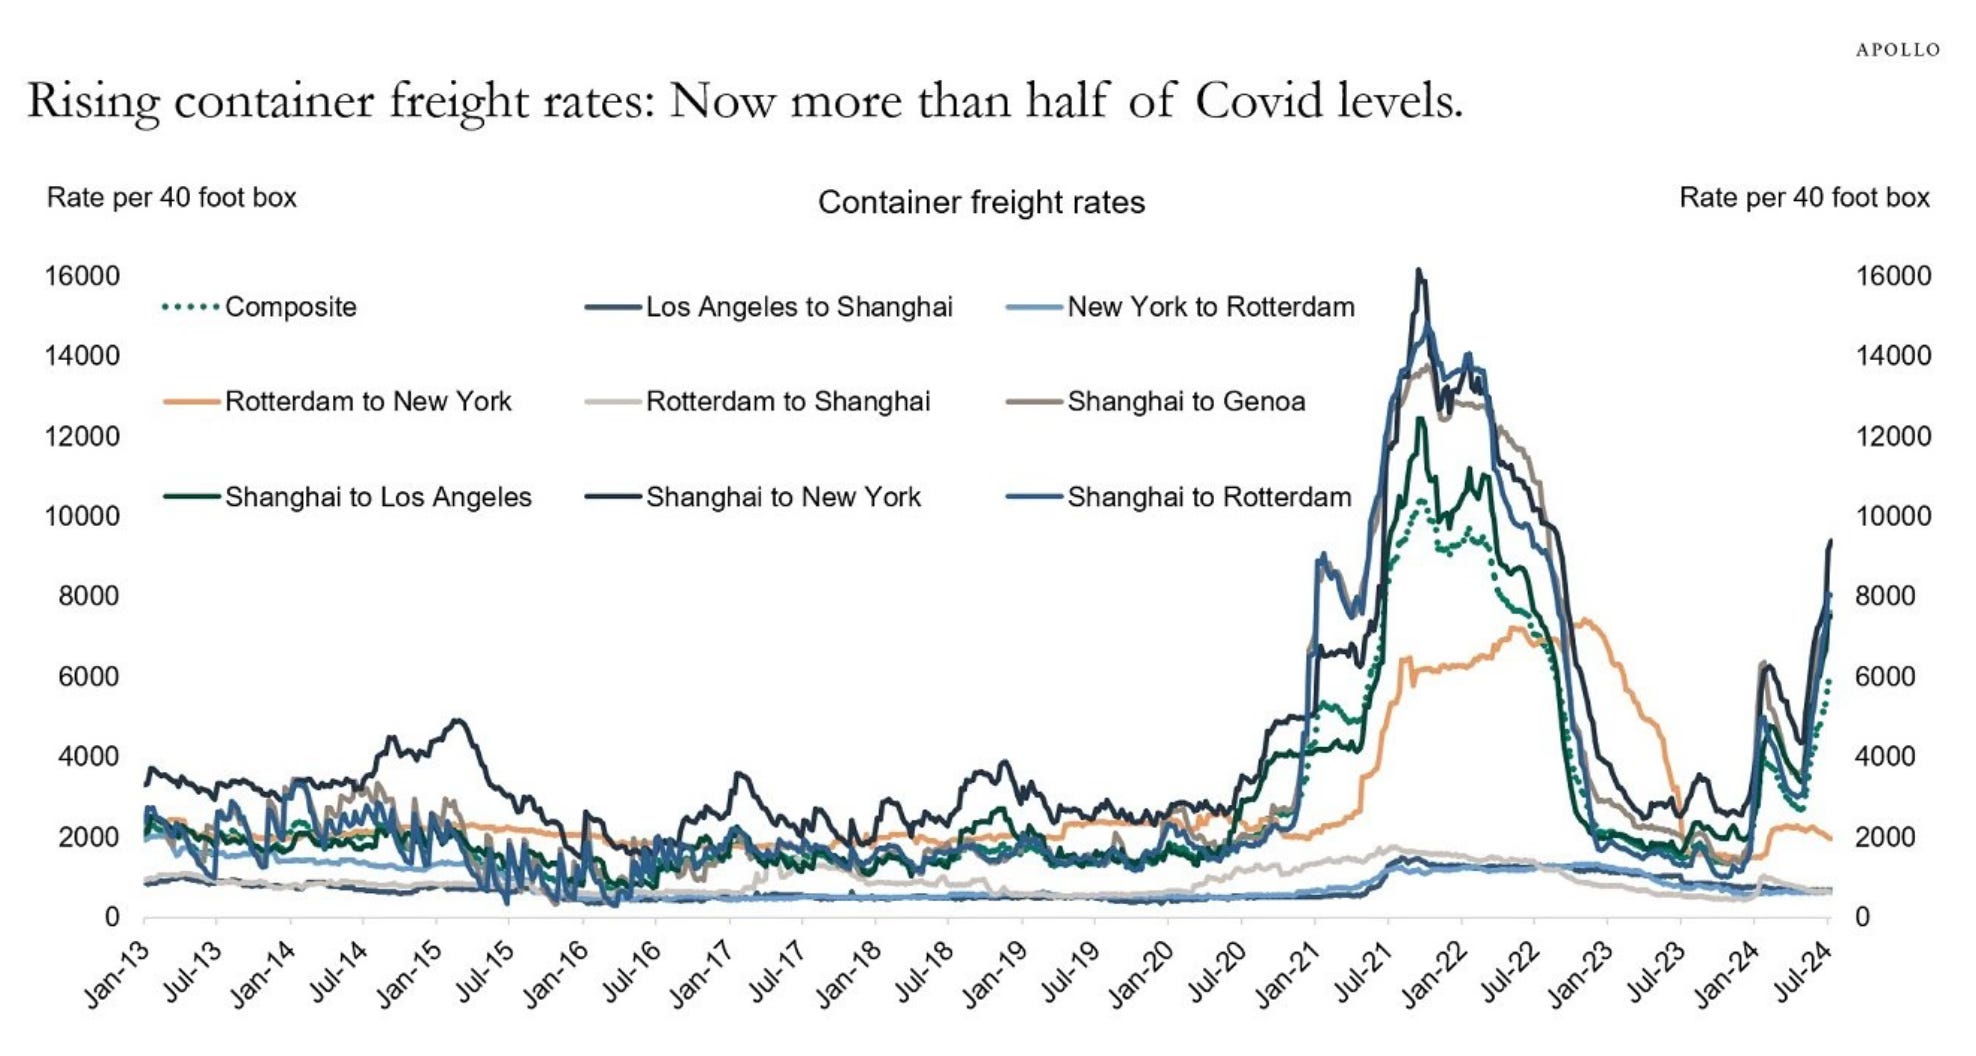
Then we have this from Torsten Slok at Apollo on container freights which are starting to climb higher.
If the global economy was slowing down rapidly, then all transportation costs would be falling. That is not what we are seeing, which suggests that global growth continues to be fine.
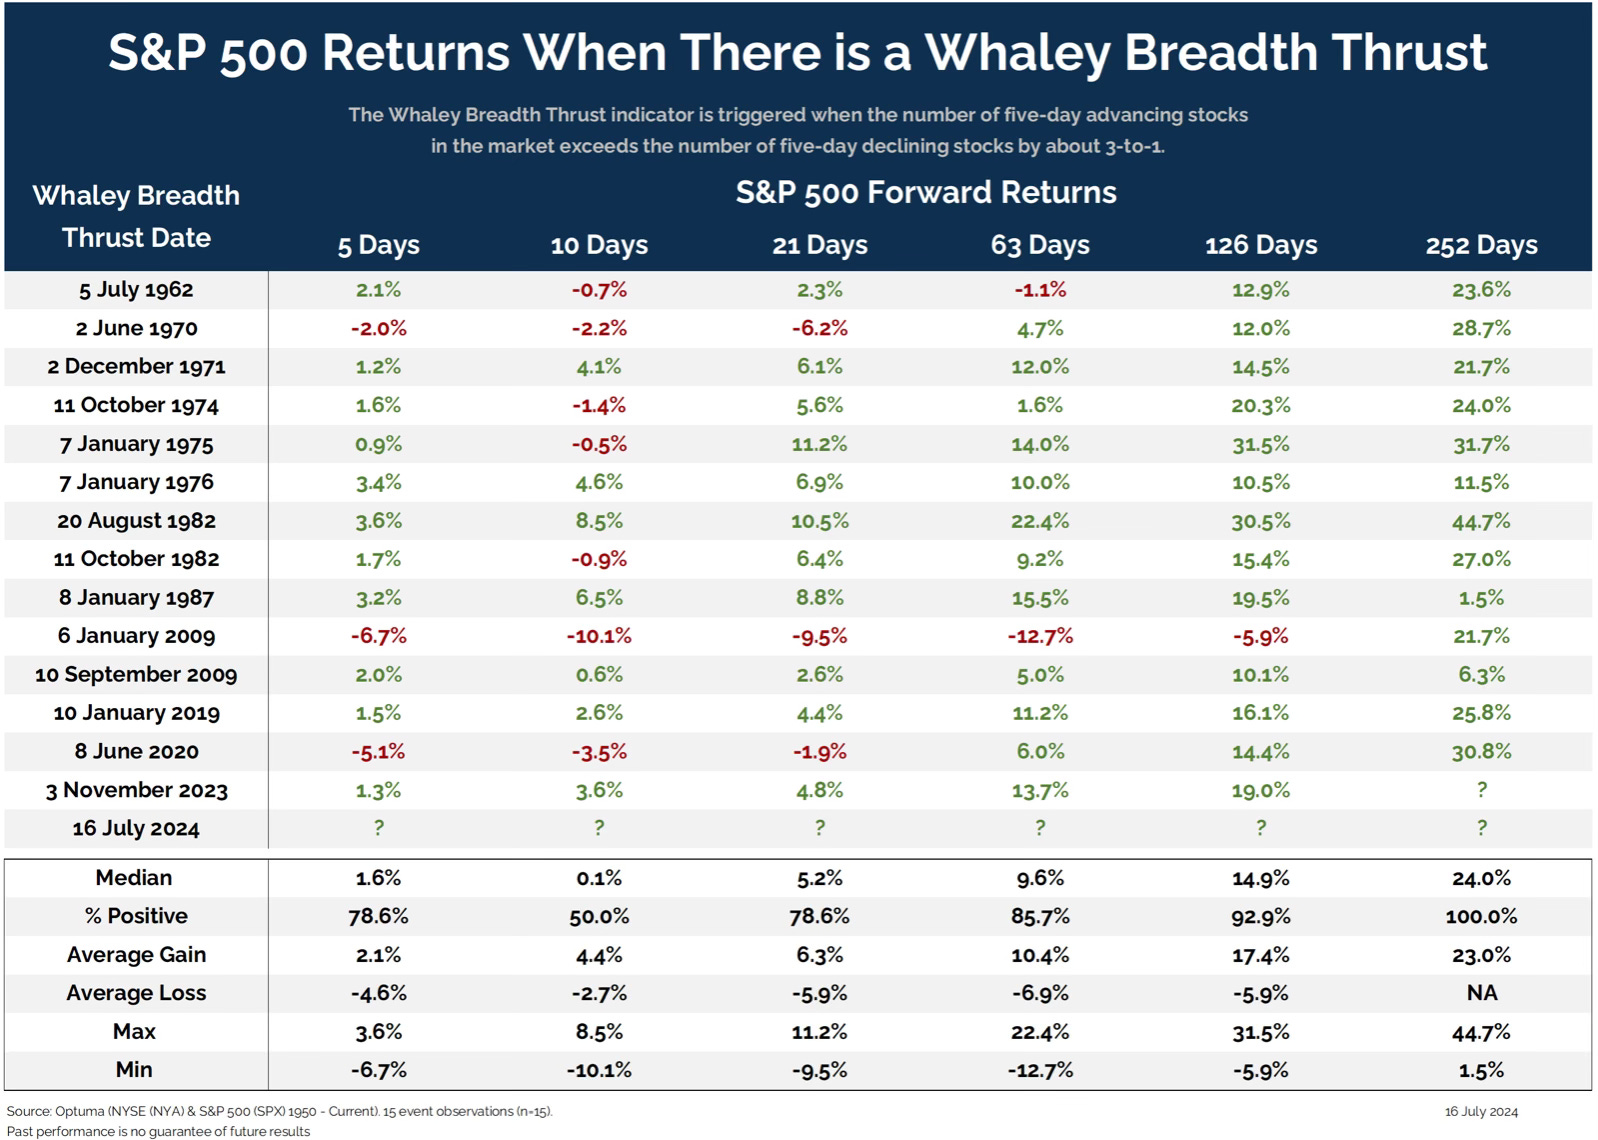
The technical indicator called the Whaley Breadth Thrust was just triggered. I think this went a little under the radar with all the news this week. Grant Hawkridge explains what The Whaley Breadth Thrust is.
The Whaley Breadth Thrust indicator is triggered when the number of five-day advancing stocks in the market exceeds the number of five-day declining stocks by about 3-to-1.
What sticks out to me is the results that the S&P 500 has after the Whaley Breadth Thrust triggers. There is very little red in the very short term or even many month out. Just a lot of green!
A pullback could be underway. Do keep in mind that a 5% pullback only bring us back to the May levels. Even if the market goes back 10%, that takes us back to the lows in April. A plunge just doesn’t seem to fit. Unless some black swan type event unfolds. No data or findings yet in the stock market or economy supports the plunge or crash narrative, other than the constant fearmongers who scream crash everyday the stock market finishes red.
The speed and velocity of this small-cap surge leads me to believe that there is no expectation of a recession in the coming year. That has been pushed out even farther. This will prove to be a pause where we see a further broadening and not so much of a rotation. The Mag 7 and mega-cap tech stocks which have been the leaders, will continue to be the leaders.
This next leg of the bull market will have even wider participation and we will see more all-time highs in the 2nd half. Think of the stock market as a car. It just stopped at the gas station to fuel up. What has been transpiring the past two weeks is adding fuel for this bull market.
Volatility Is Expected
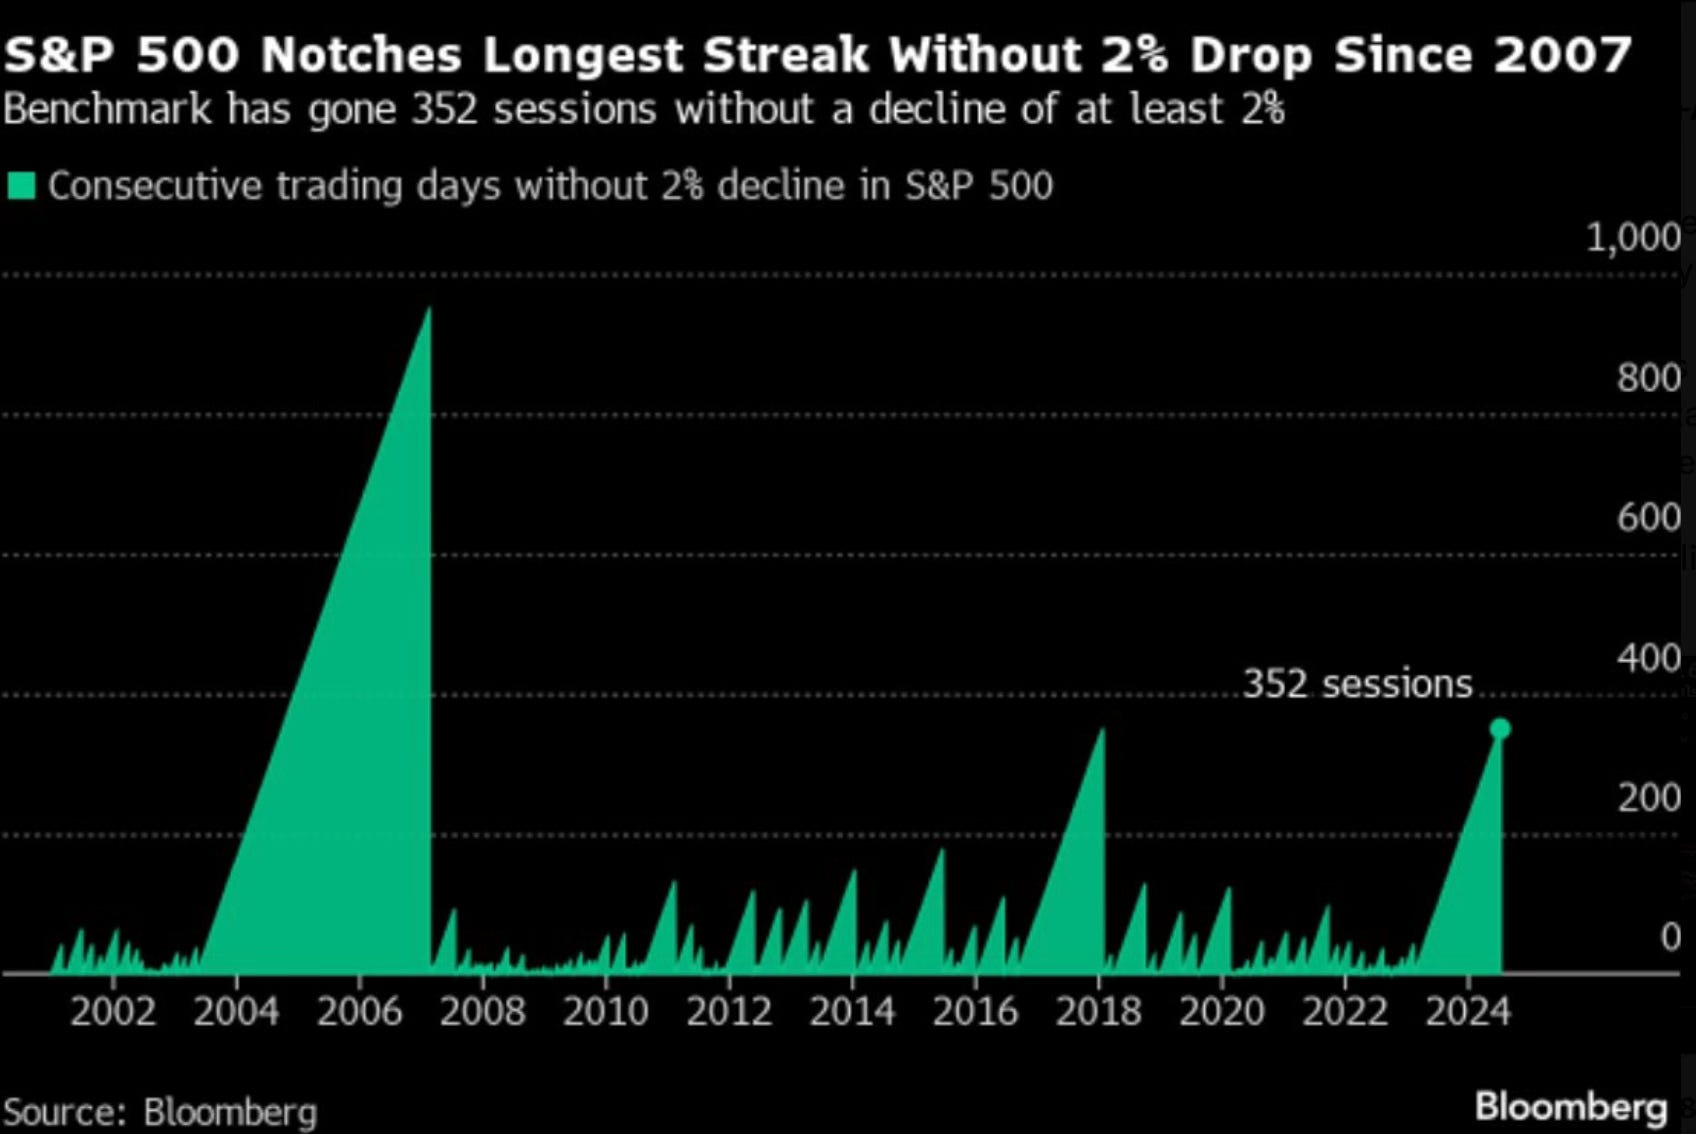
Even with some bumps in the road for investors this week, the year still remains very smooth relative to history. It’s now up to 354 trading sessions since the S&P 500 has logged a day with a 2% or more drop. That’s the longest streak since 2007.
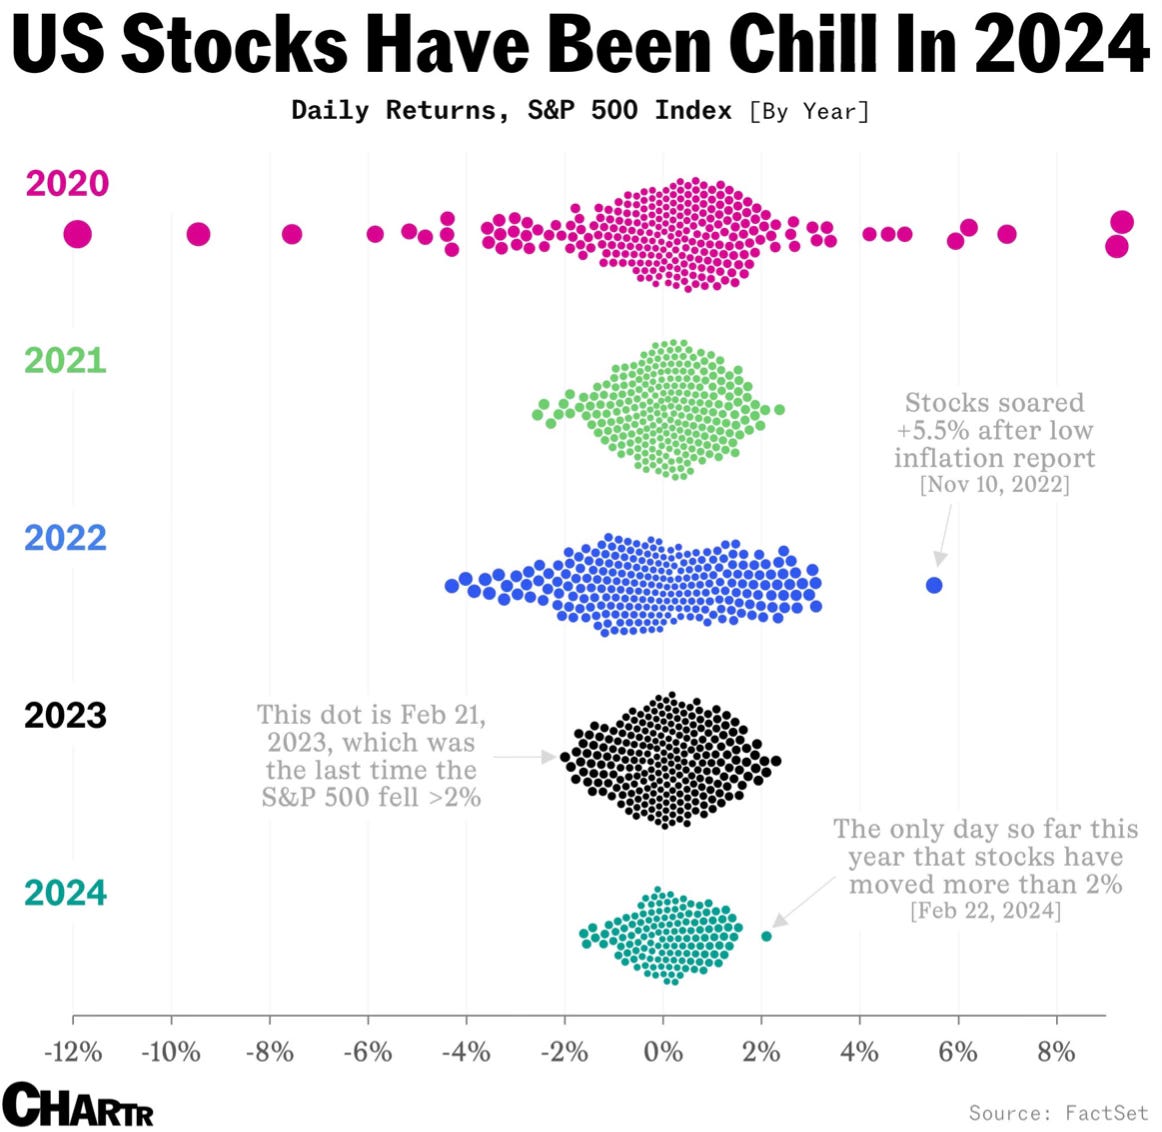
That would be 514 days ago. But it has only moved up more than 2% one day so far in 2024. Talk about a smooth consistent year 2024 has been. This is not the norm though. This chart shows a great visual of the last few years and how most years there are more widespread daily swings.
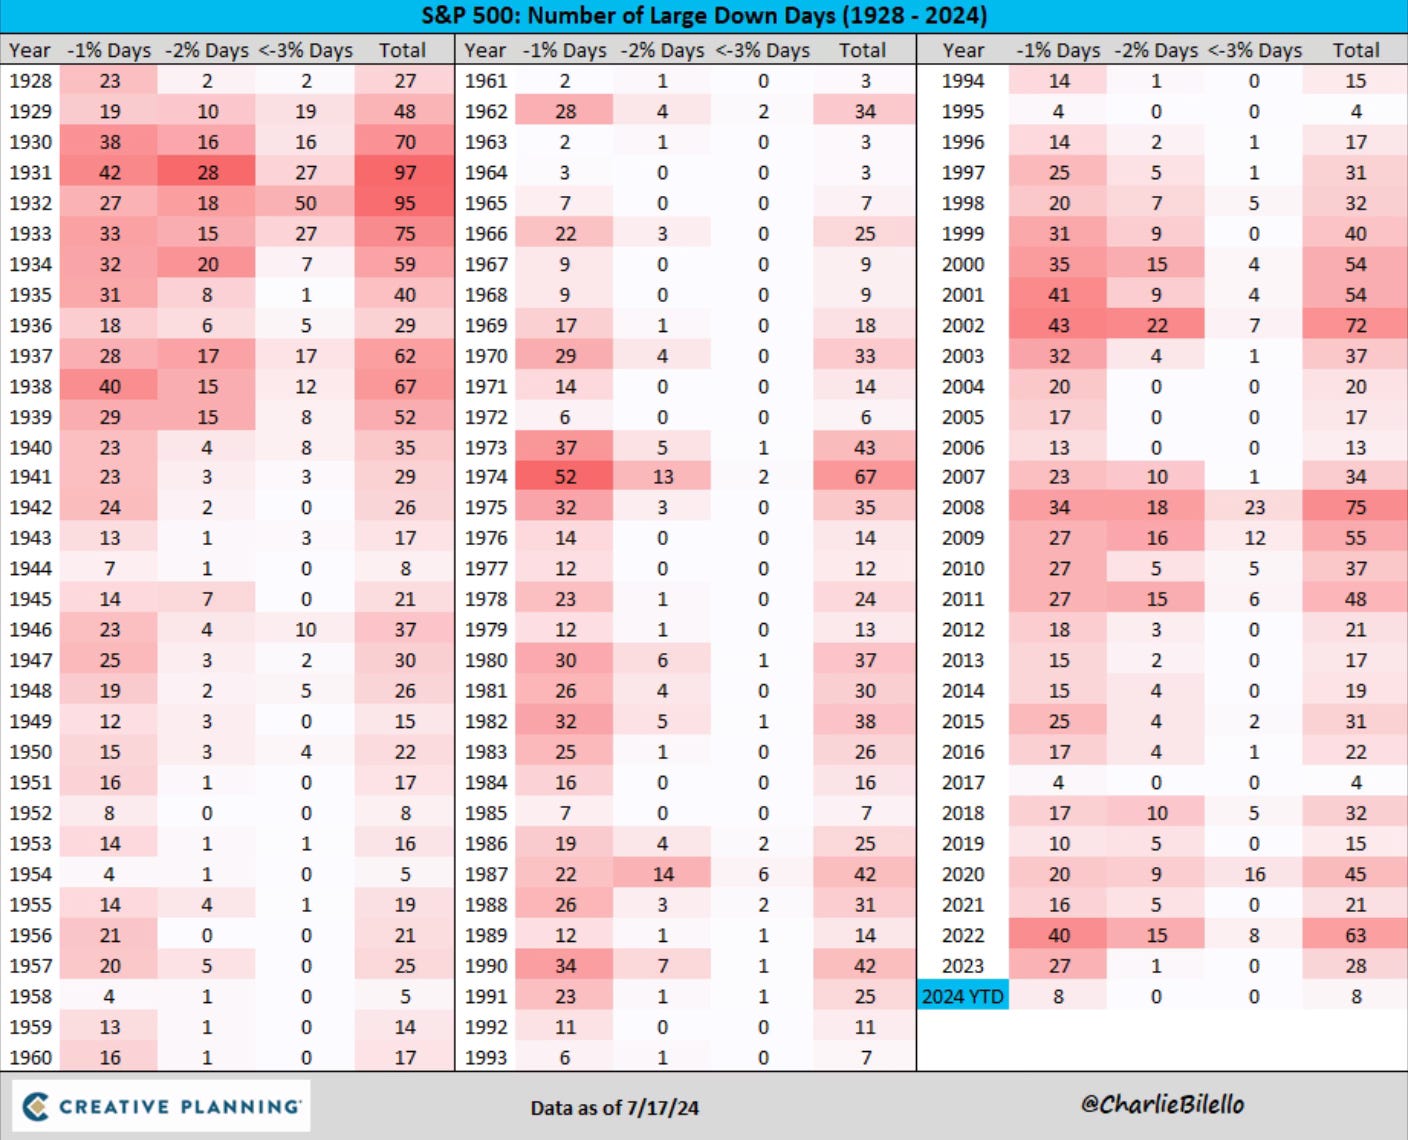
Then look at how many days throughout history per year have actually been down over 1%, 2% and 3% plus.
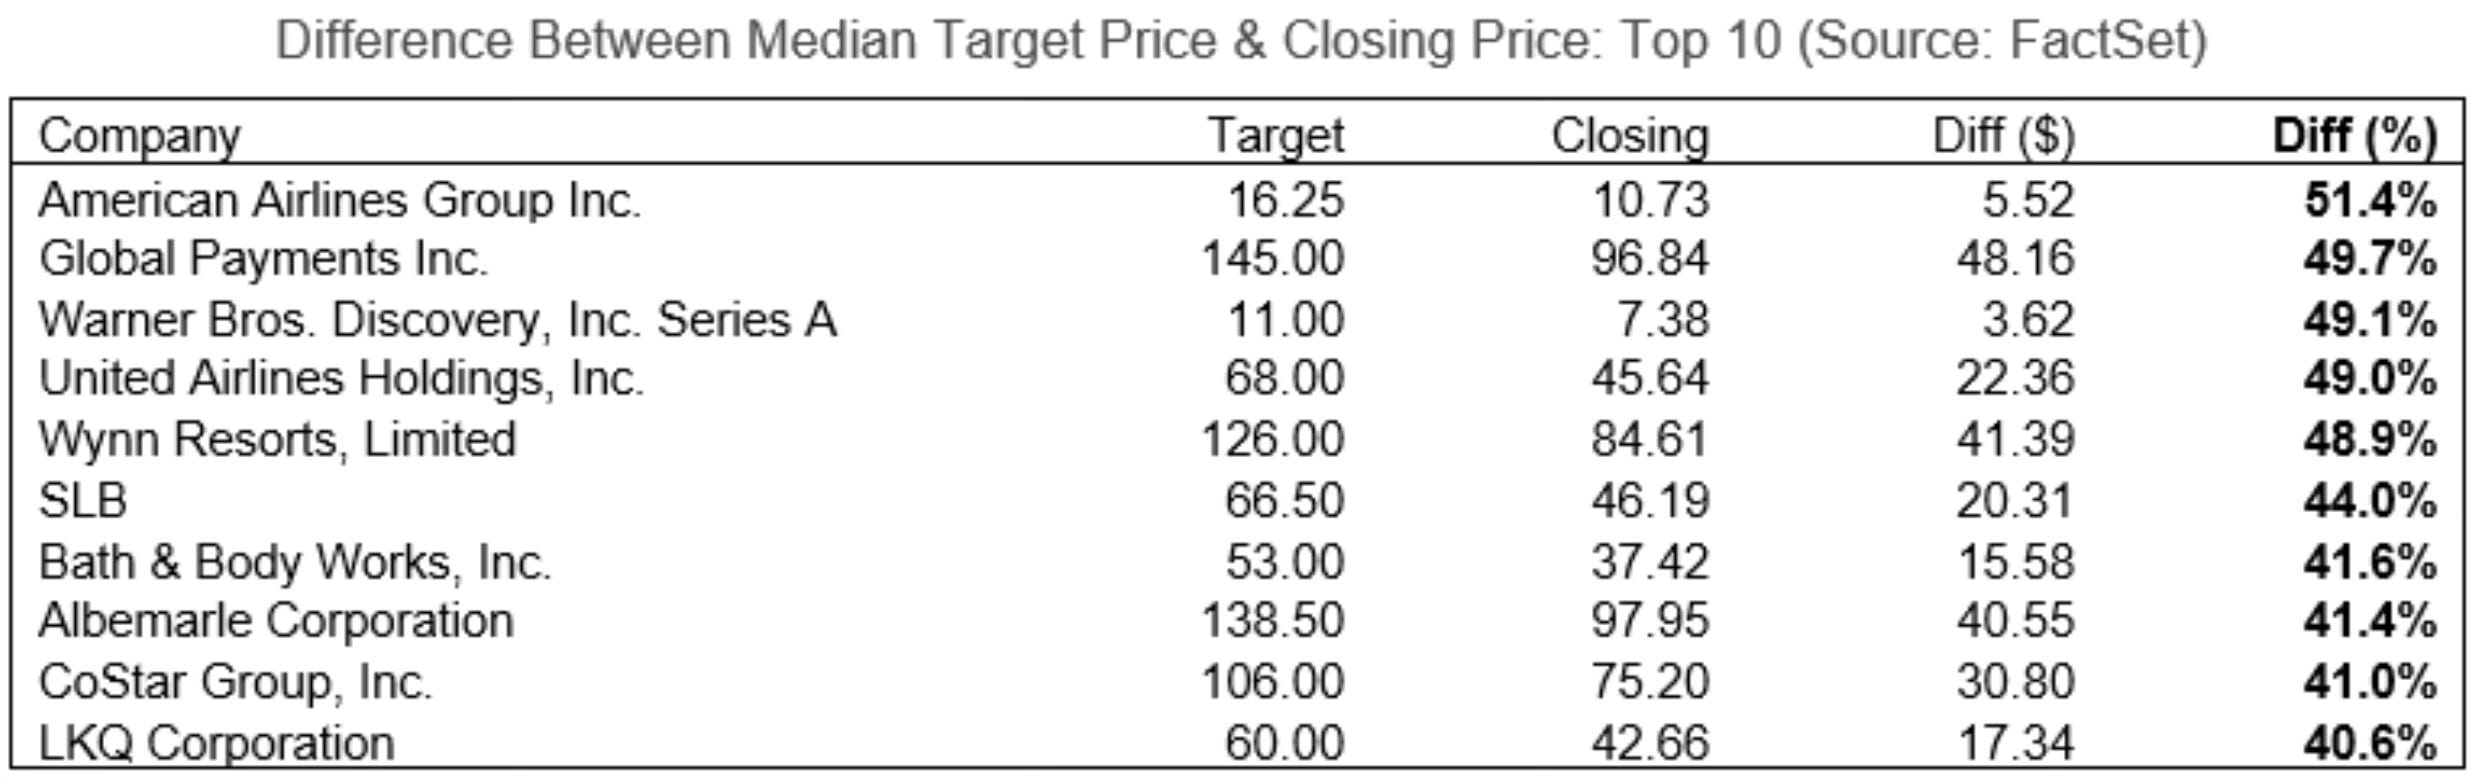
Analysts Stock Target Prices
This was great information from FactSet. They put together the 10 S&P 500 stocks that analysts believe will see the largest price increase over the next 12 months.
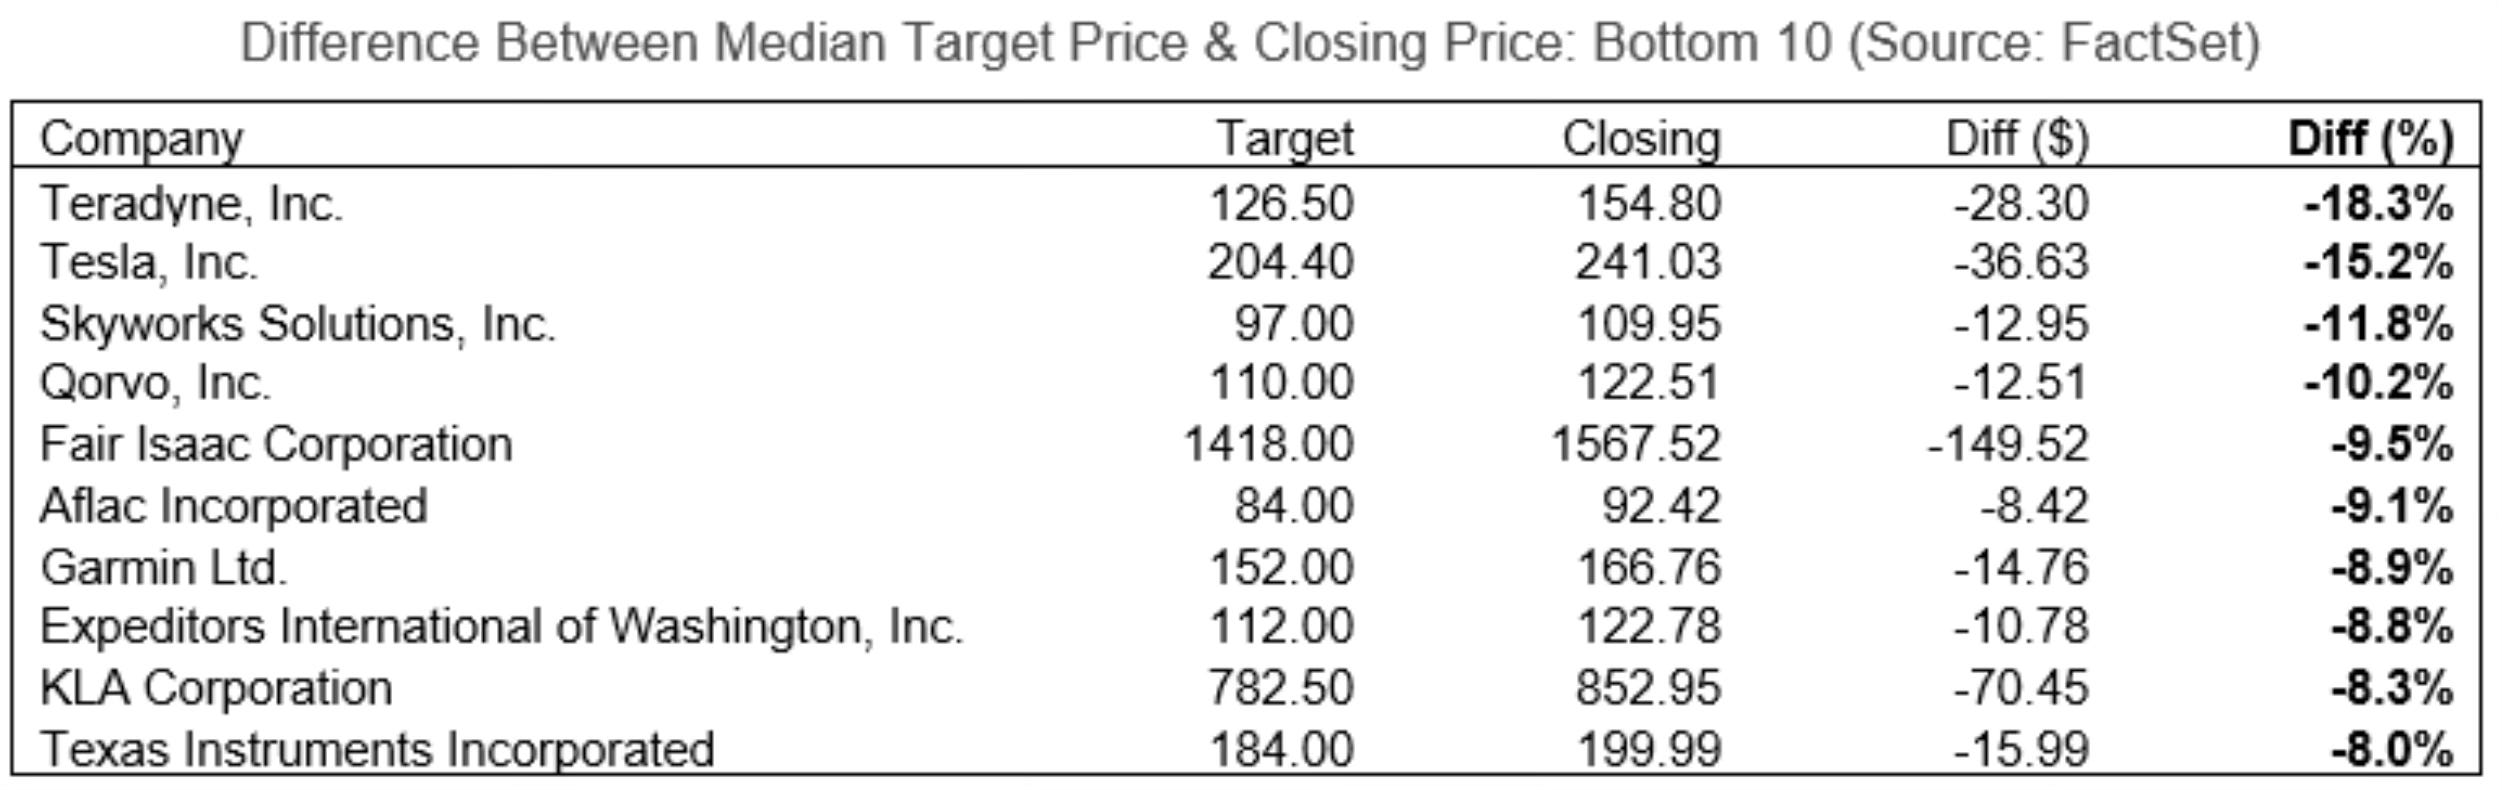
Here are the 10 S&P 500 stocks that analysts believe will see the largest decrease over the next 12 months.
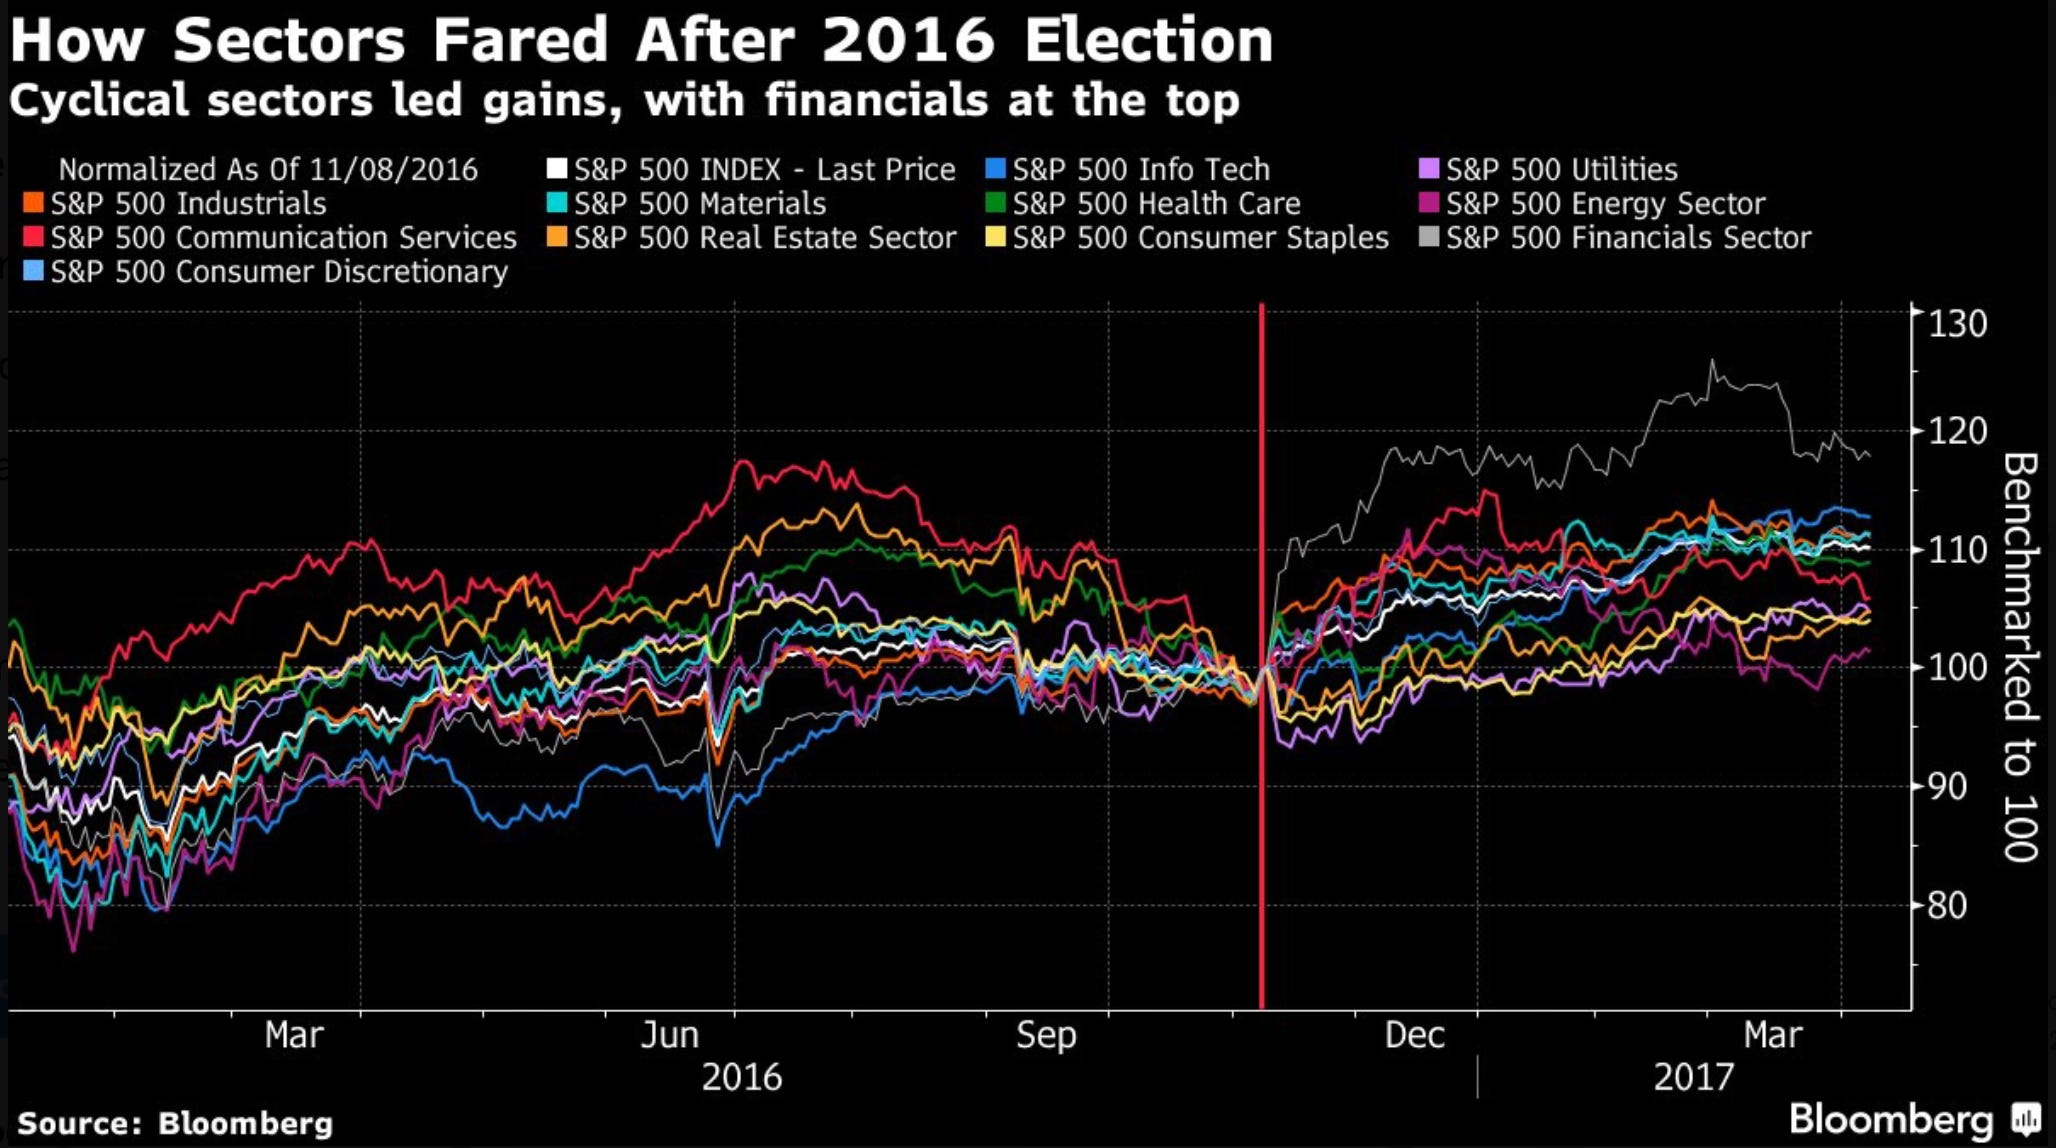
Sector Performance After 2016 Election
Some believe that some of the recent rotation has been attributed to the likelihood that we see another Trump presidency. If that is the case, we can go back to what sectors did the best after rate 2016 election. We can see that financials outperformed all other sectors.
Moves I’ve Made
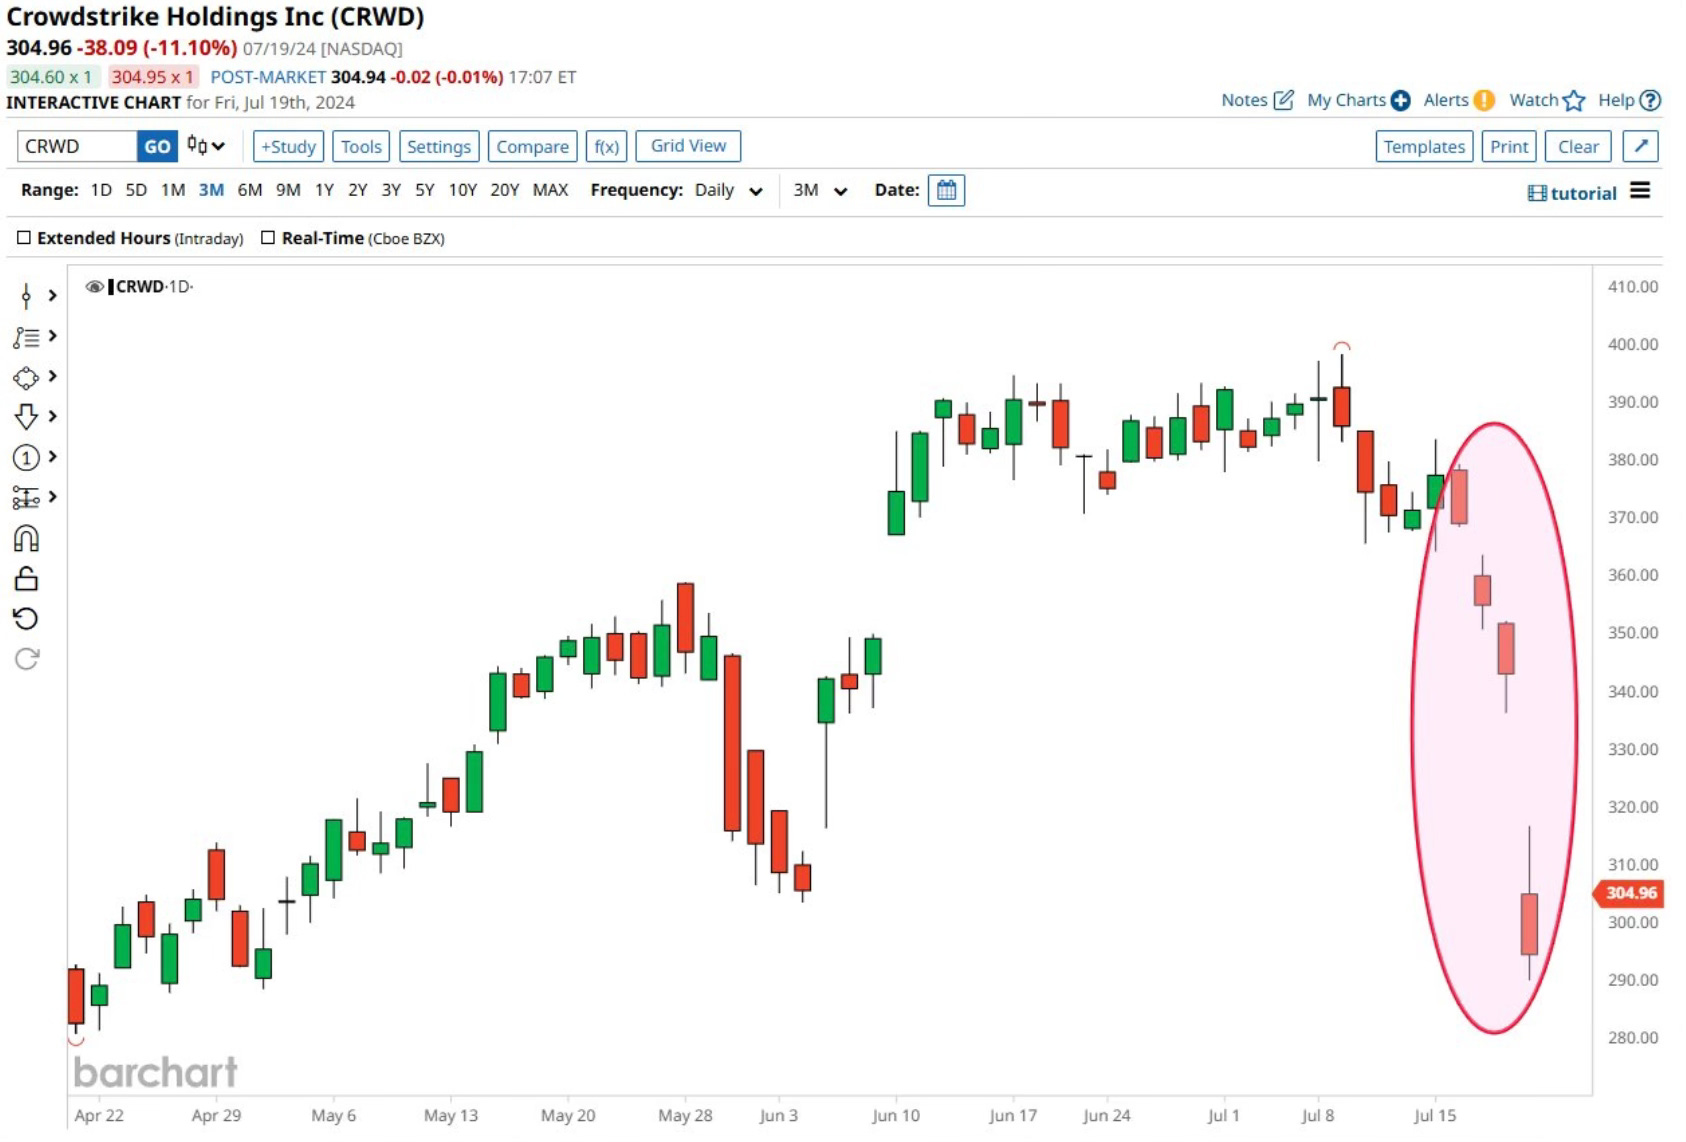
CrowdStrike As readers know CrowdStrike has long been one of my favorite long term stocks. It was one of my stocks picks for 2024, Investing Update: 3 Stocks For 2024. The unfortunate event on Friday did present a buying opportunity in my view. It saw the biggest decline since November 30, 2022. I added shares at $305.
This shows just how deeply integrated and important CrowdStrike is across the world. It also highlights their impressive customer list, which includes 62 of the Fortune 100 companies.
The important part is that this wasn’t a security breach. It was an issue with their software update. I don’t believe many of their customers will go to other platforms as this wasn’t a security incident.
It also shows just see how easily disrupted so much of the United States and the world is. A wrong line of code caused this much of the world to shut down? A period or comma in the wrong spot can do this?
If anything this reinforces the importance of CrowdStrike and the entire cybersecurity system of companies (Palo Alto, Zscaler, Fortinet, Sentinel One and Okta). I firmly believe this is an area to be exposed to over the long term. The threats and risks will only grow.
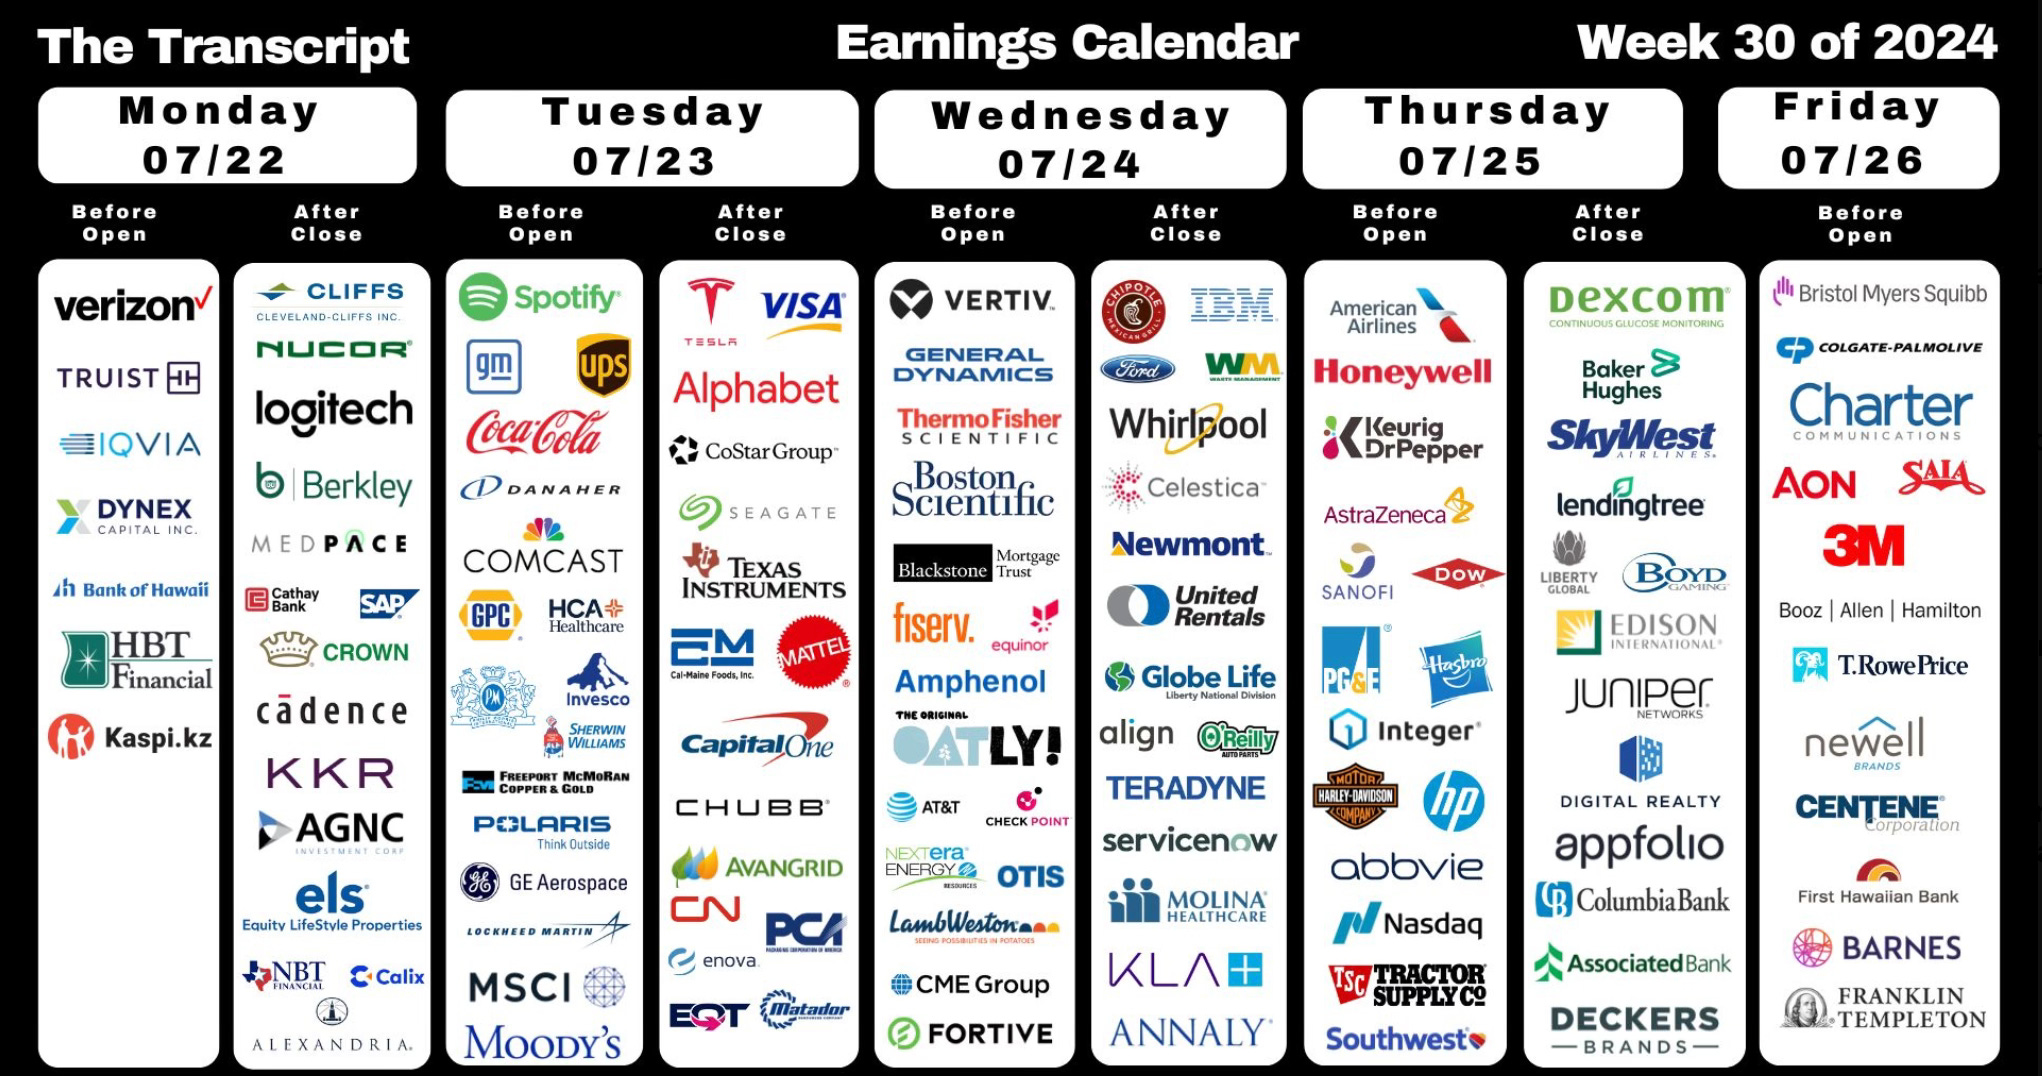
Upcoming Earnings
A big week of earnings is upcoming next week.
The Coffee Table ☕
It’s great to see Kelly Evans back at CNBC and writing again after maternity leave. Love her insights and interviews. I liked her post this week, The Exchange: Rotation, or breakdown? She gives a good overview on just how hard it is to figure out what’s all going on right now in the economy and the stocks market.
Matt Wirz wrote a good piece in the WSJ called Real-Estate Meltdown Strains Even the Safest Office Bonds. This segment of the economy does still worry me a bit. But so far nothing has spilled over to the broader economy from it. This part of the article really stood out to me.
The commercial real-estate meltdown is spilling over into the bond market. Defaults are mounting in a favorite Wall Street mortgage-bond investment, setting off fresh alarms about the future of offices and malls in cities across the U.S.
Luke Kawa at Sherwood News put out a great image in his story, The cost of everything that goes into building a new home. I like this chart as it shows the estimated amount per home and then the key companies of that product.


Thank you for reading! If you enjoyed Spilled Coffee, please subscribe.
Spilled Coffee grows through word of mouth. Please consider sharing this post with someone who might appreciate it.
Order my book, Two-Way Street below.
