Investing Update: A Sentiment Shift?
What I'm buying, selling & watching
With all eyes focused on the Fed, inflation and interest rates, the stock market keeps shrugging off all the news and noise.
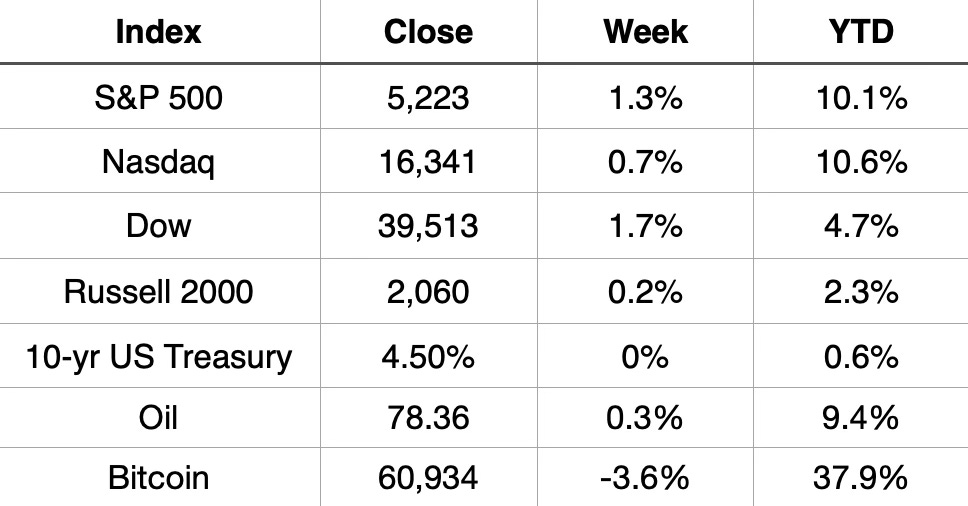
The Dow has now been up 8 days in a row. That’s the longest streak since December. The S&P 500 closed the week at the highest level since April 9th. It now sits within 1% off its record high and back to a double digit gain for the year up 10.1%.
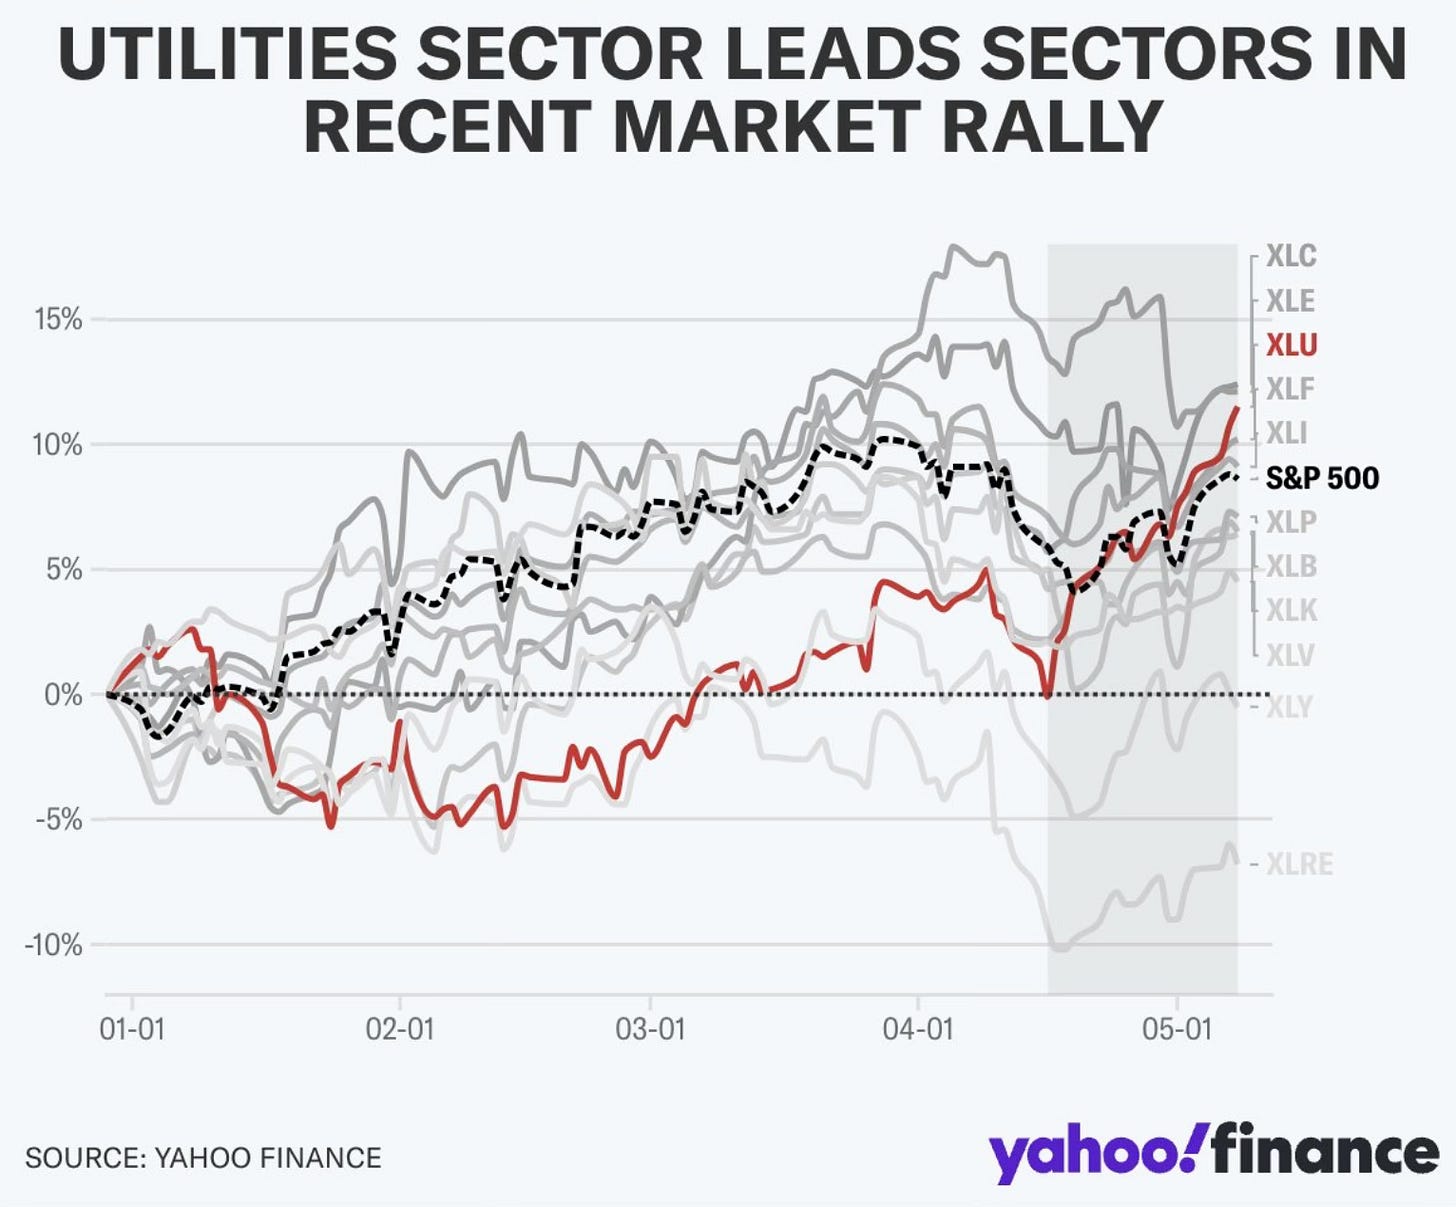
We’re now seeing sector rotation with consumer staples and utilities both hitting new 52-week highs this week. It’s actually a five way battle for the best performing sector between communication services, energy, utilities, financials and industrials.
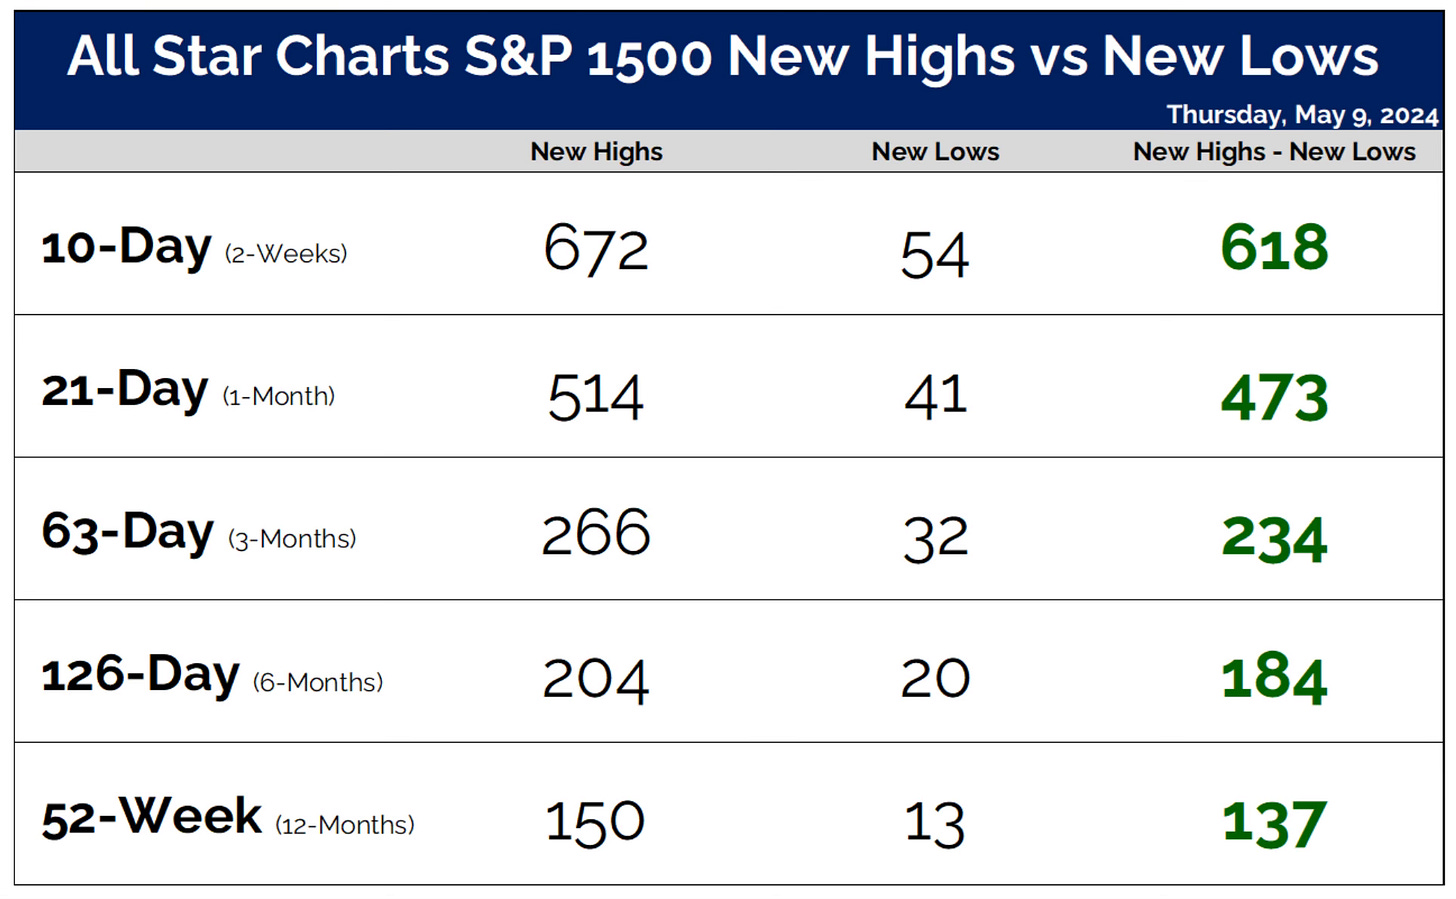
Under the surface new highs are continuing to expand.
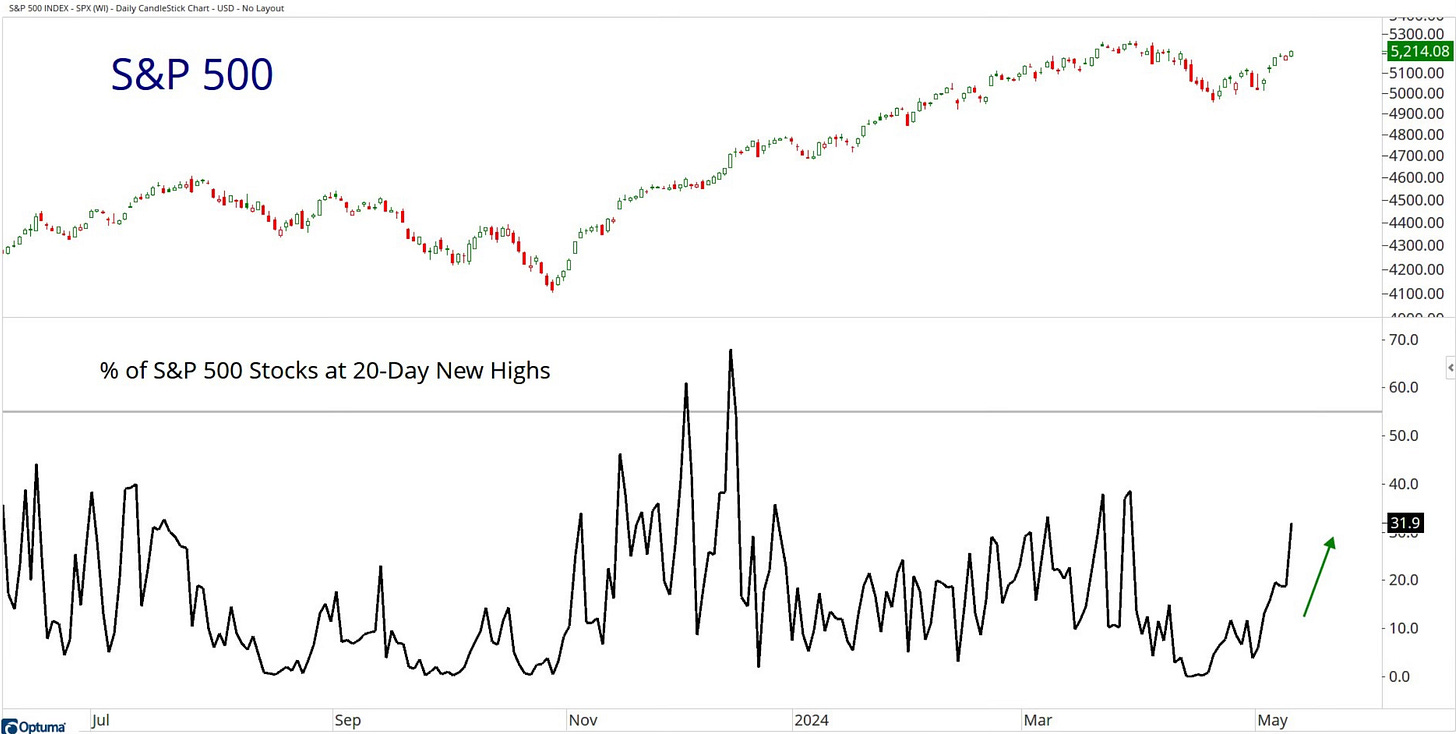
A bull market is still intact with no questions asked when you still have more new highs than the new lows.
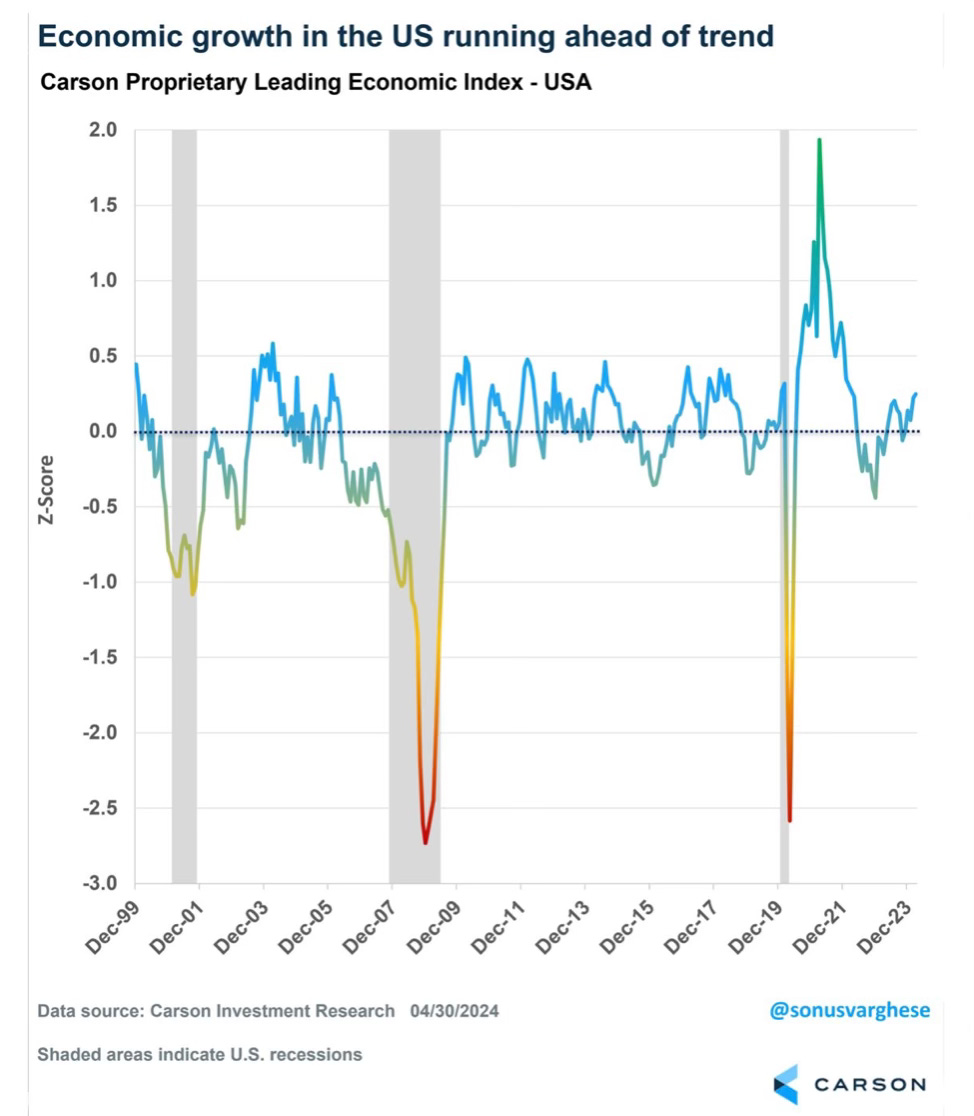
It also helps when US economic growth is still running ahead of trend. This is a nice chart from Sonu Varghese over at Carson where he said the following.
The good news is that the US LEI currently points well away from a recession. The index has been rising in recent months, indicating growth is running above trend.
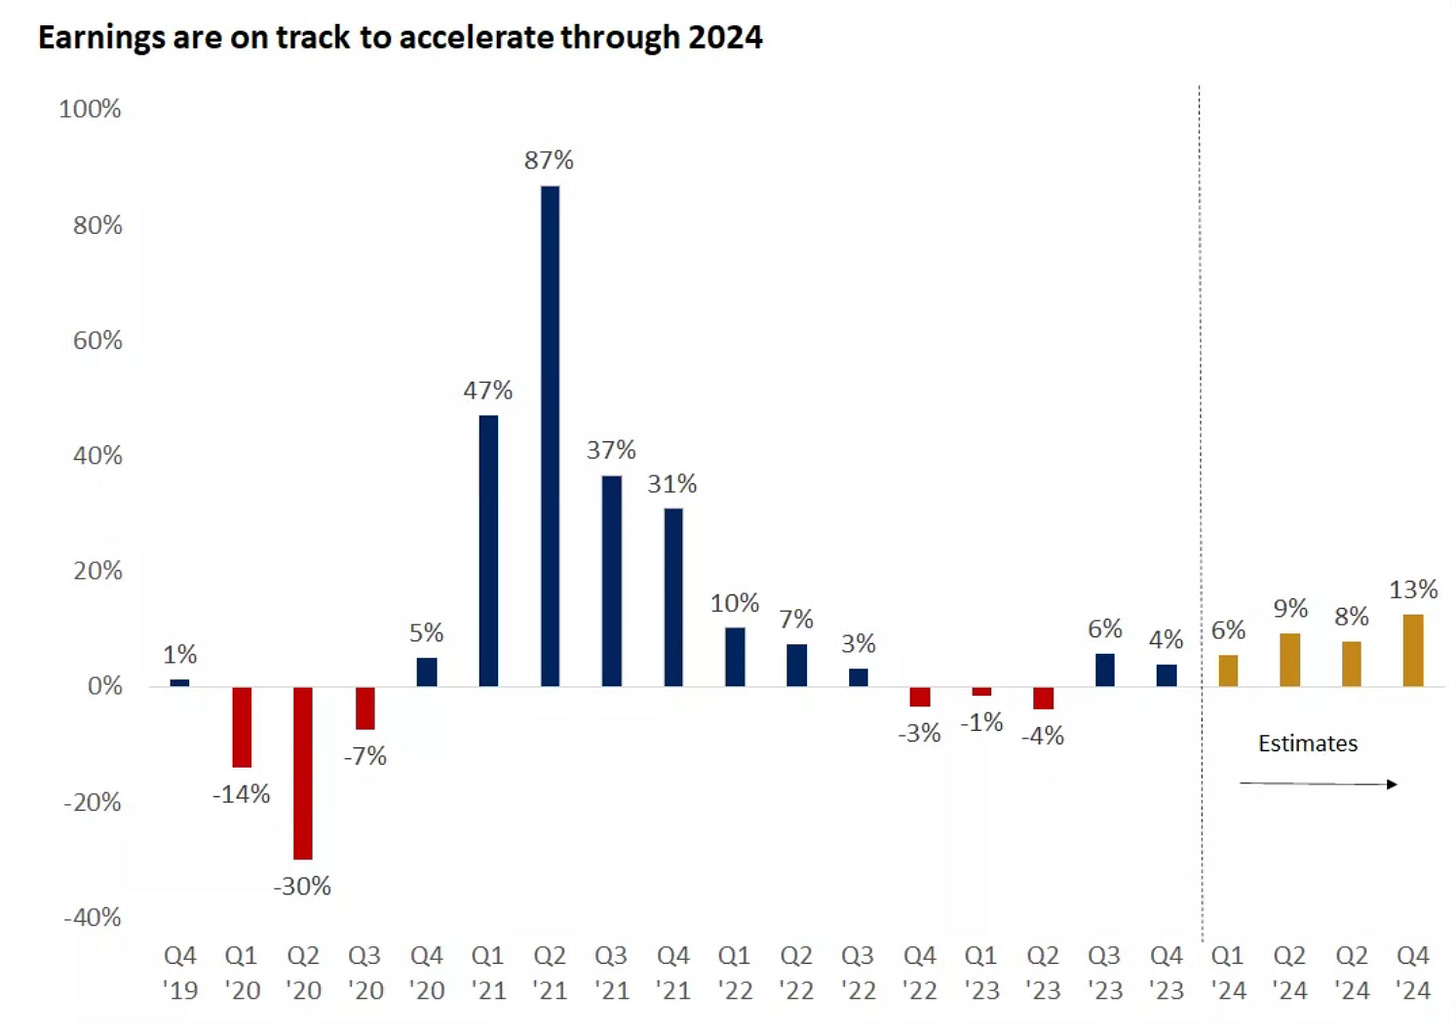
90% of S&P 500 companies have now reported quarterly earnings. Earnings grew 5.5% from last year which has exceeded analysts expectations by 8.5%. The biggest beat since Q3 2021. This has earnings on track to accelerate as we move through 2024.
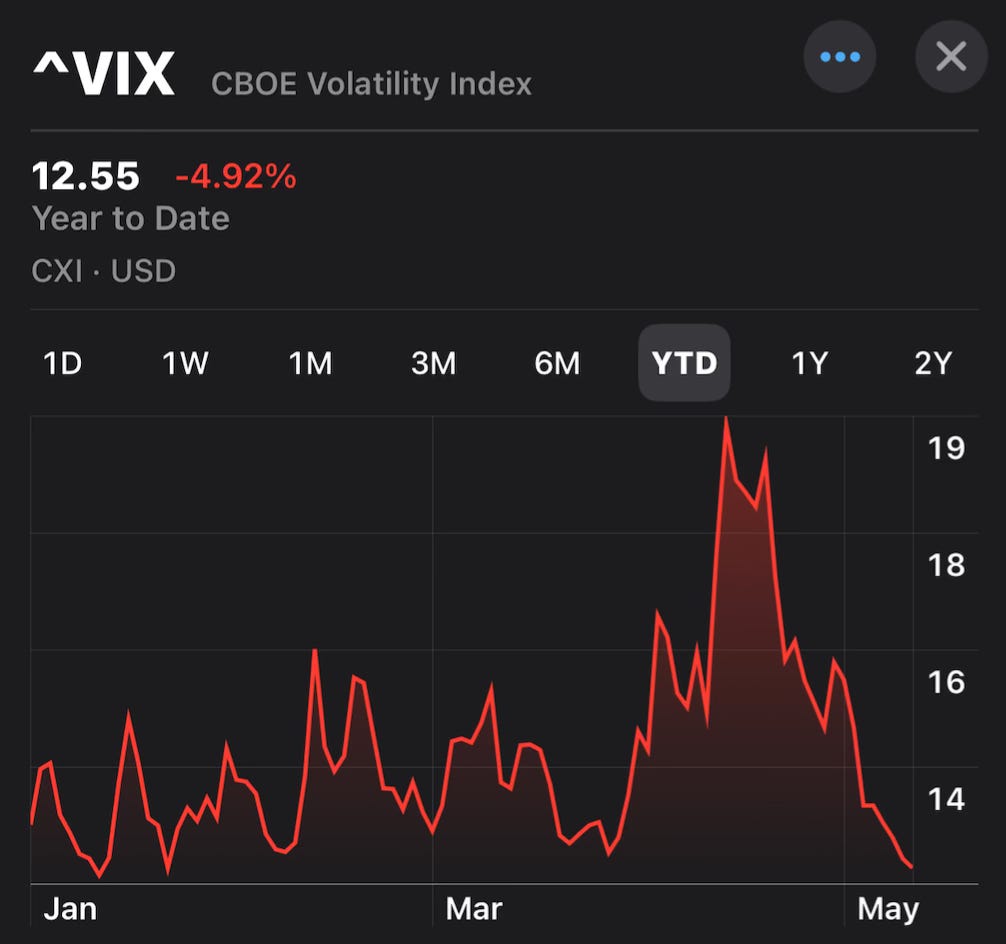
After recently reaching 20 on the VIX for the first time this year, the fear and volatility has been sucked out. The VIX now has settled below 13. It now sits at the lows of the year.
Market Recap

A Sentiment Shift?
In a surprising development Friday, the US consumer sentiment measure fell off a cliff. The University of Michigan Consumer Sentiment Survey for May plunged to 67.4 from 77.2. The expectation was 76.2. This is the largest miss on record.
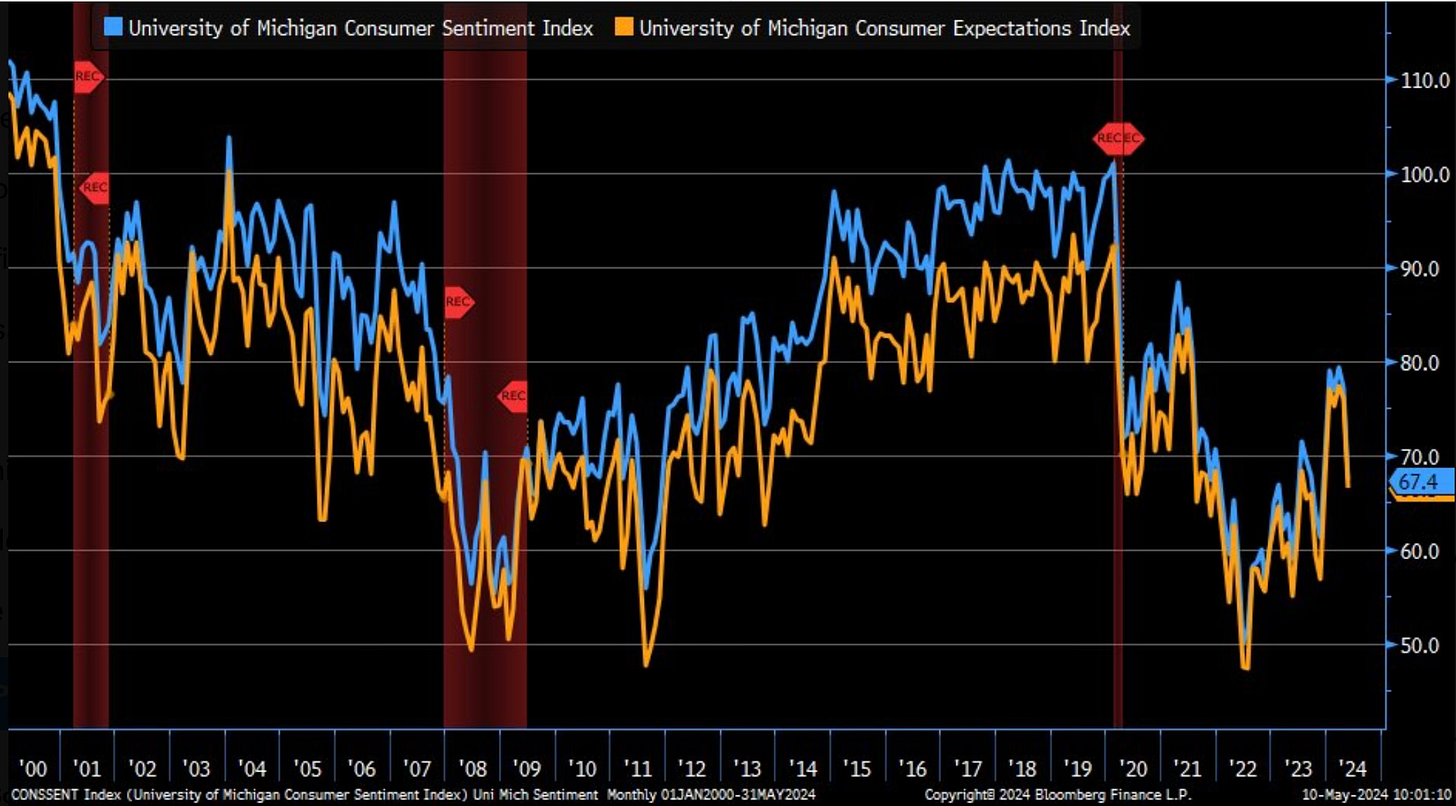
US consumers are clearly worried about the trajectory of the economy. Stickier inflation and higher interest rates for longer look to be affecting sentiment.
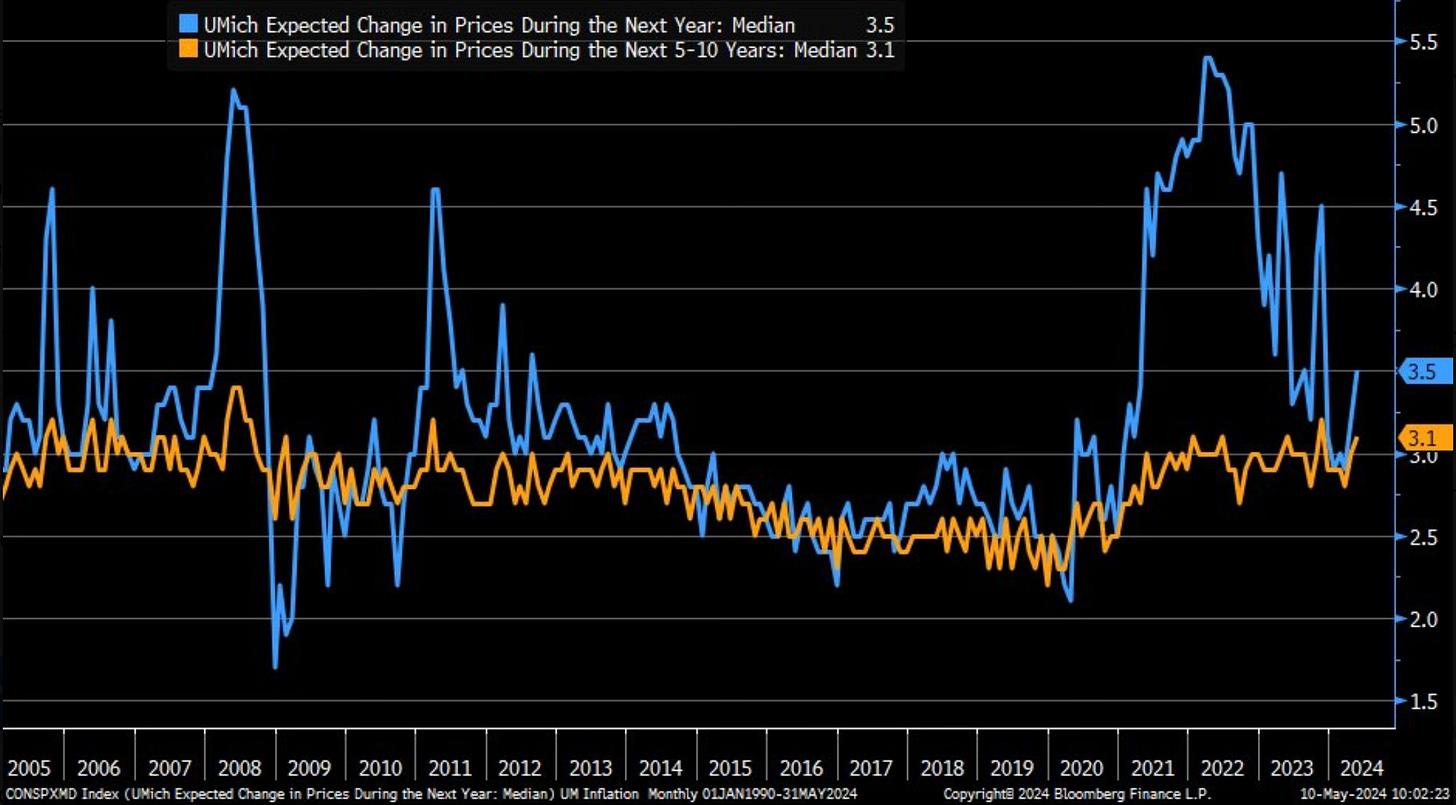
The 1 year inflation expectations rose from 3.2% to 3.5%. The 5-10 year expectations went from 3% to 3.1%.
This large of a miss really made me question what happened. Was the reporting changed or was something incorrect. Then Goldman came out with a very good summary of what they noticed.
.. this month’s decline in sentiment was broad based—with decreases across age, income, and education groups—and particularly steep in western states. .. consumers ‘expressed worries that inflation, unemployment and interest rates may all be moving in an unfavorable direction in the year ahead.
The broad based decline in sentiment was even evident in the consistent fall across political party lines also. No good news really anywhere to be found in this.

There was no good news to be found in this reading. I’m expecting the stagflation talk to only pick up steam after this report. If you aren’t familiar with it or are sick of hearing it, be prepared. Next week’s inflation reading just became even more interesting than it already was. All eyes will be on CPI and PPI data this coming week.
Highest & Lowest Forward Price To Sales Ratios
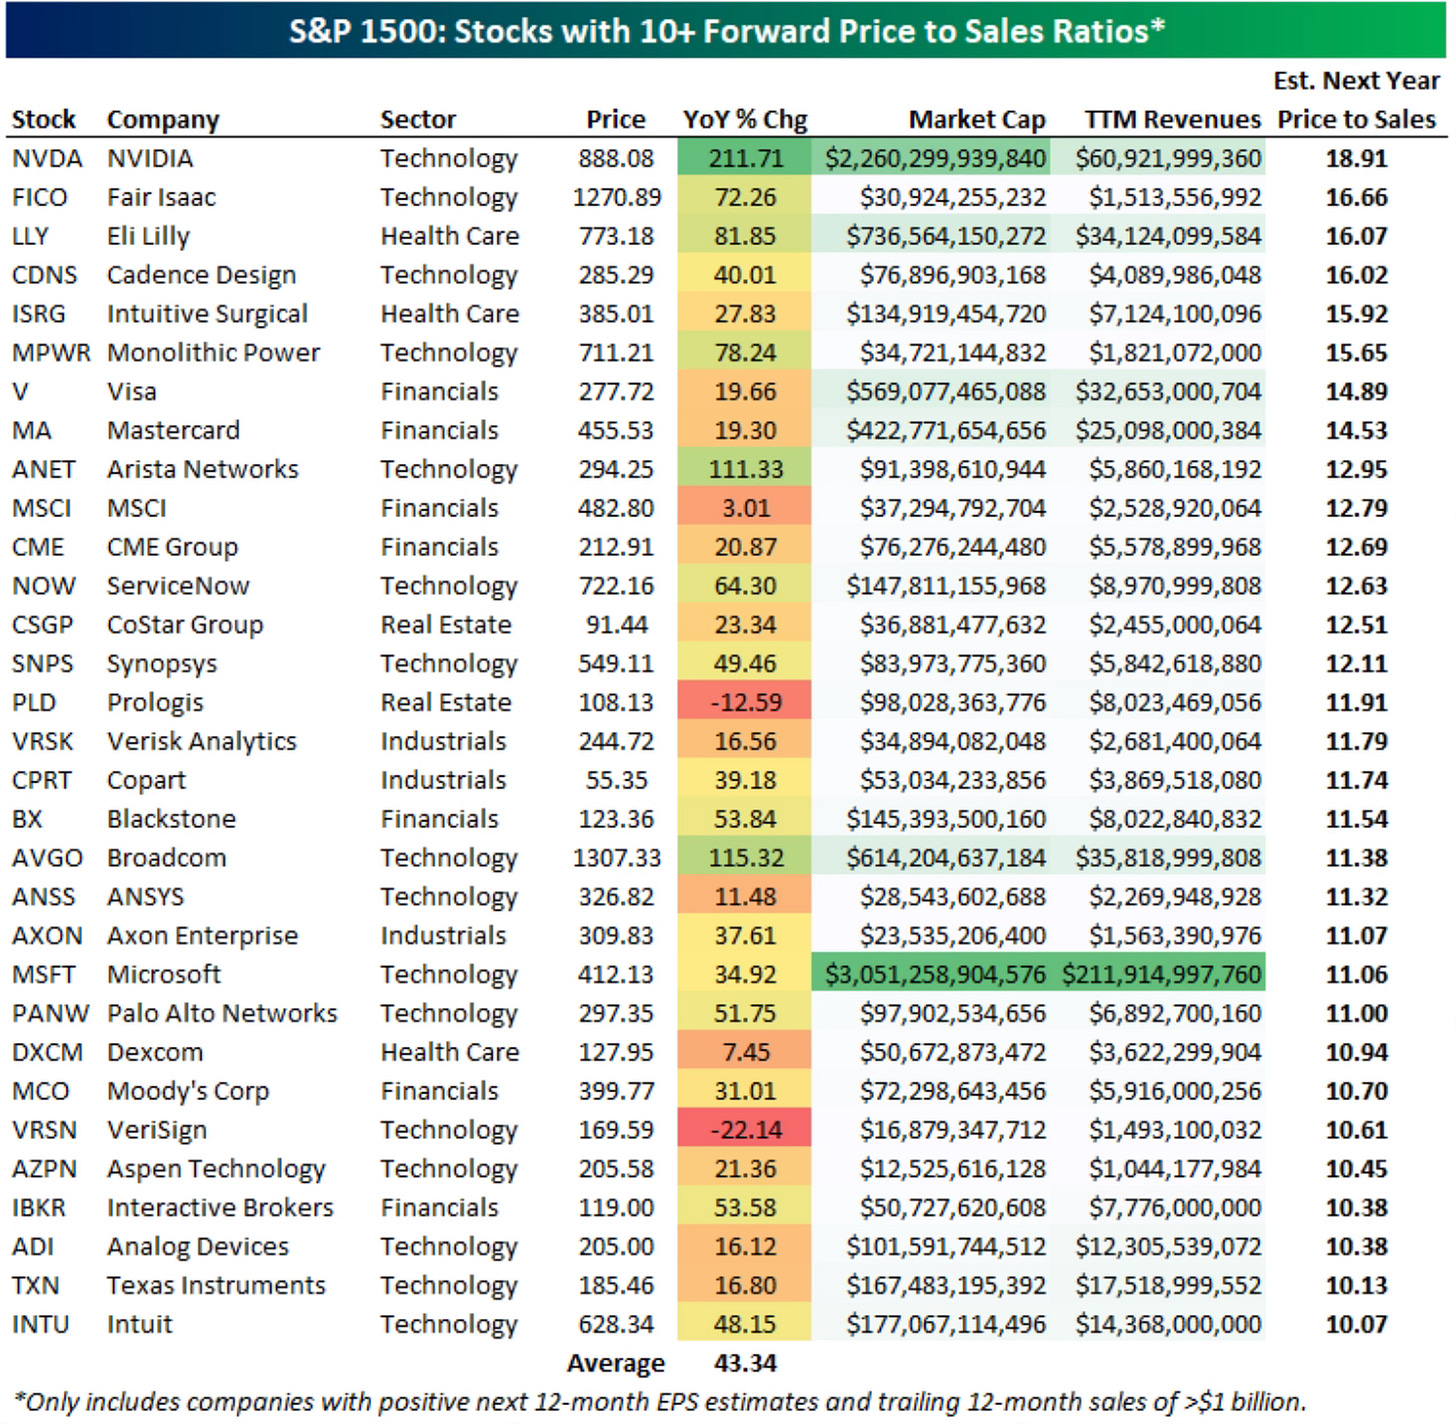
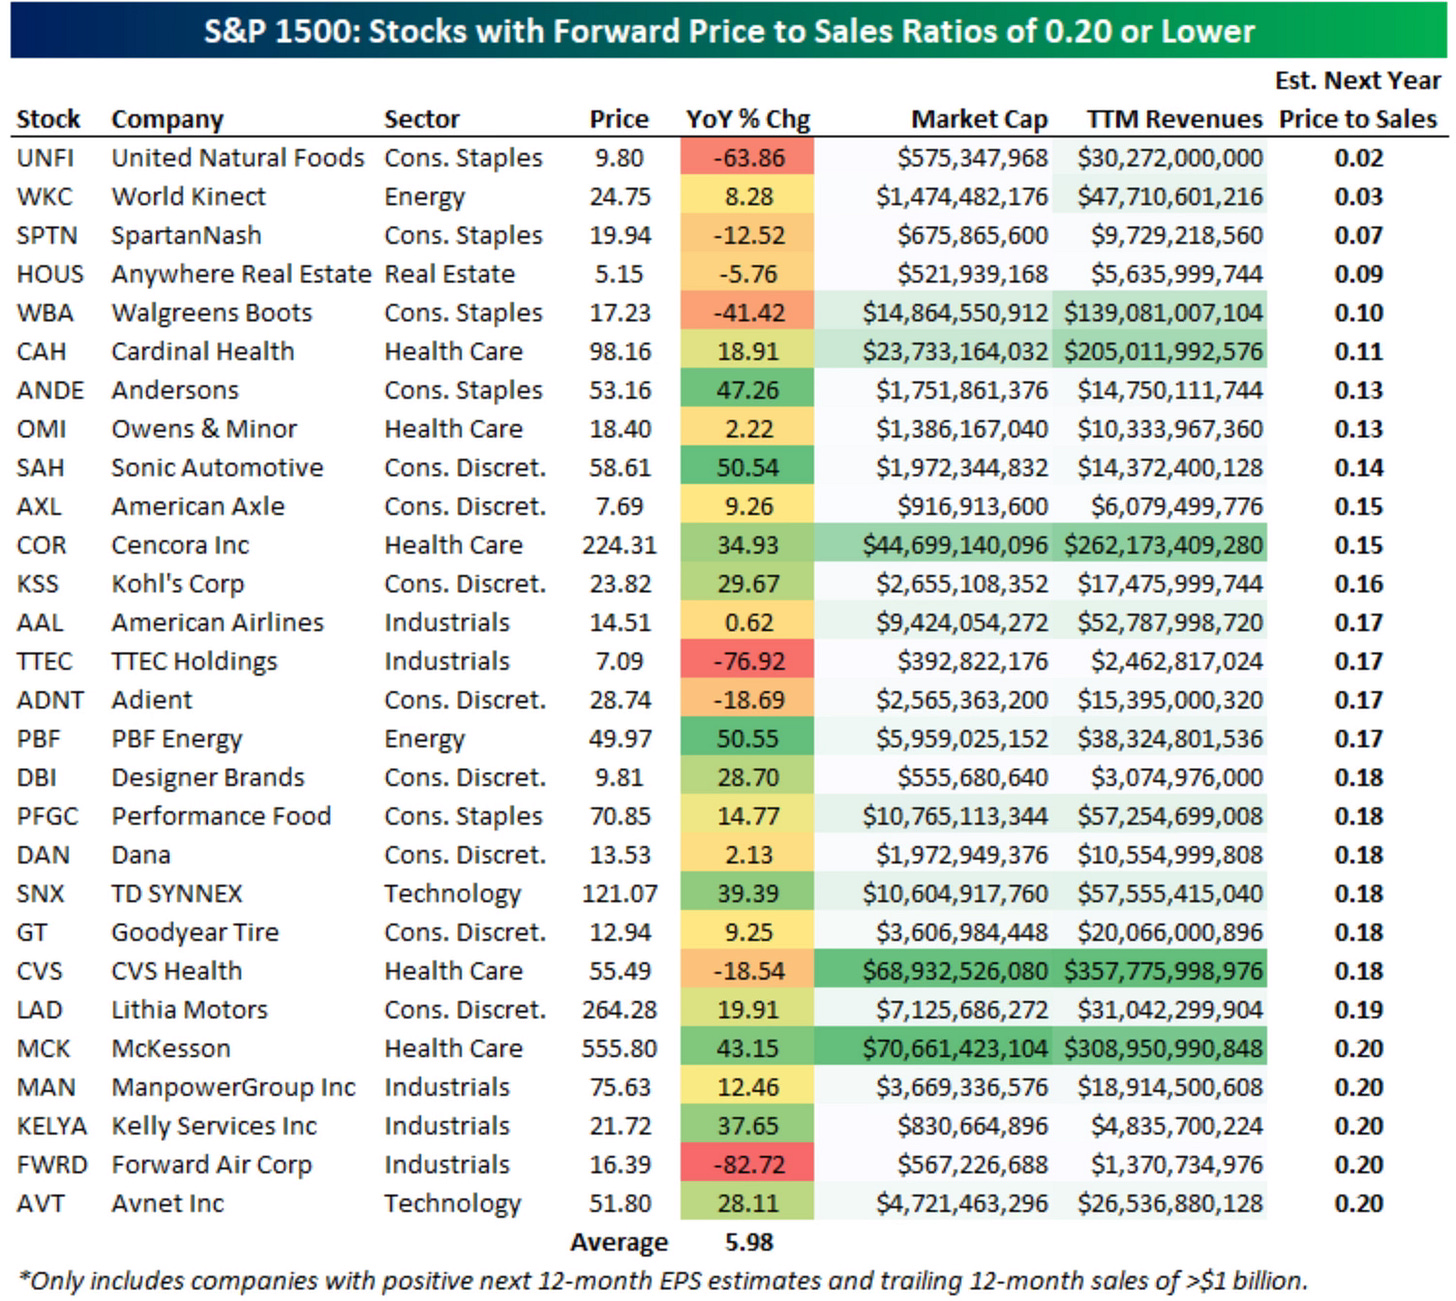
Bespoke had a good breakdown of forward price to sales ratios for the S&P 1500 stocks. The price-to-sales ratio (P/S) is a company’s current market cap divided by their annual sales. Forward price-to-sales is for the next 12 months sales estimates.
Here are the 31 stocks with a forward P/S over 10. These companies are expected to grow significantly. No surprise at the top of the list is Nvidia. Both Visa and Mastercard being this high surprised me.
Here are the names on the other end, with a forward P/S under 1. Their market caps are lower than their 12 months sales estimates. The downfall of Walgreens continues. McKesson is a bit of a surprise on this list to me.
Crypto Outflows
In one of the more interesting charts I saw this week was the outflow from crypto funds. They just had their largest outflow going back to June 2022.
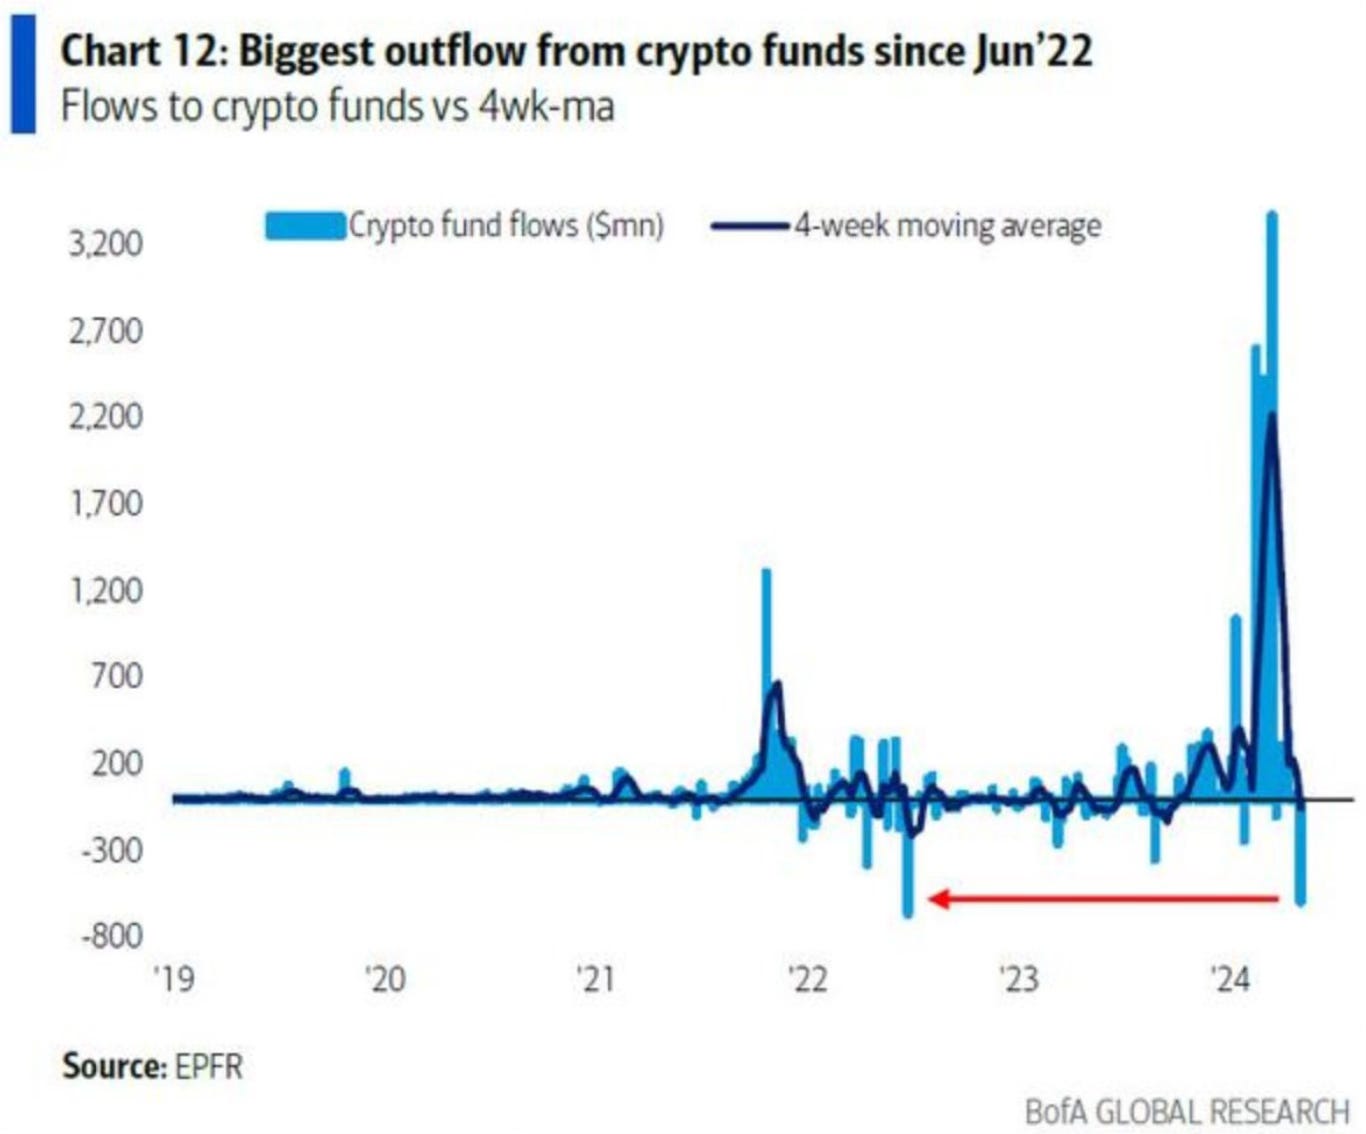
Bitcoin ETFs also had their largest outflows ever.
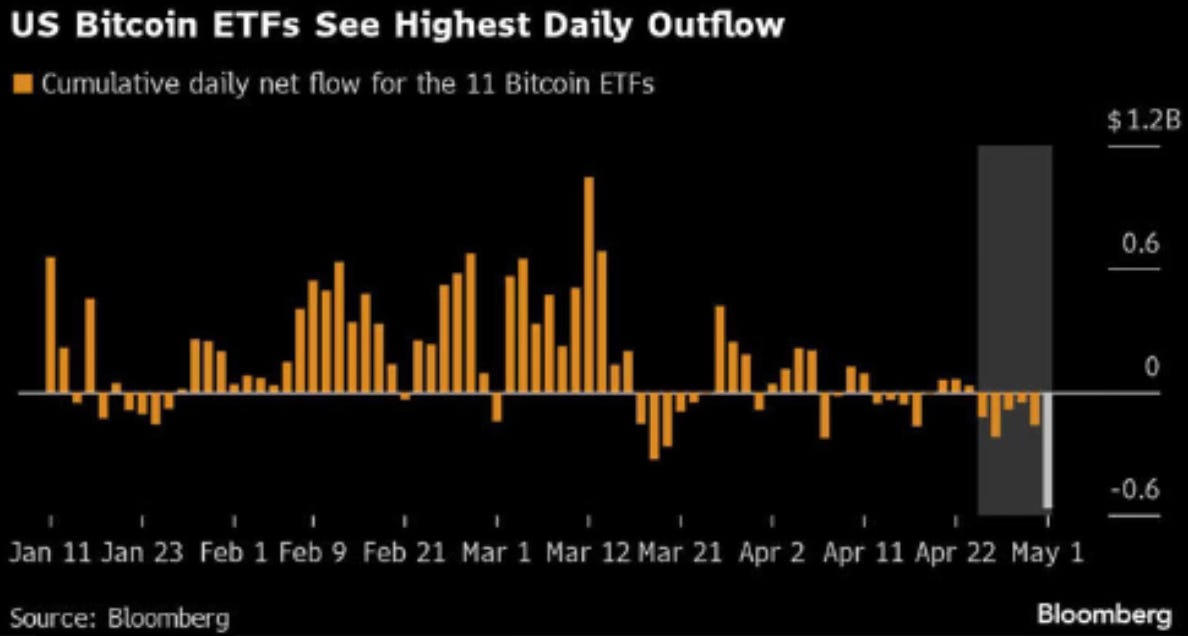
This is a bit surprising that money is going out of these funds at this moment and not in. If it’s being pulled out of crypto, where is it headed?
Retail Sales Start To Surge
The retail sales from April shows a US consumer that regardless what the economic outlook is right now, they’re going to continue to spend. From March retail sales to April, only three categories saw a decrease in sales, home improvement, airlines and total online retail.
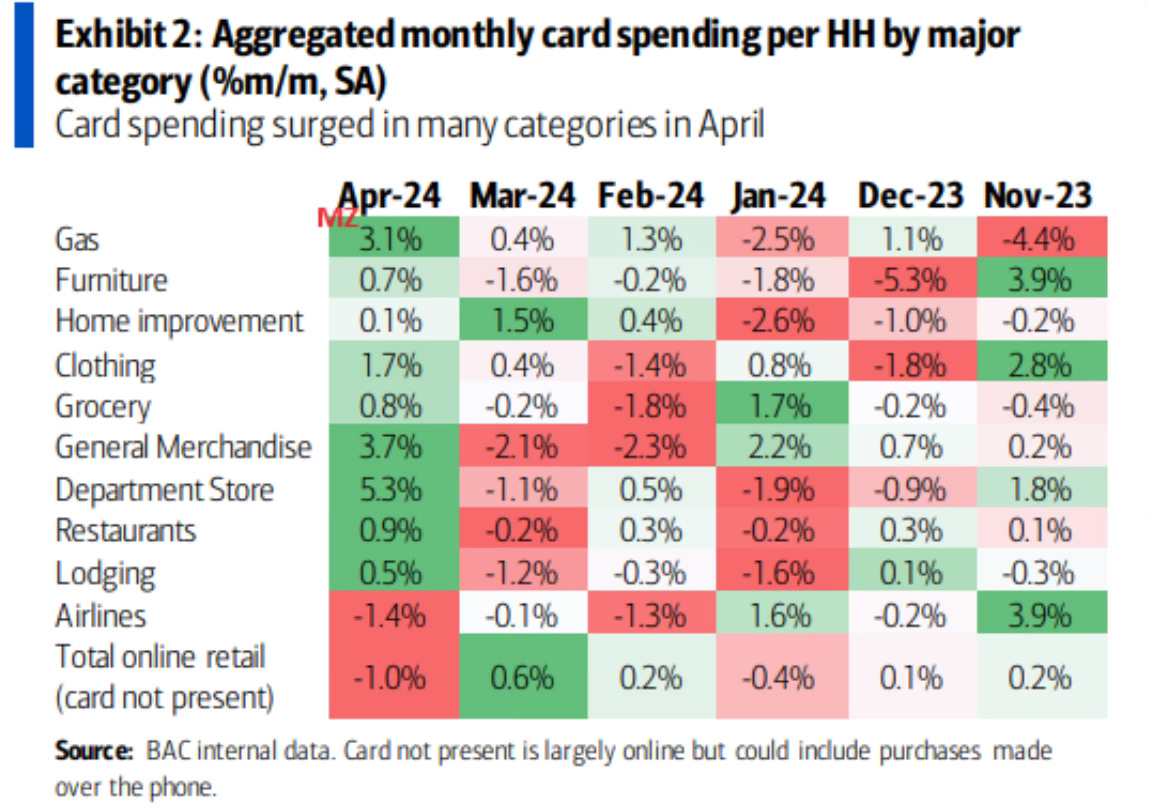
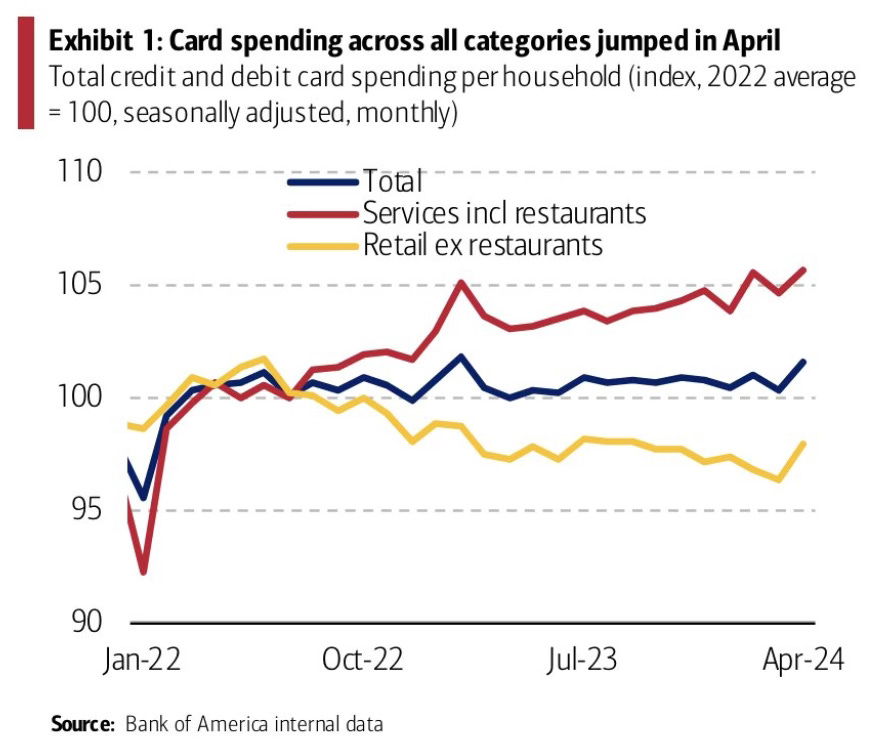
This from Sam Ro shows that total card spending per household rose 1% YOY. March was a YOY rise of only 0.3%. All categories jumped up in April.
Weekly YOY same stores retail sales data is showing that there is a continued uptick higher. We’re starting to approach the highest levels since early 2022.
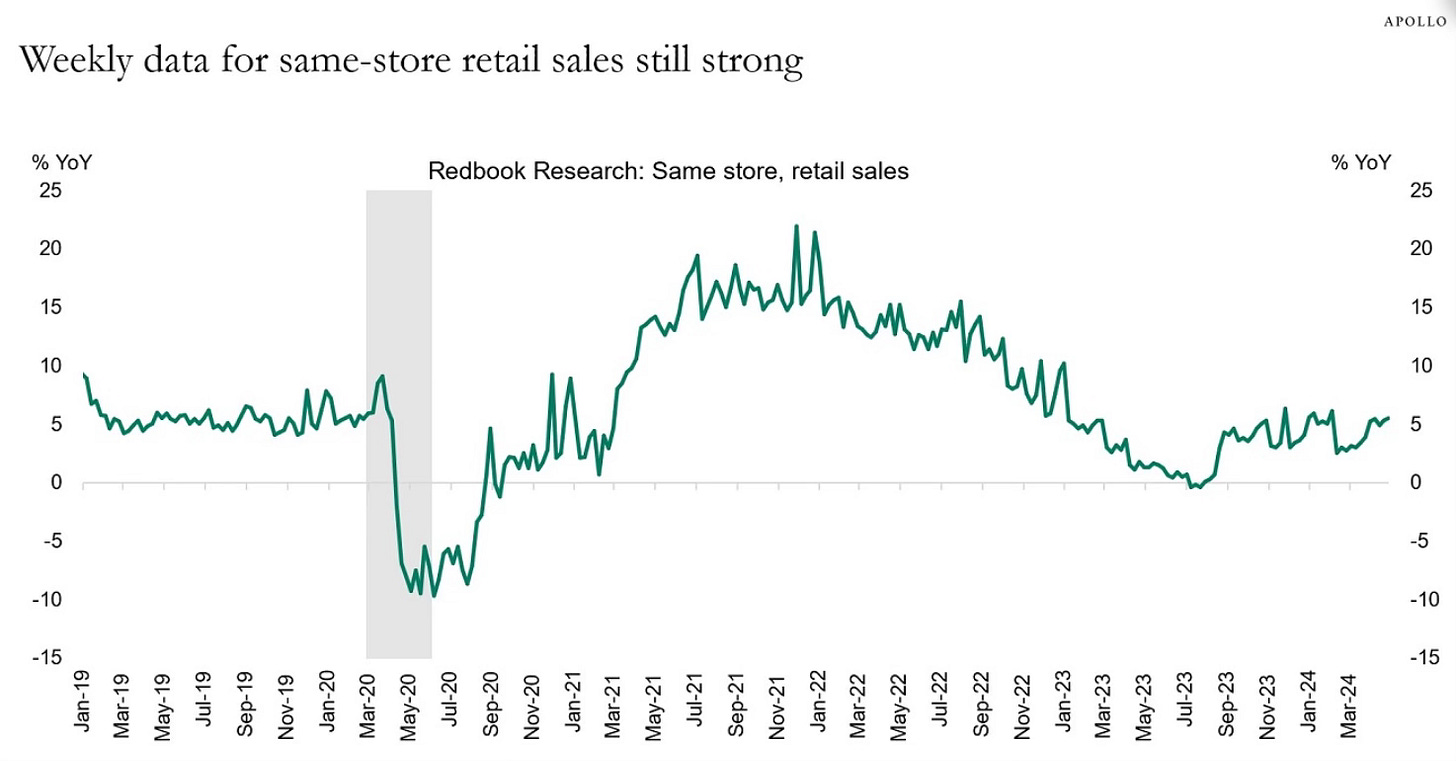
This is quite an uptick surprise when you consider what we’ve been hearing about consumers who are battling with inflation, higher interest rates and the consumer sentiment spiraling downward. Again, pay attention to what people do, not what they say.
Used Vehicle Prices Falling
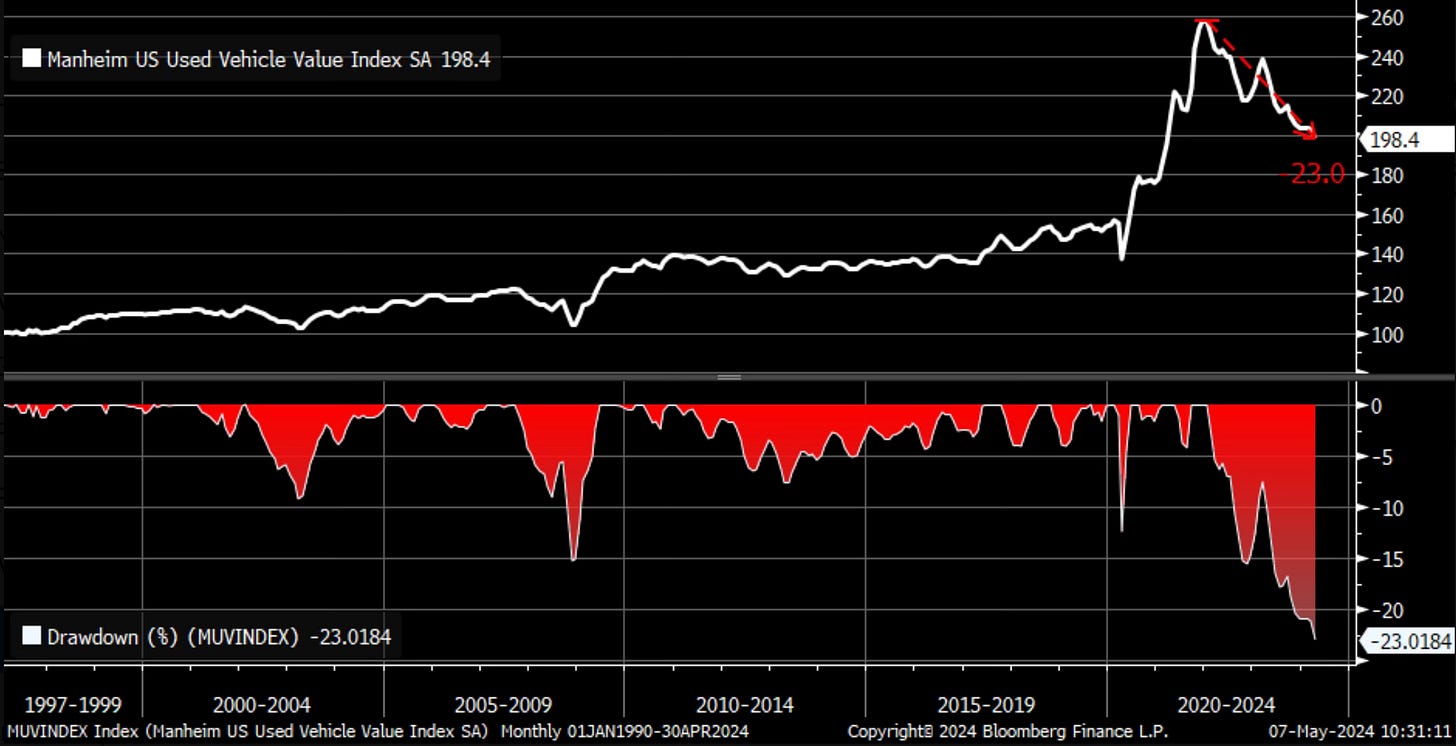
The Mannheim Used Vehicle Index just fell below 200 for the first time since March of 2021. Used car prices just dropped 2.3% in a month and are now down 14% YOY.
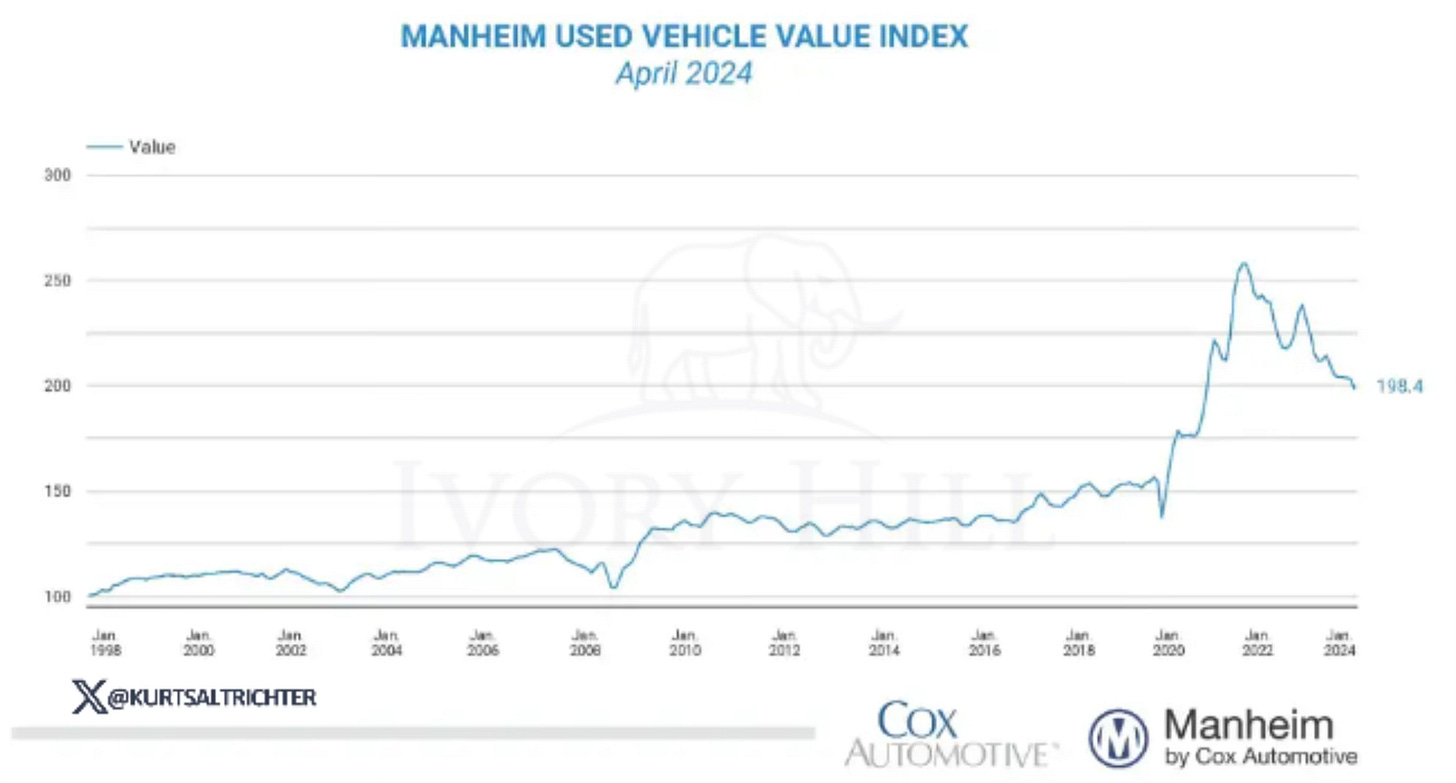
This marks a 23% drawdown from the used vehicles price peak. How long before we see this hit pre-pandemic levels?
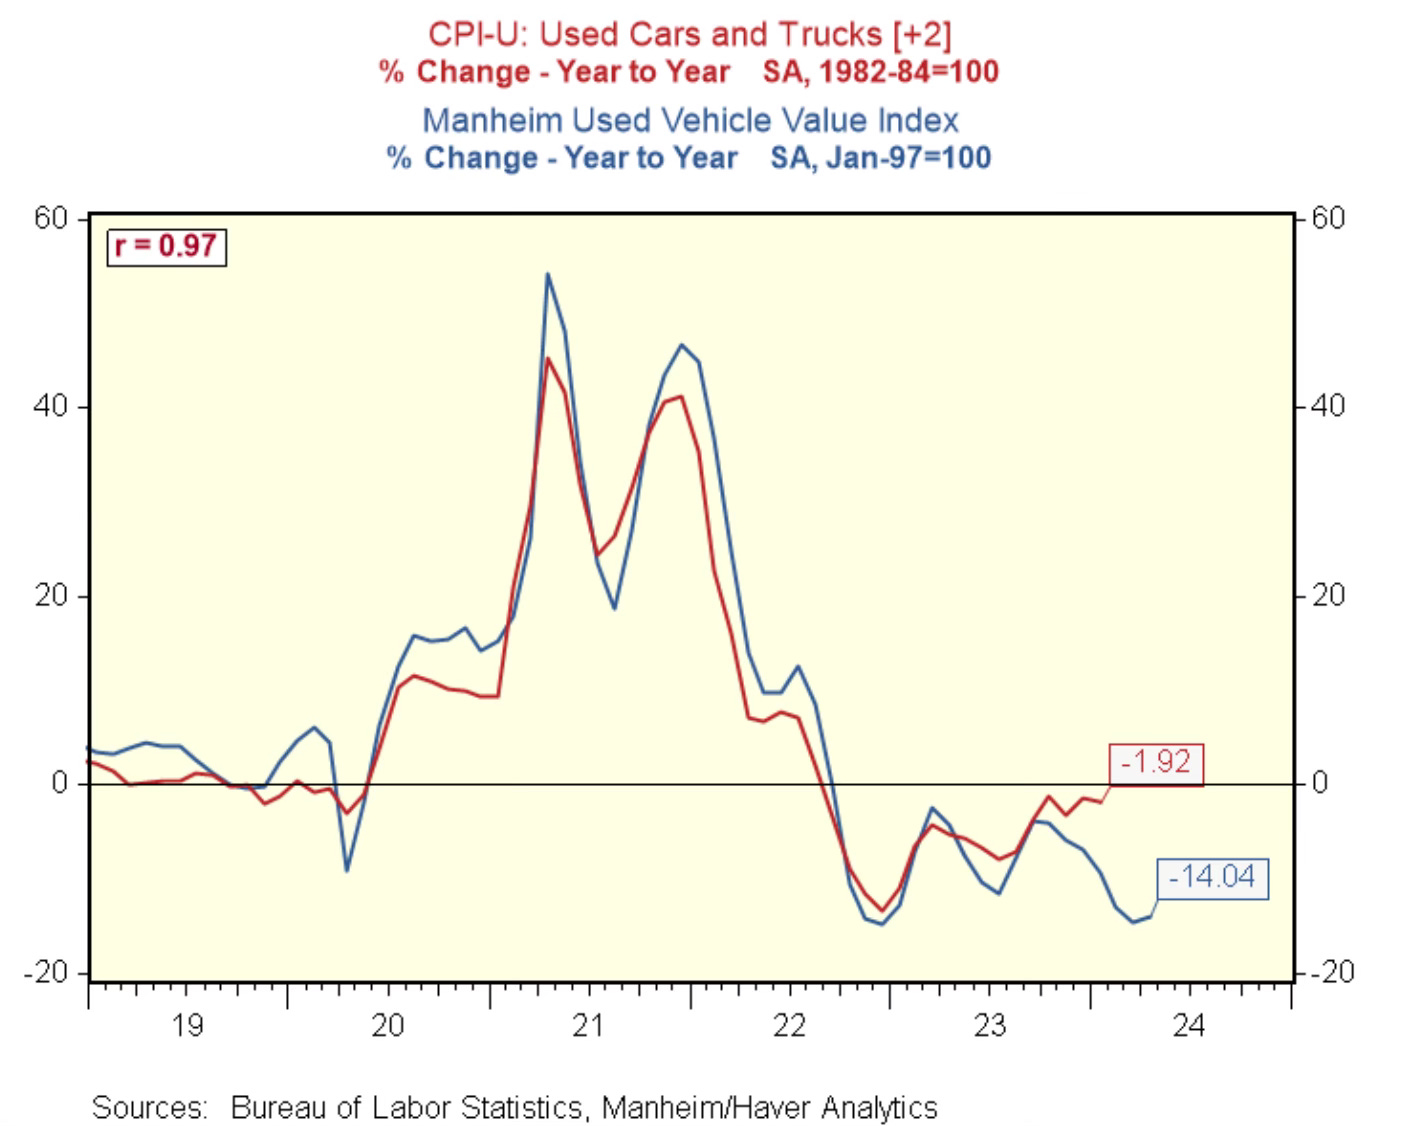
RenMac made a great observation with this relative to CPI data.
Notably, as of March, used car and truck prices in CPI are only off about 2% against last year. Given the Manheim auction data, perhaps this means there is additional downside to the CPI measure in the months ahead.
This decrease in used auto pricing will also help what has led the inflation data this year, auto insurance costs.
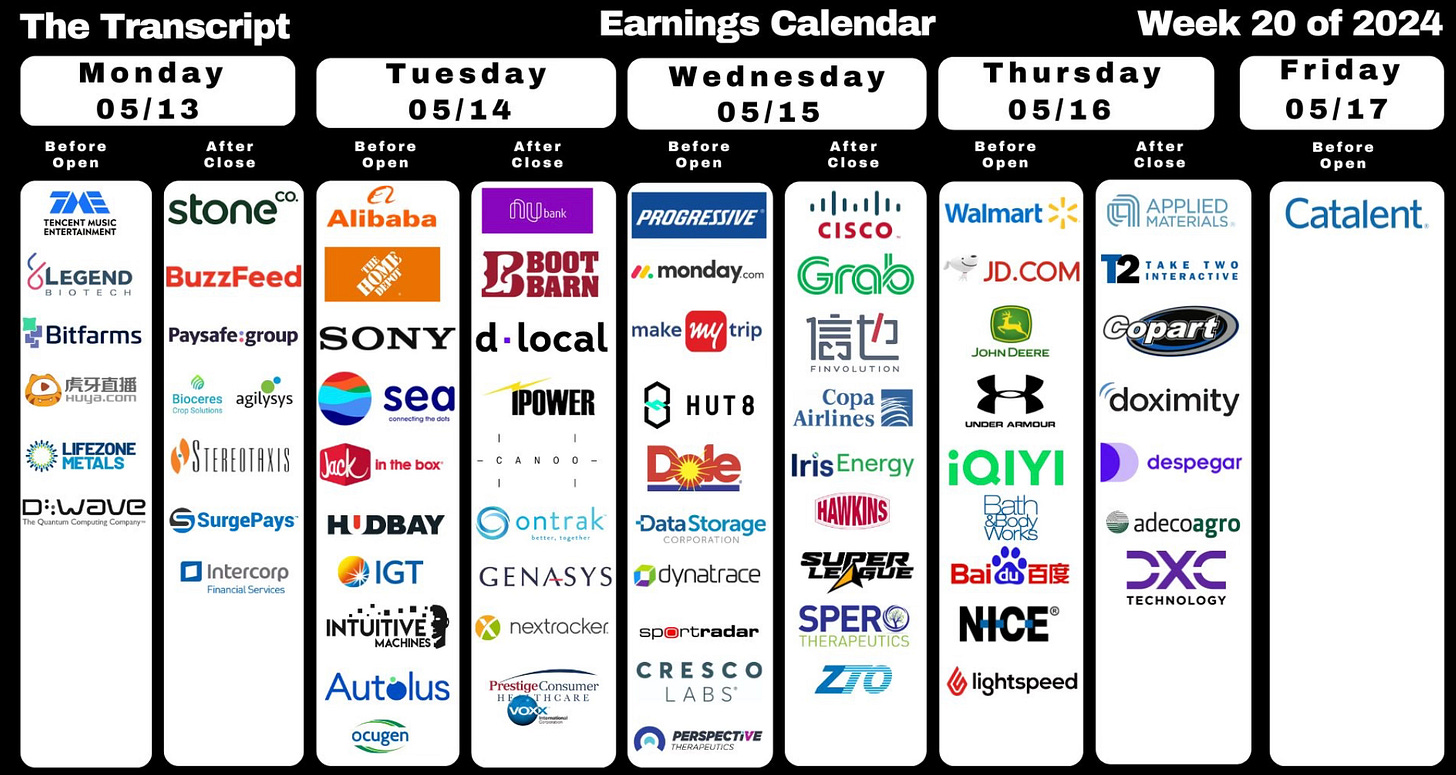
Upcoming Earnings & Data

The Coffee Table ☕
Value Stock Geek who writes Security Analysis wrote a timely post as we enter election season called Politics Ruins Portfolios. He spoke from his experience when you combine your portfolio and politics. It never mixes well.
Blair duQuesnay had a good piece called Sins of the Brokers, where she discusses what she’s seeing in the financial planning space. It’s a good reminder to be on alert, ask questions and do thorough reviews of whoever is managing your money, as well as where and what it’s invested in.
I think this was one of the more interesting pieces I have read in sometime. It’s called Why I Don’t Invest in Real Estate and was written by Tomas Pueyo who writes Uncharted Territories. It’s in depth with a lot of data and charts about the future of real estate investing. I don’t agree with everything he writes but it makes you look at it from another point of view. It’s long but worth the time reading.
With a steady stream of negativity and stagflation talk, Ryan Detrick had a good post on the other side of that called Six Reasons This Bull Market Is Alive and Well. Ryan is about as plugged into the data as anyone and when he writes a blog post, I make sure to read it.
Thank you for reading! If you enjoyed Spilled Coffee, please subscribe.
Spilled Coffee grows through word of mouth. Please consider sharing this post with someone who might appreciate it.
Order my book, Two-Way Street below.

