Investing Update: A Mag 7 Stock Set To Surge
What I'm buying, selling & watching
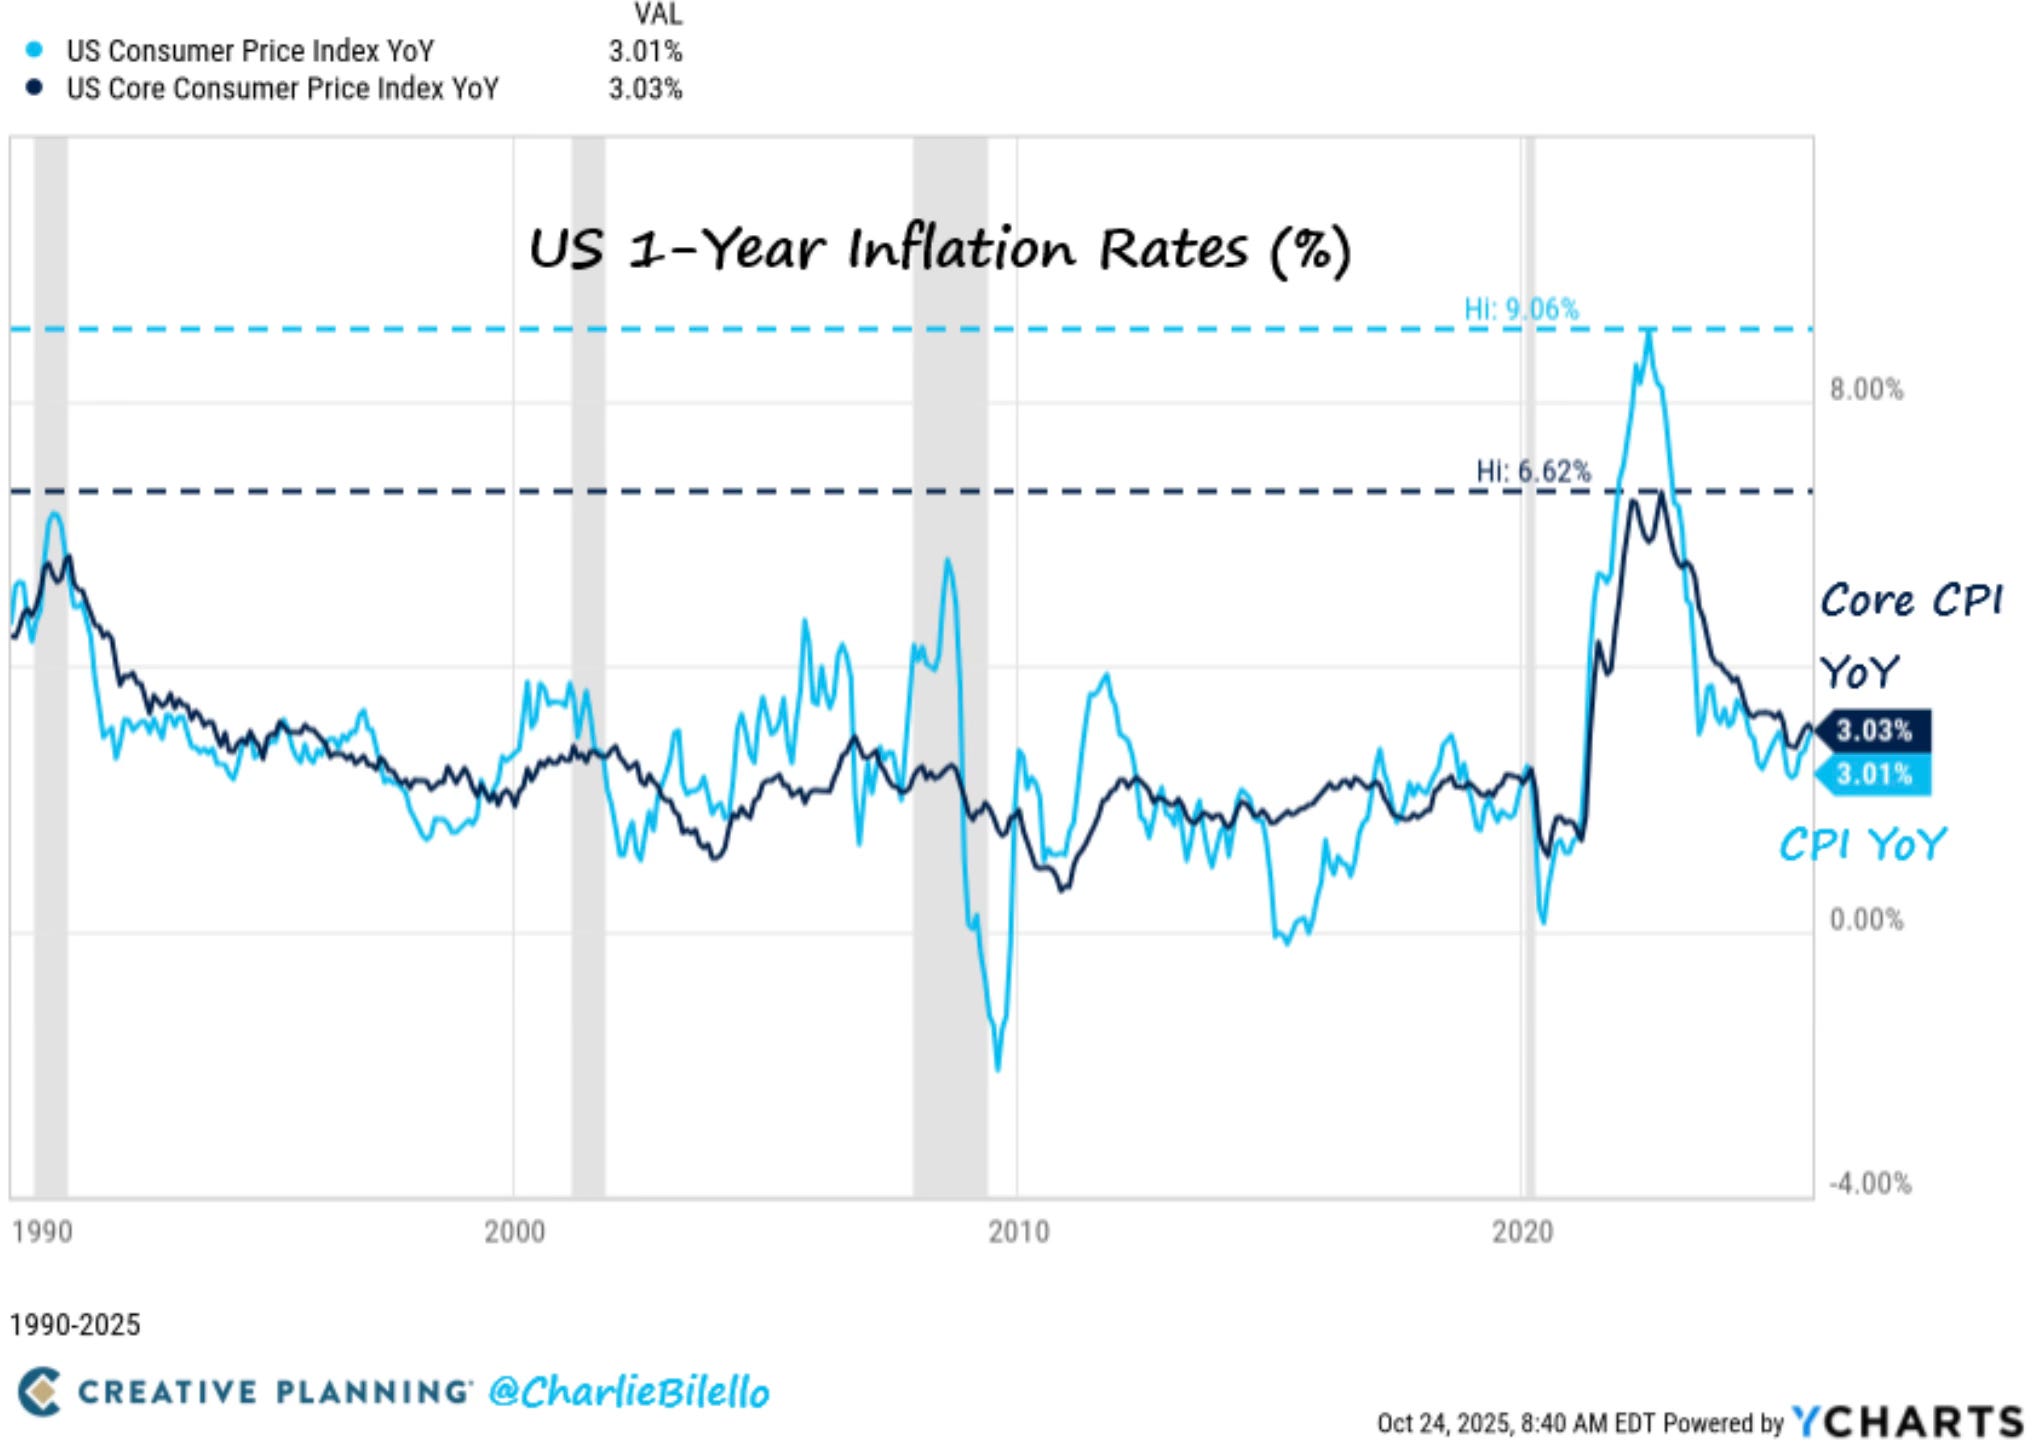
Better than expected inflation data on Friday pushed the stock market to new all-time highs.
For September, U.S. CPI rose 3.0% year over year — the highest level in 16 months, but slightly below expectations for a 3.1% increase.
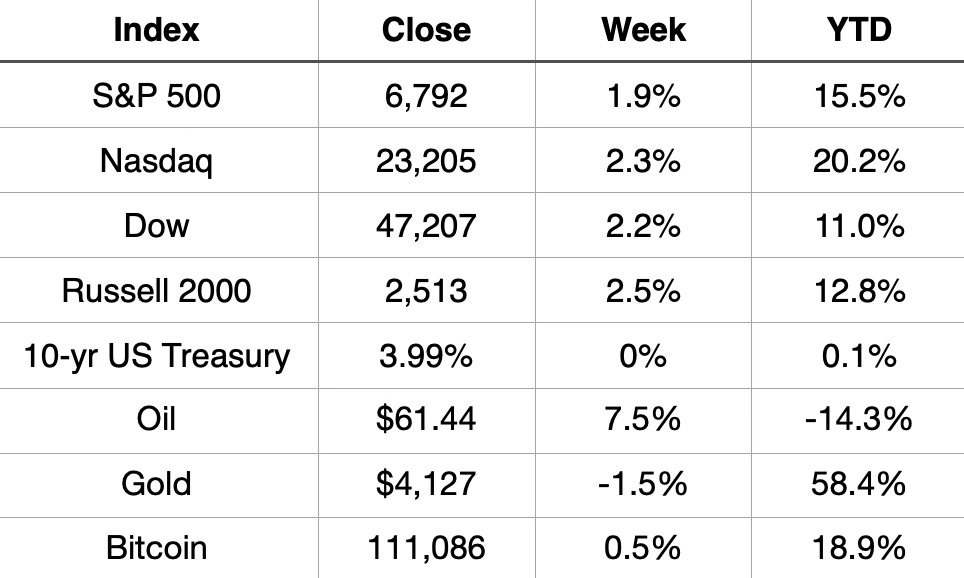
The better inflation data helped lift the stock market to its third positive week in the past four for the major indices. For the first time ever, the Dow crossed 47,000. The Dow, S&P 500, and Nasdaq all ended the week at new all-time highs.
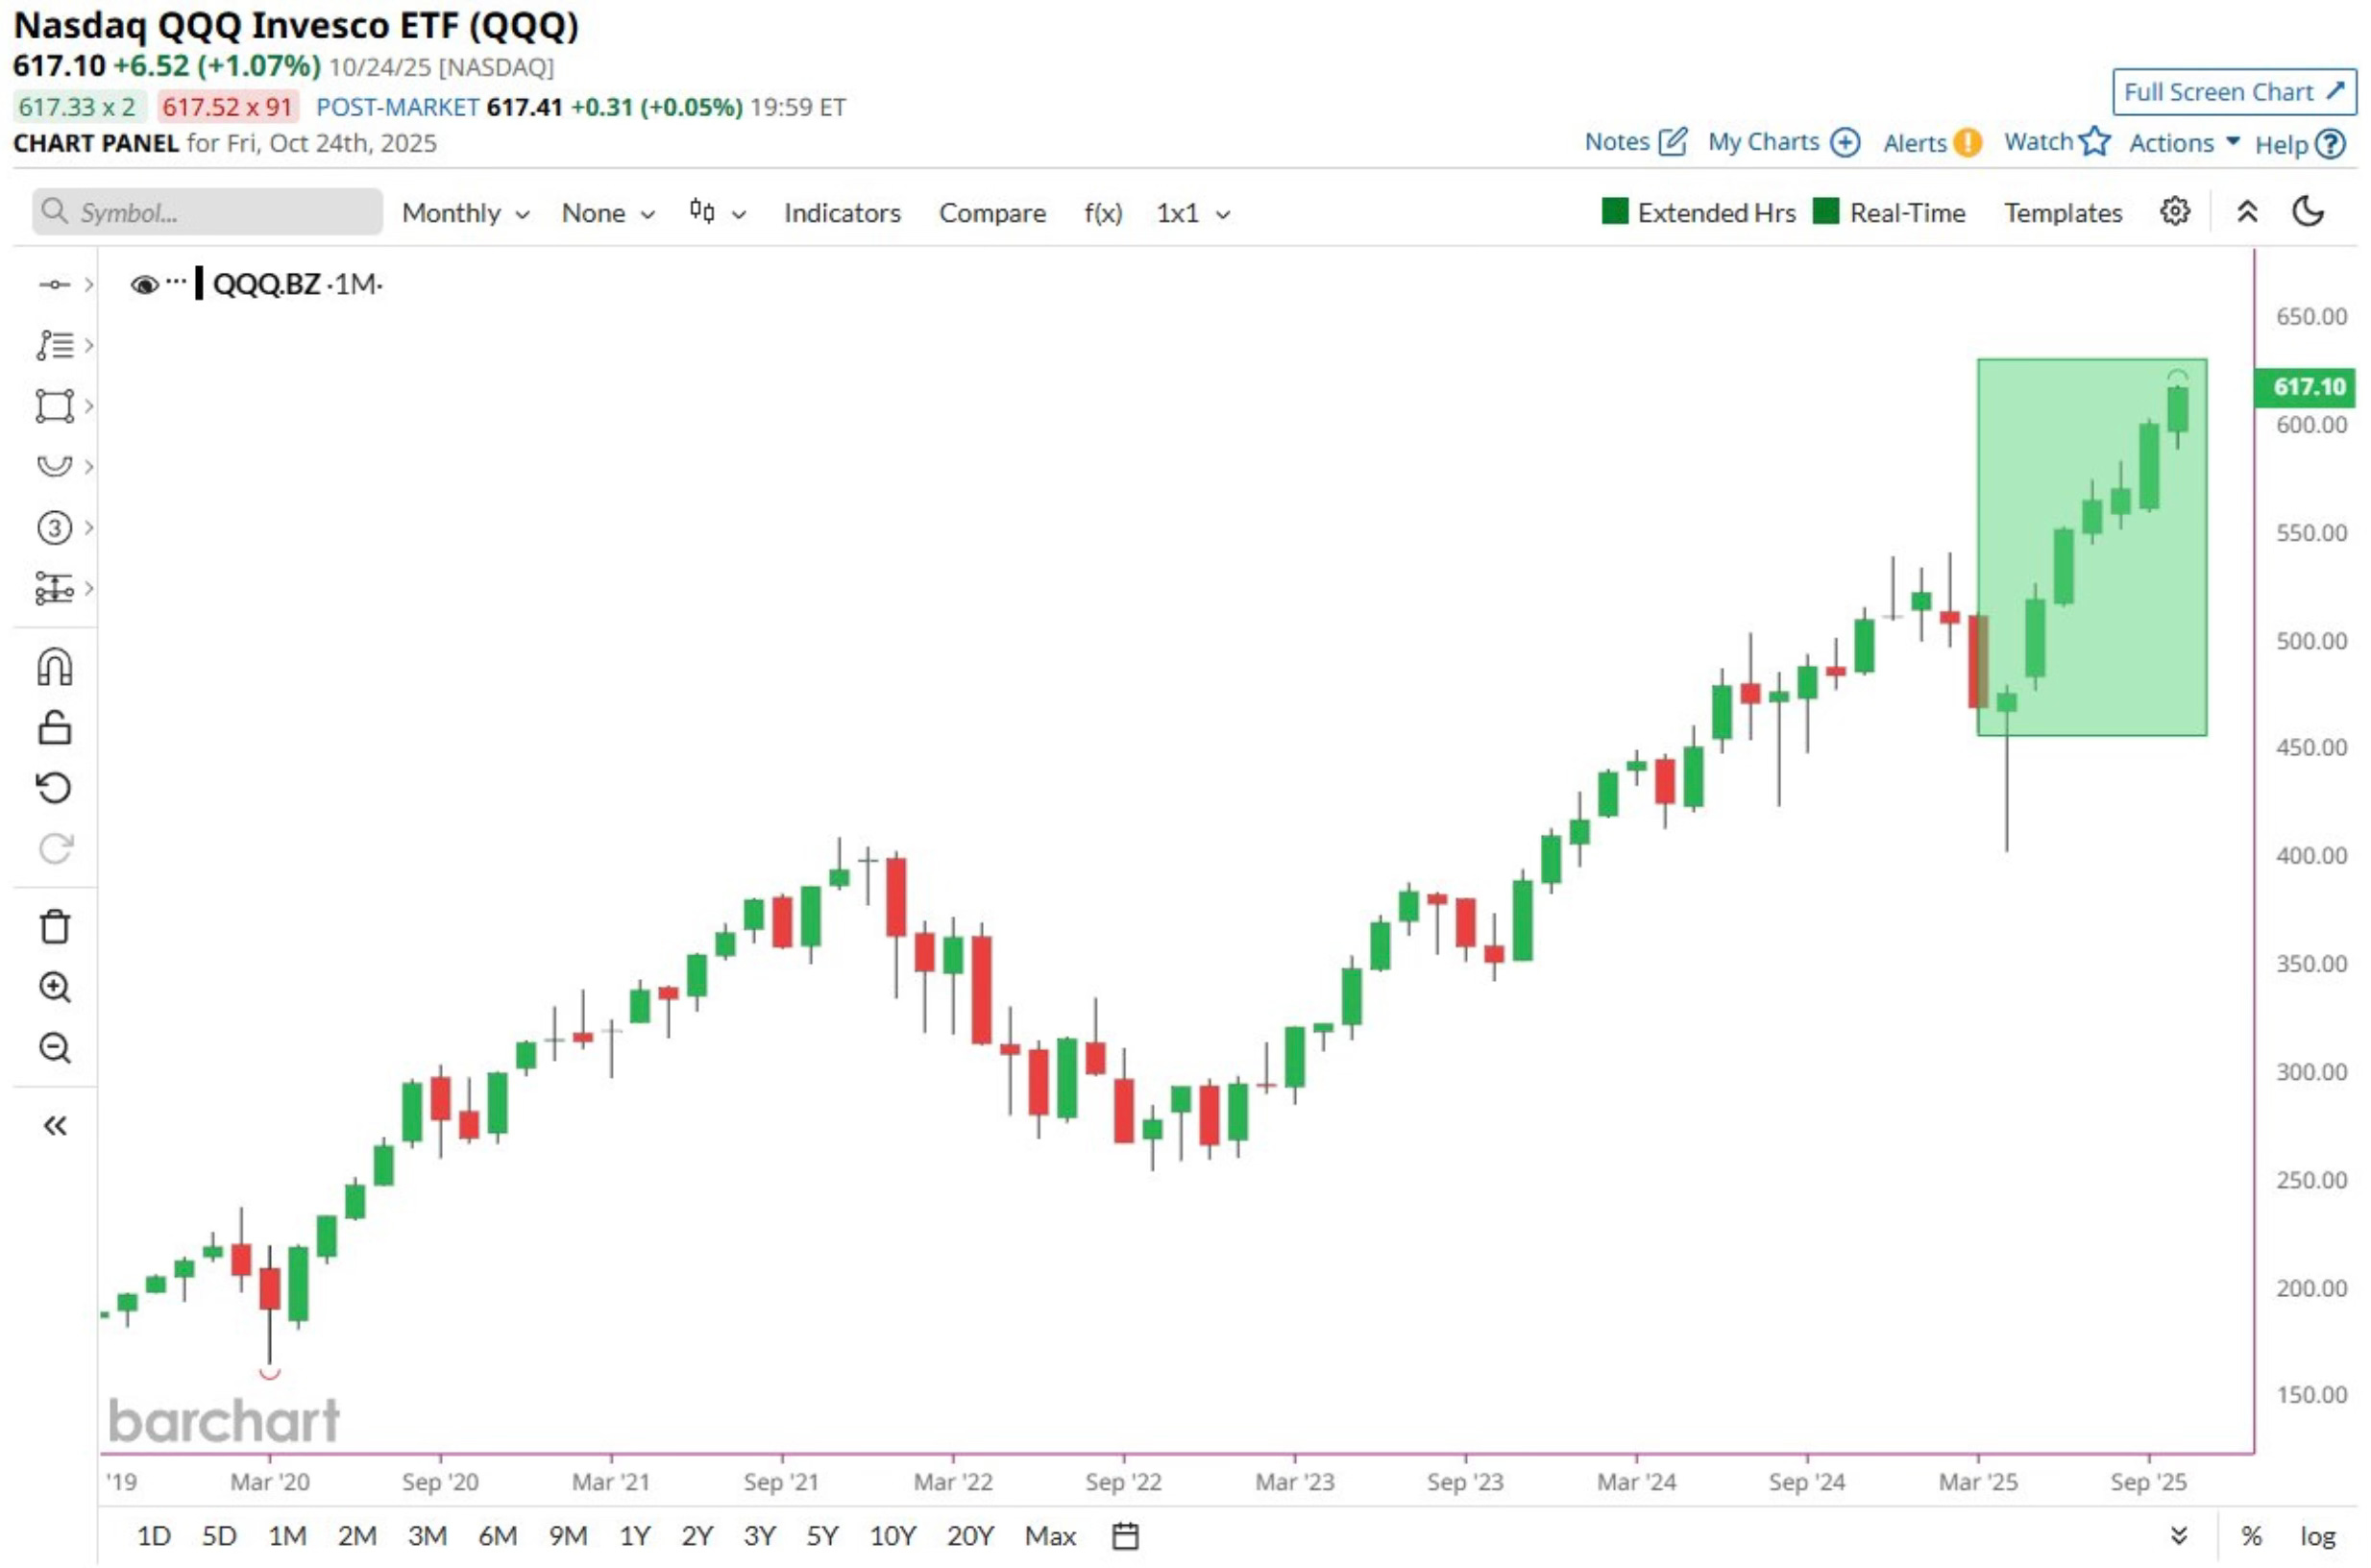
The Nasdaq is now on pace for its seventh straight positive month, its longest winning streak since 2016–2017.
Market Recap
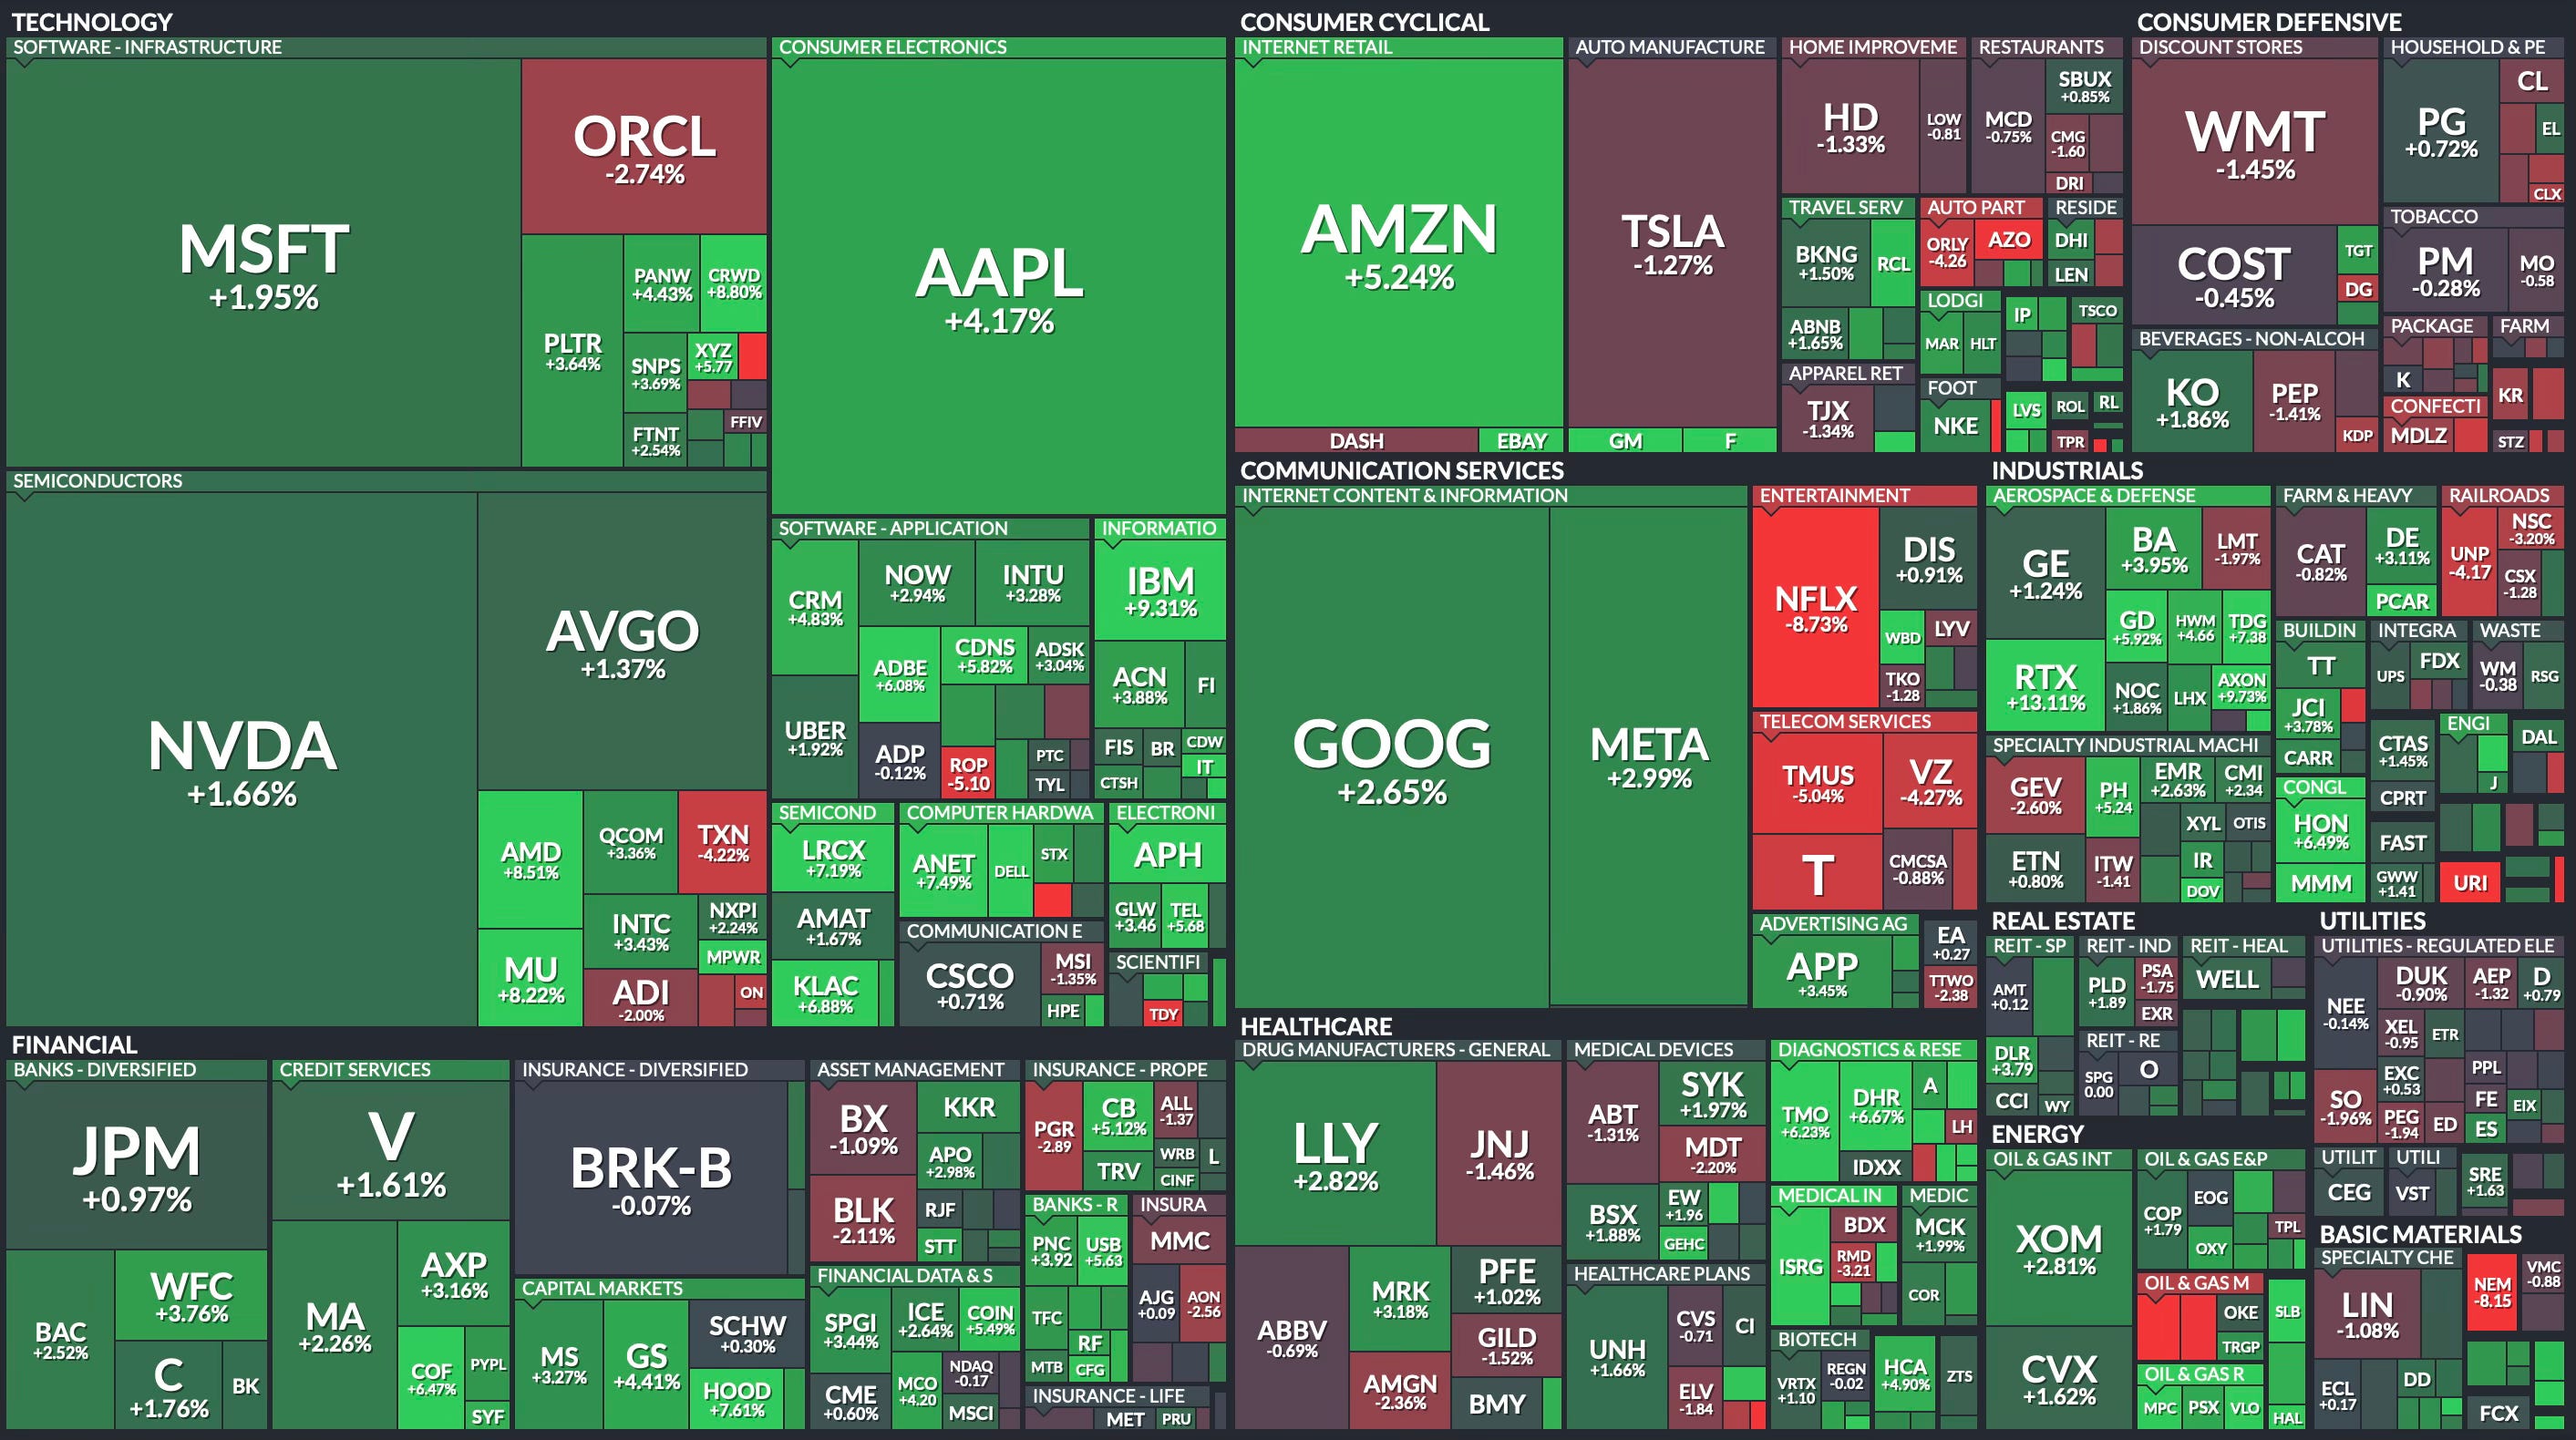
Weekly Heat Map Of Stocks
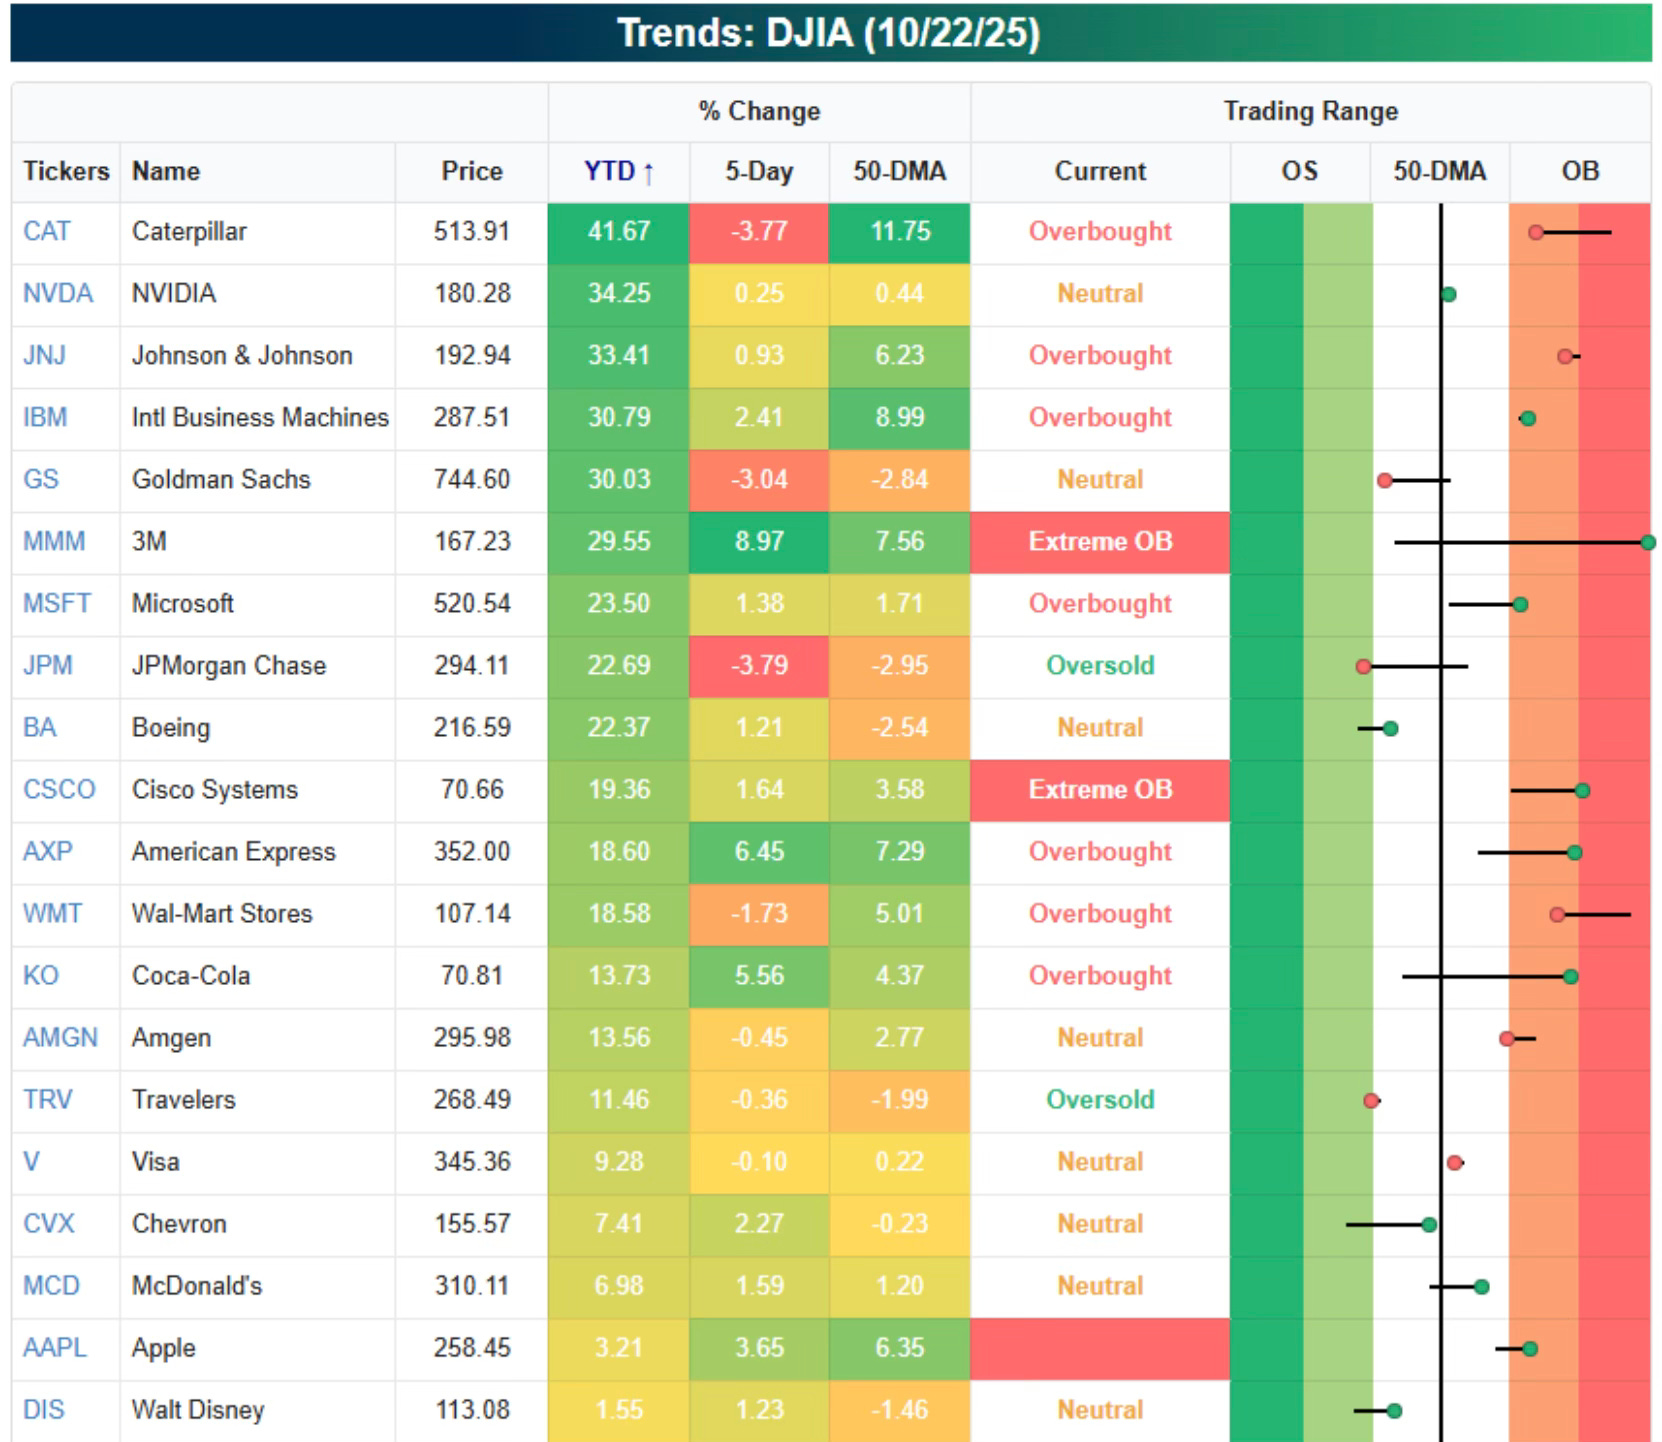
Dow Stocks YTD
20 of the 30 Dow stocks are up YTD. Caterpillar and Nvidia lead the way. Apple and Disney are the biggest laggards.
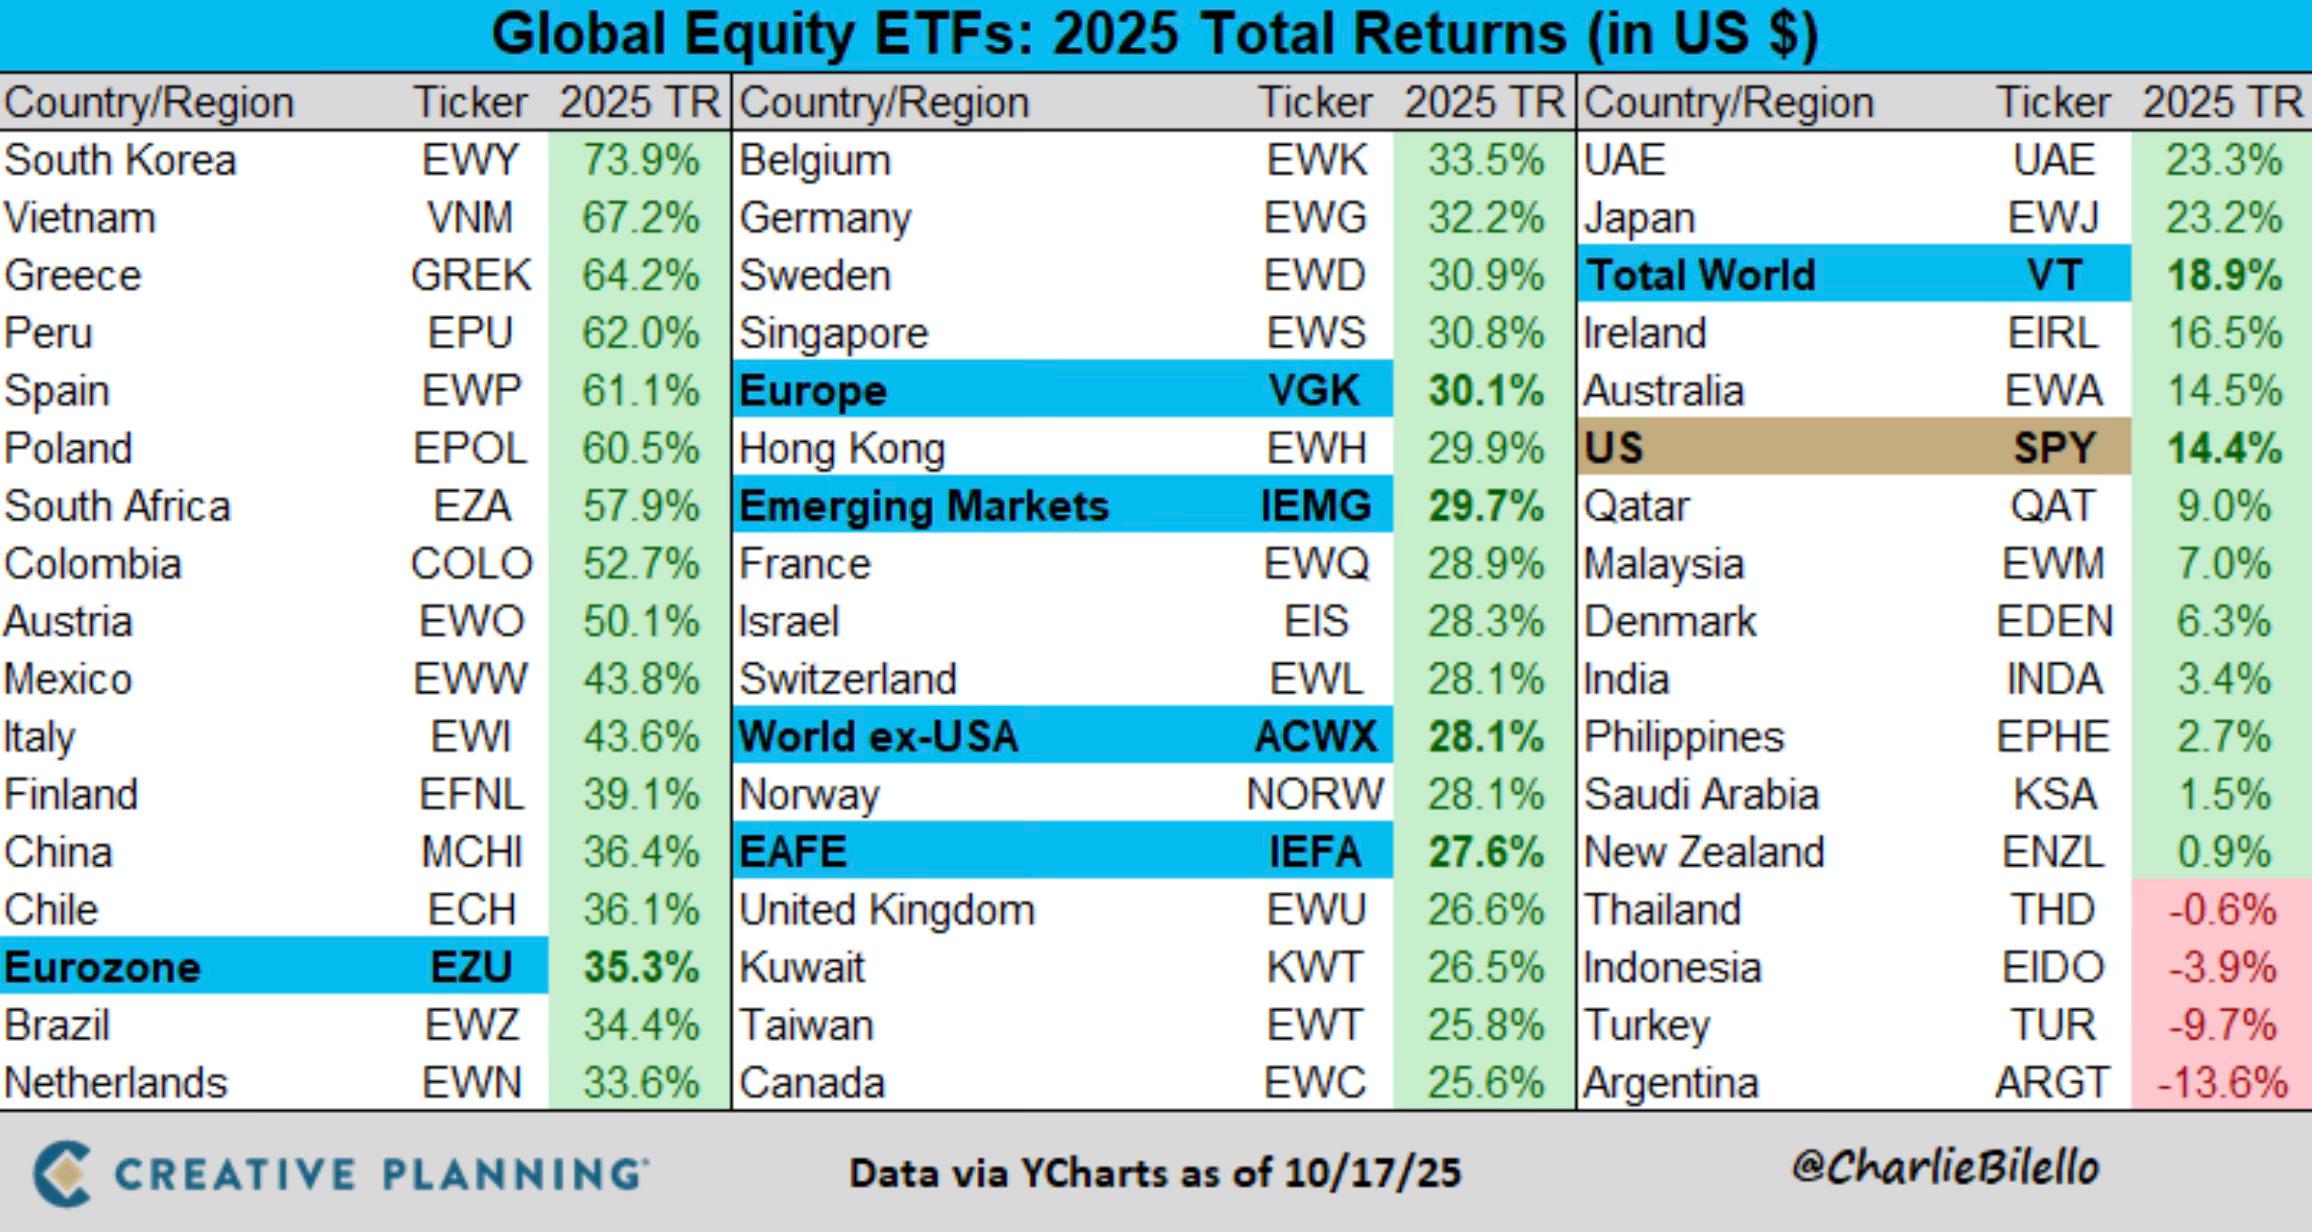
Global ETFs
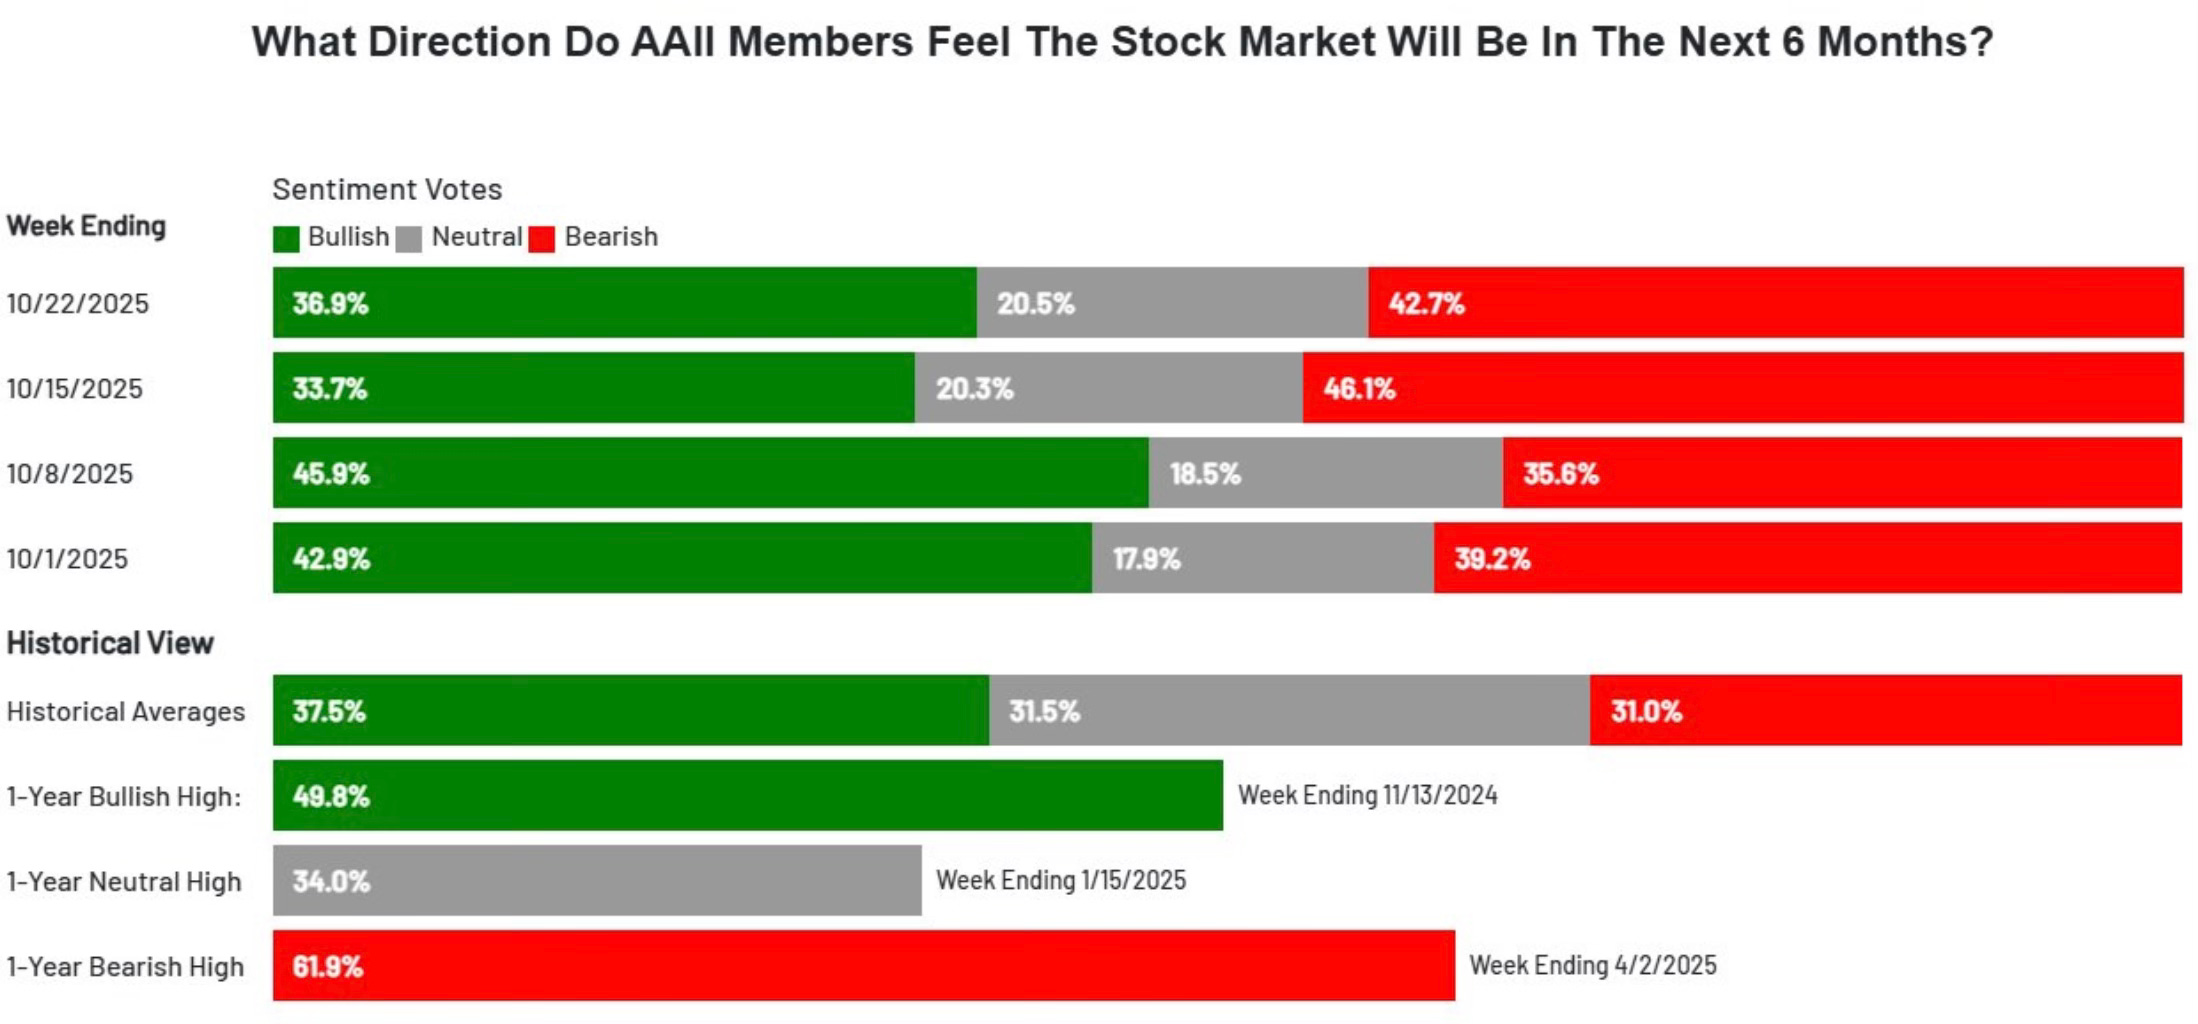
Despite new all-time highs, the AAII Investor Sentiment Survey still shows that there are more bears than bulls.
If you wanted one single signal as to why this bull market likely isn’t over, this is it.
The best month of the year for stocks is upcoming. November is historically the best month for the S&P 500 since 1950. Even over the past 10 years, it has also been the best month.
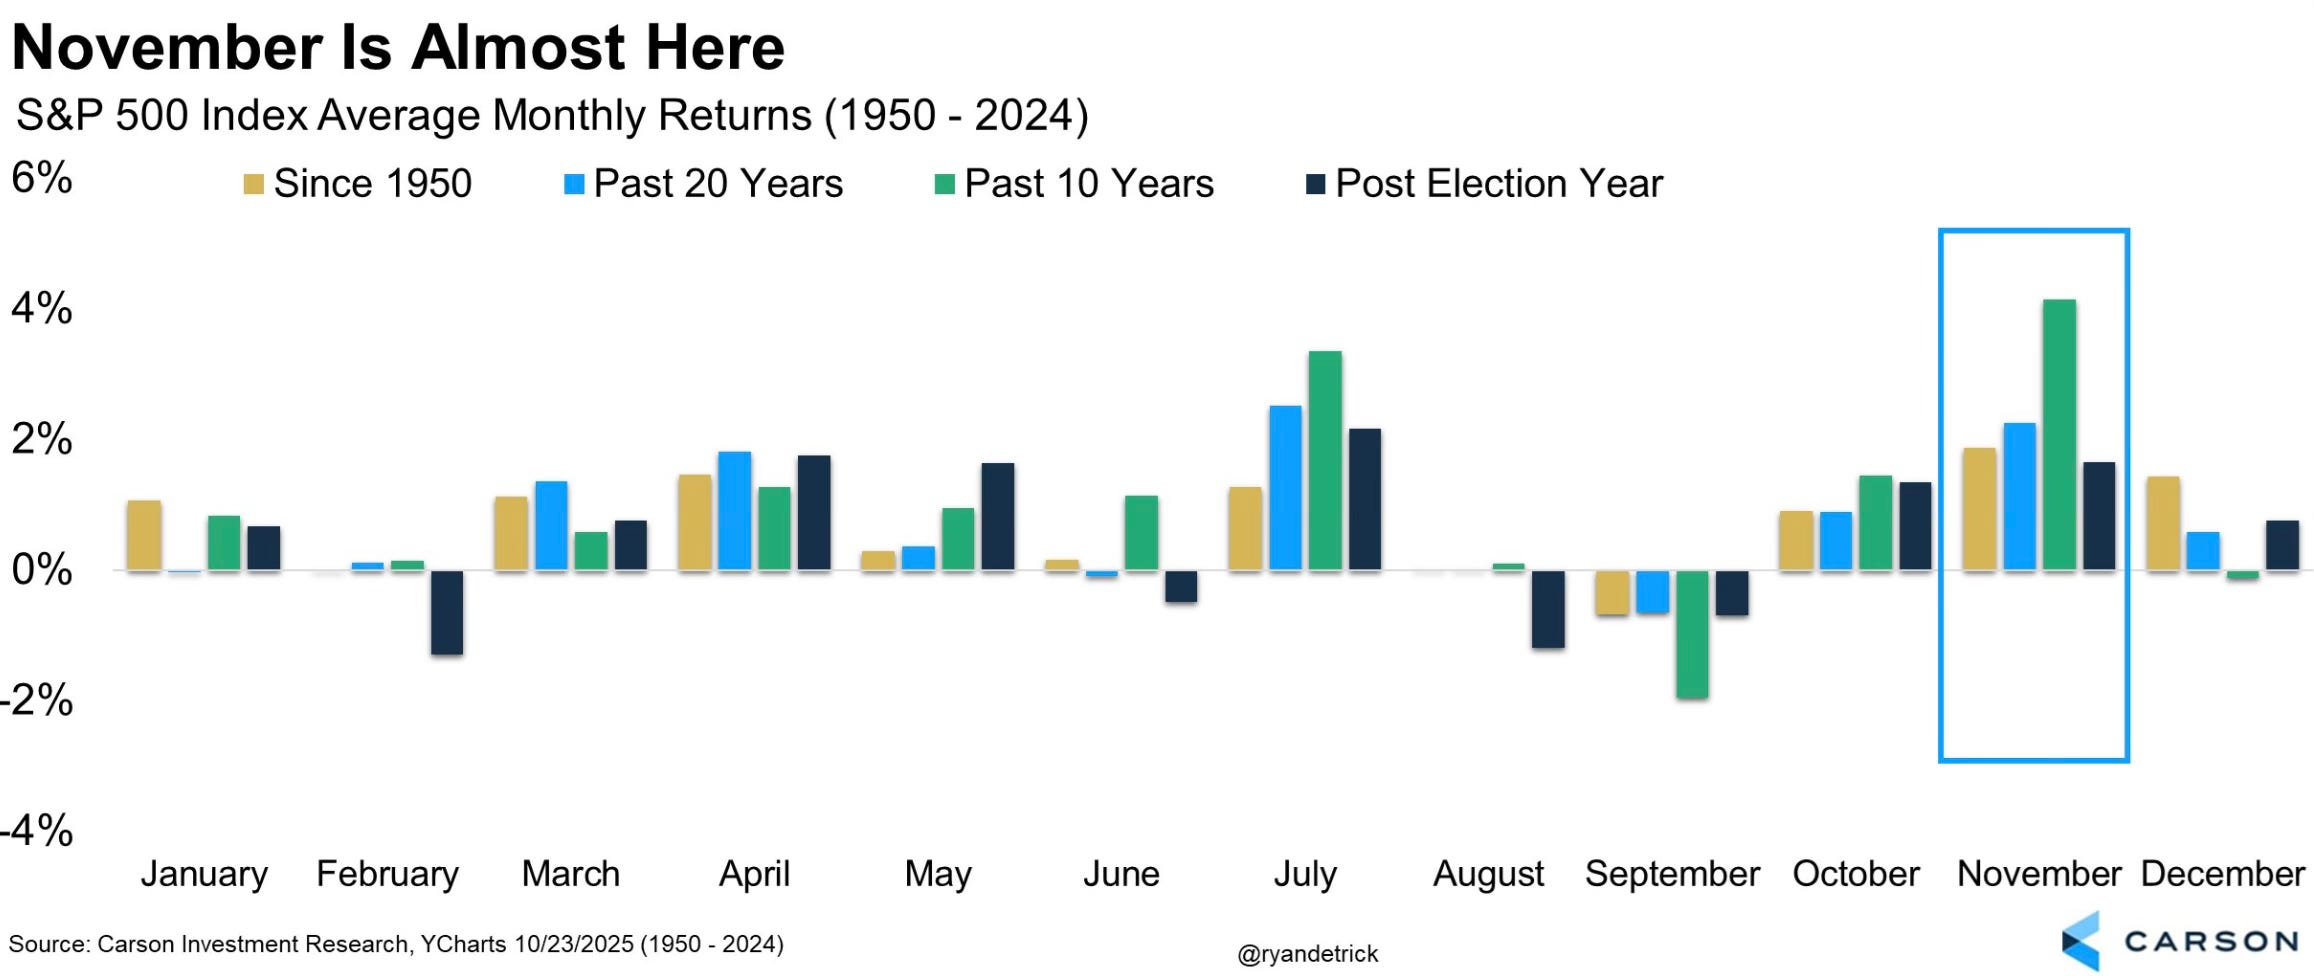
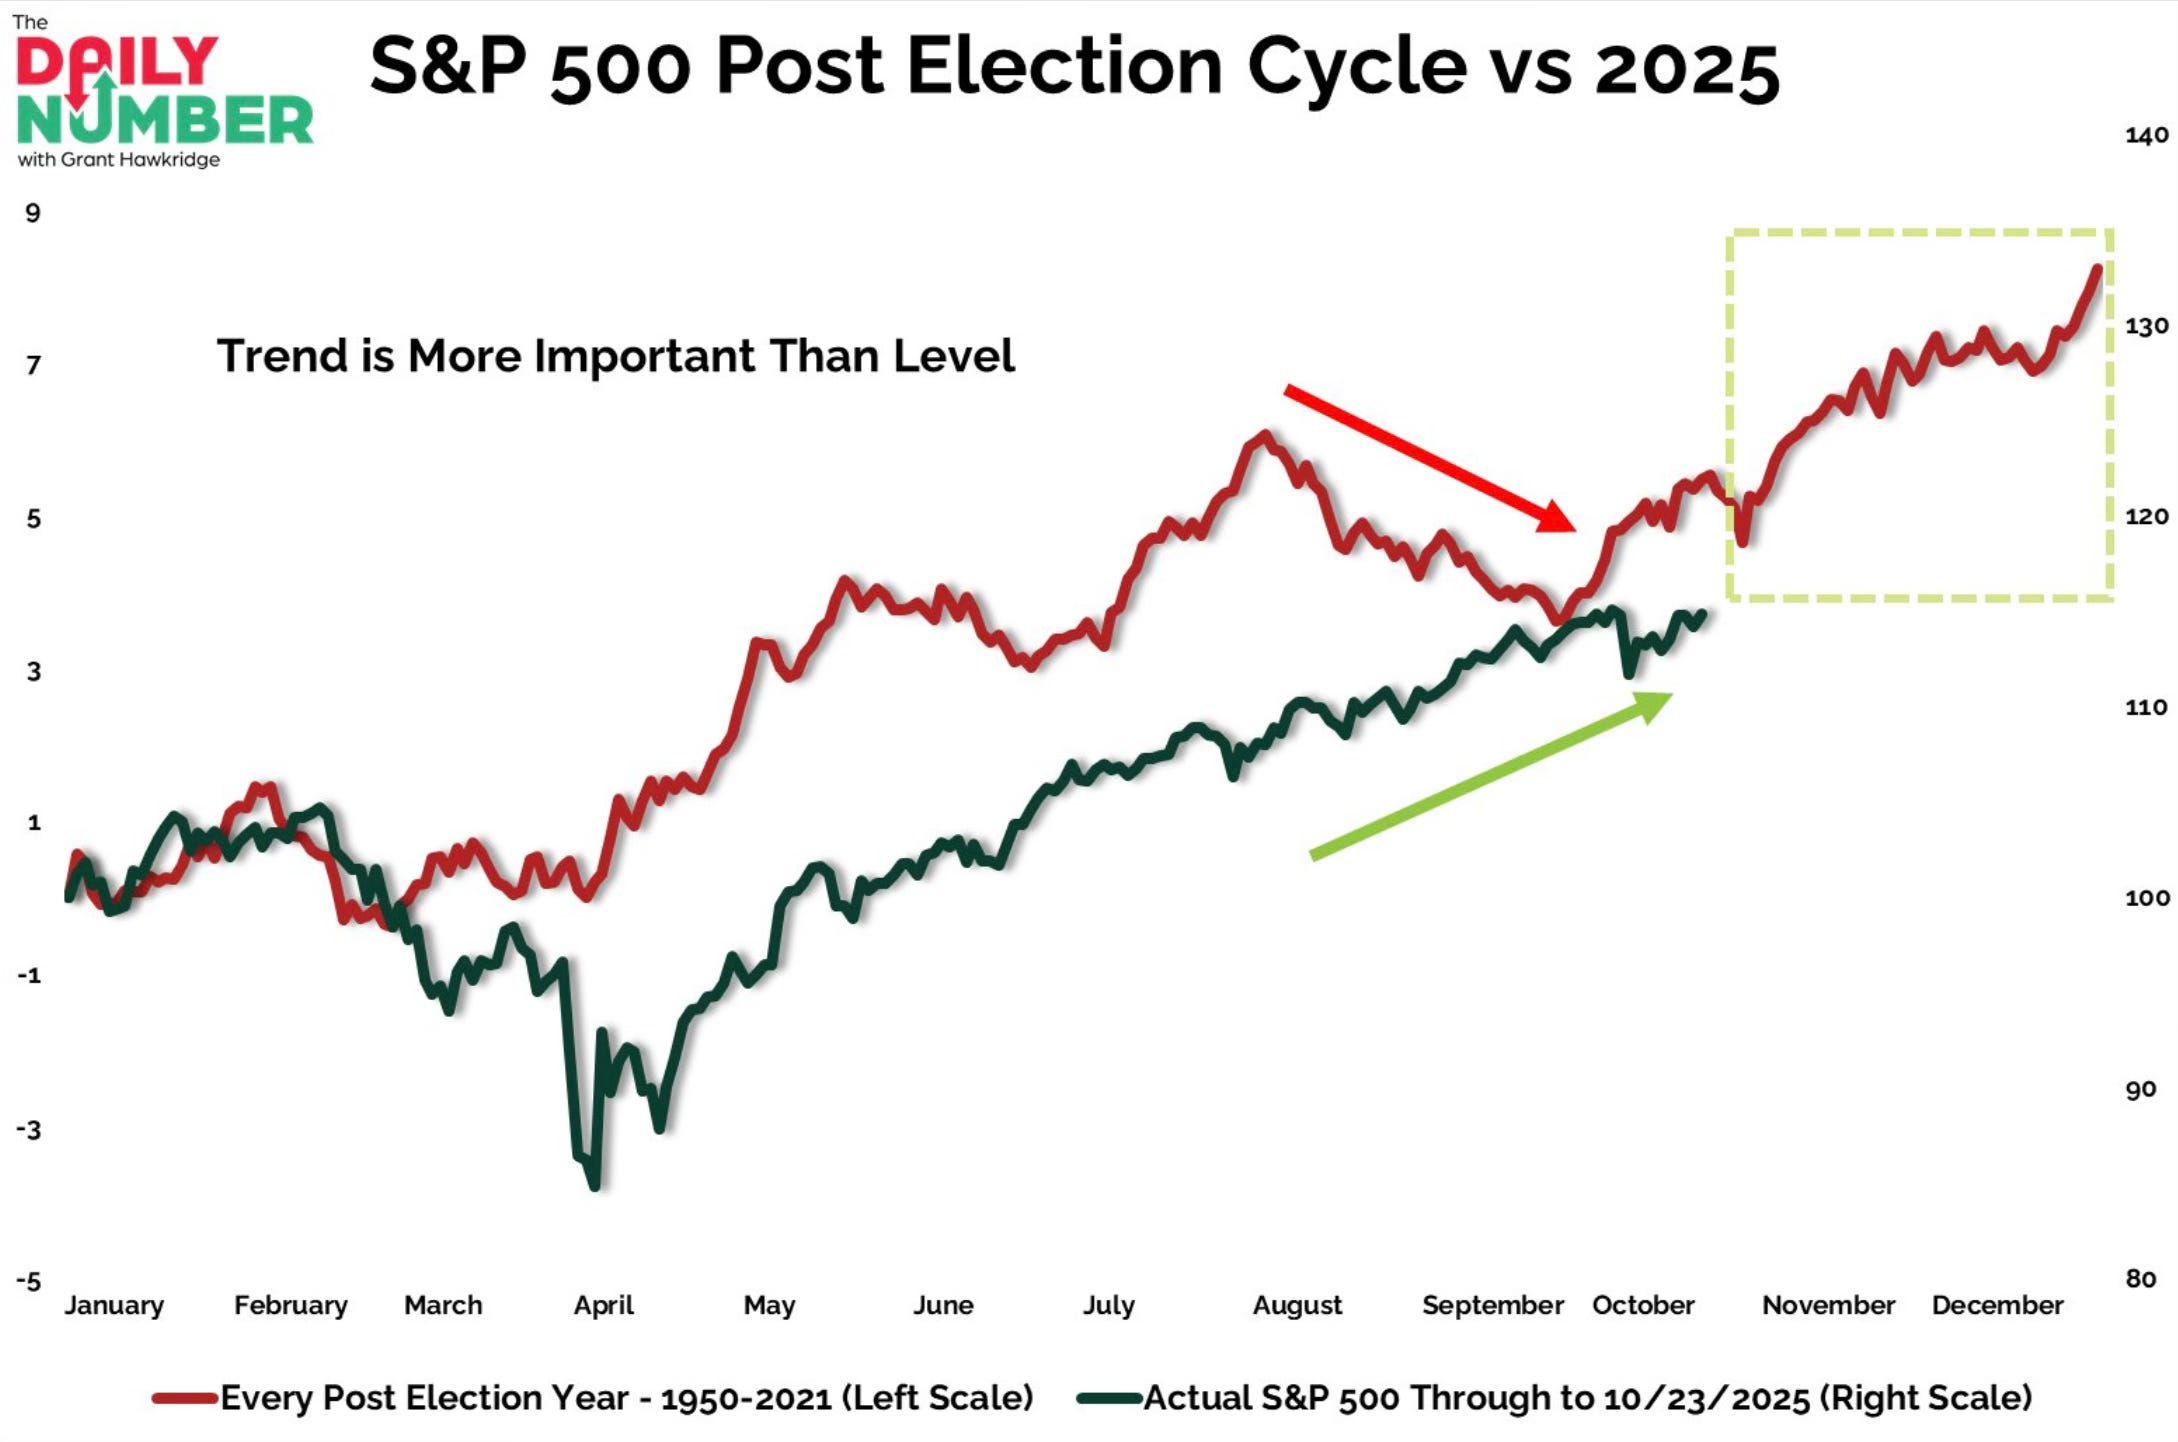
Even in this post election cycle, the traditionally weak period has held strong. We now have the strongest stretch of the year upcoming.
Why the strength at this time of the year?
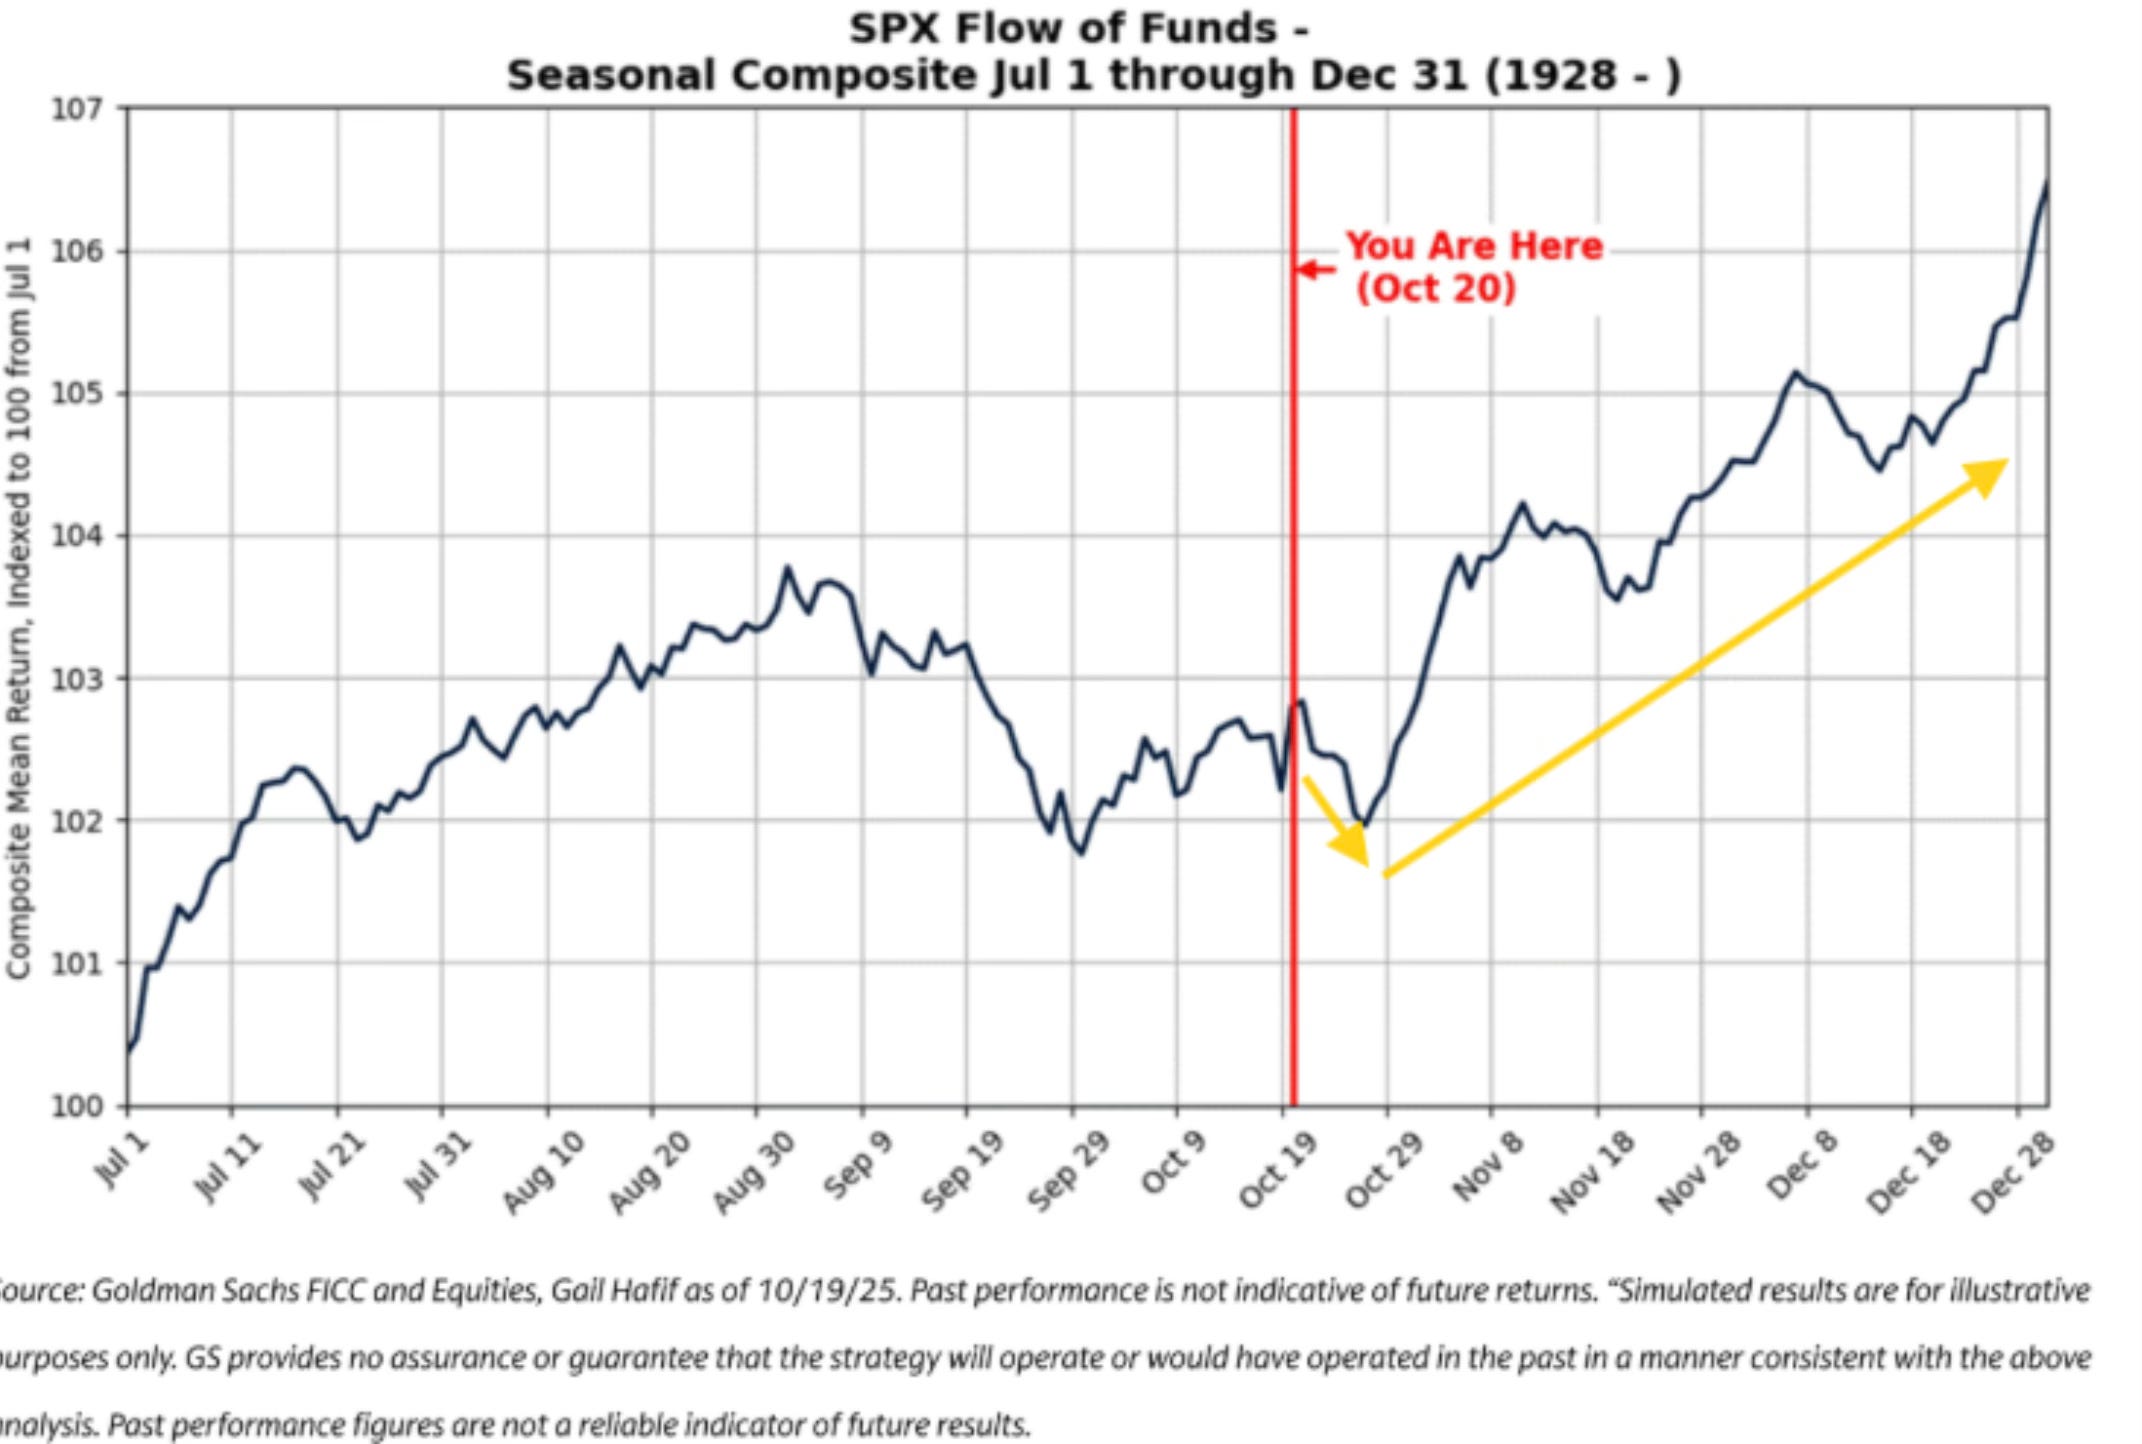
The year-end chasing is about to begin.
You can tell where we are at in the cycle and where the flow of funds historically goes from here dating back to 1928. A very clear chase into year-end.
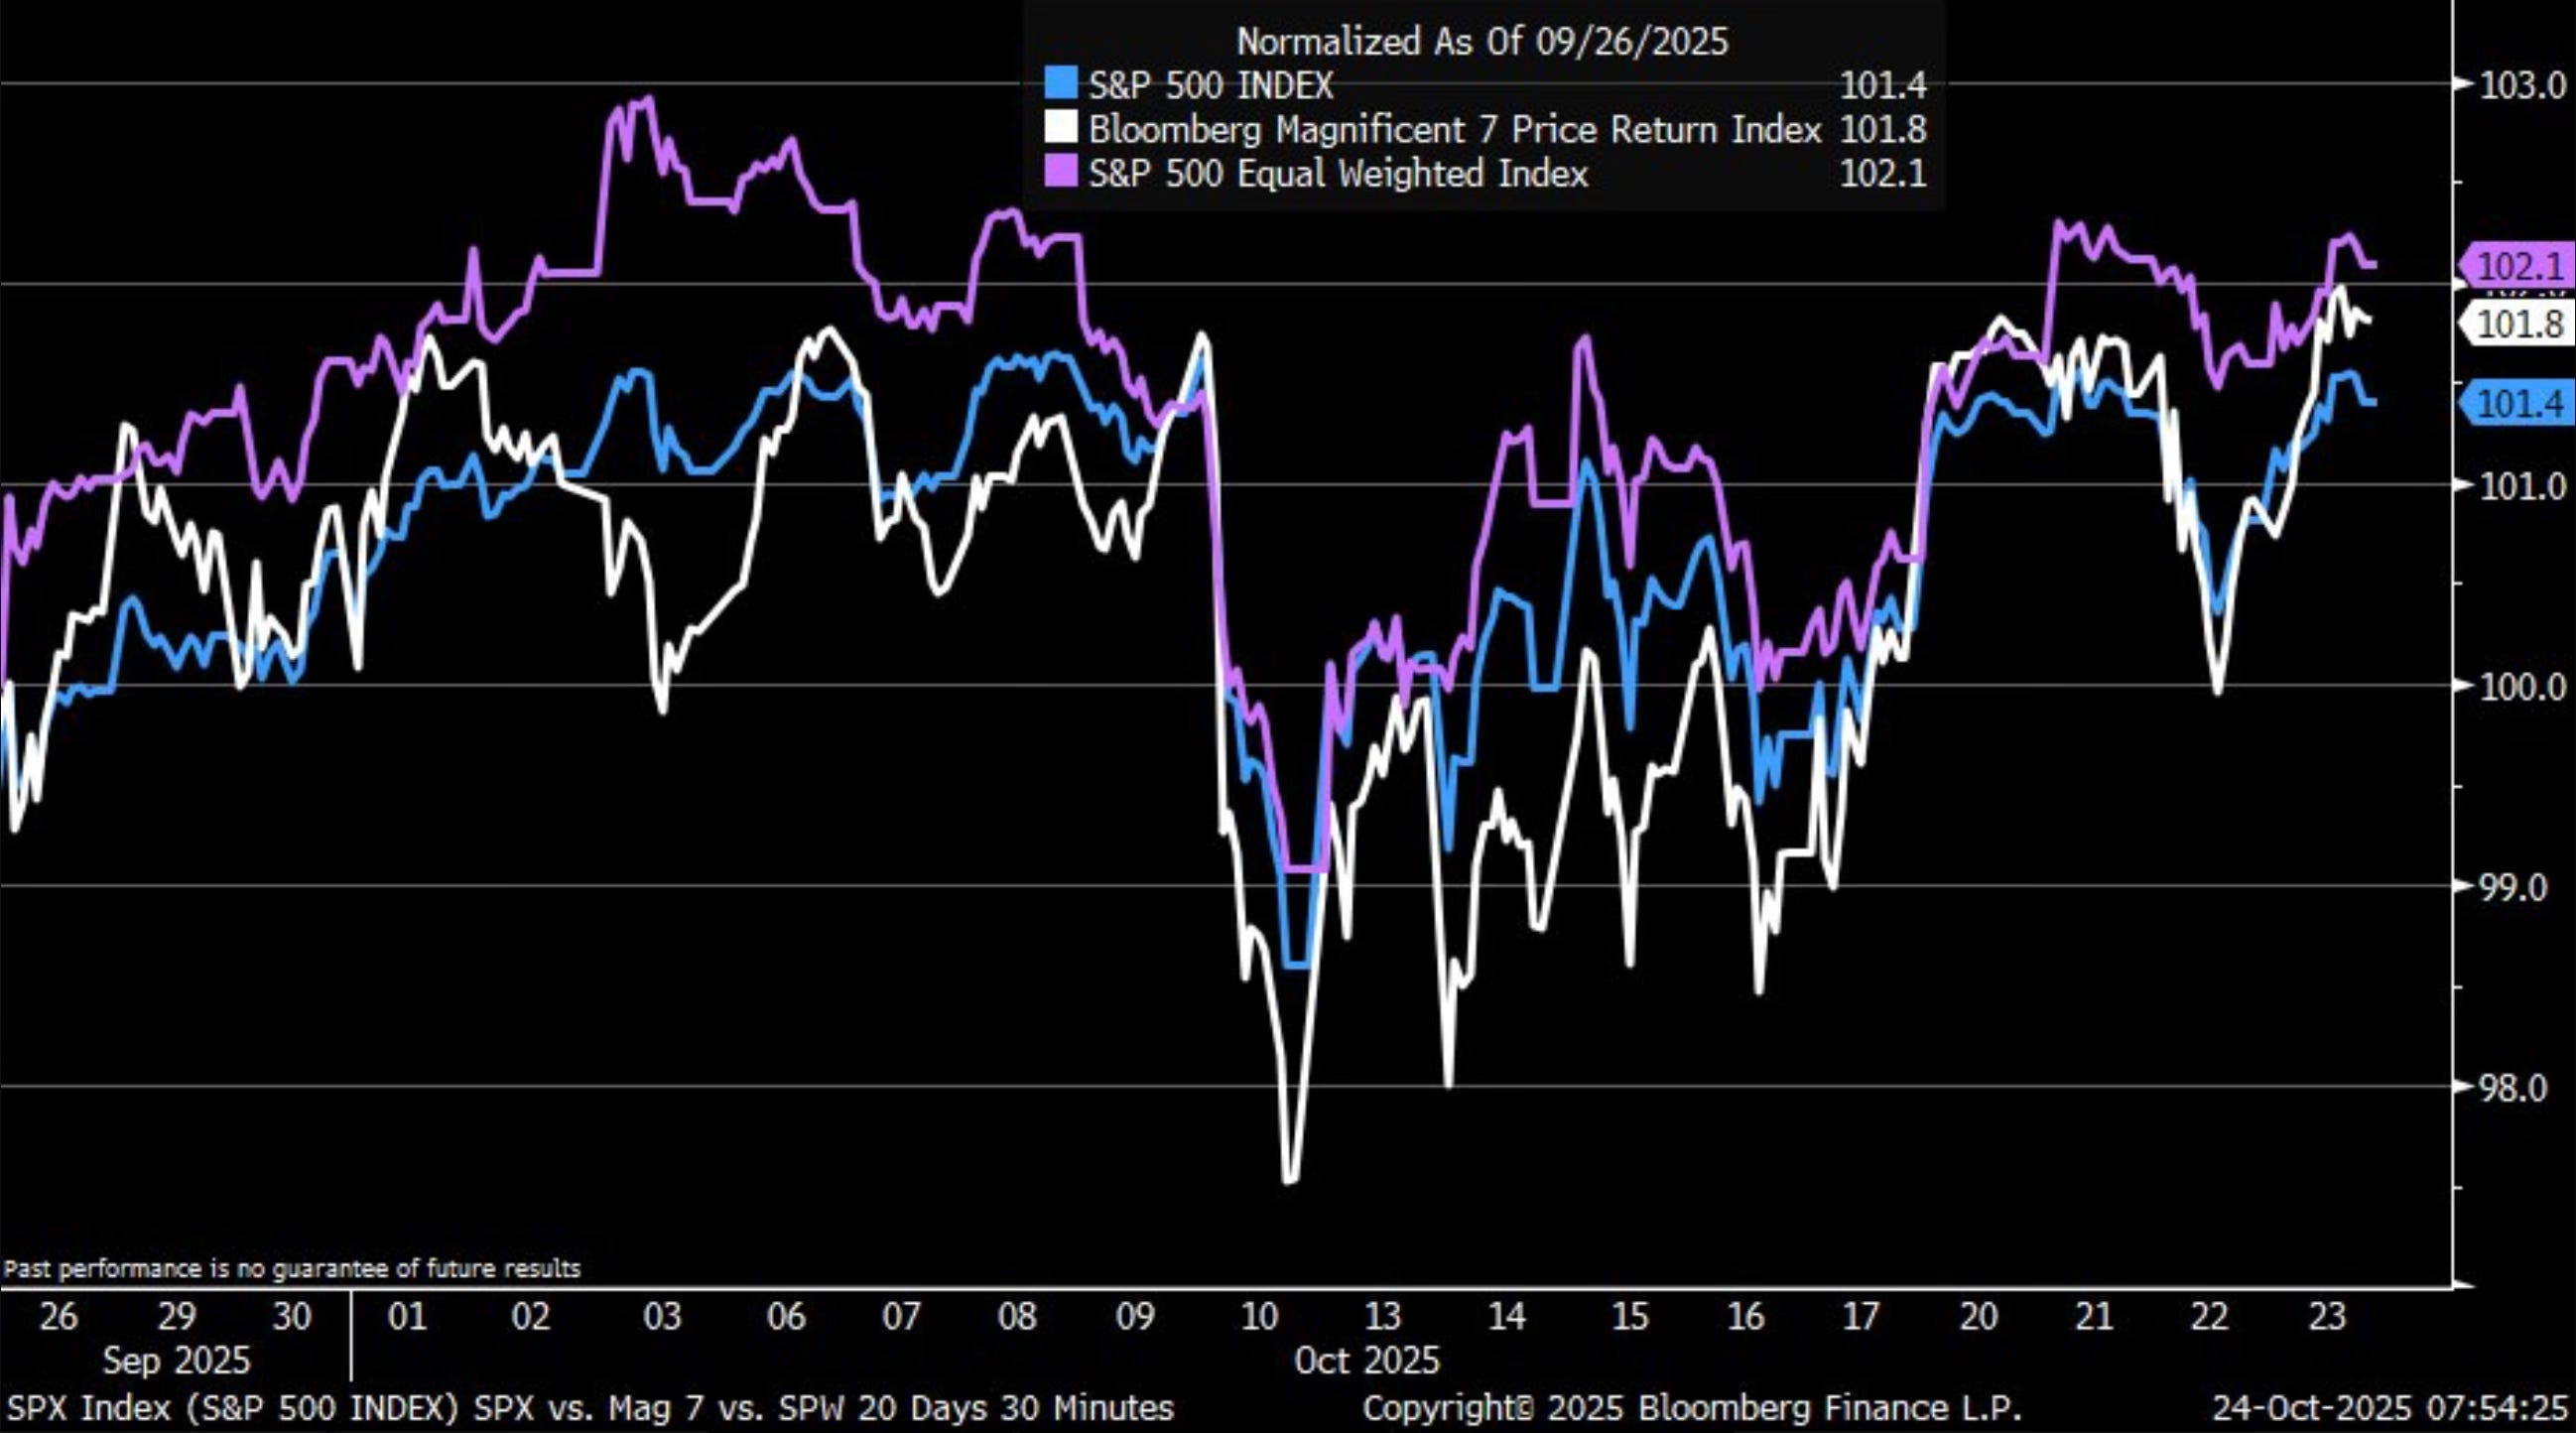
And if you need more proof that this rally isn’t being driven by just a handful of stocks, take a look at what’s been leading over the past month. The equal-weighted S&P 500, Nasdaq and Dow all just hit a new all-time high. The idea of narrow market leadership is another fallacy.