Investing Update: 5 Stocks For The 2nd Half
What I'm buying, selling & watching
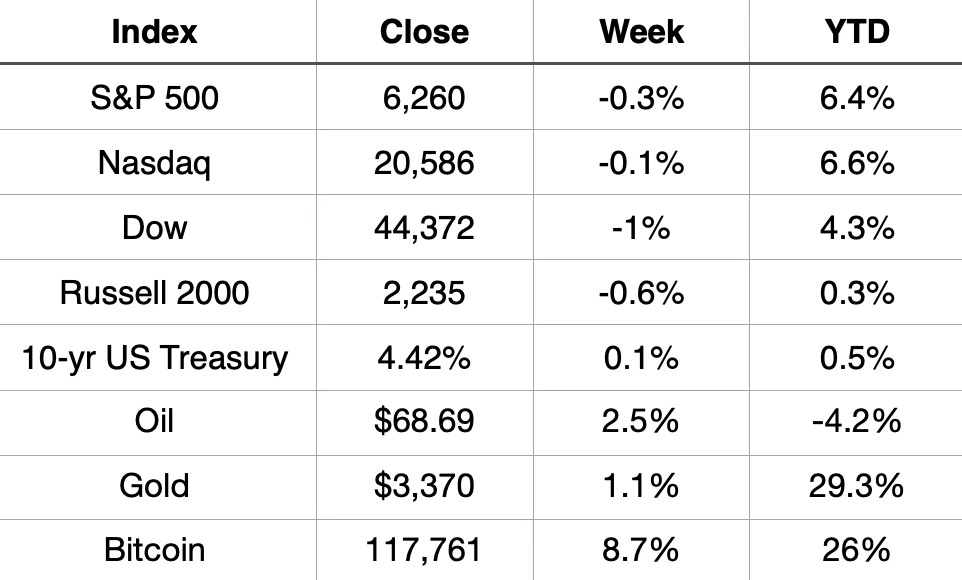
This week saw all three of the major indices slightly lower on the week.
Thursday was the highlight of the week as both the S&P 500 and bitcoin set new all-time highs on the same day. That was also the 5th S&P 500 record in the past 9 trading days. Quite a run.
YTD the S&P 500 and Nasdaq are both up over 6%. Gold is up 29.3% and Bitcoin is up 26%.
Market Recap
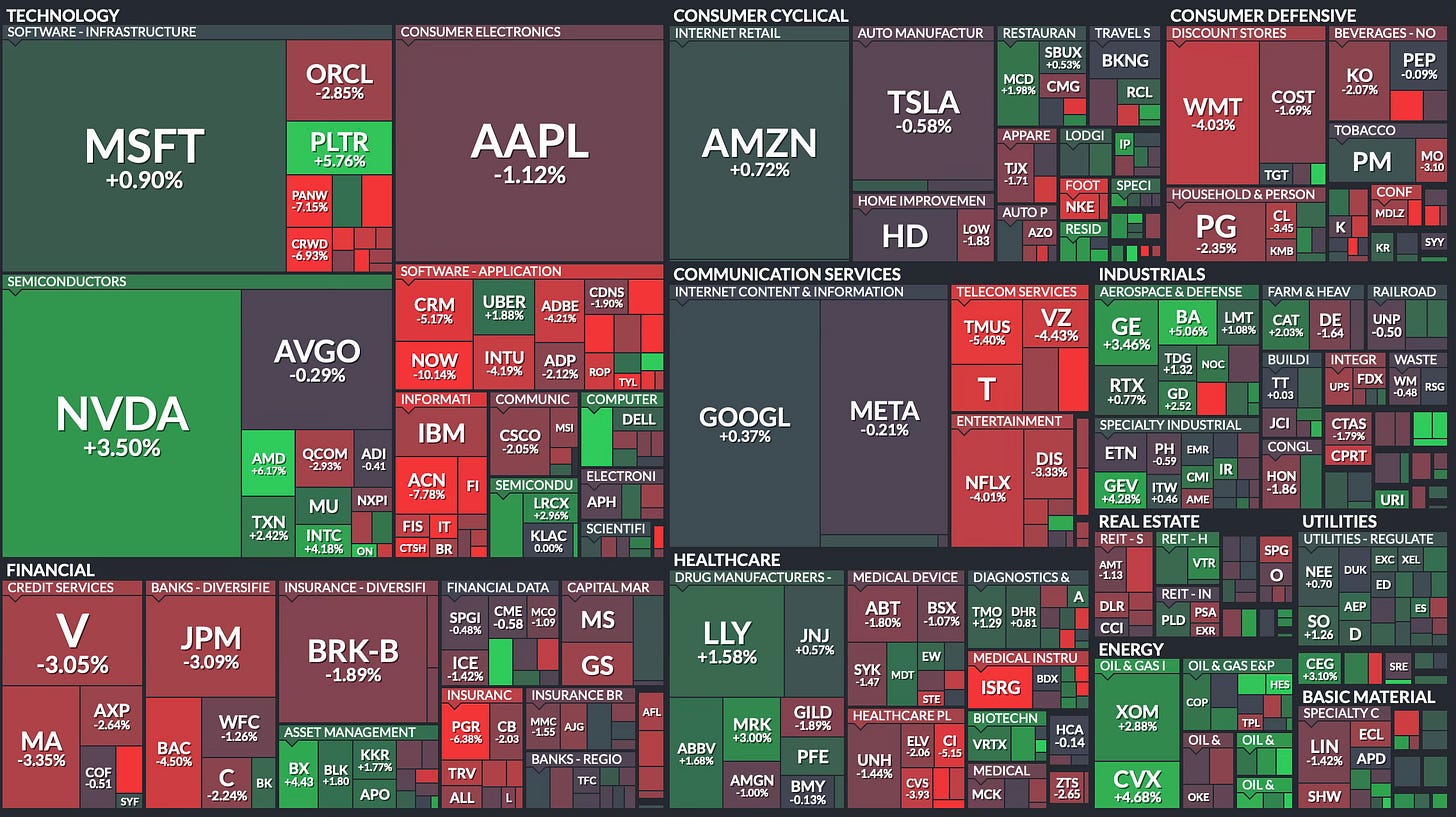
Weekly Heat Map Of Stocks
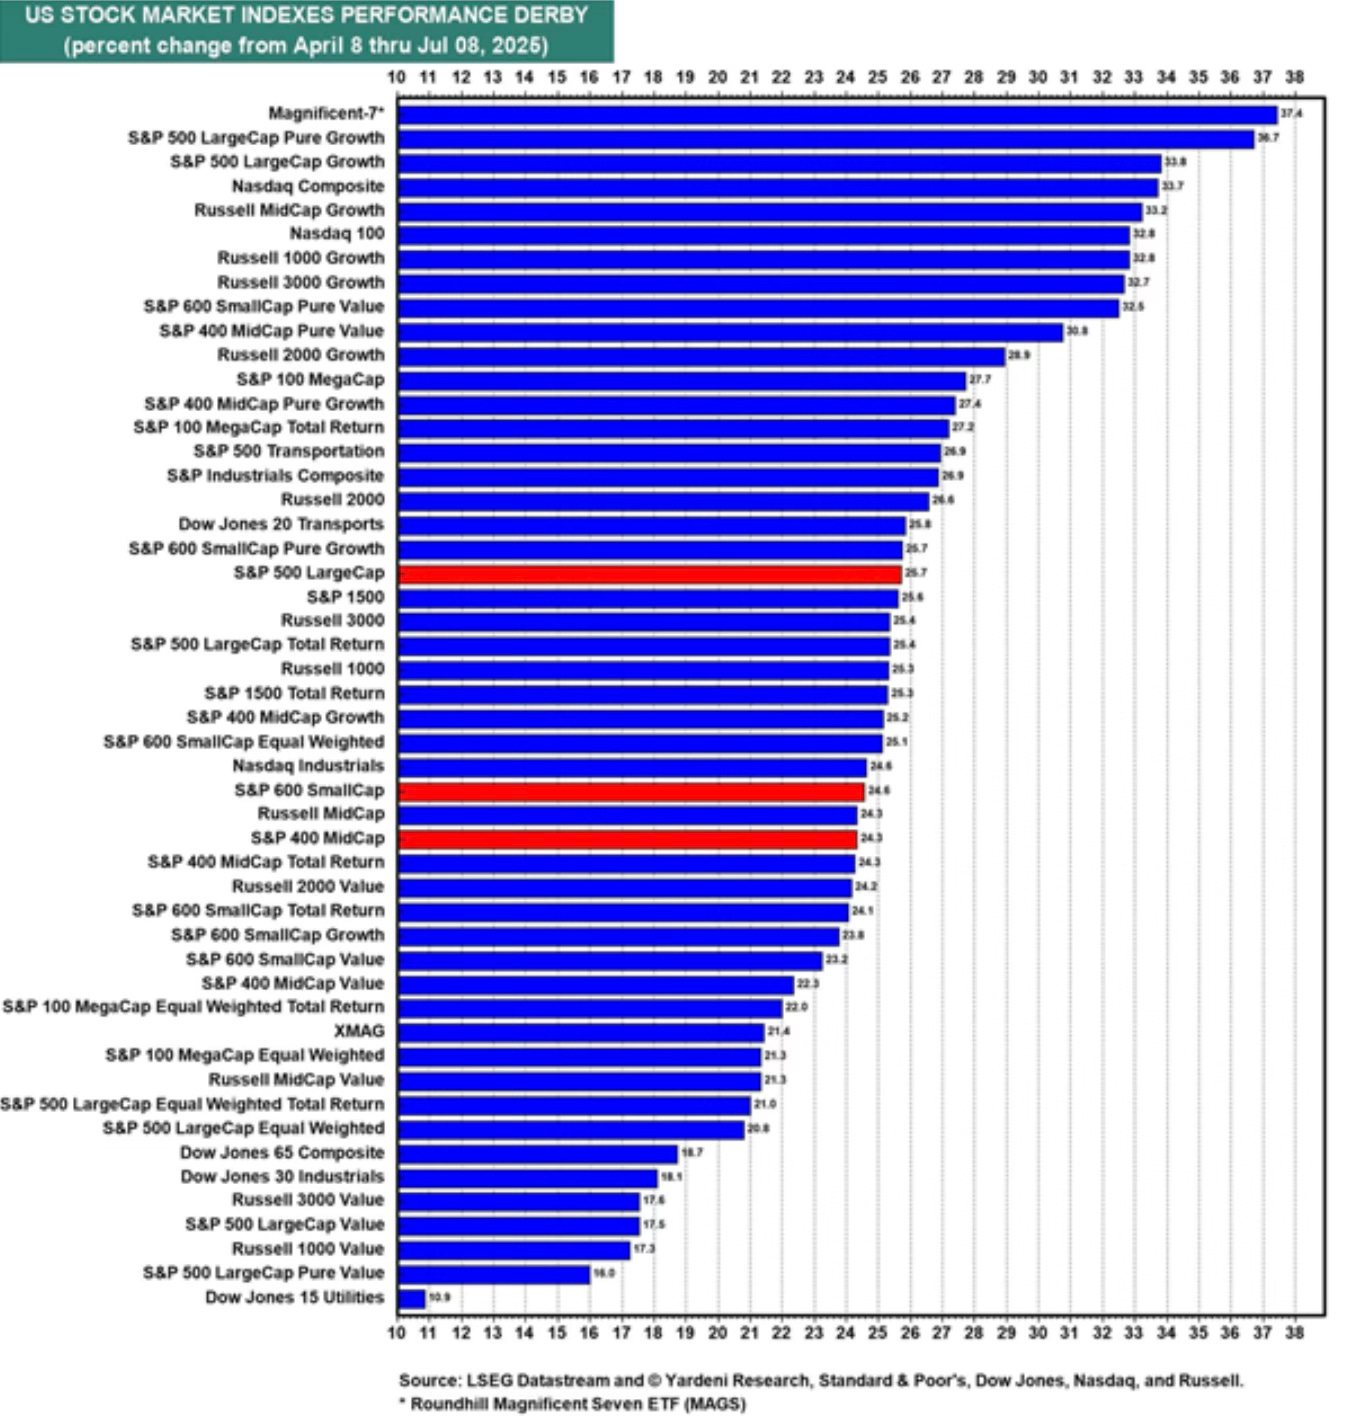
Pretty much everything is up from the April lows. Did you know that the leader from the lows has been the Magnificent 7? Imagine where the Mag 7 would be if Apple and Tesla could sustain a rally.
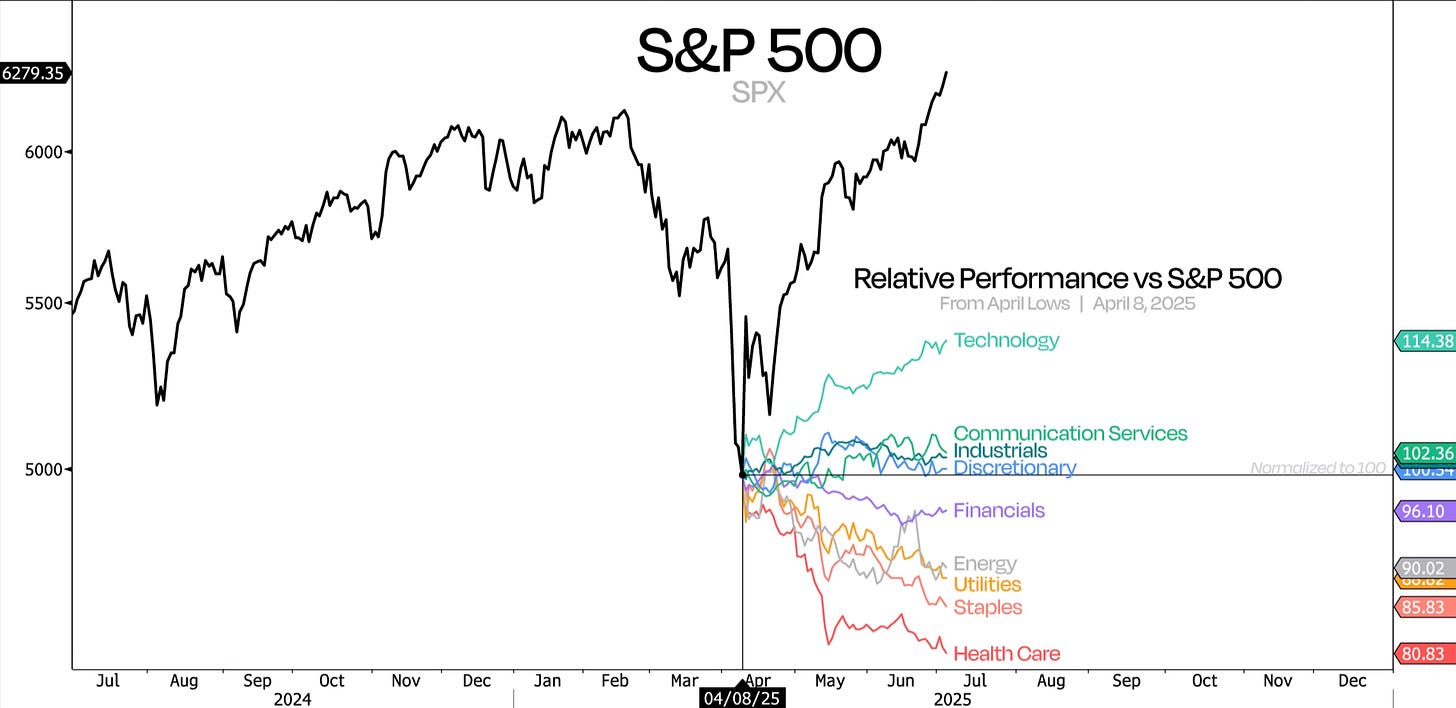
We’re seeing the bullish signals continue. Take a look at how stocks are doing relative to the S&P 500. This has been on an upswing since the April 8th lows. You're getting the leadership where you want to see it. This is what you look for in a sustained bull market bounce. What’s leading is what you expect. Leaders lead. This gives me confirmation.
We’ve also seen the highest levels of the year for the Risk-On/Risk-Off Ratio. It's actually at the highest level since mid-2024. Risk-on is ripping.
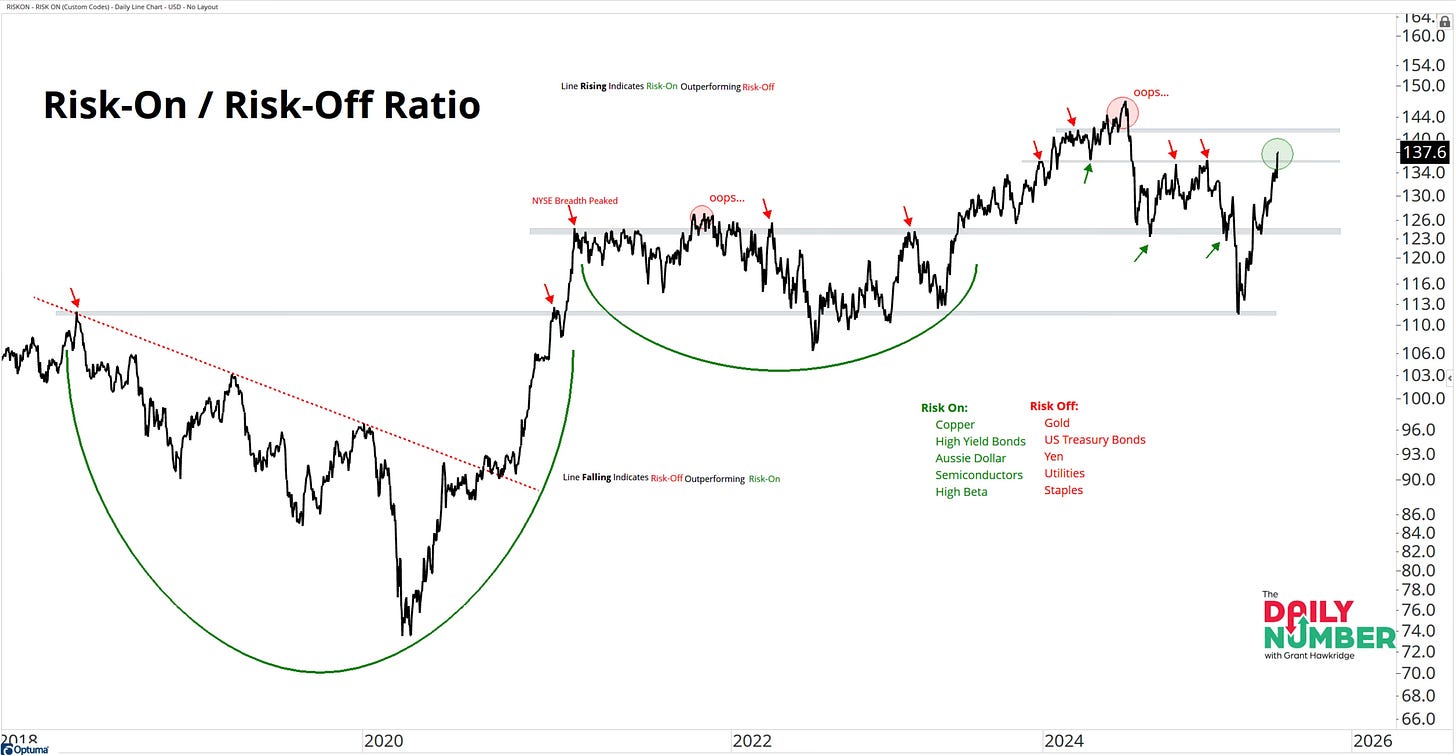
We also have to take a cue from Ryan Detrick’s chart.
When the S&P 500 is up between 5-10% at the midway point. The final six months are higher 13 out of 15 times. The full year is up 14 of 15 times.
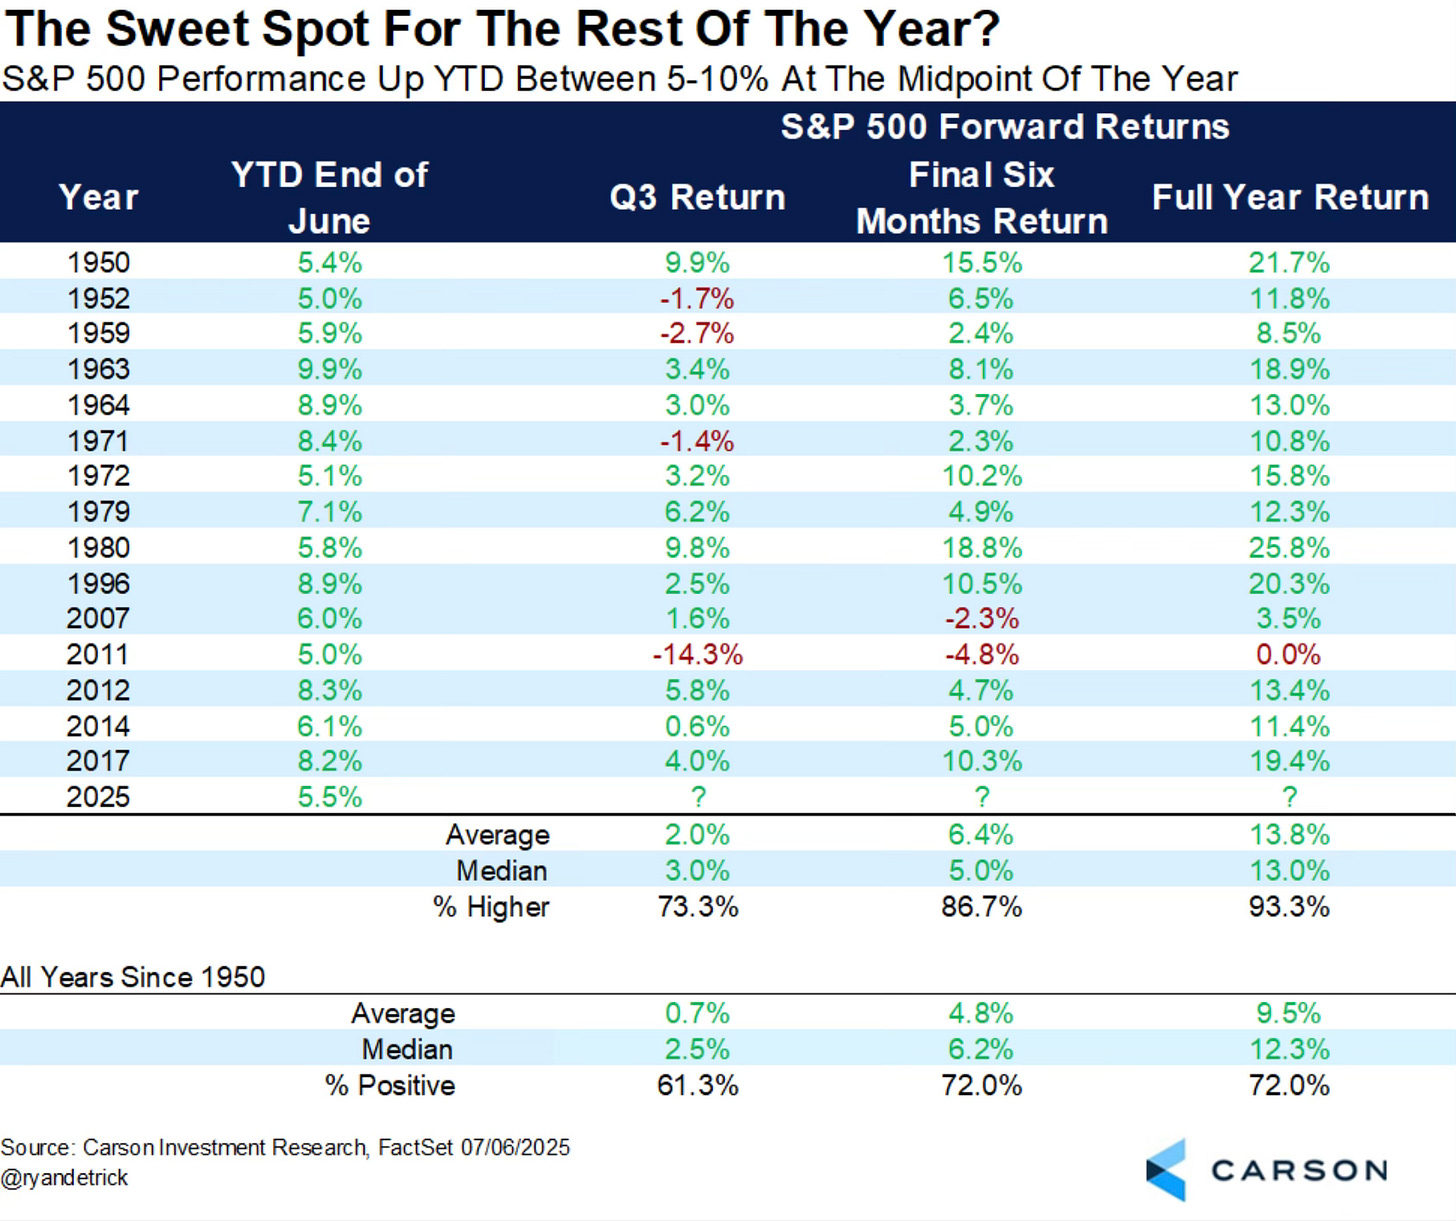
It’s a good time to be a bull. Everything has started to lean and lean very far to the bullish side. That may shift in time but right now it’s a full on party for the bulls. The bears will have to wait their turn. I’ve been watching for bearish signals and data but so far it has been nonexistent. At some point that data will emerge. For now, enjoy summer and the bull party.

