Investing Update: 3 Worrisome New Data Points
What I'm buying, selling & watching
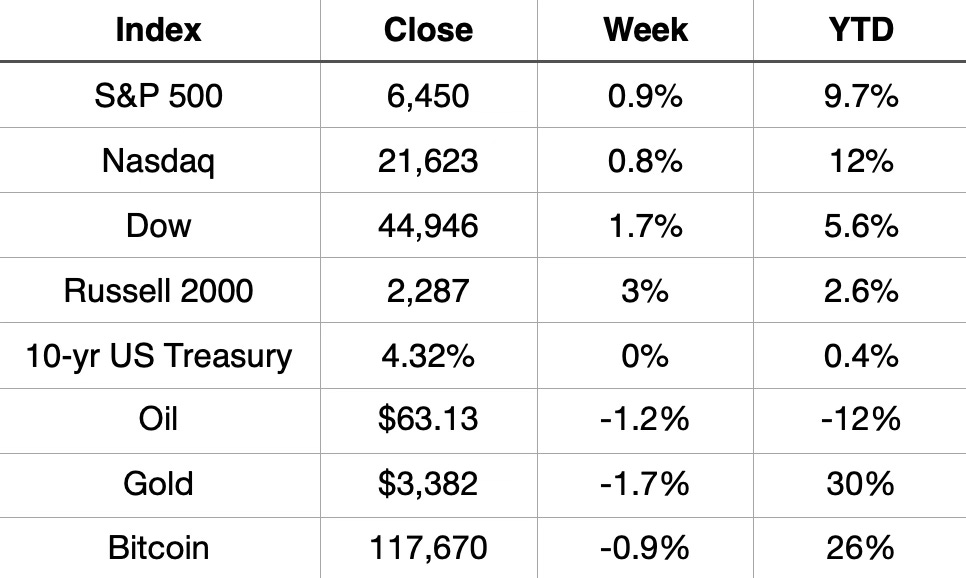
It was another winning week on Wall Street, as all three major indices ended in the green.
Four of the past five weeks have now ended in gains for both the S&P 500 and Nasdaq.
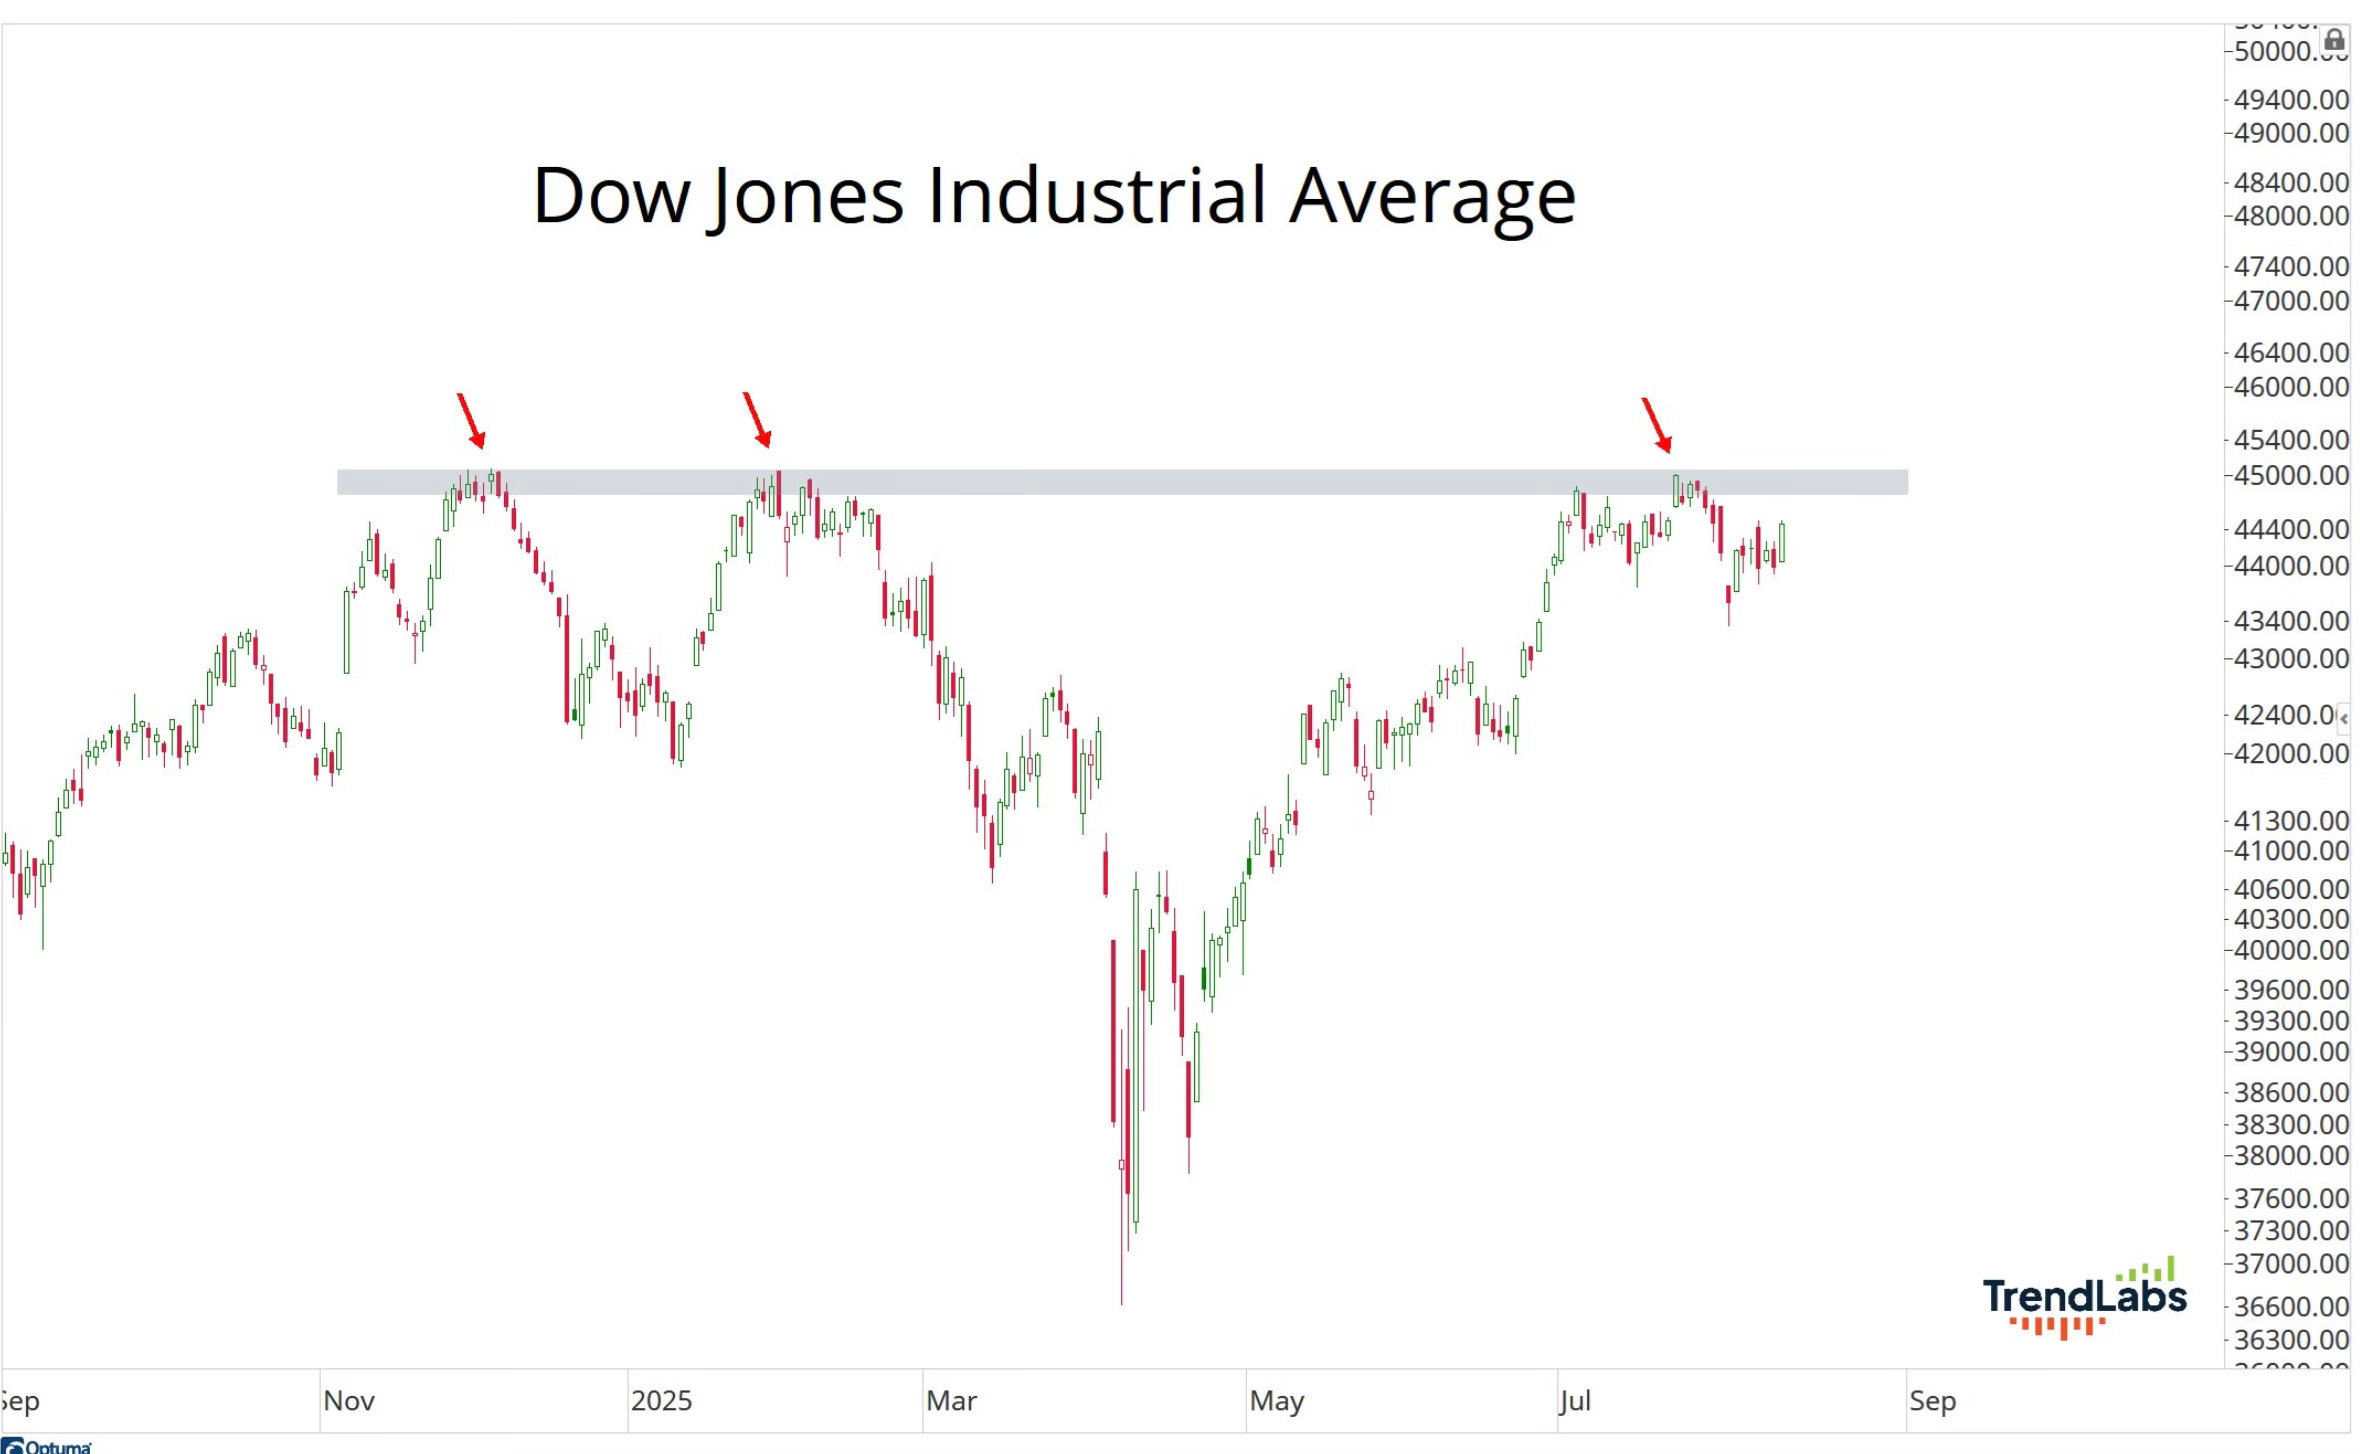
YTD the S&P 500 has set 18 new all-time highs and the Nasdaq has set 19 all-time highs. The Dow is still searching for its first new all-time closing high of 2025.
Market Recap
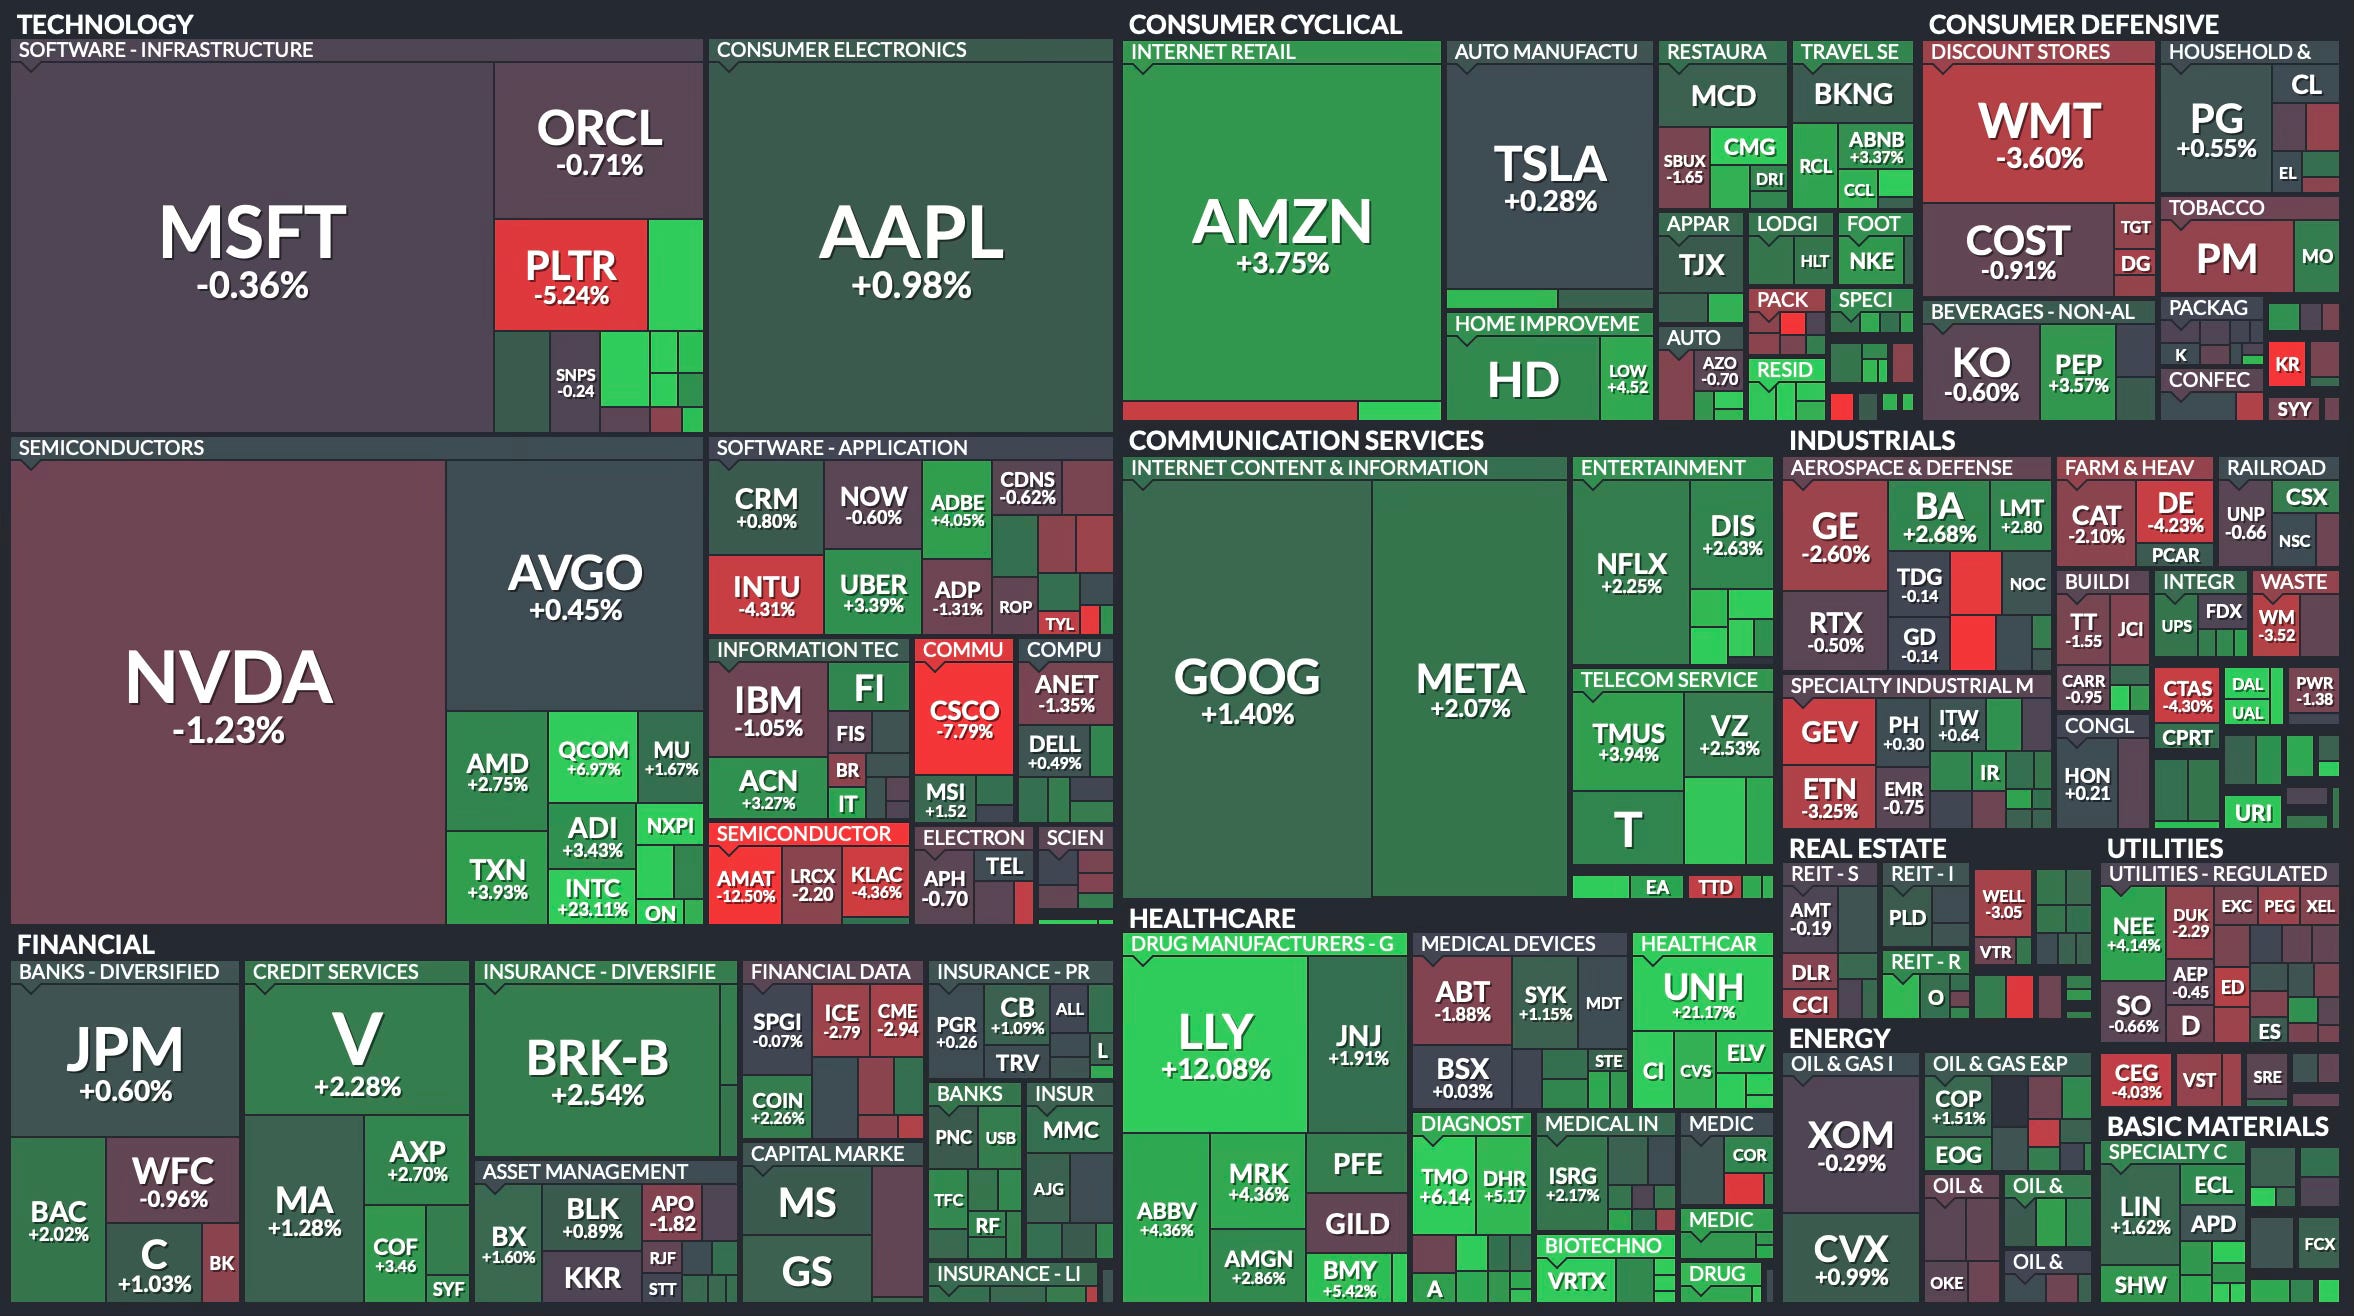
Weekly Heat Map Of Stocks
I’ve been hearing how this market is running out of steam. Don’t try telling me that when the Dow has yet to close at an all-time high in 2025.
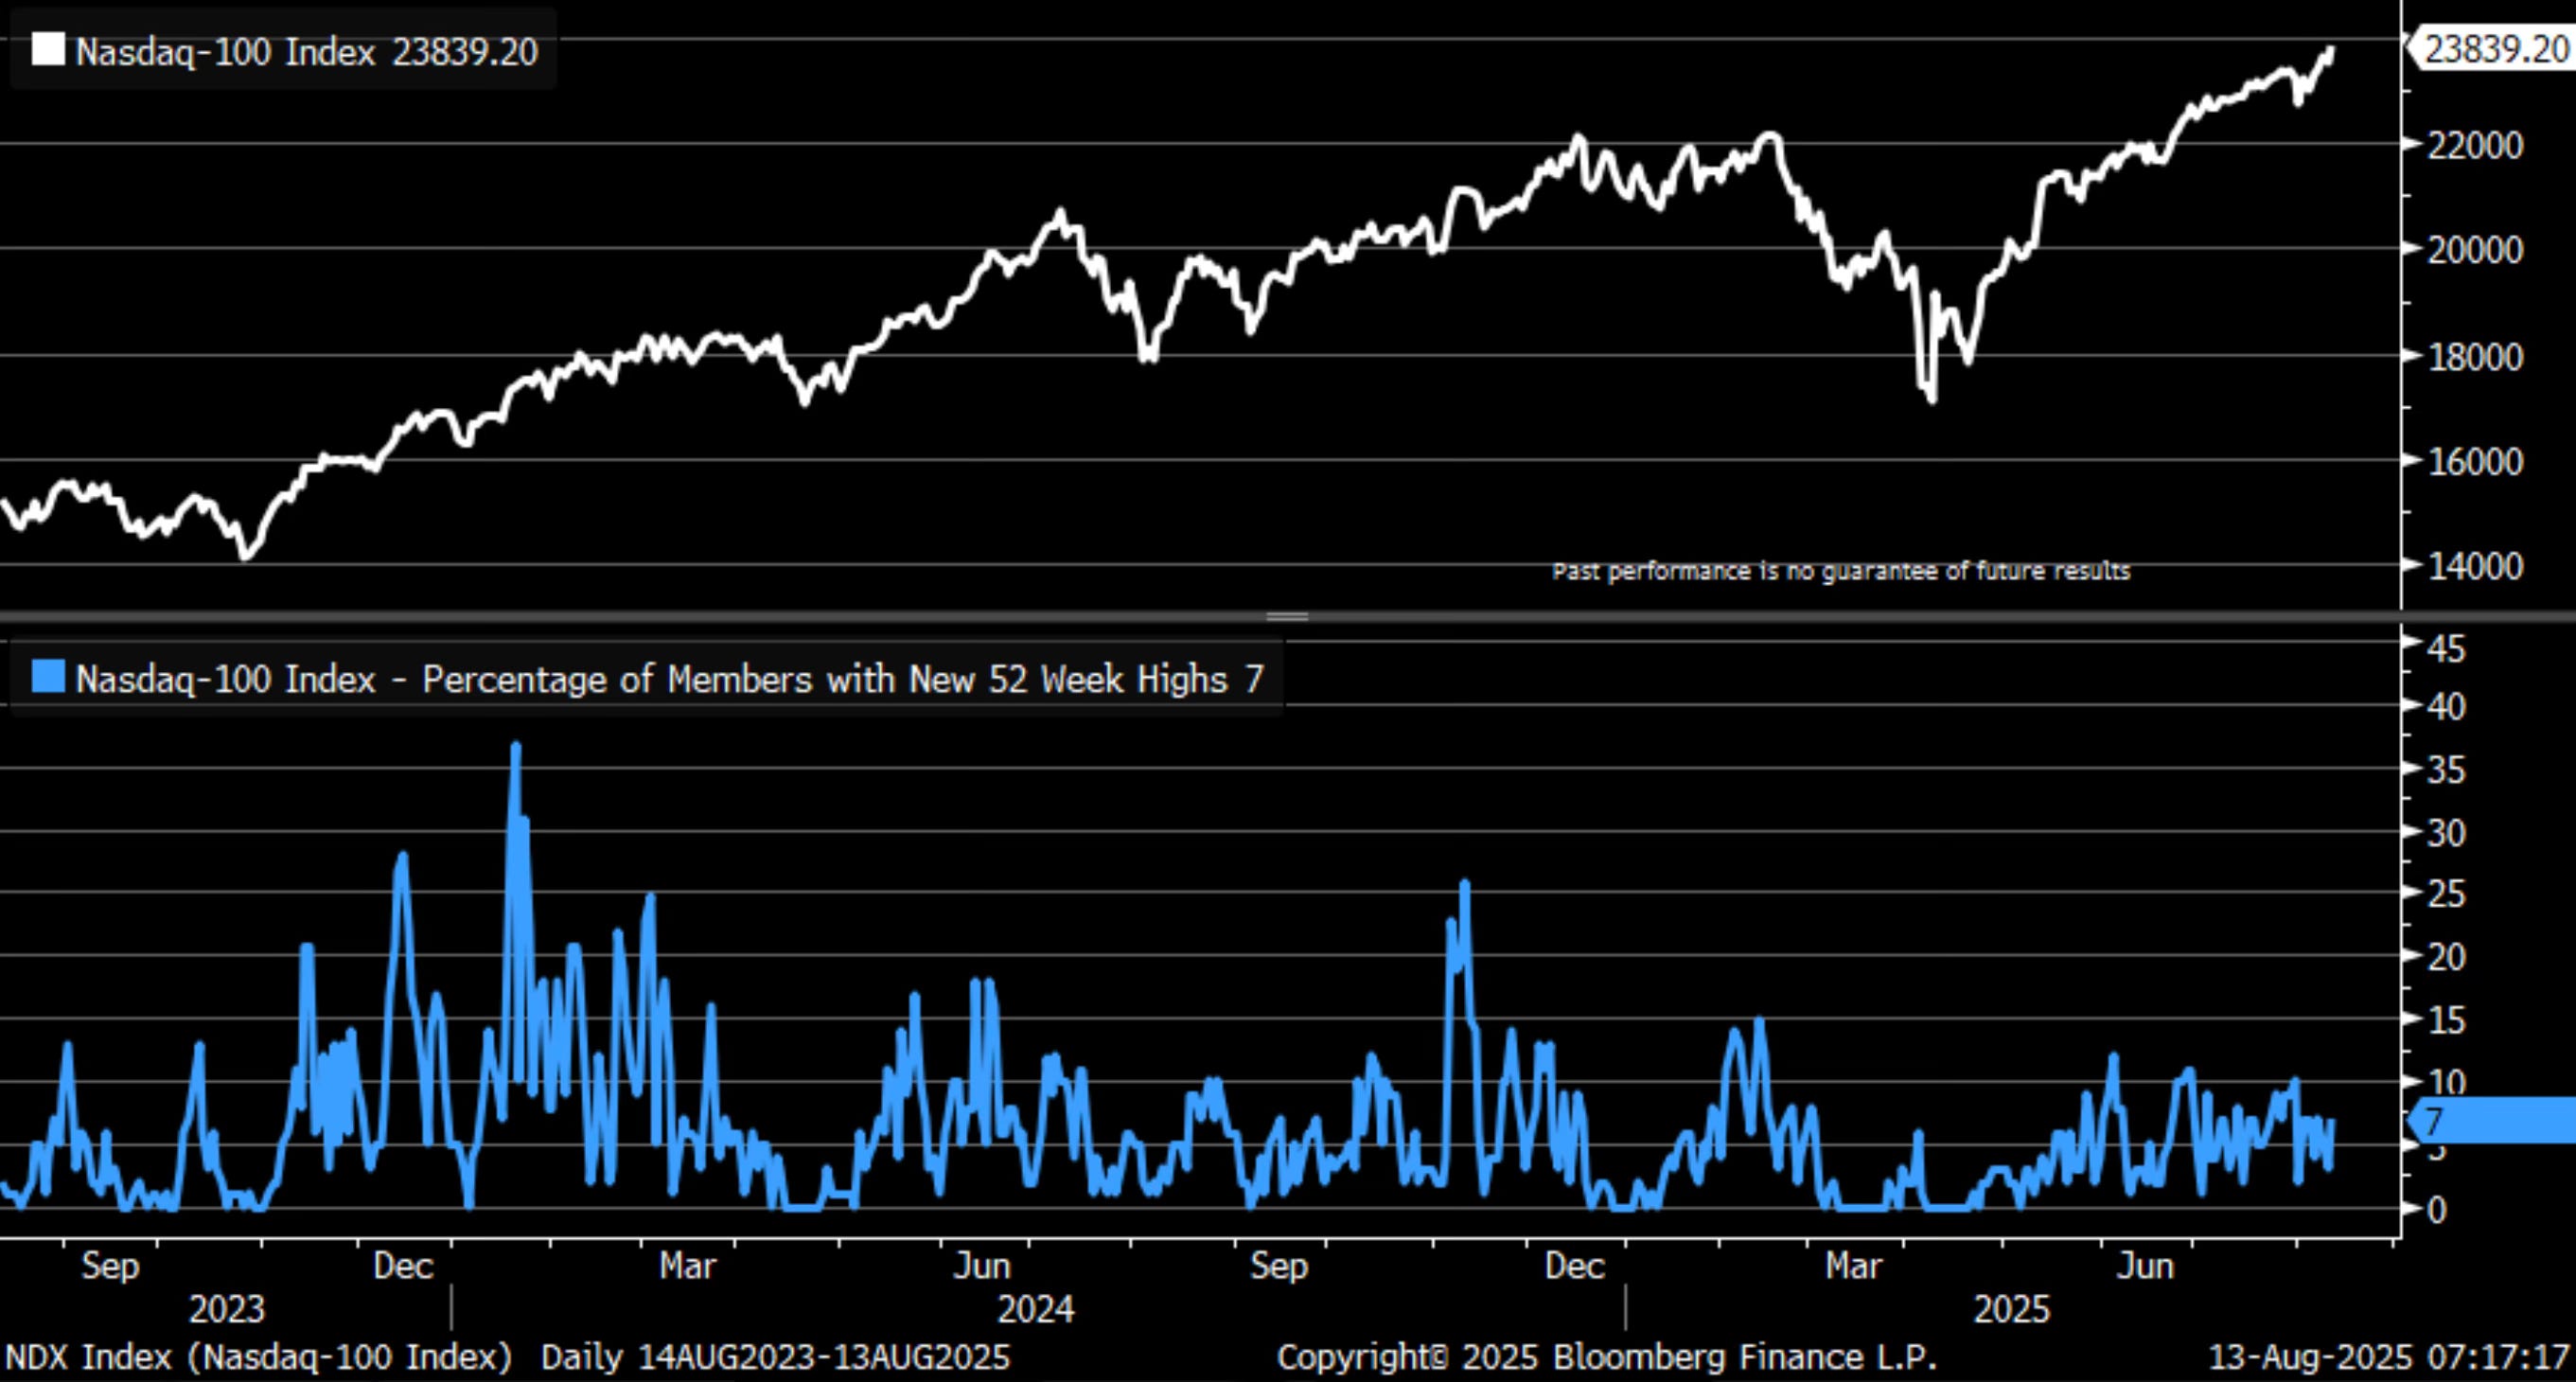
The new 52-week highs for the Nasdaq are still at only 7%.
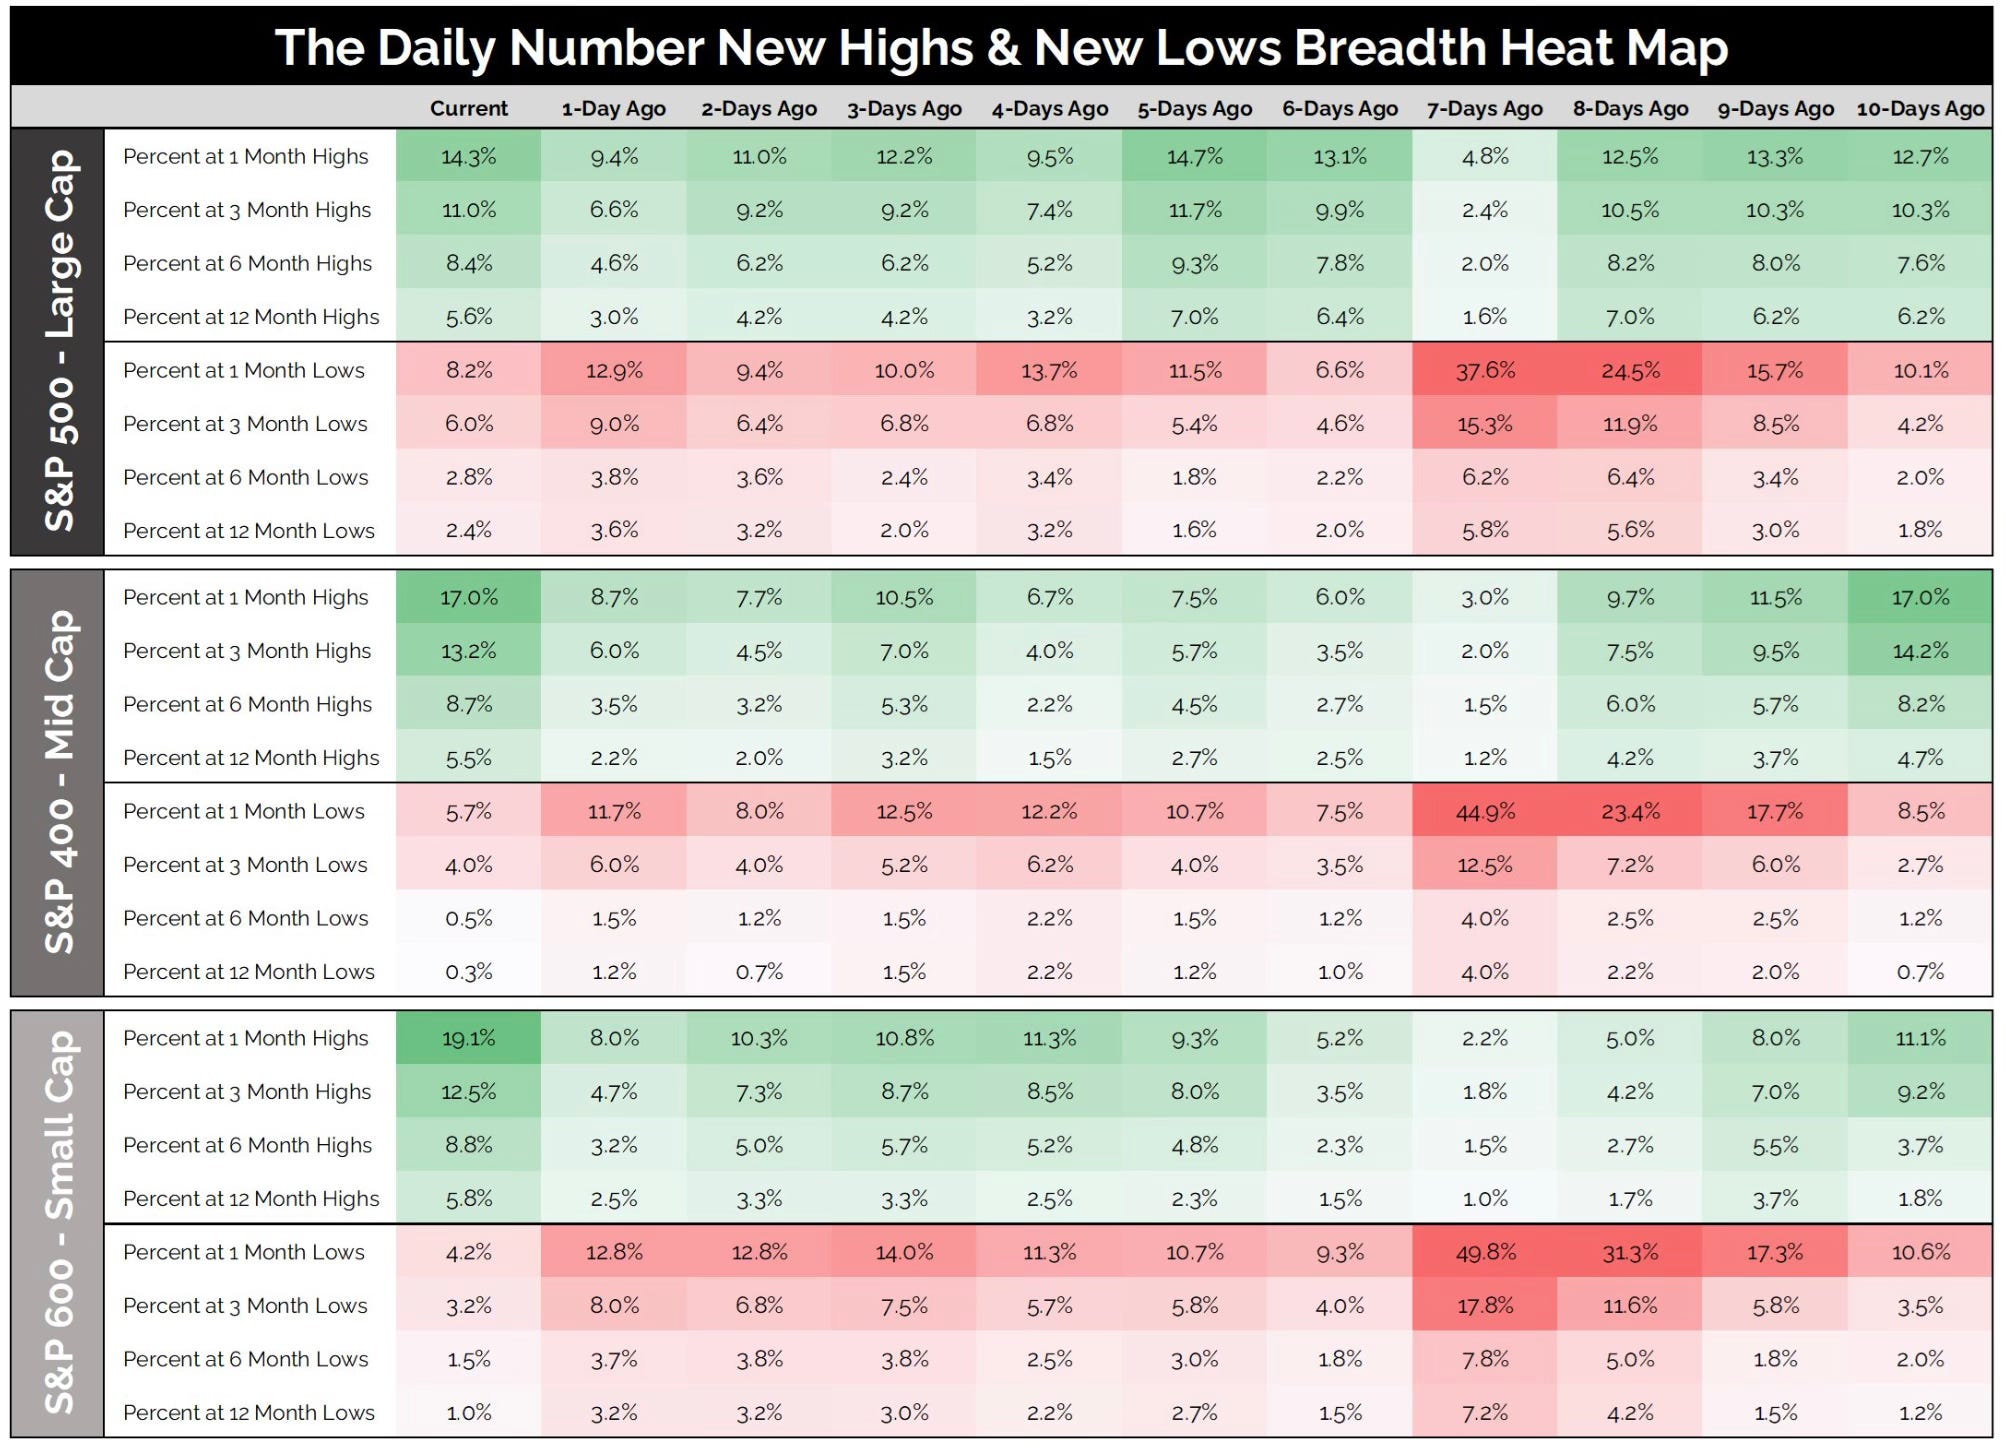
Take a look at the breadth heat map from Grant Hawkridge. There is a lot of green in the highs but you can see the percentages are still quite low. Room to run higher.
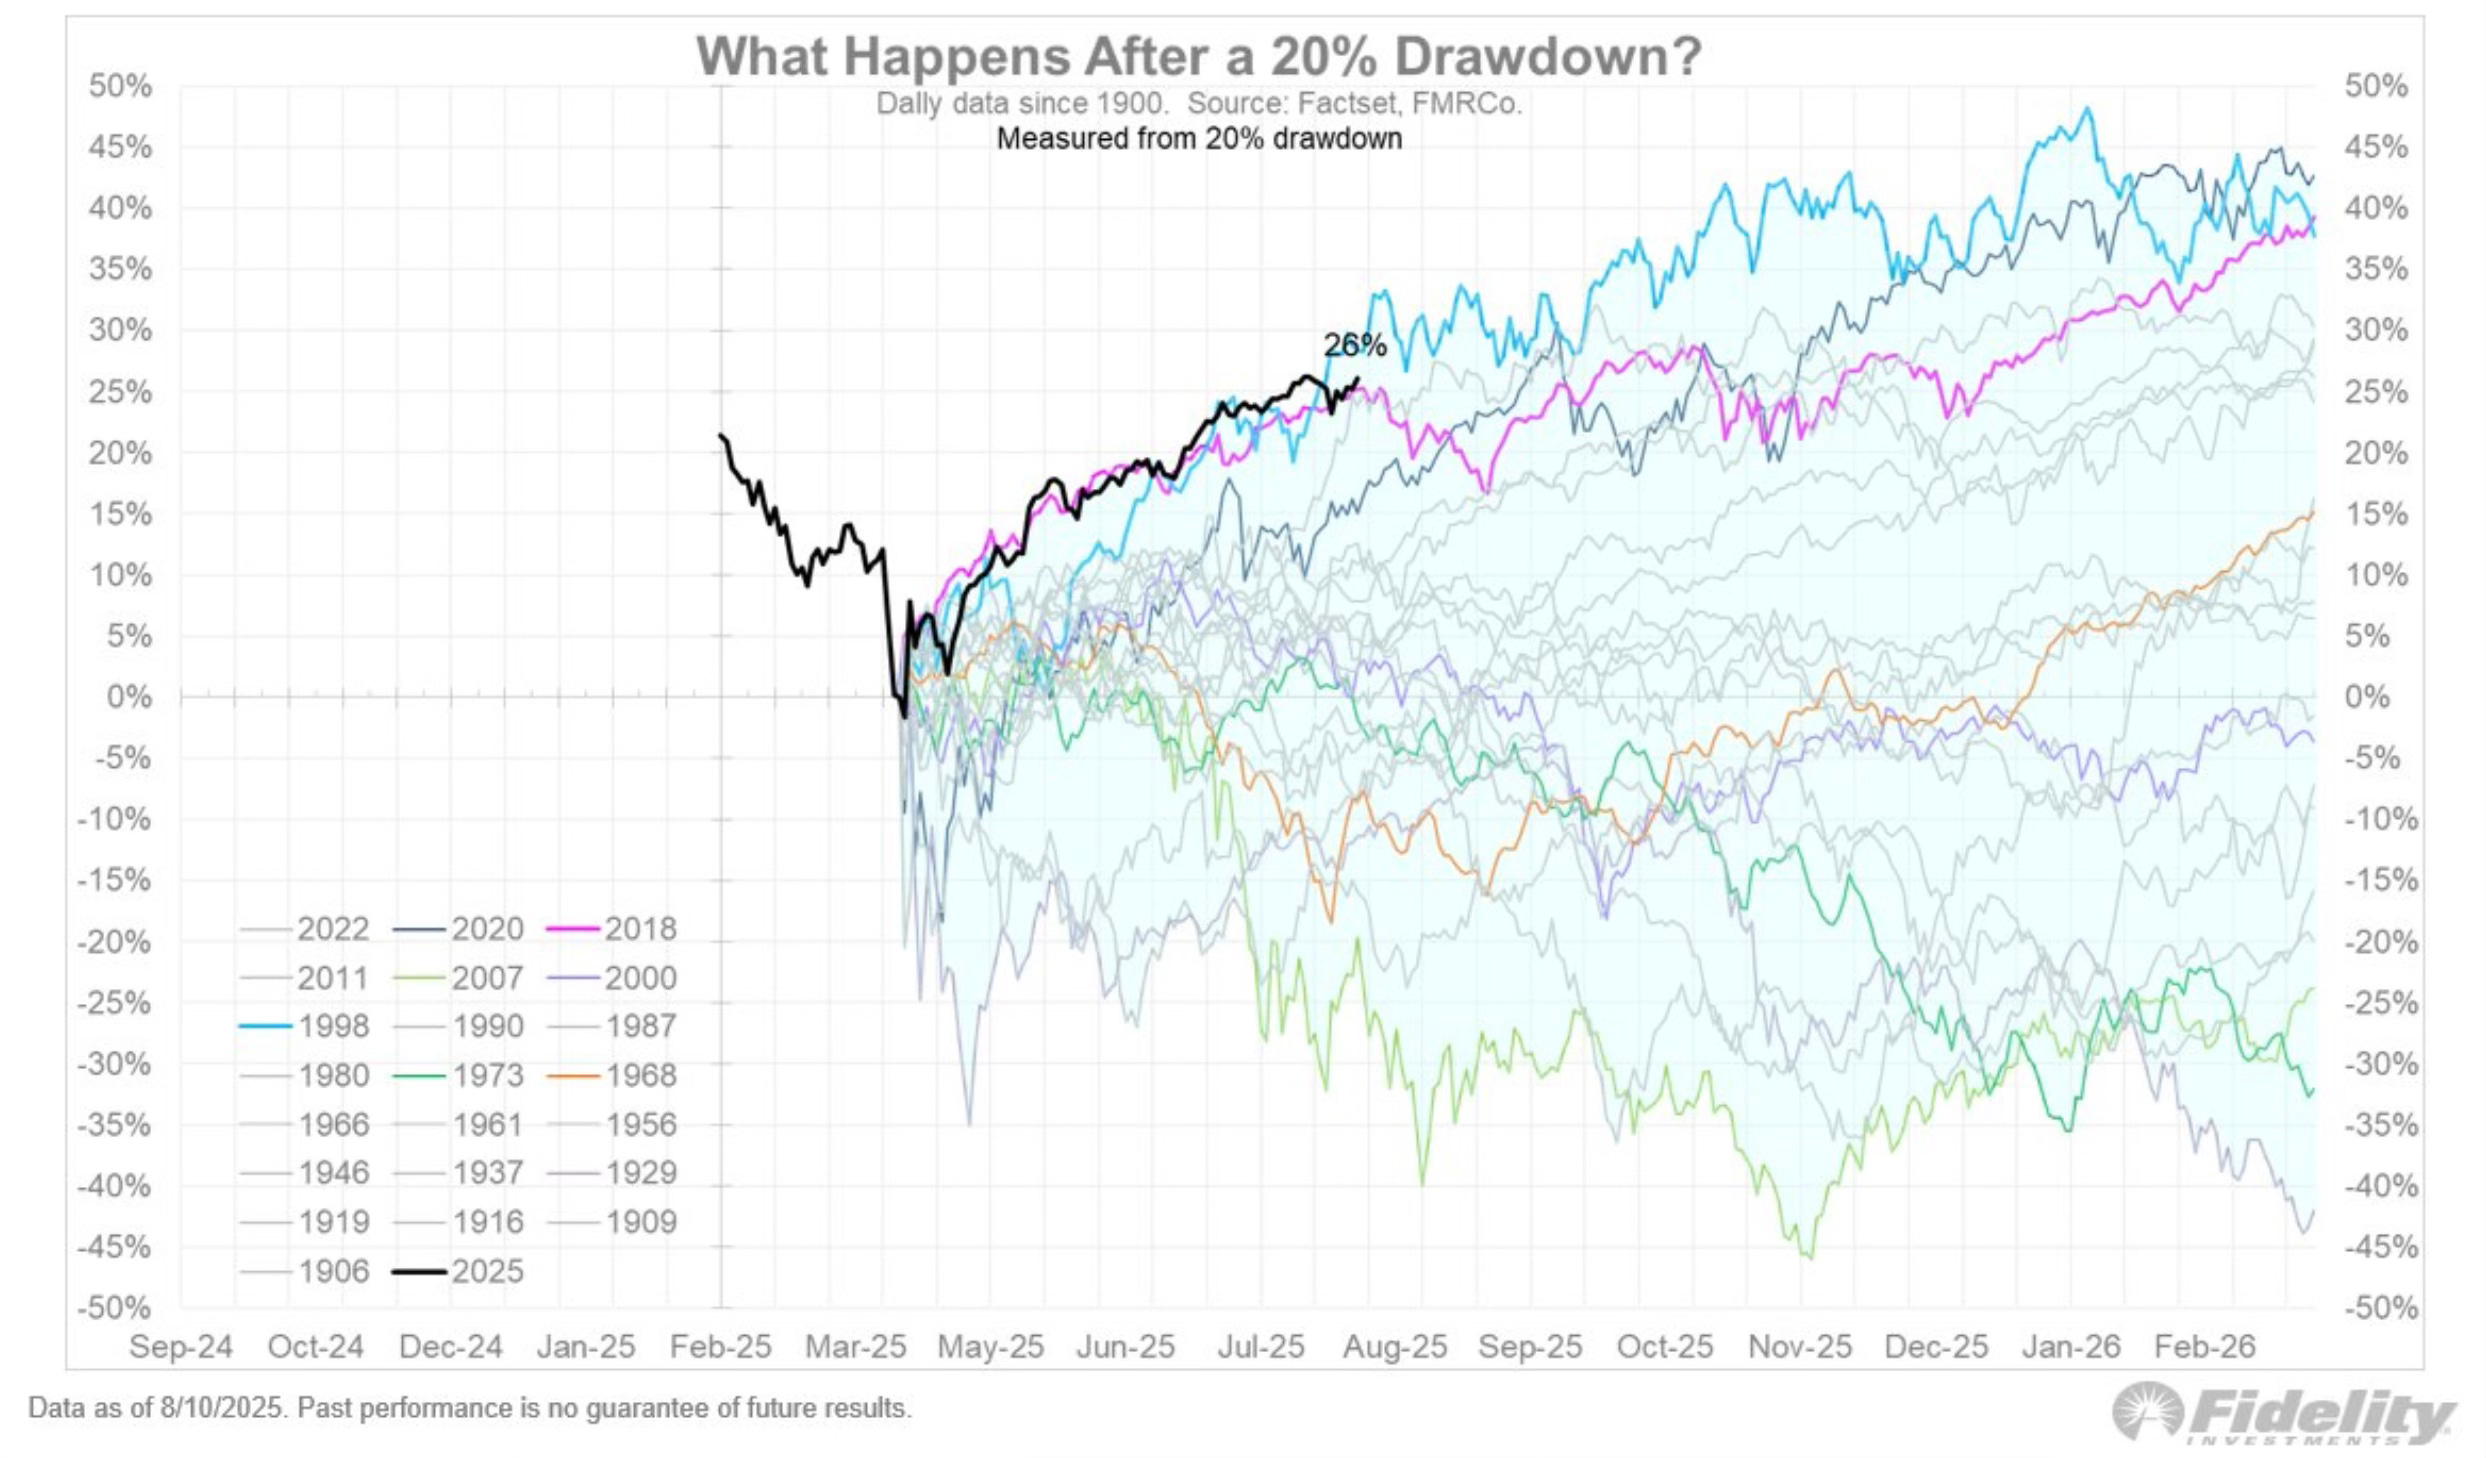
It’s easy to forget the rapid bounce that we’ve seen after the 20% drawdown. It’s still on pace to be one of the fastest recoveries ever.
The market is now entering the rough annual seasonality period. It traditionally lasts from now until mid-October.
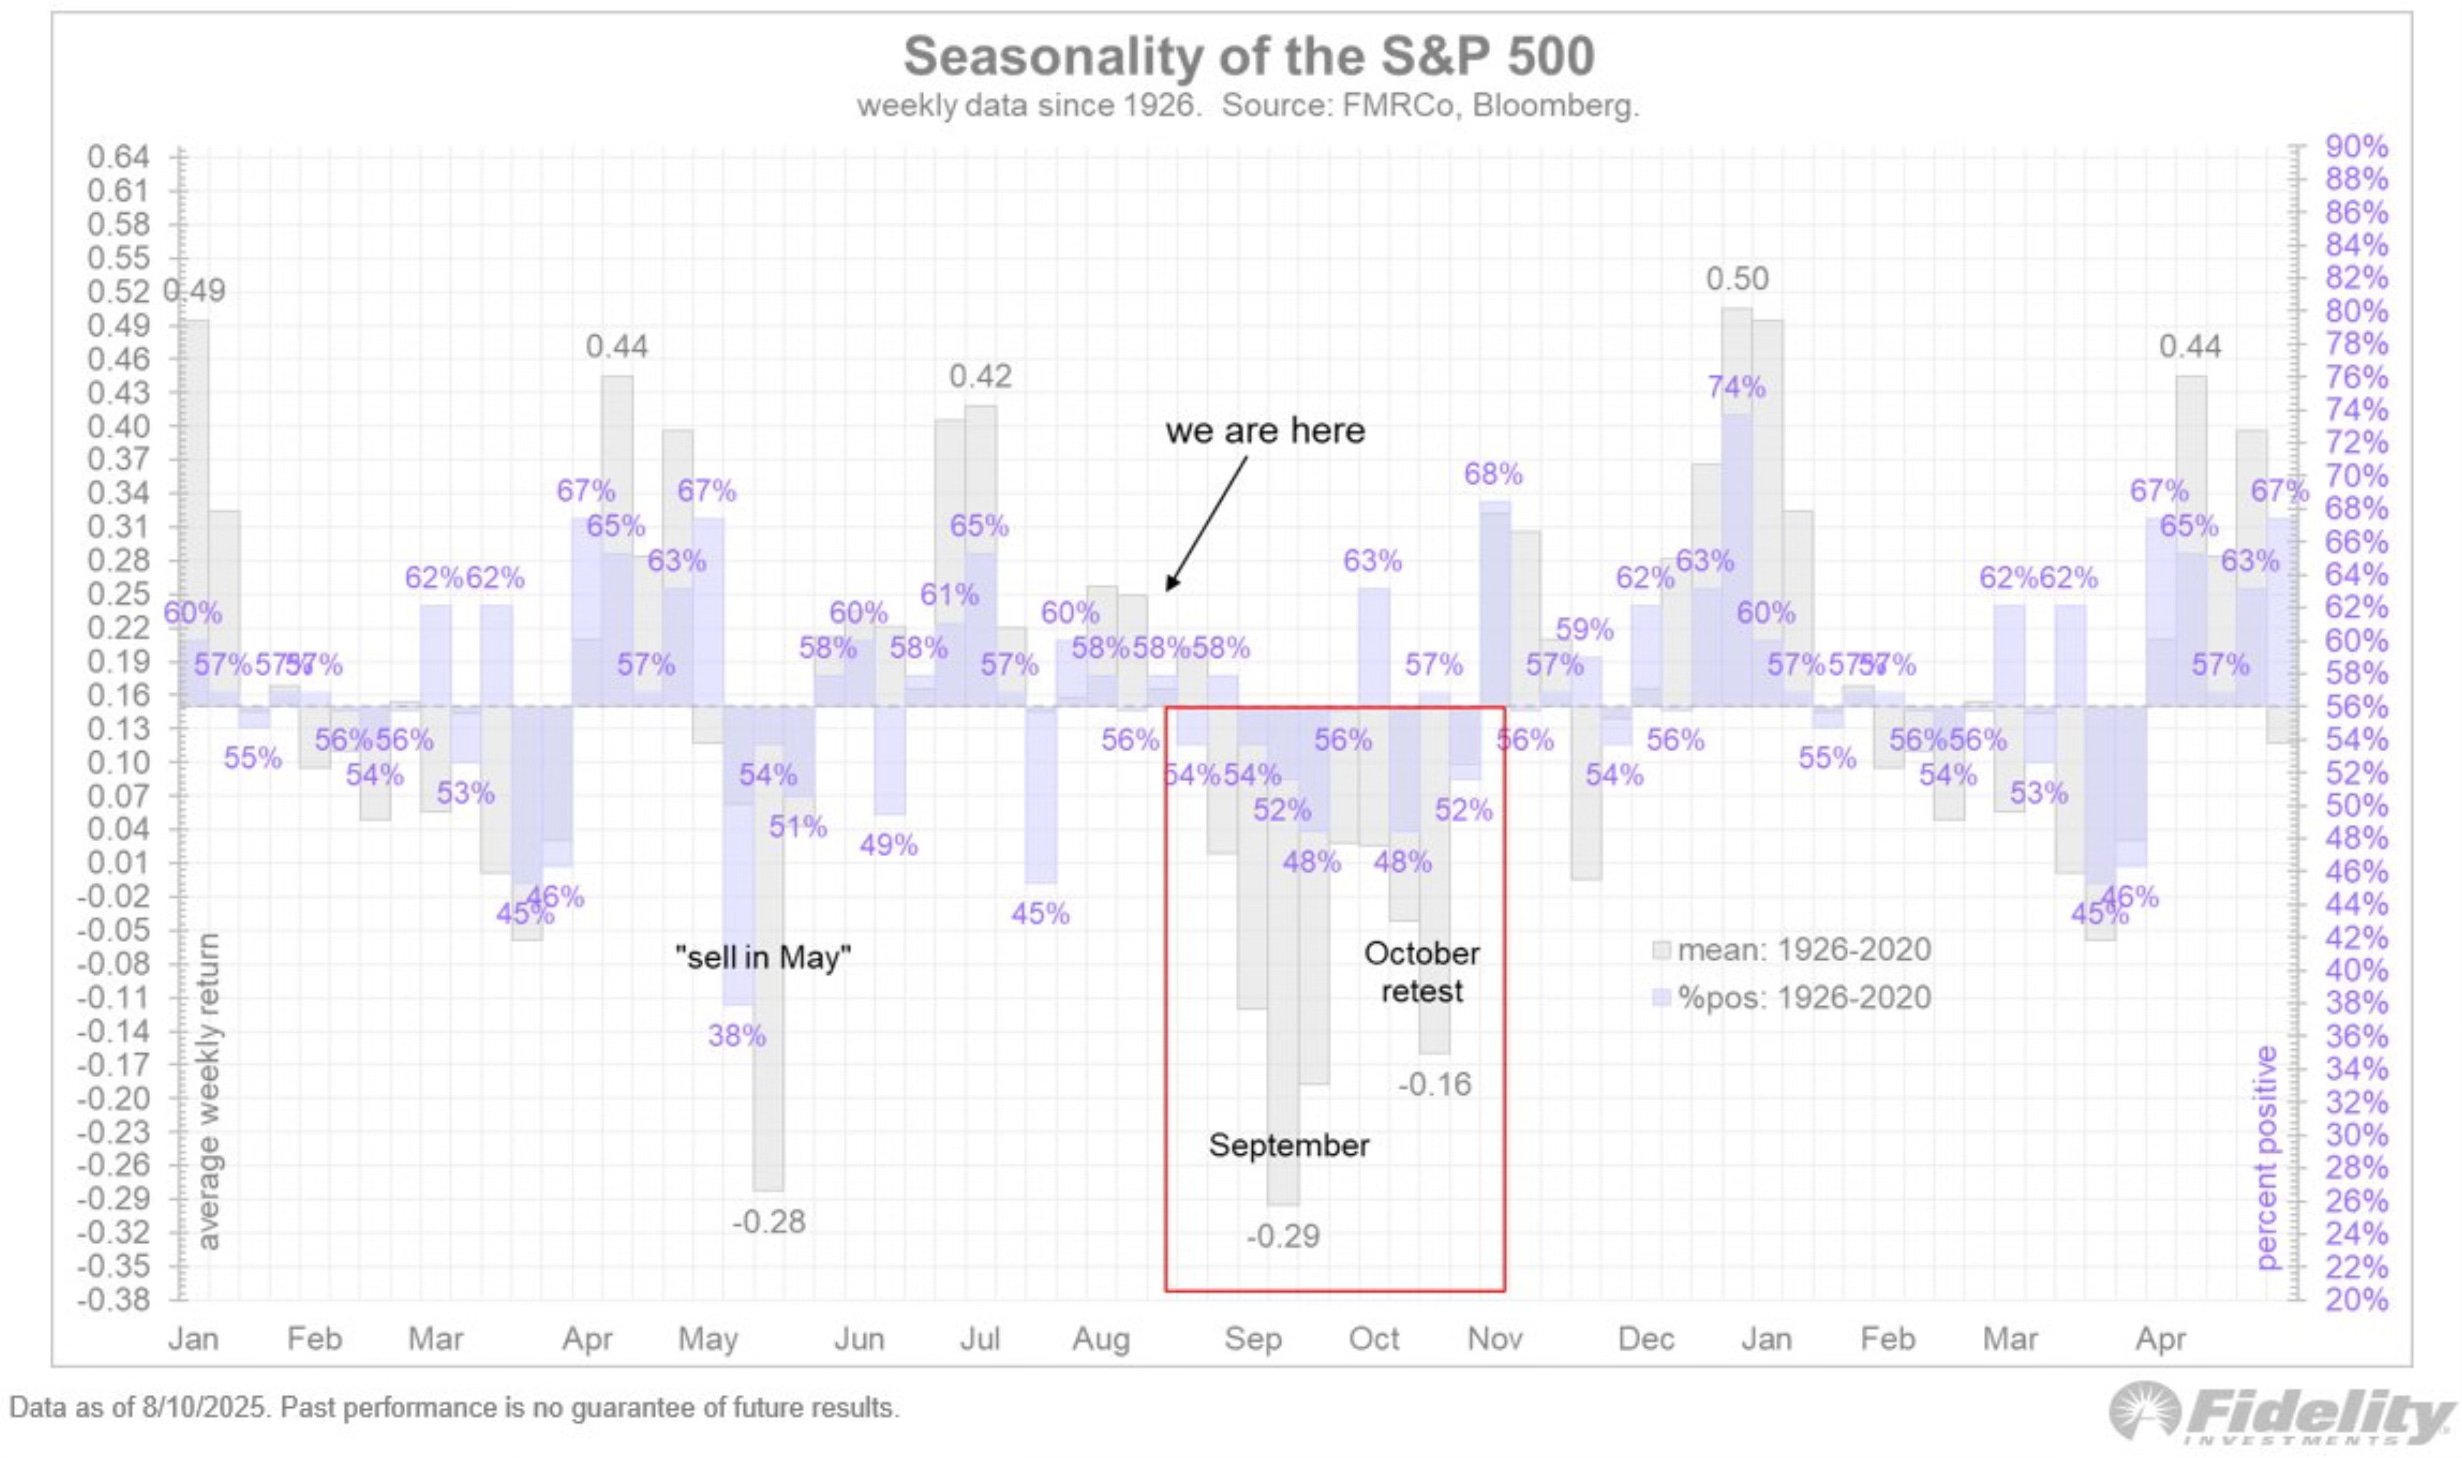
Even with seasonality looming. There has been some new strength added to the market. I’ve written about how institutional investors and hedge funds have been slow to get on this bull market train.
That looks to be changing as institutional flows are shifting.
Stocks saw their 10th largest weekly inflow from institutional clients in history.
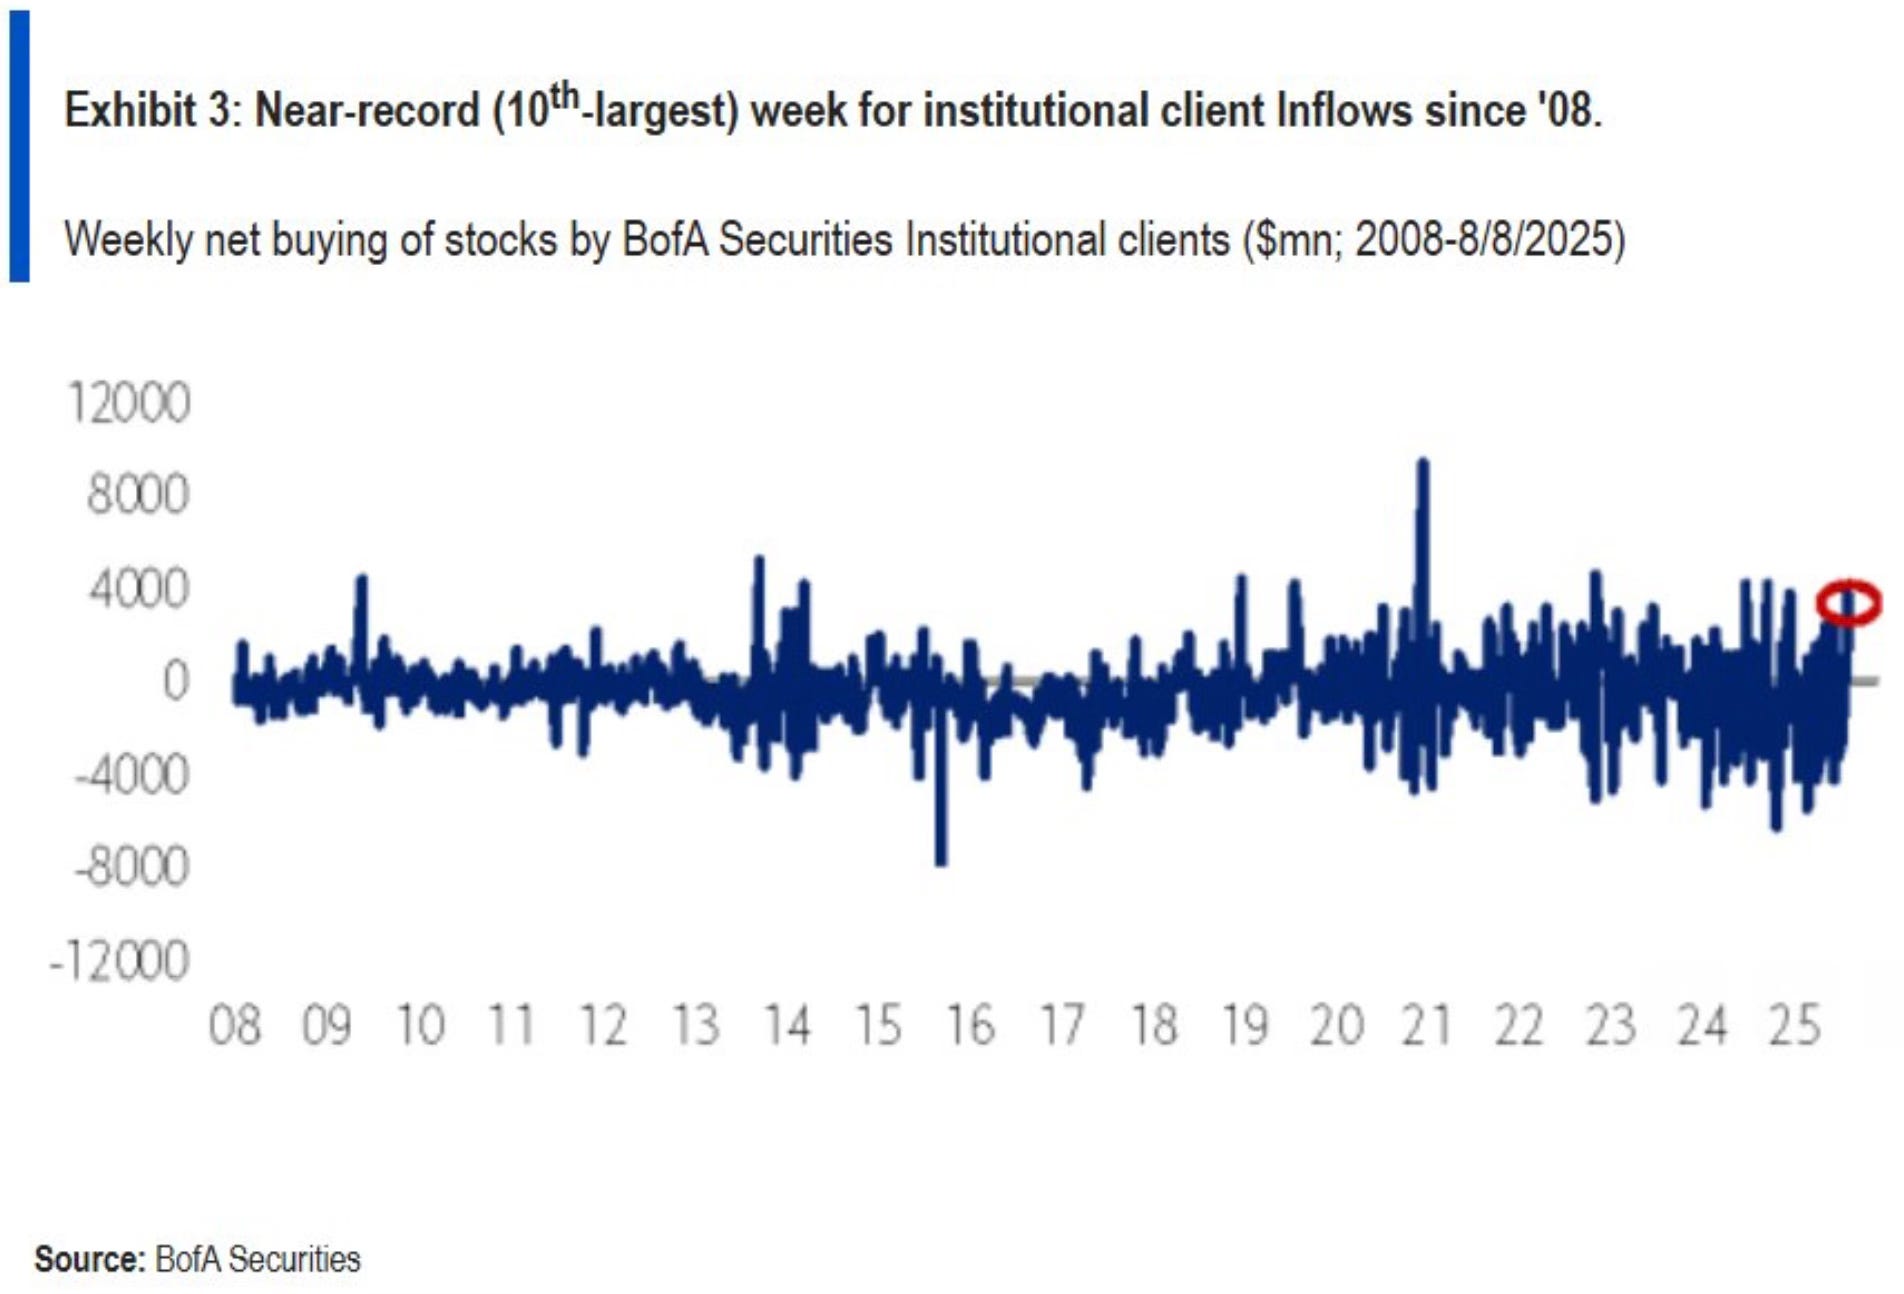
It’s the largest net buys since last September. BofA private clients have now had net inflows for 6 straight weeks. The catch up trade is accelerating.
I said you would see a catch up trade in May. Here is what I said on May 17th in my Investing Update: New Highs Incoming?
Institutional investors are very underweight. They have sat and remain on the sidelines. So many people are offsides. The rush to get back in will accelerate.
This is exactly what we’re now seeing play out.
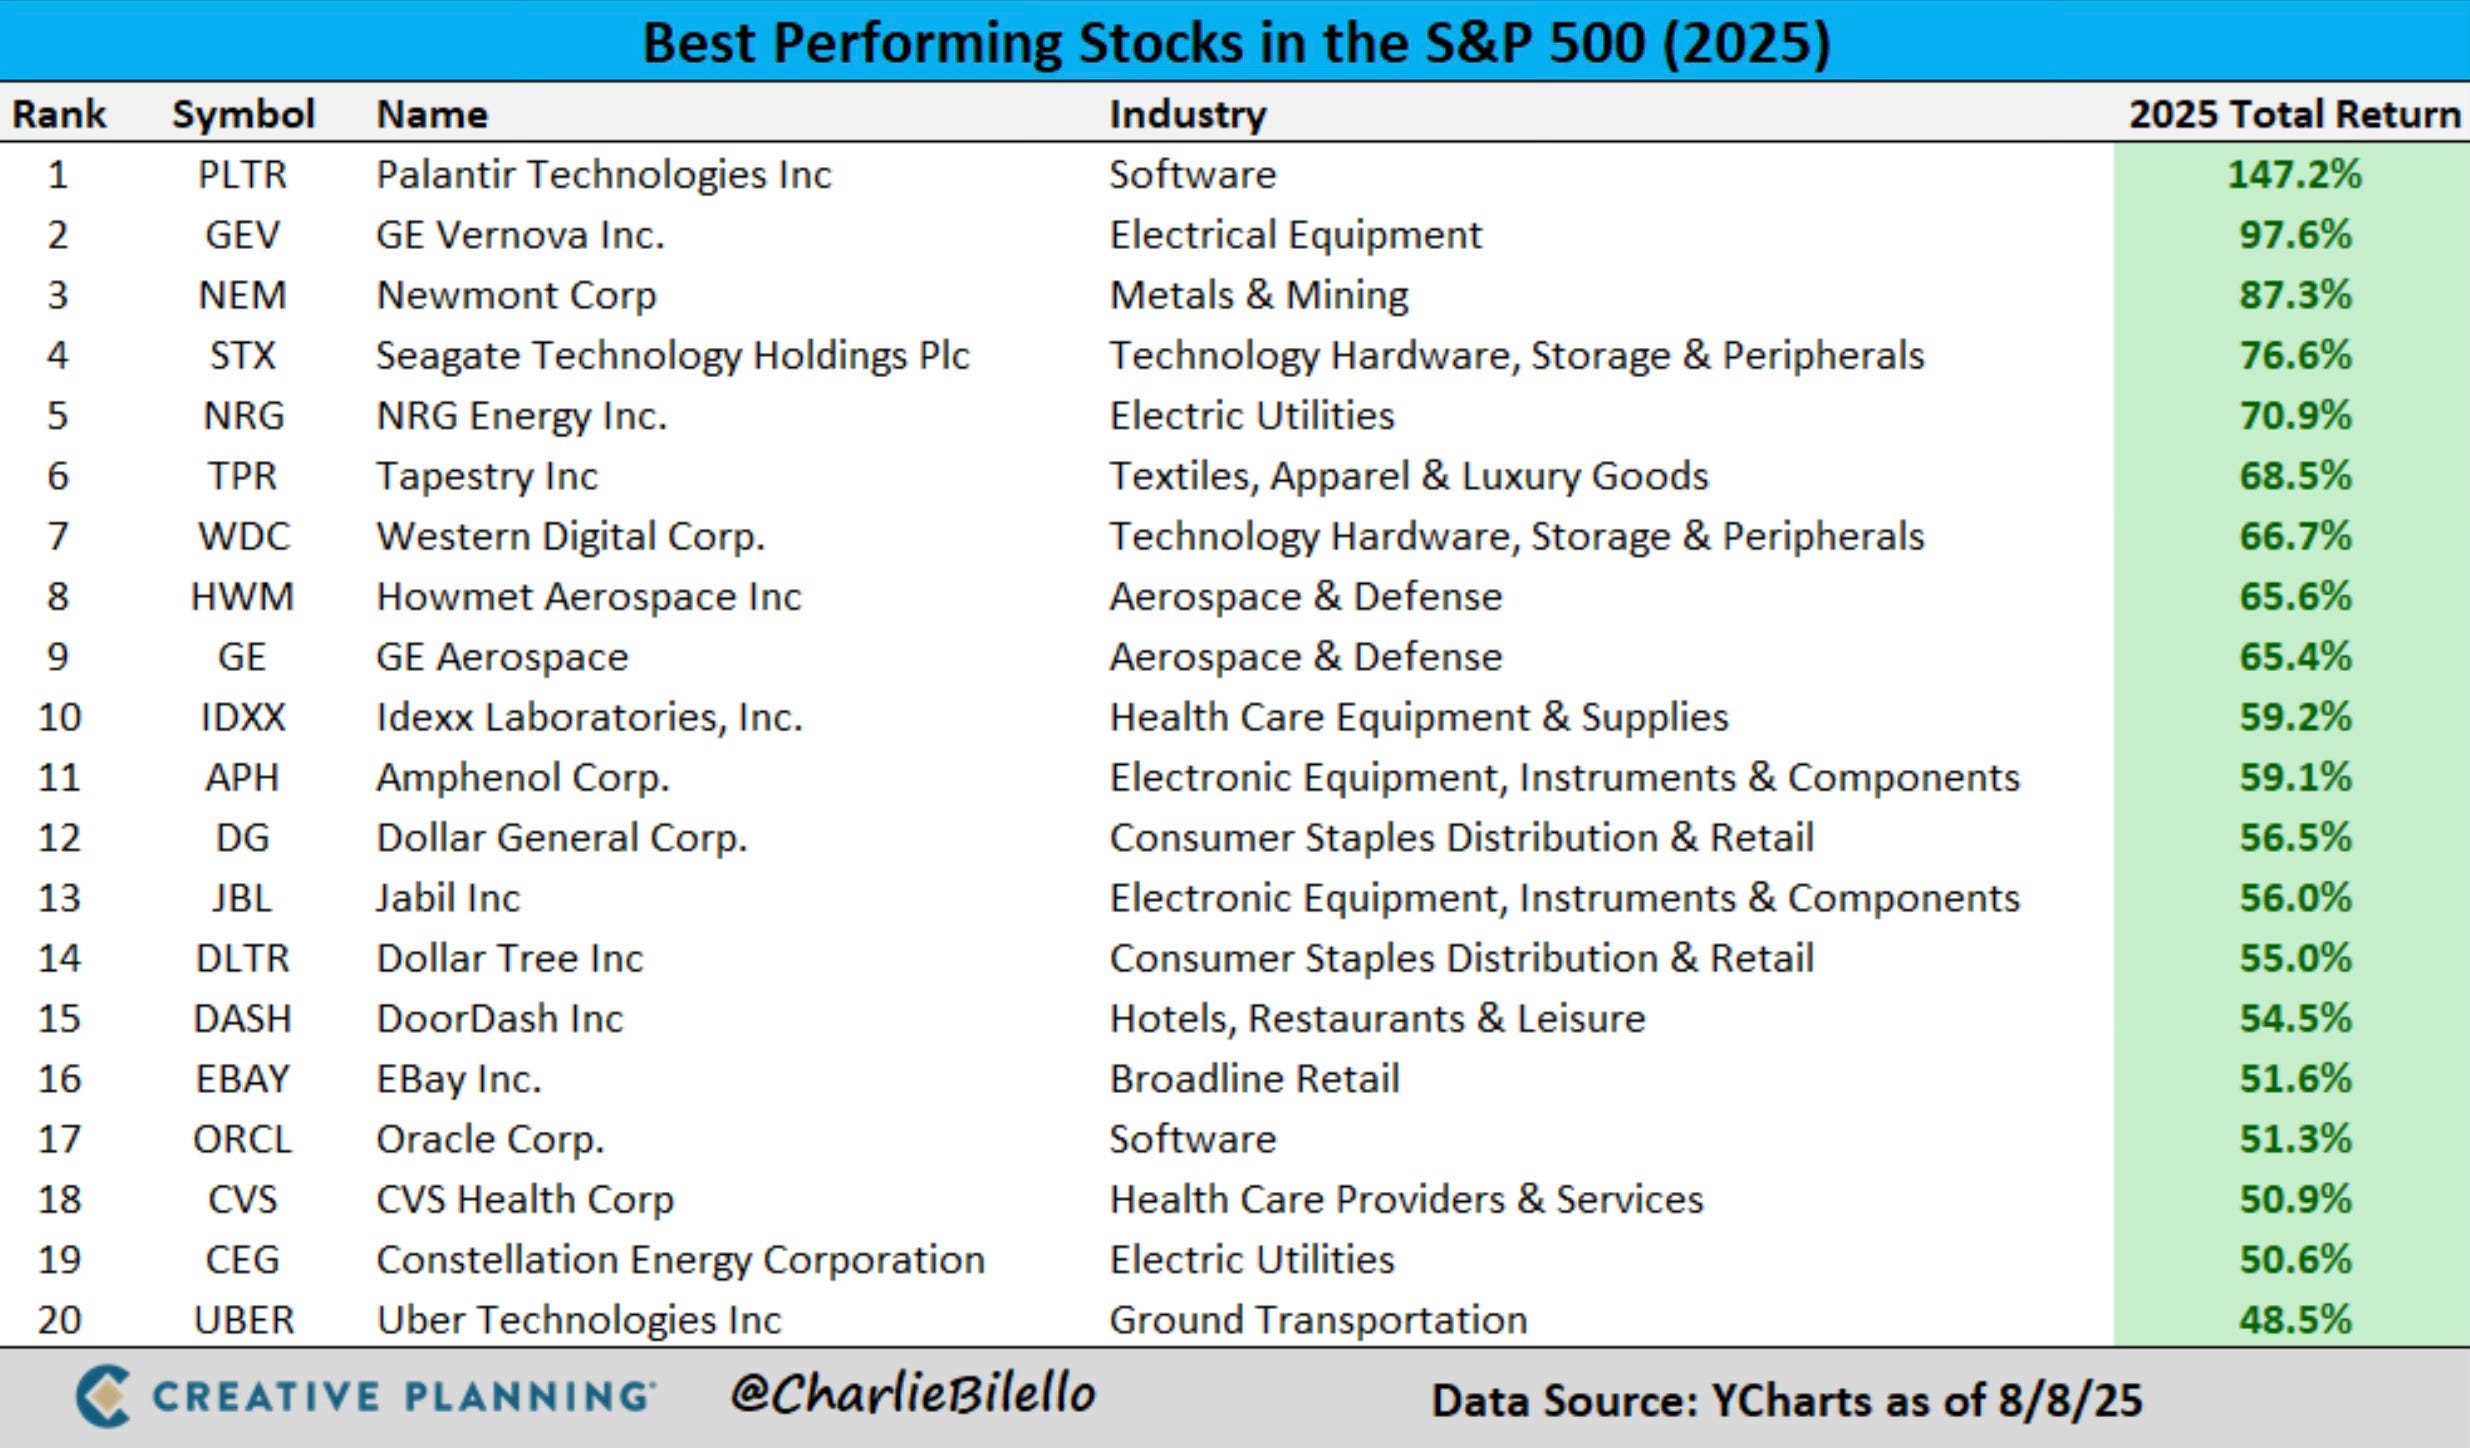
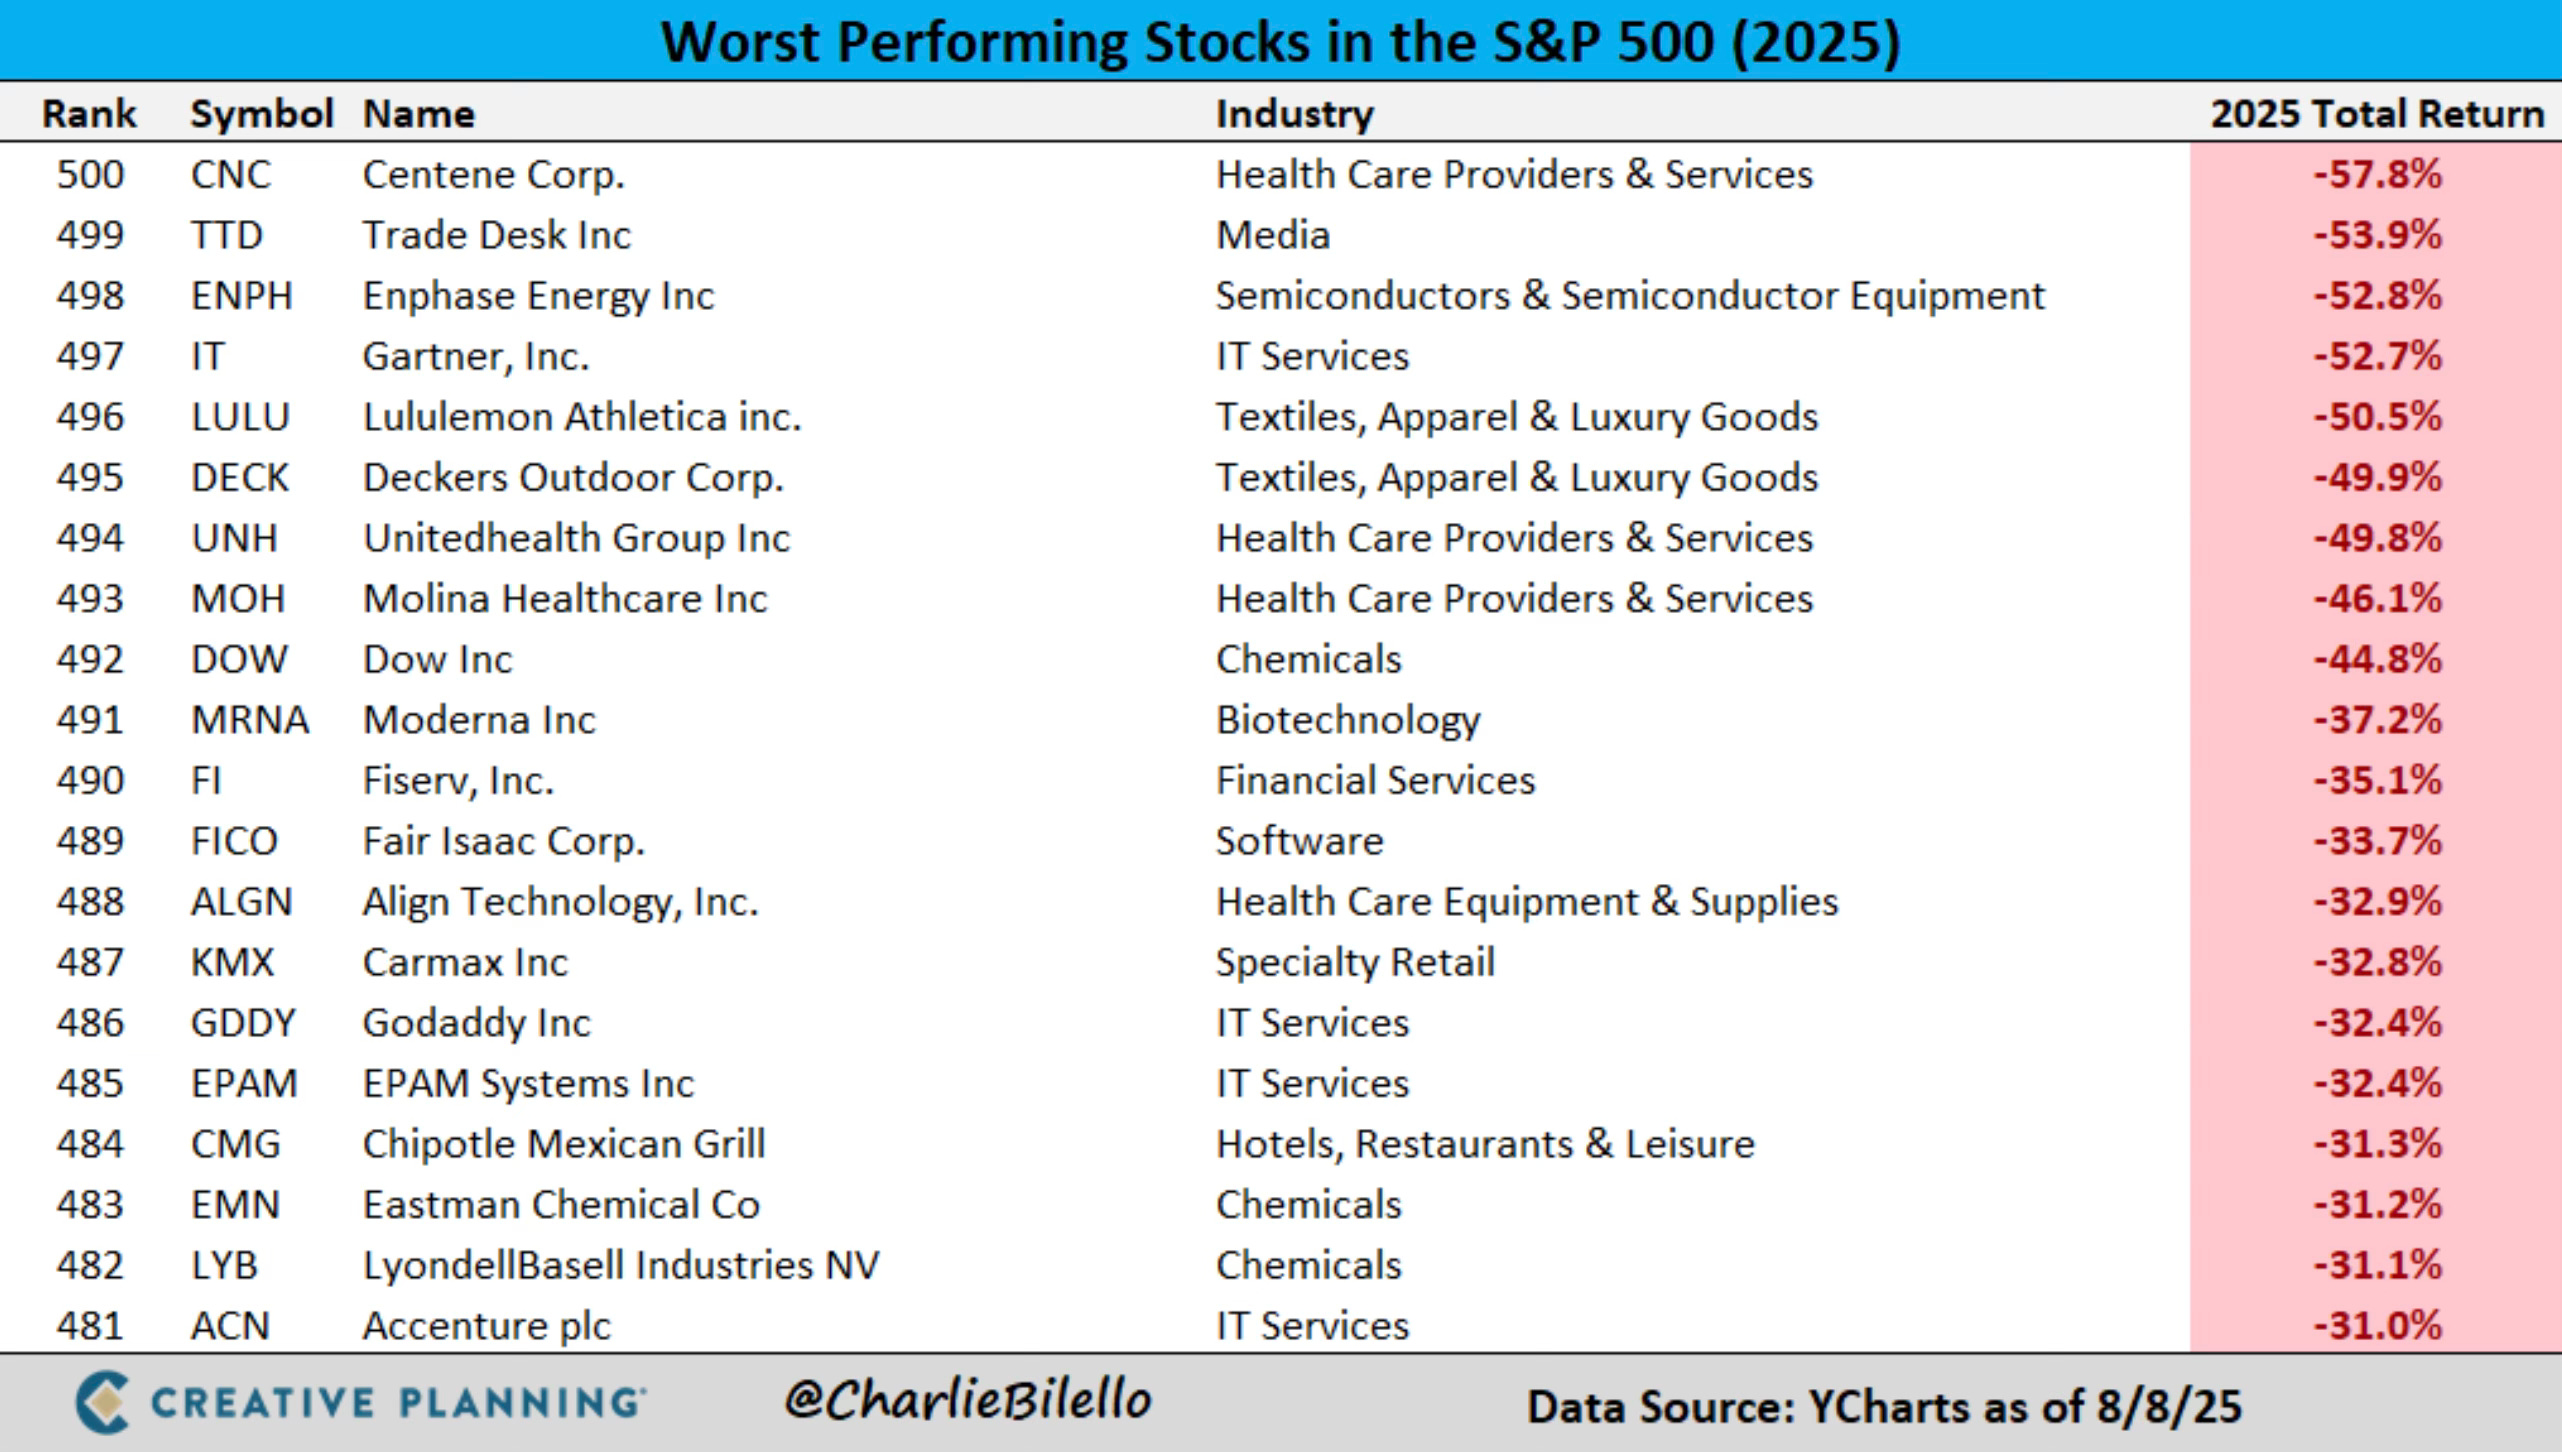
Best & Worst S&P 500 Performers YTD