Investing Update: 2 Stocks I'm Watching
What I'm buying, selling & watching
What a roller coaster the stock market has been the last two weeks.
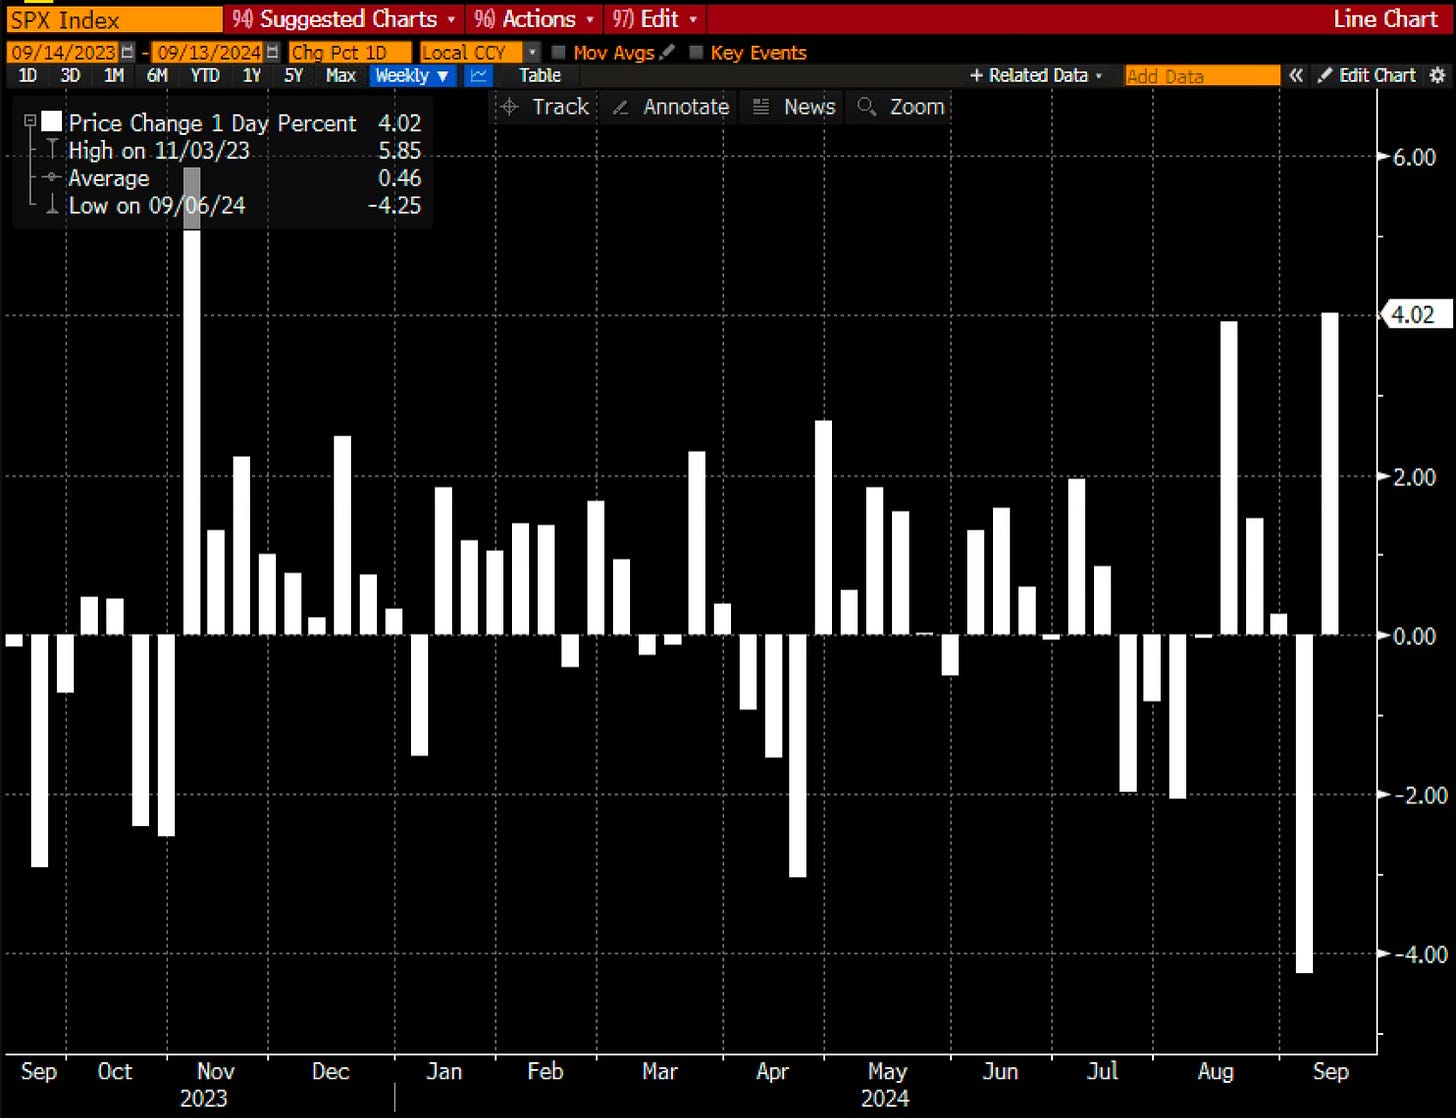
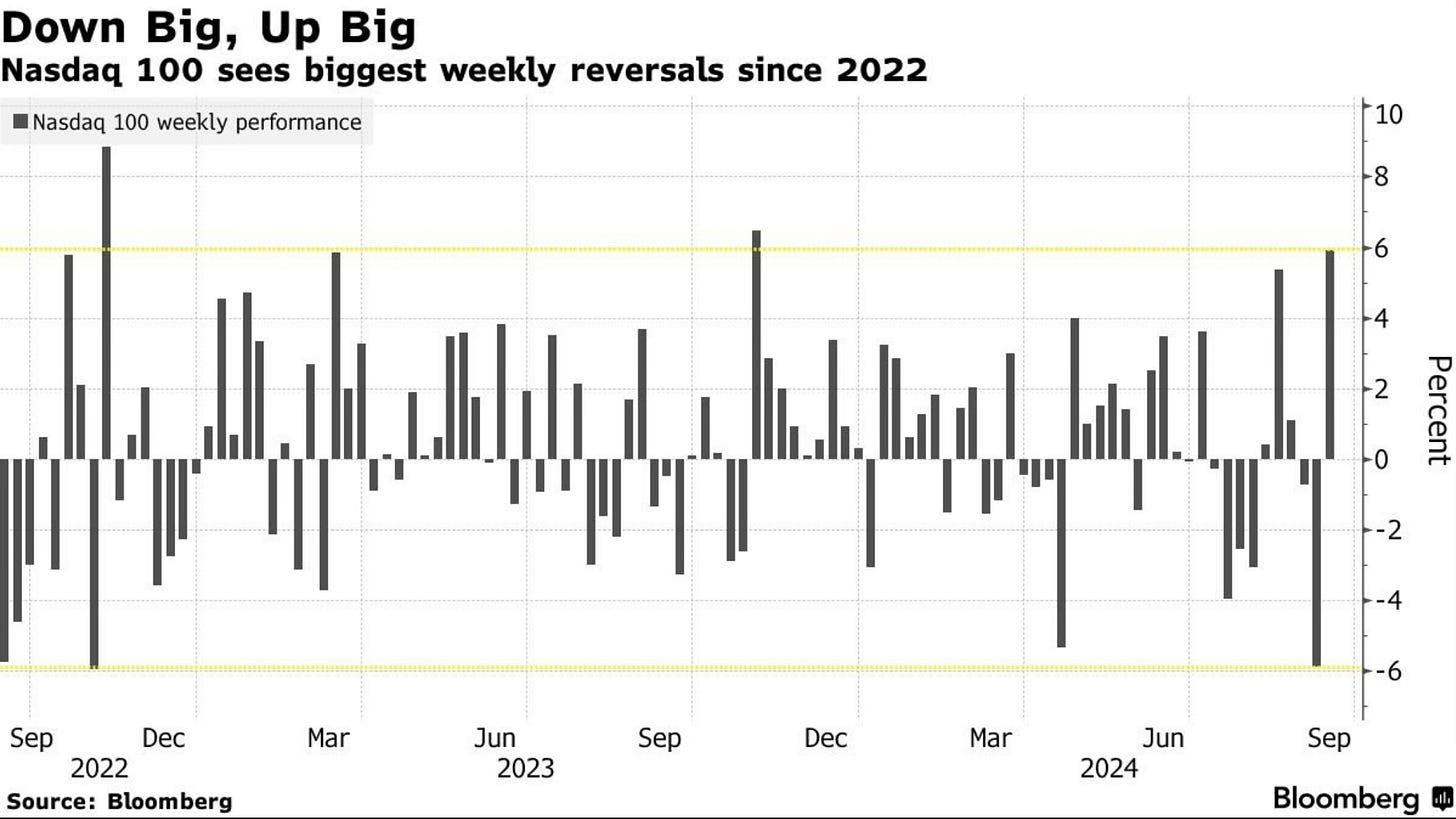
Last week the S&P 500 had its worst week since March 2023. The Nasdaq the worst week since June 2022.
This week instead of tumbling down farther, the stock market reversed course and rocketed higher.
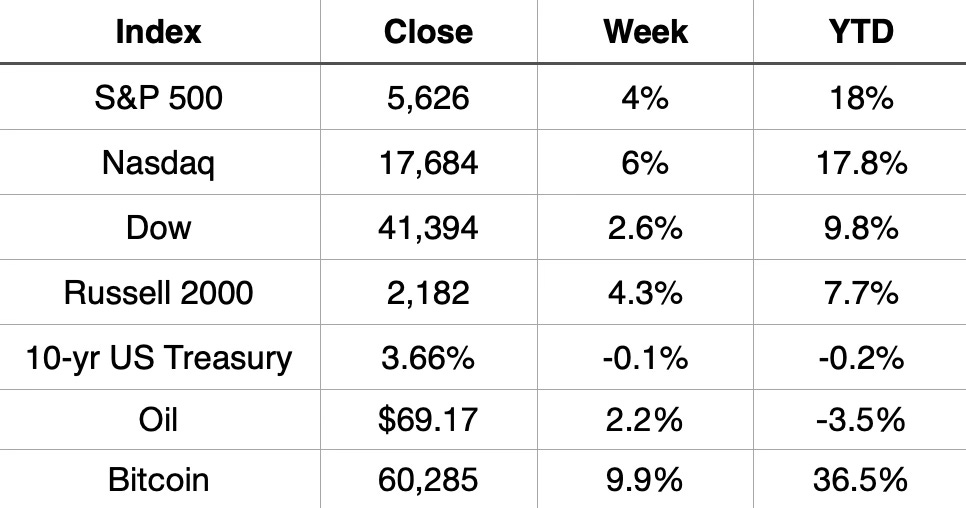
It was the best week of the year for the S&P 500, which finish up 4%. It finished positive everyday this week.
It was also the best week of the year for the Nasdaq as it finished up 6%.
Market Recap
Wednesday was the biggest day of volatility as the session saw the S&P 500 down almost 2% but finished the day up over 1%. Ryan Dietrick had some interesting context for what that big of a move means and what it may be saying.
The last time the S&P 500 was down >1.5%, but finished up >1%? The exact lows at the end of the vicious bear market in Oct '22. It happened again today. Looking at previous big reversal days like this shows better than avg returns across the board.

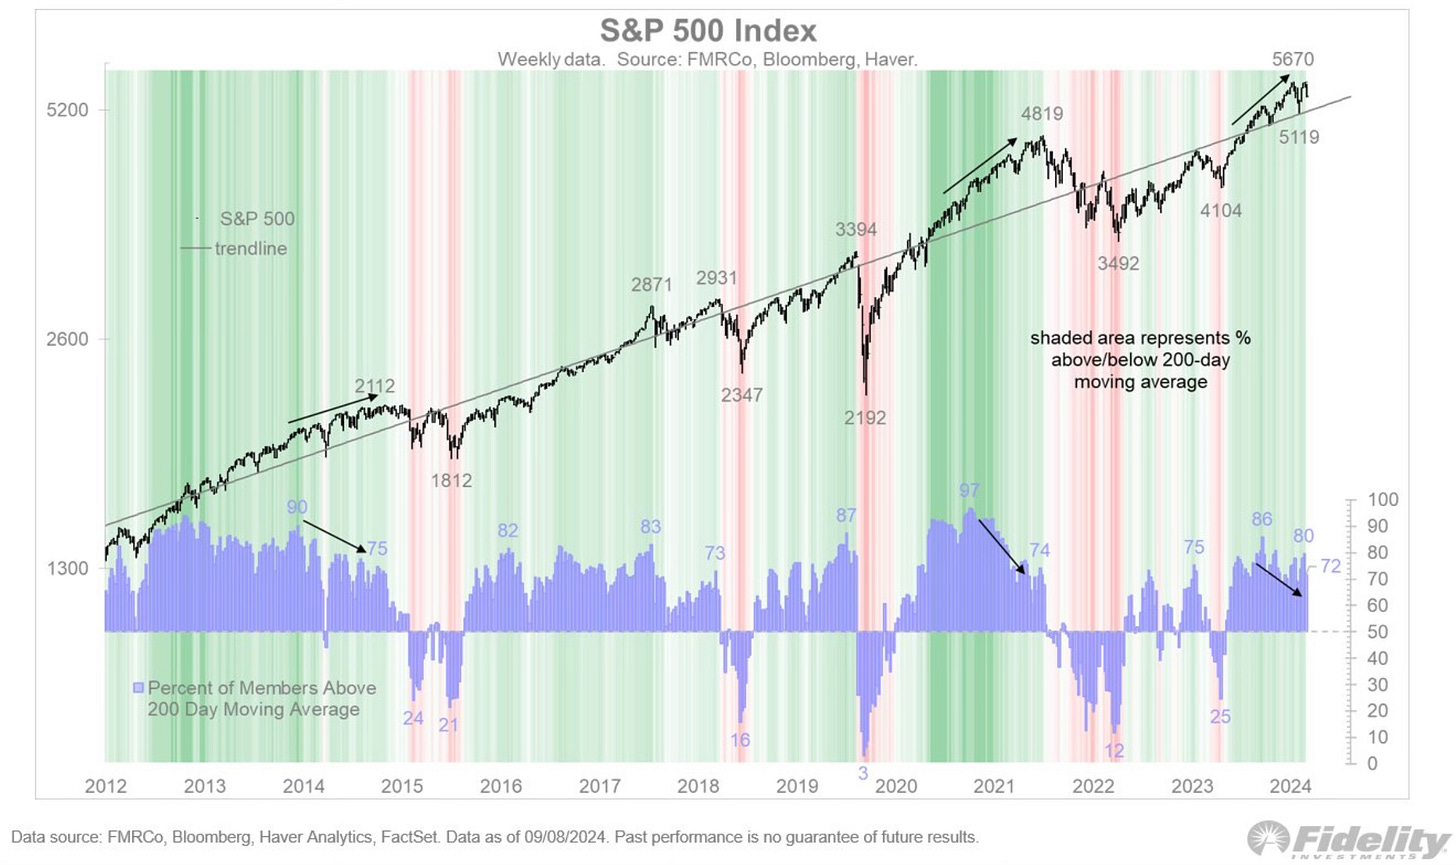
The fact is that 72% of stocks and 11 sectors remain in an uptrend. It’s very hard to keep that strong of a market down very long.
Inflation Battle Looks To Be Over
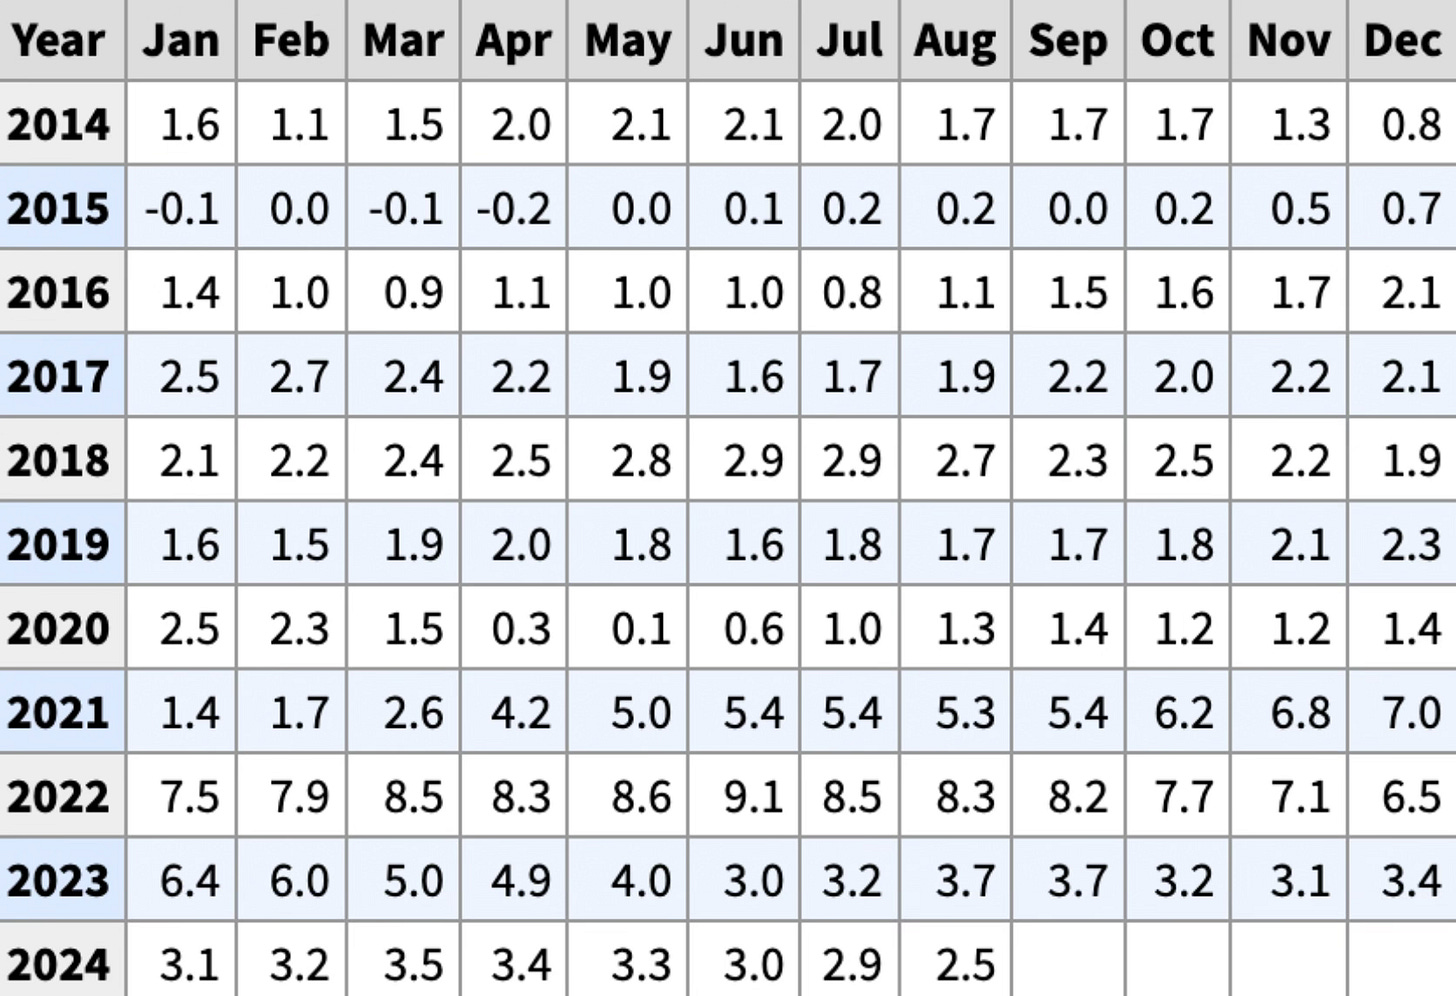
The CPI inflation reading came out this week at 2.5%. That’s the lowest number since February 2021. Core inflation was at 3.2%, the lowest since April 2021.
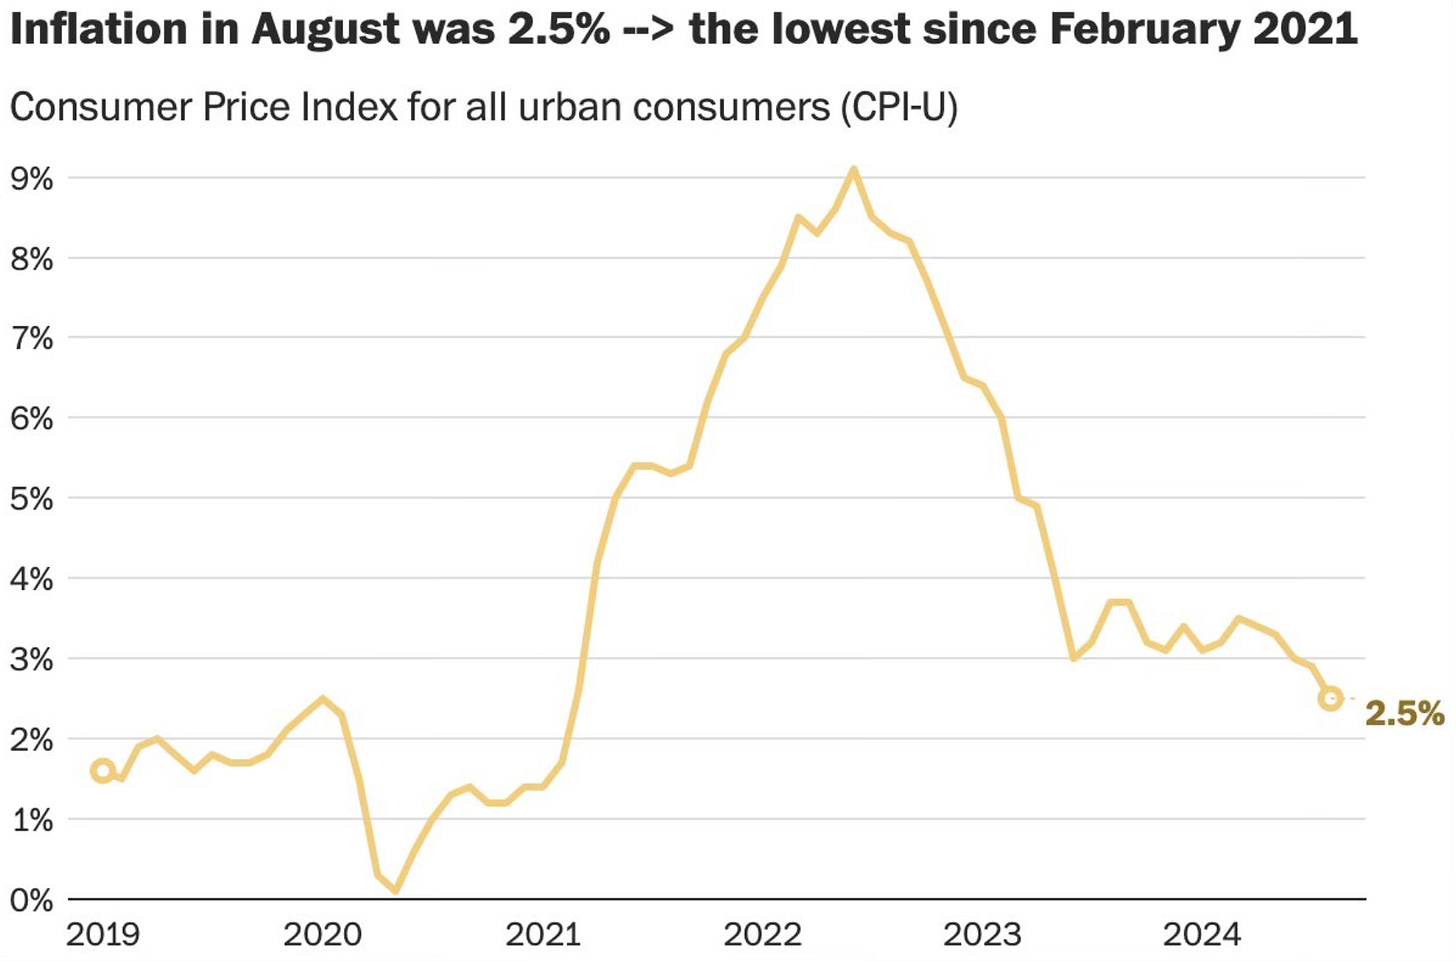
In just over 2 years, inflation has gone from 9.1% to 2.5%.
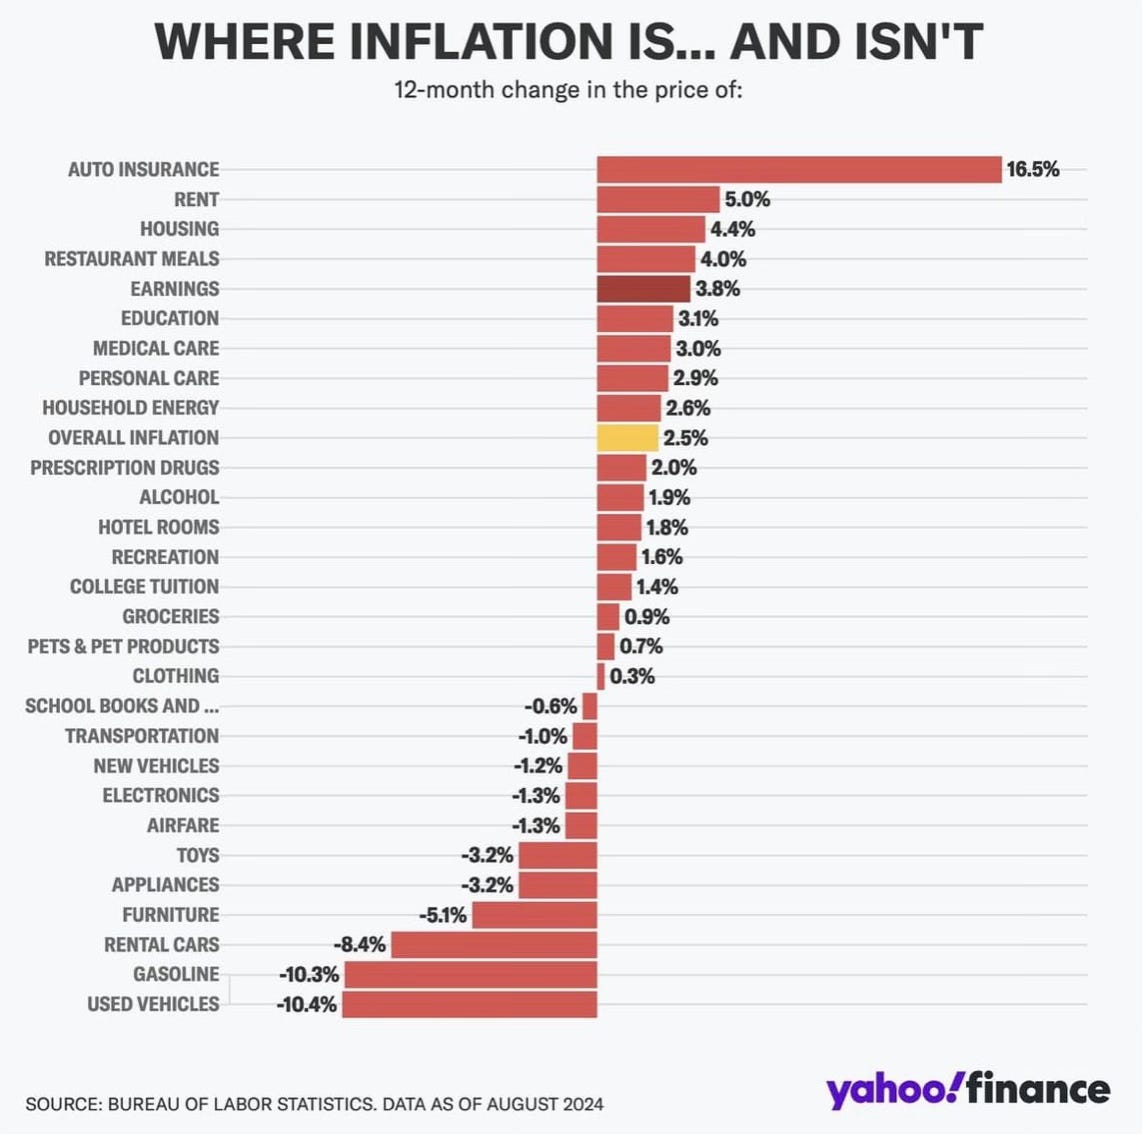
The battle of inflation looks to have been won. Here is a good visual showing where inflation is still present and also some areas that are now seeing deflation.
Price Drops For Consumers
Some areas of the economy are actually now seeing some significant price drops.
This week saw the biggest ever one week drop in shipping container rates
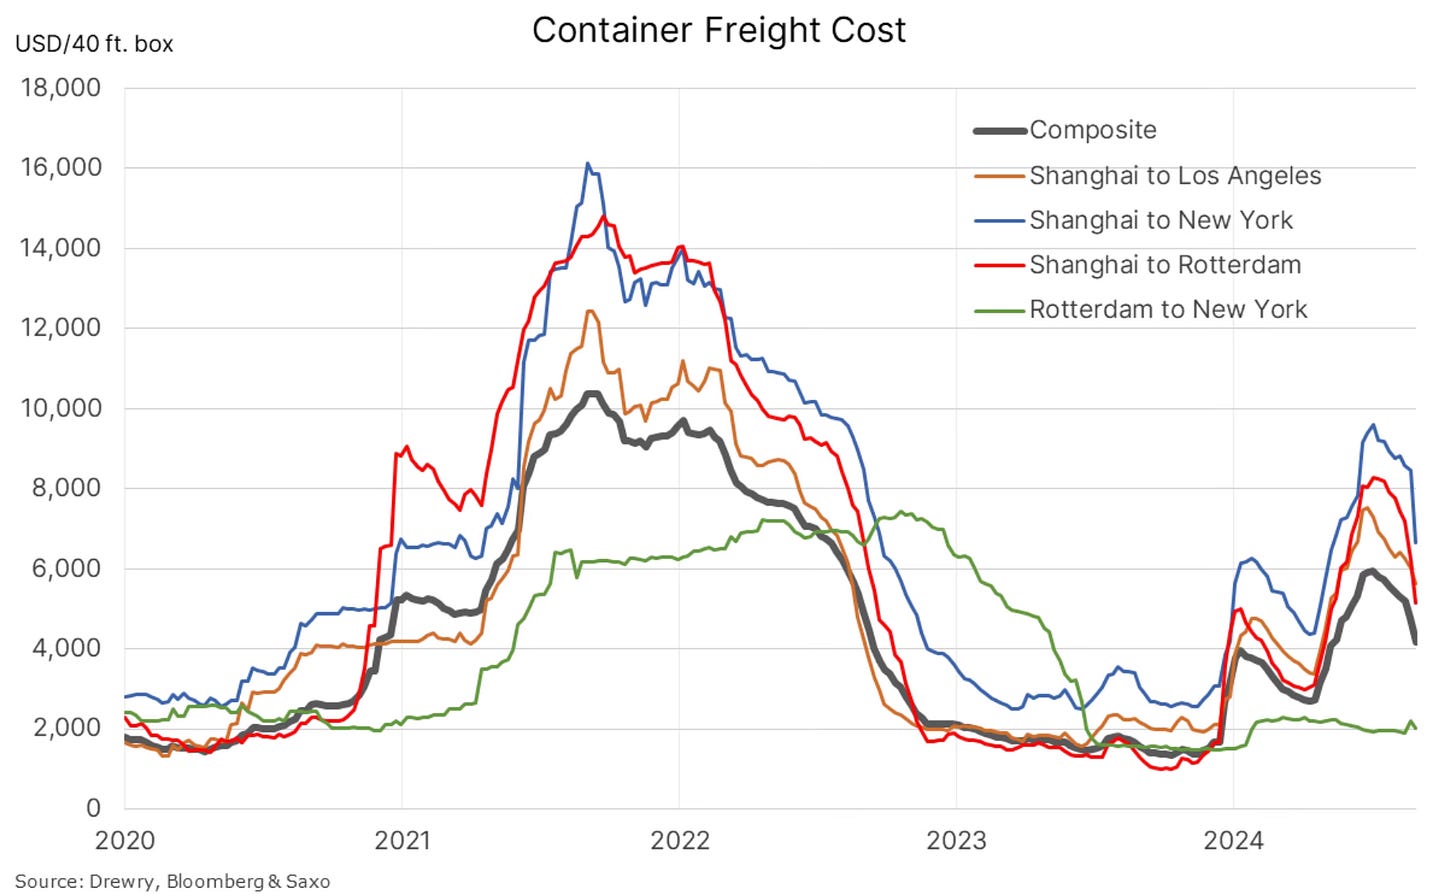
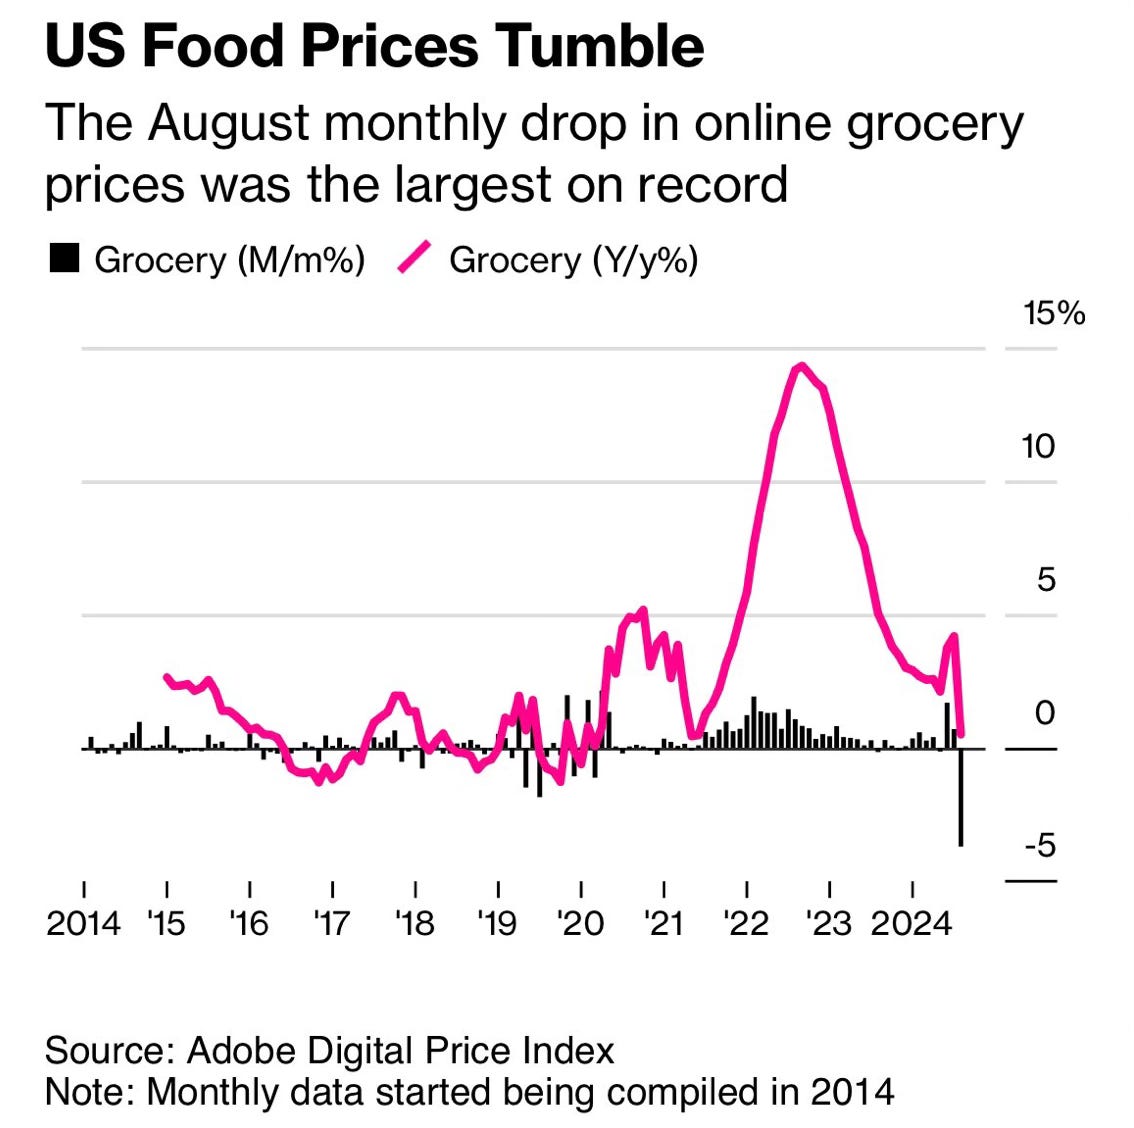
It also was the biggest ever one month drop in online grocery prices.
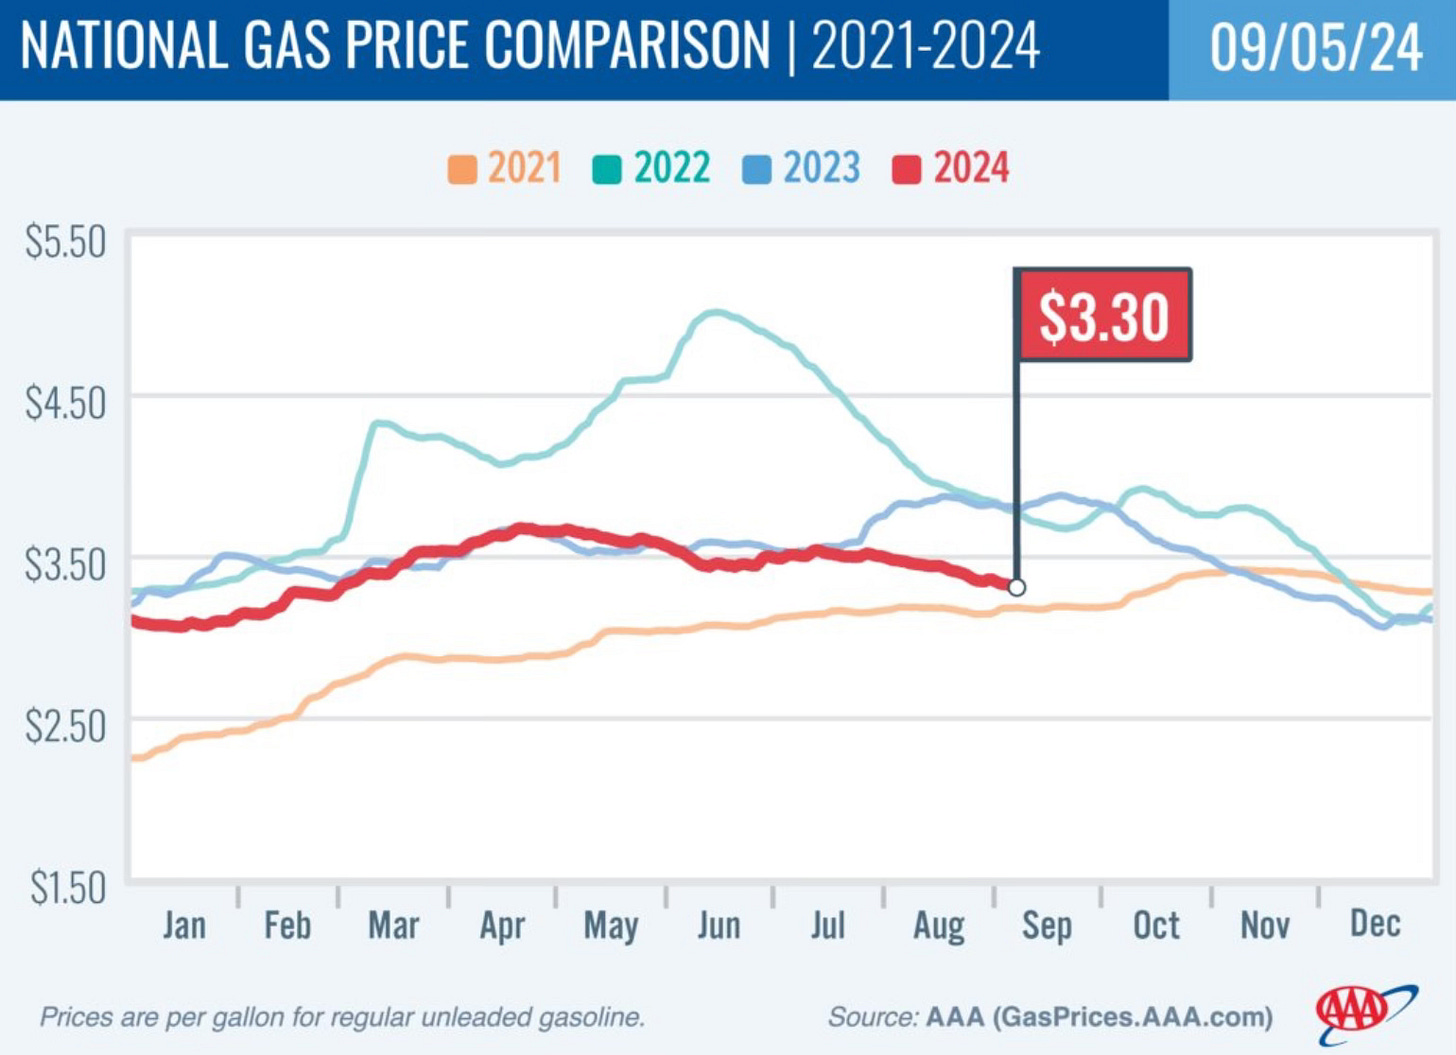
And have you noticed what the price of gasoline has done? Here in Wisconsin we’re back under $3 a gallon. It’s been a long time. Nationally it looks like the price is about to fall below 2021 levels.
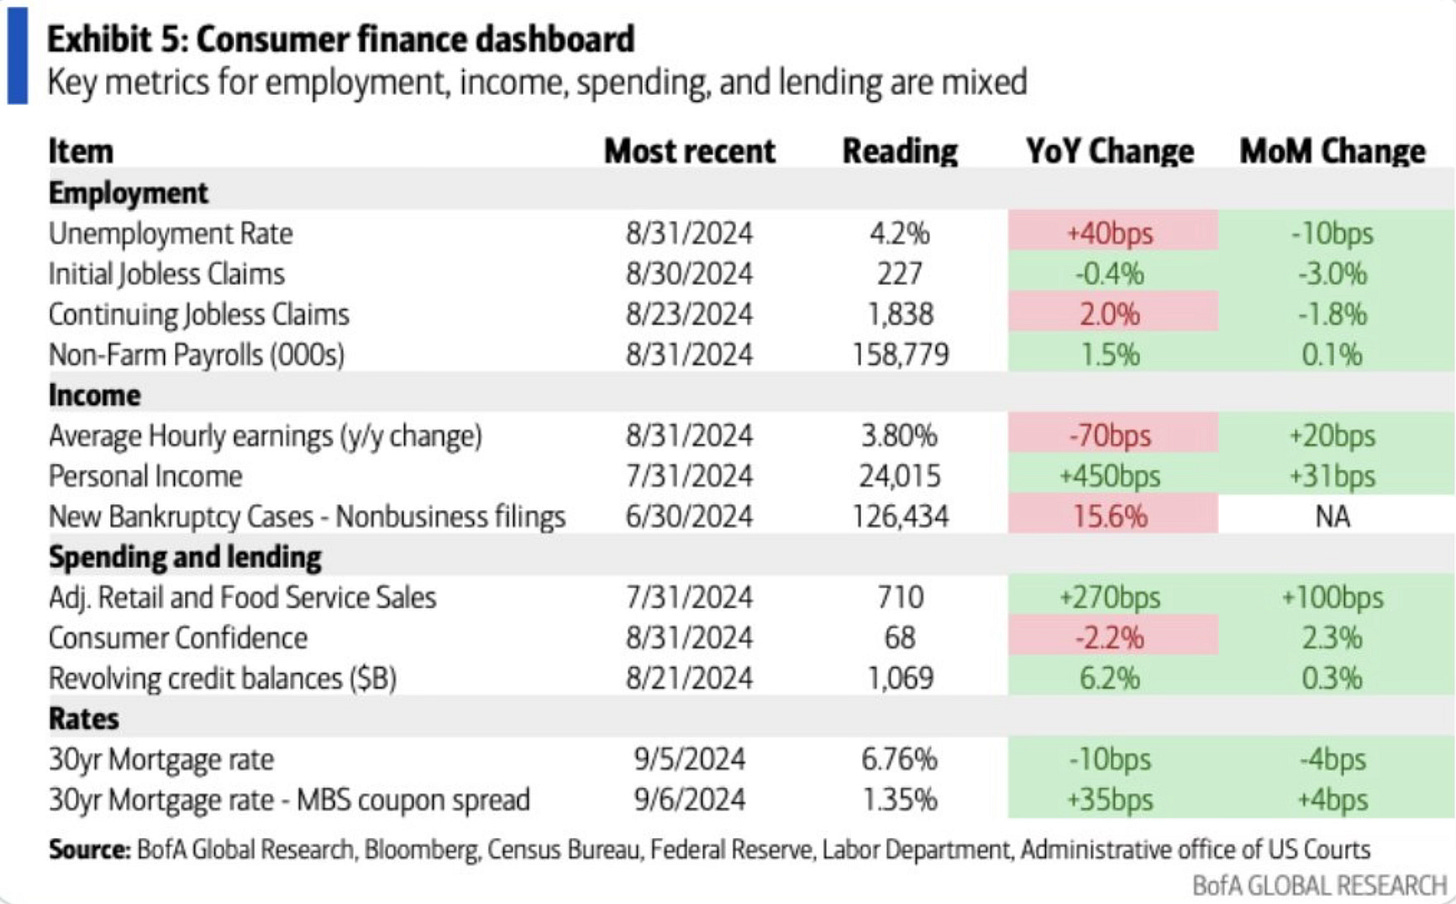
As we look at the Consumer Finance Dashboard, you can see that consumer finance metrics look quite strong. Signaling positives for the consumer.
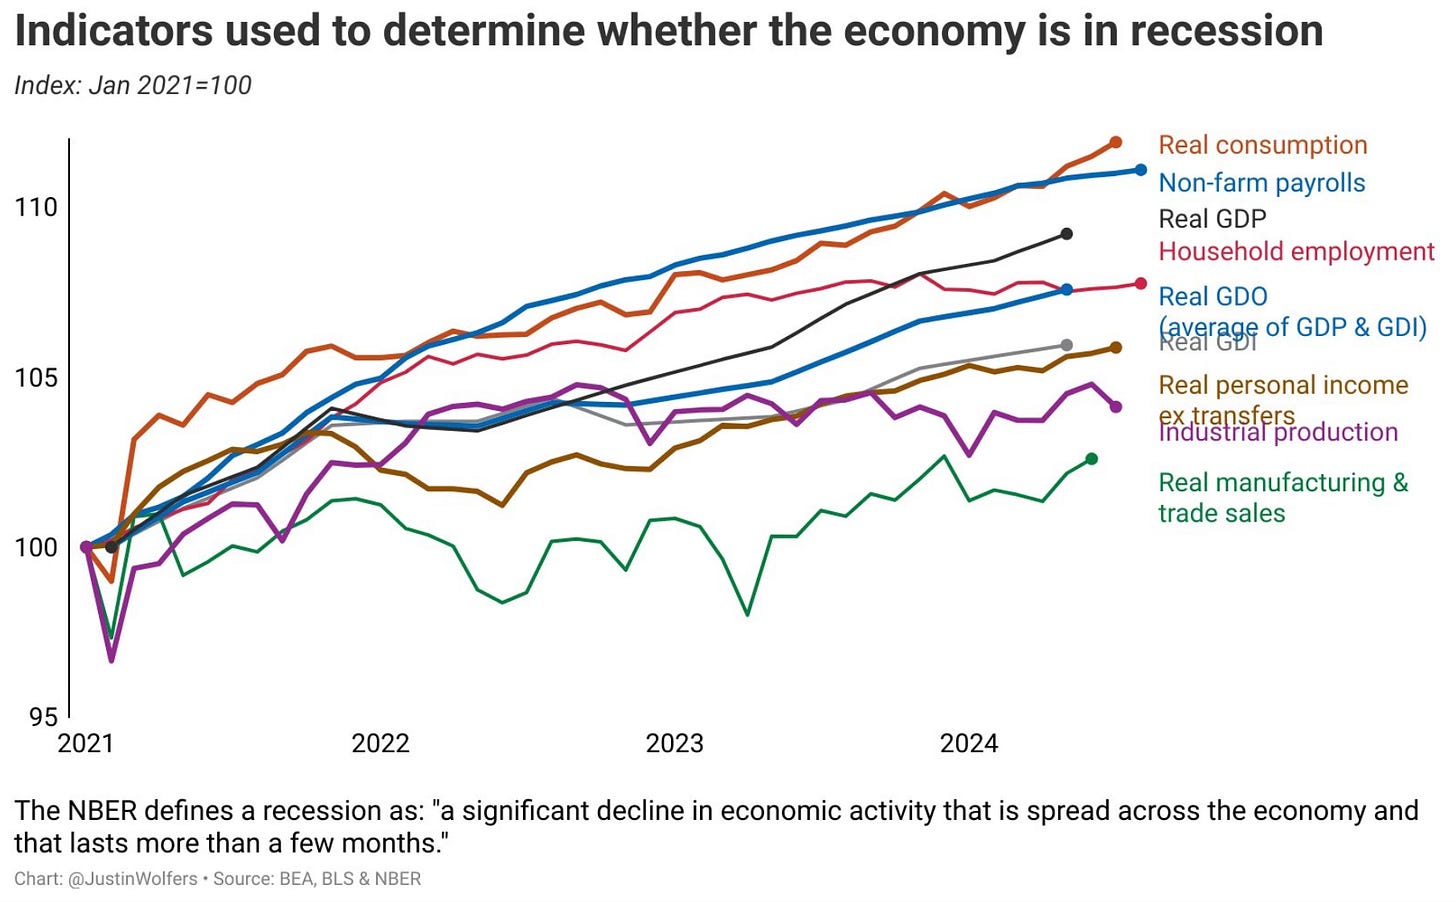
Then just to check in on the updated chart of recession indicators. Still nothing to see other than a continued steady growing economy.
Market Returns Around The Election
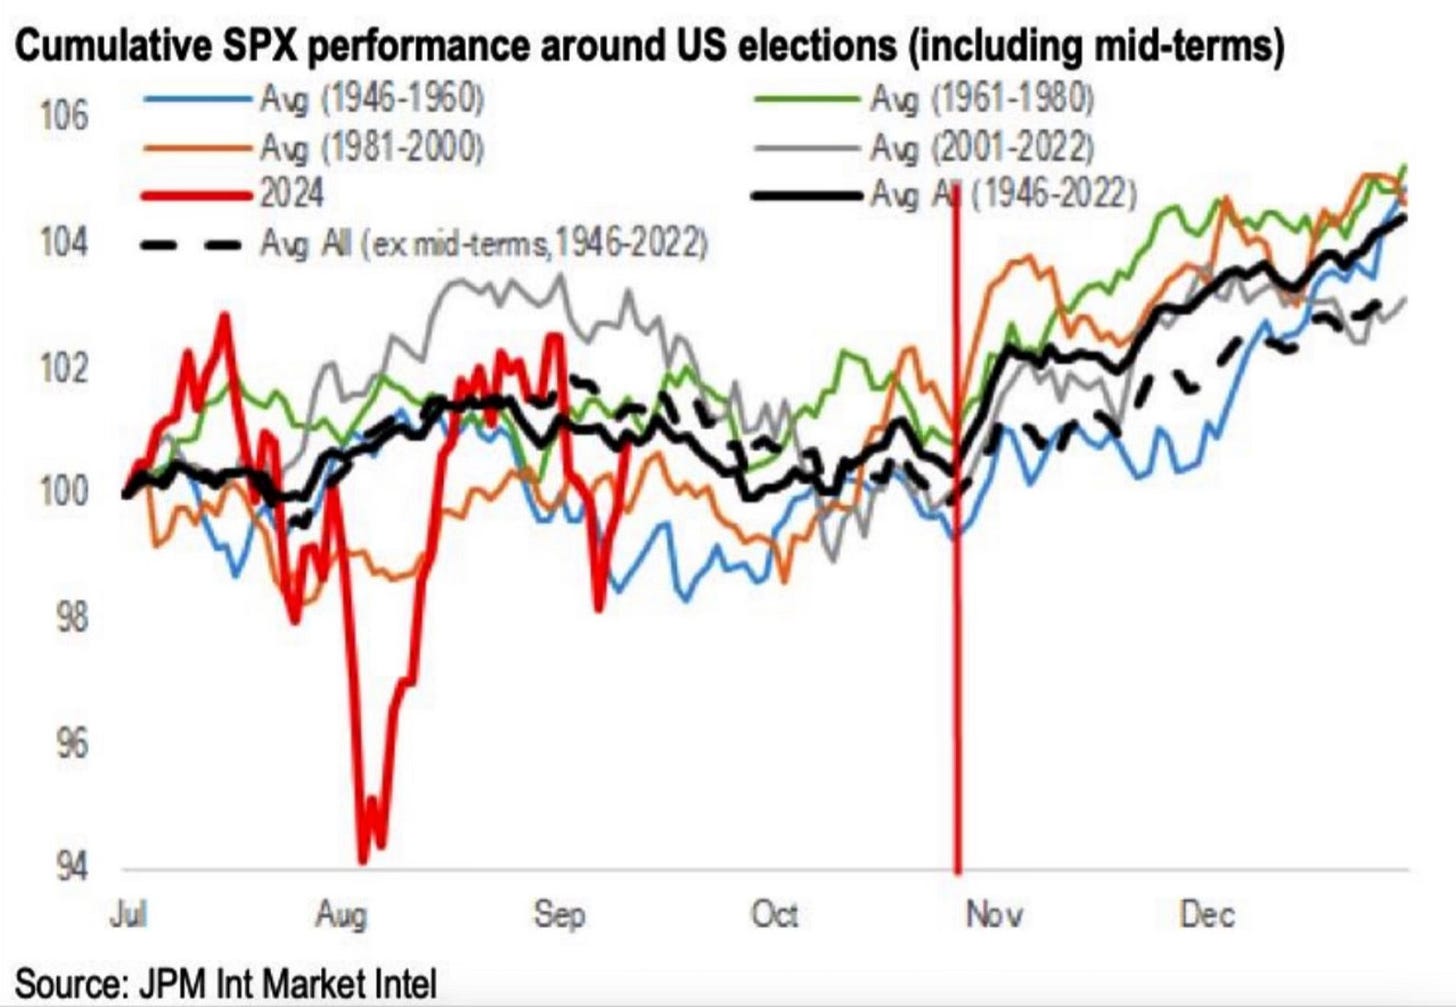
As the election slowly inches closer, we look to what the stock market and sectors tend to do once it’s over.
Looking back over the past elections, once it’s in the past the S&P 500 tends to rally higher.
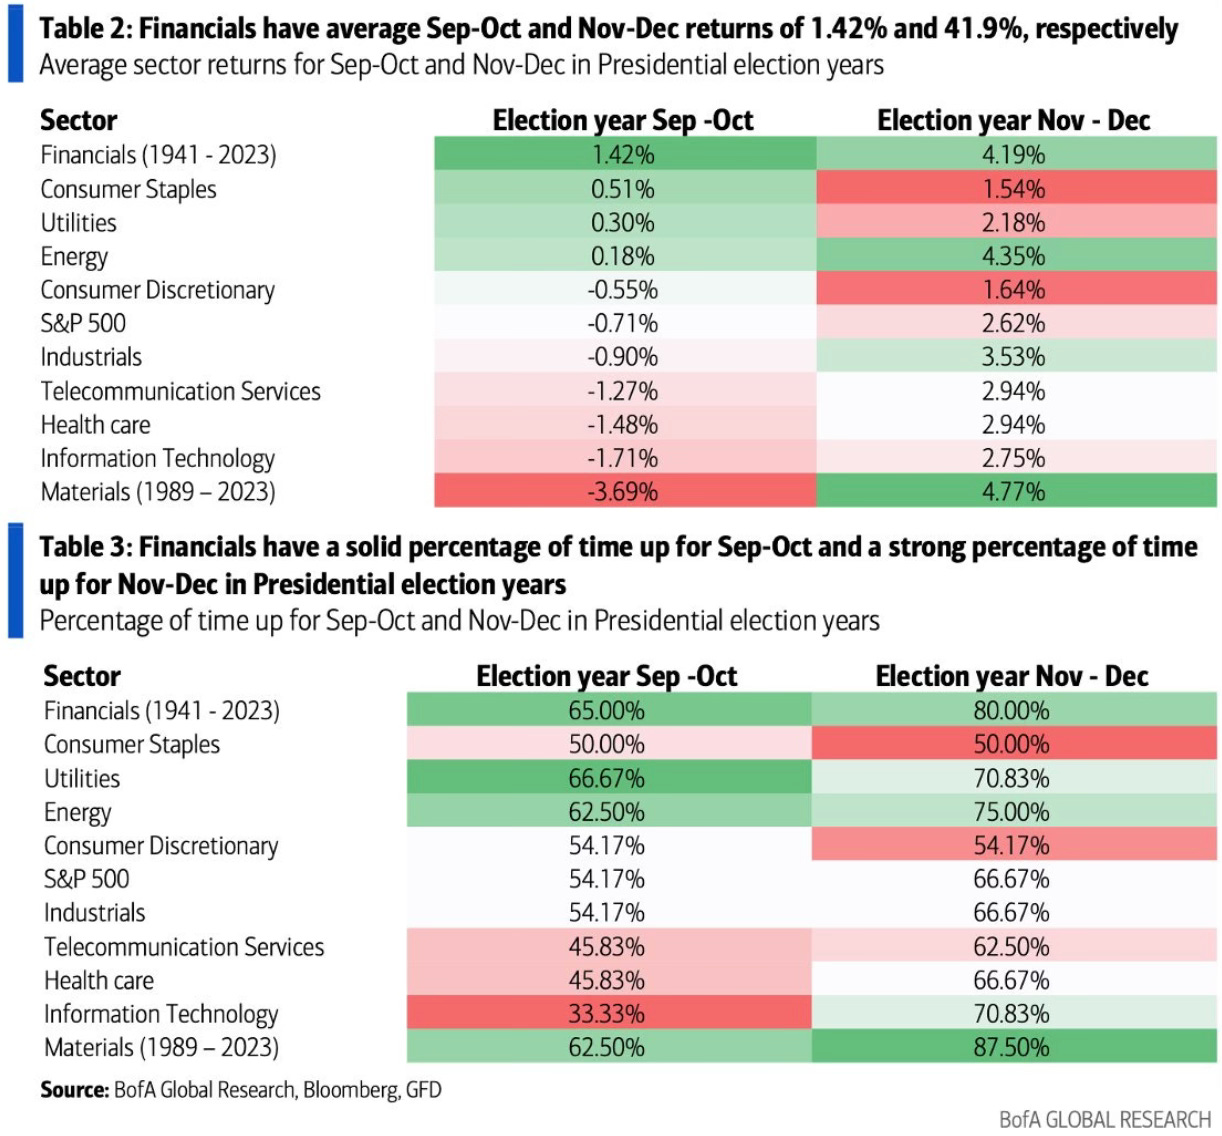
If we look at the sector levels, you can see which areas tend to perform well and not so well in the time leading up to the election and after. The performance of financials really stands out.
Bull Market Length
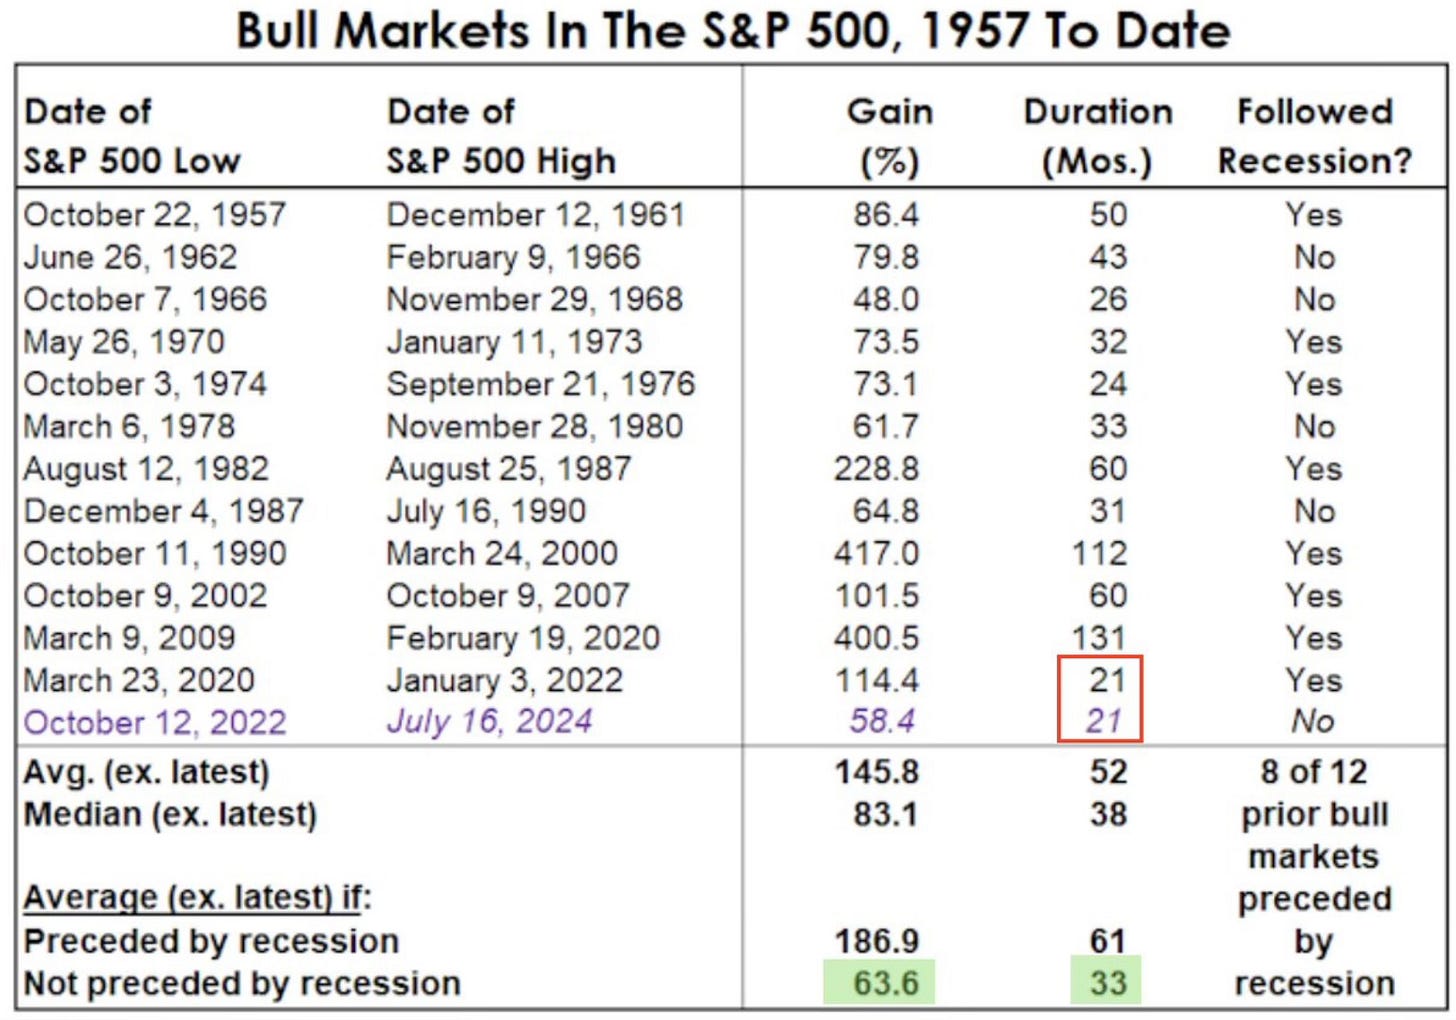
Seth Golden points out that the average length of a bull market is 33 months. That would take this bull market cycle out until May 2025. Right now the length of this bull market (21 months) matches the shortest bull market in history, the last one which ended in January 2022.
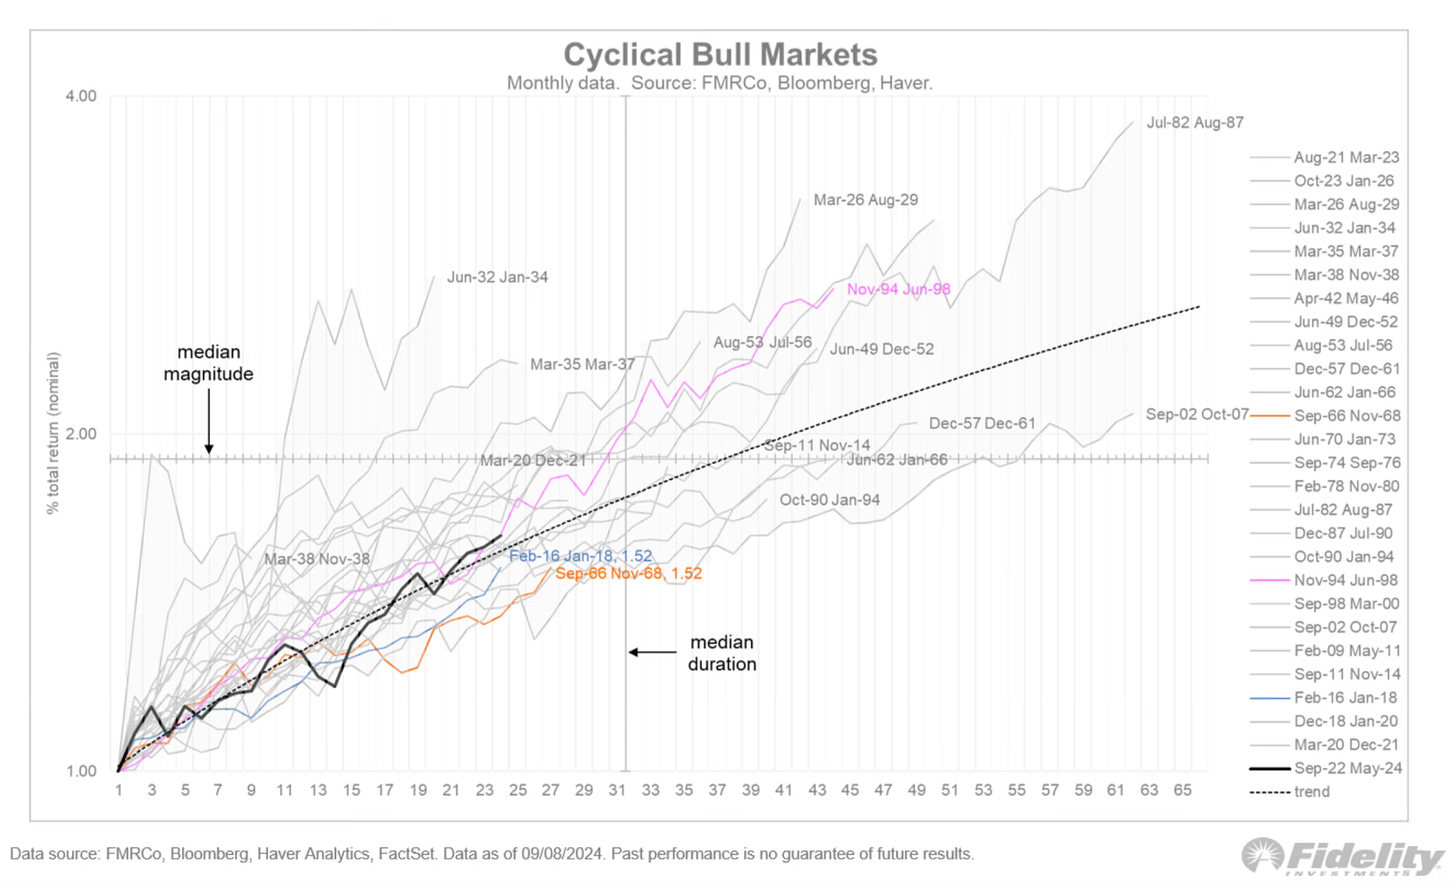
Here is a nice look at where this current bull market is at compared to other bull markets dating back to 1957.
This chart shows just how early in a typical bull market cycle we’re in.
It’s Not Only The Magnificent 7
I still continue to hear people try and tell me and others that this is a stock market that’s only about the Mag 7. I love it when people refer to the Mag 7 as a deck of cards that will soon fall and collapse it all. These are the perfect people to never discuss the stocks market with again.
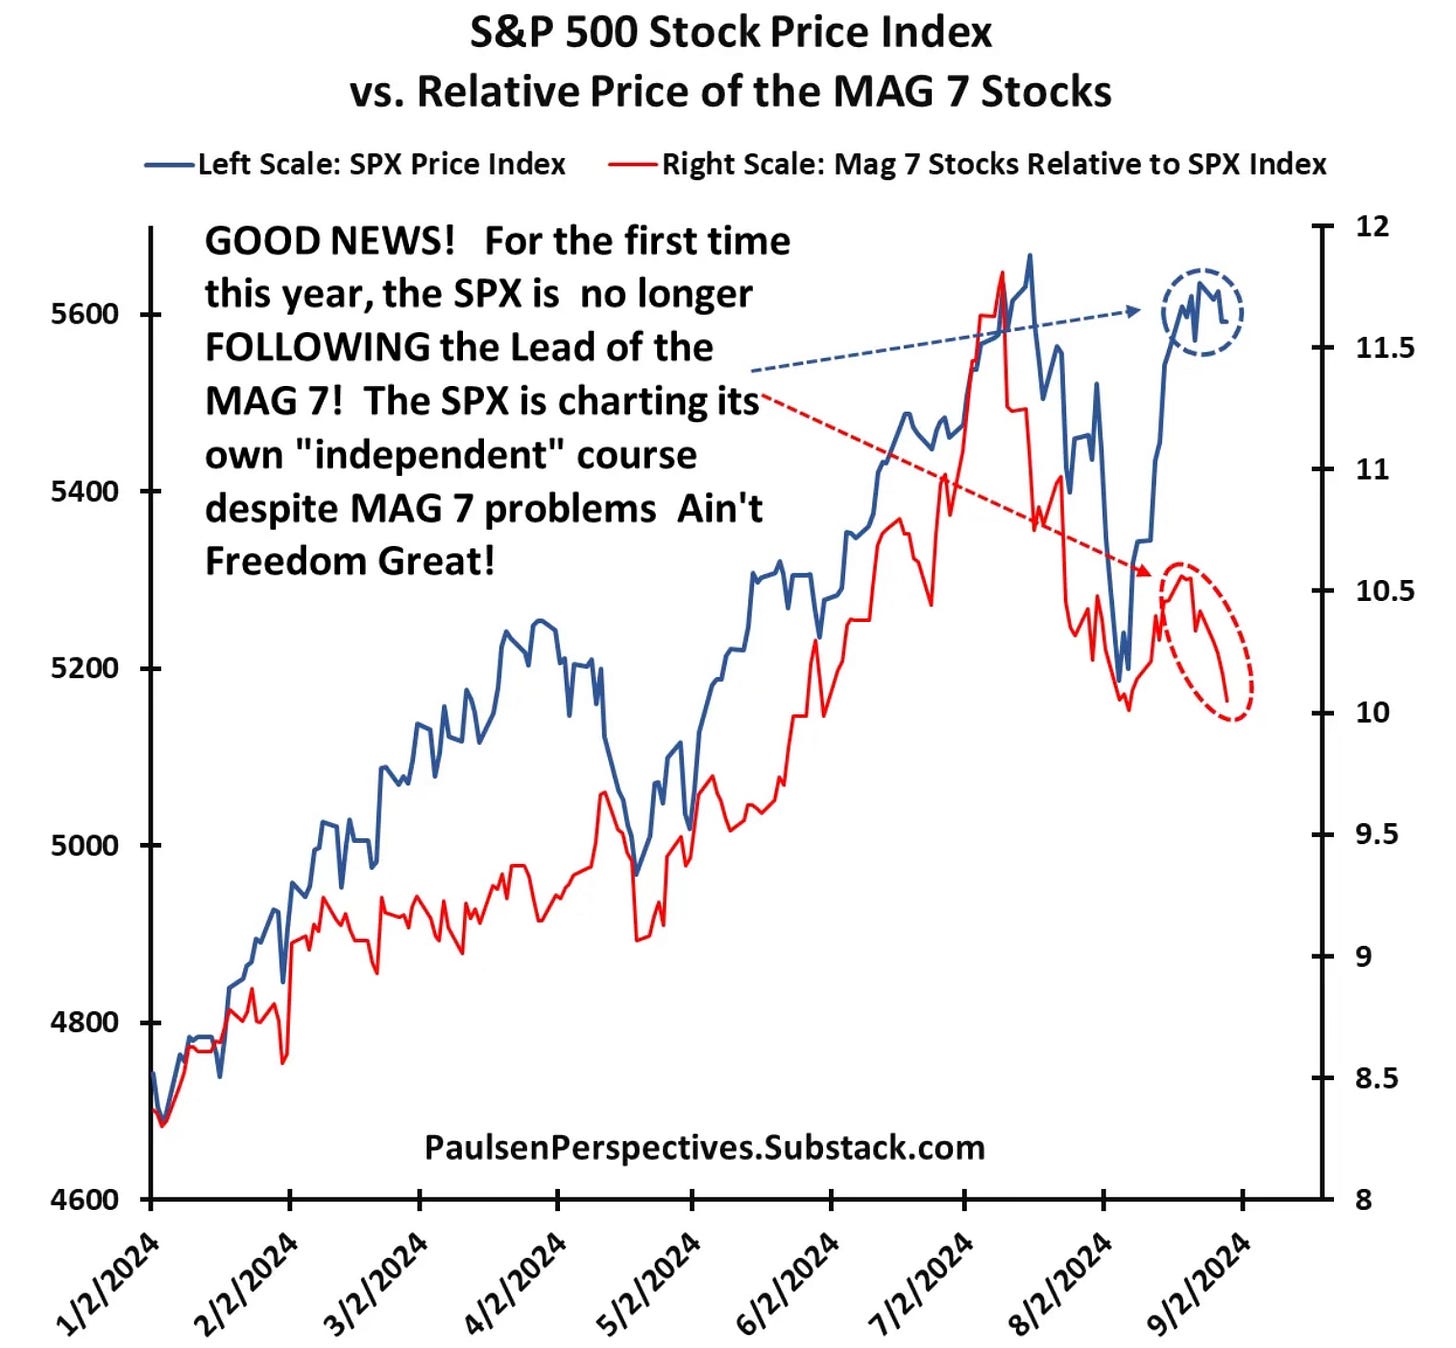
This is a great chart from Jim Paulsen showing that the S&P 500 has broke free of following the Mag 7. It’s now creating its own path. The Mag 7 have actually continued to weaken and underperform of late.
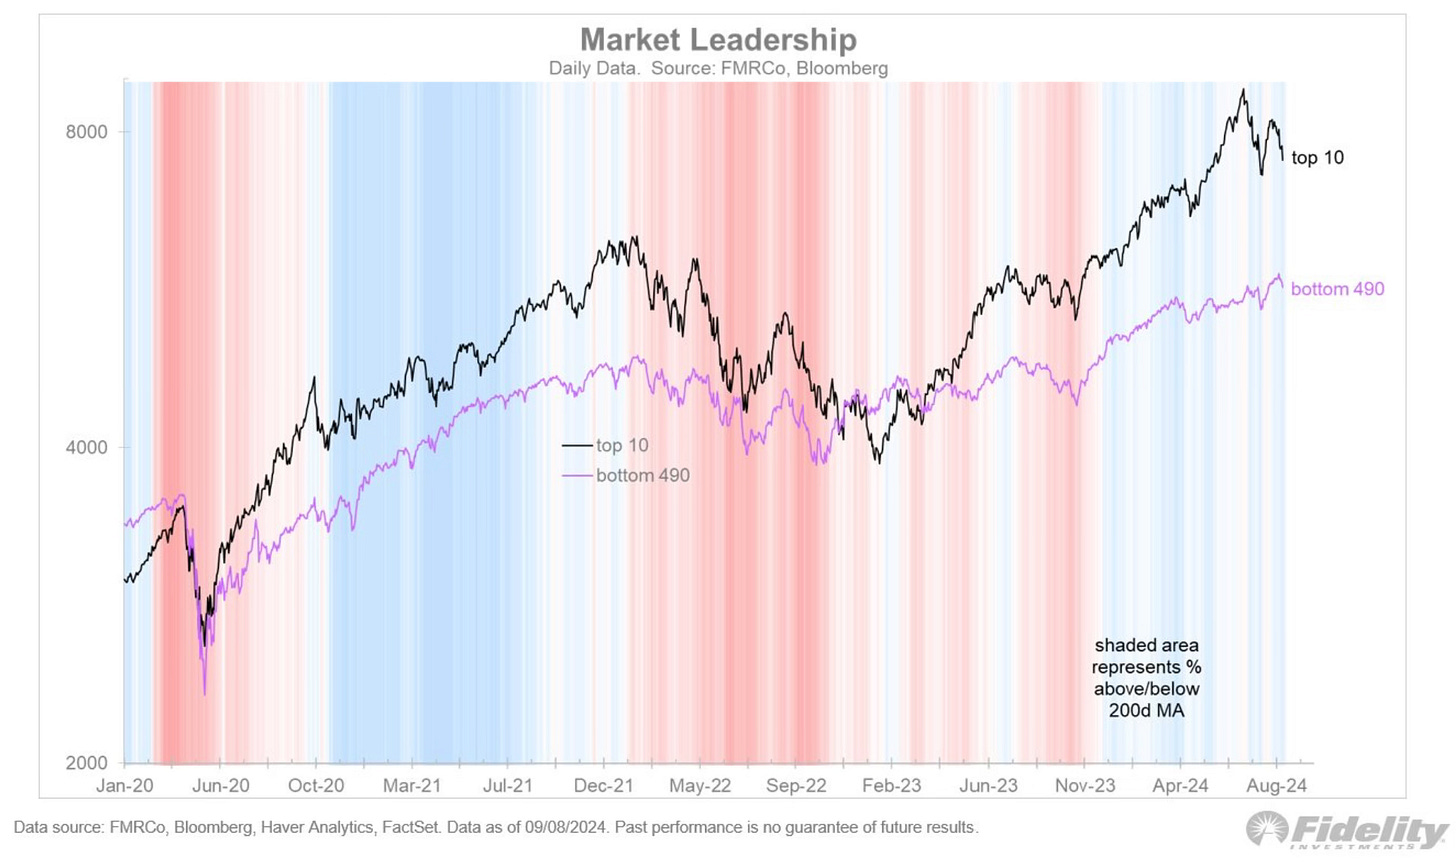
It even goes a little father than the Mag 7. The top 10 stocks have all been treading water lately. The other 490 stocks not so, they’ve been in a strong have uptrend. I wouldn’t be shocked to see this gap tighten further.
Small Business Red Flags?
The August NFIB Small Business Survey results came out and an area of concern stuck out to me. The earnings picture has now dropped for three straight months for 37% of small businesses. This is now weaker than the 35% in the depths of the pandemic. That really surprises me and makes me try and figure out what this is telling us. Or is it just noise? I’m not totally sure.

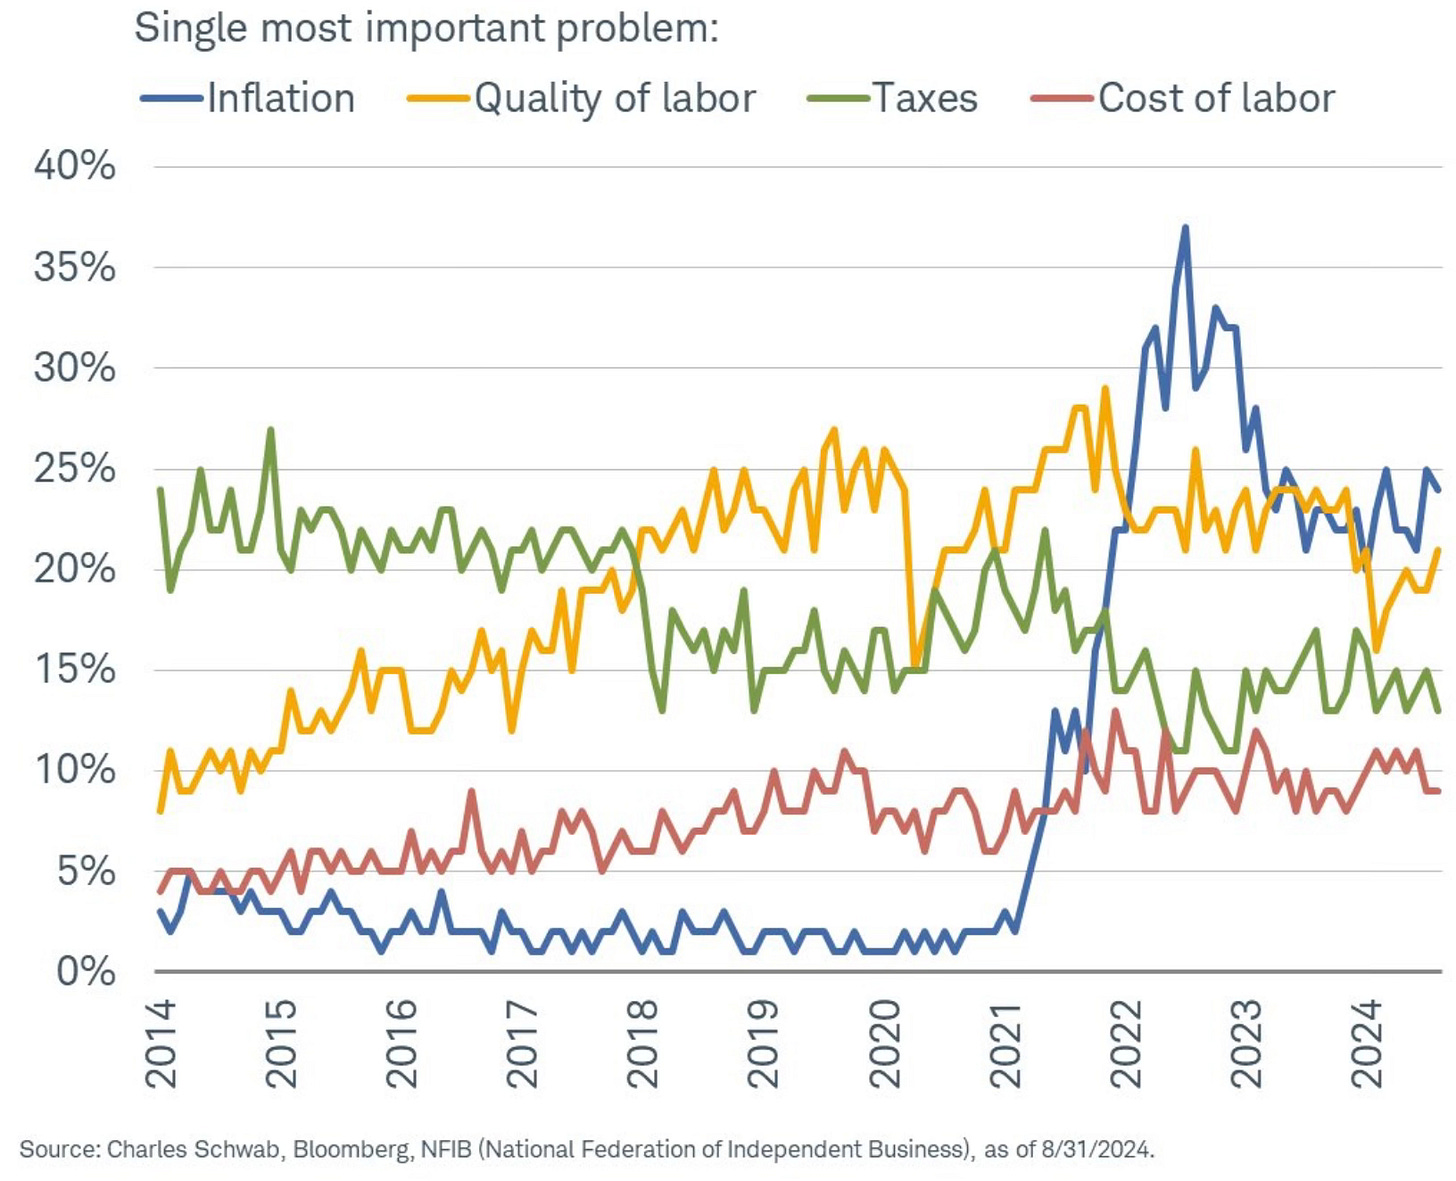
Inflation is still the biggest concern for small businesses. The quality of labor has really started to tick up of late. This bears watching.
One area that still concerns me a bit and that ties directly into the Small Business Survey results is what the Restaurant Performance Index continues to show. Consumers continue to pullback on dining out. I mean this is trending towards reaching the pandemic lows, where many restaurants were closed.


