Investing Update: 2 Stocks For The 2nd Half
What I'm buying, selling & watching
Another week and another record high for the S&P 500. Friday closed out the week with the 31st record high for 2024. 8 of the past 9 weeks have been positive.
The stock market is now in the longest stretch (377 days) without a 2% sell-off since the GFC. There still has not been a drop of 1% or more on the S&P 500 in May or June.
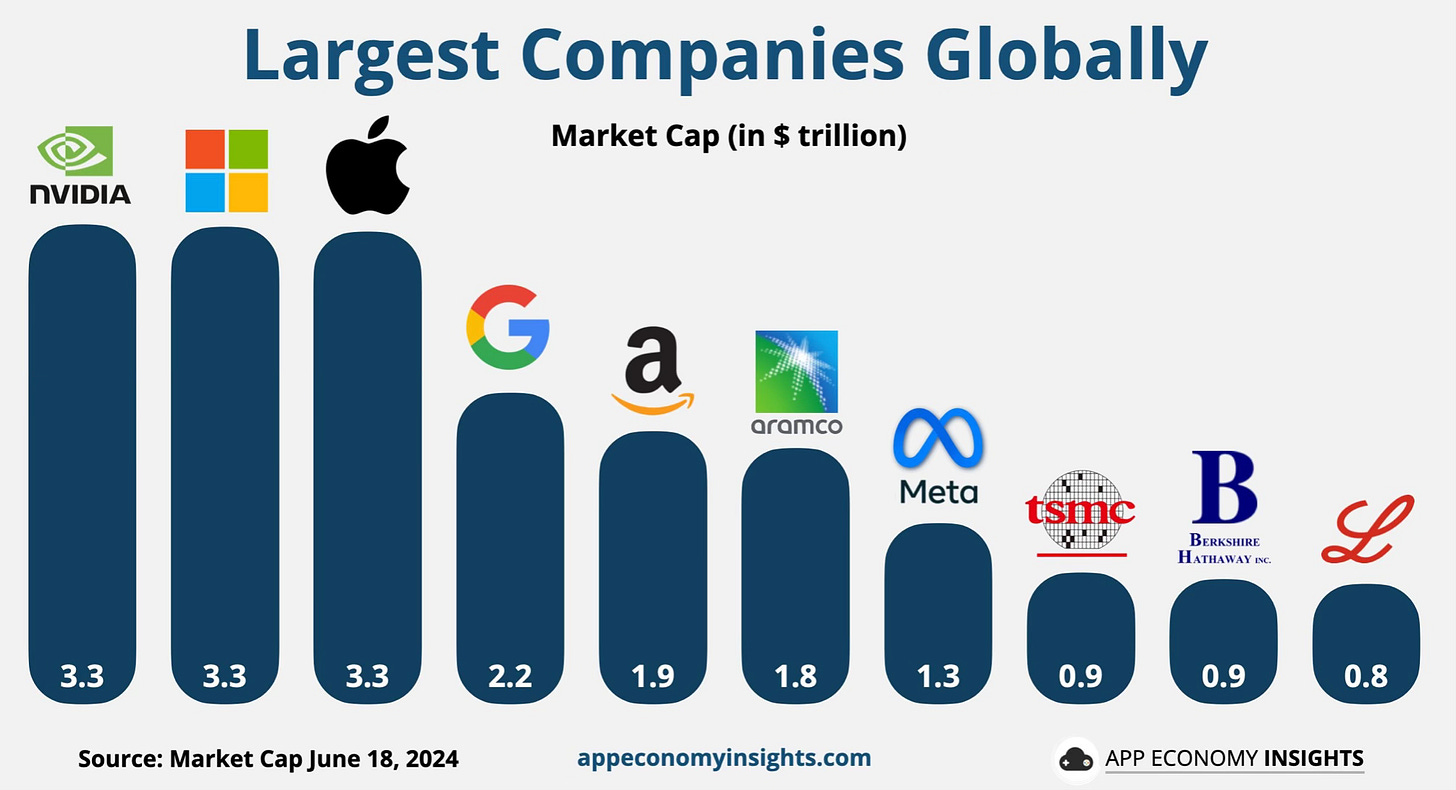
This week also saw Nvidia take over the top spot as the largest company in the S&P 500. It’s the 12th company to ever be in the top spot.
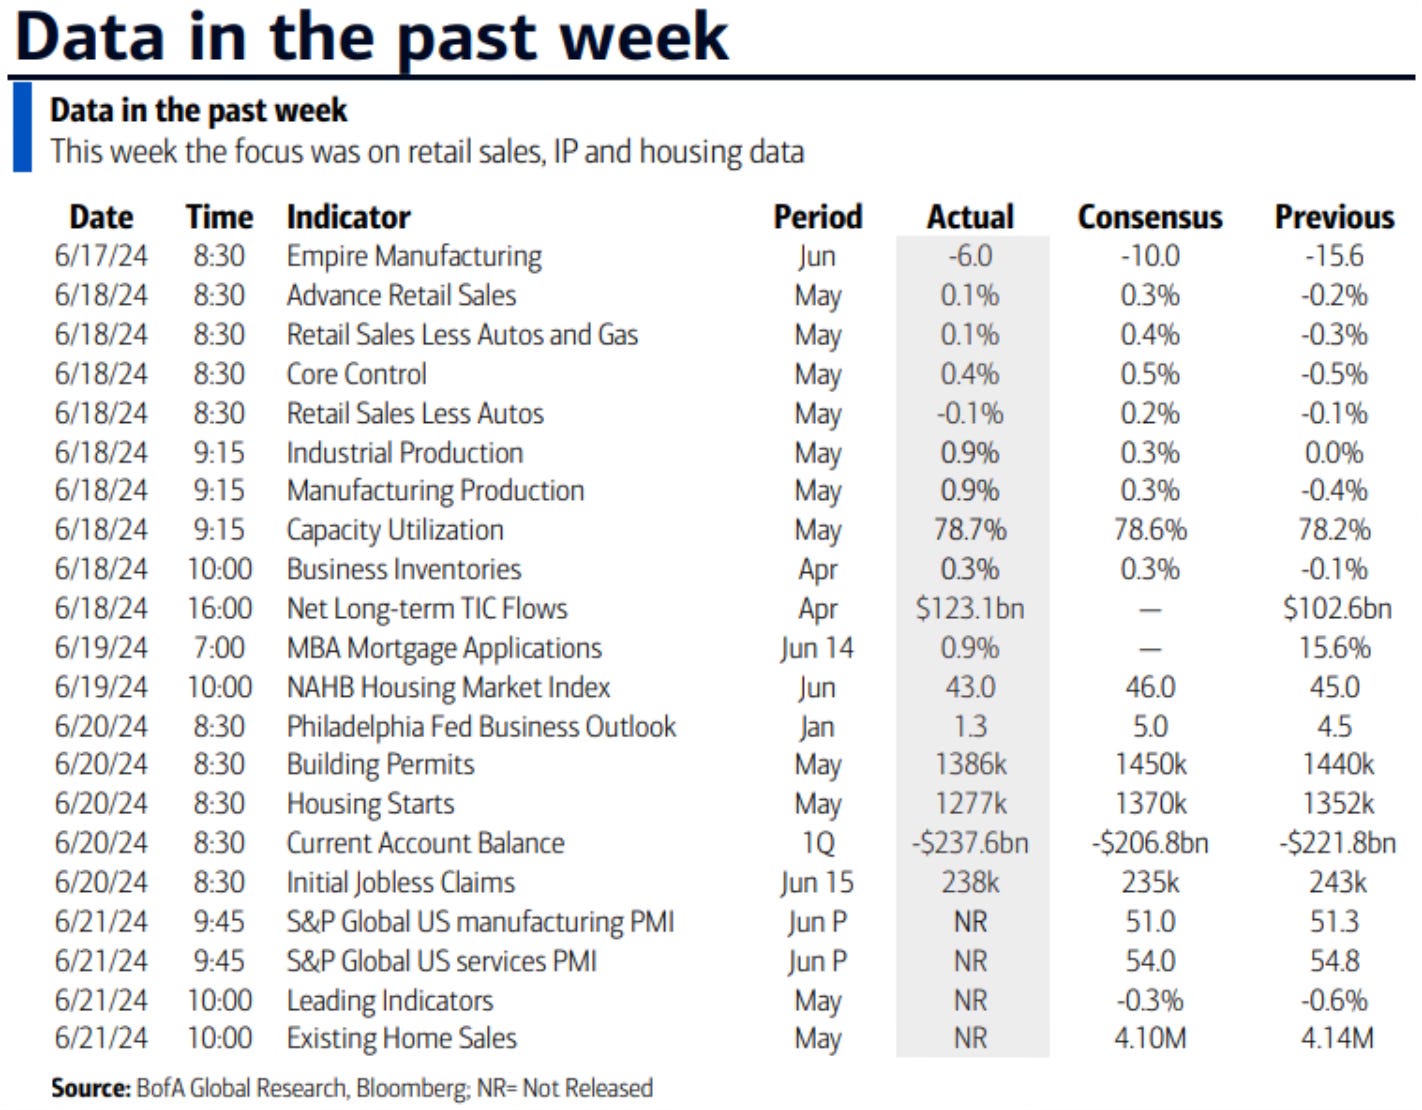
Market Recap
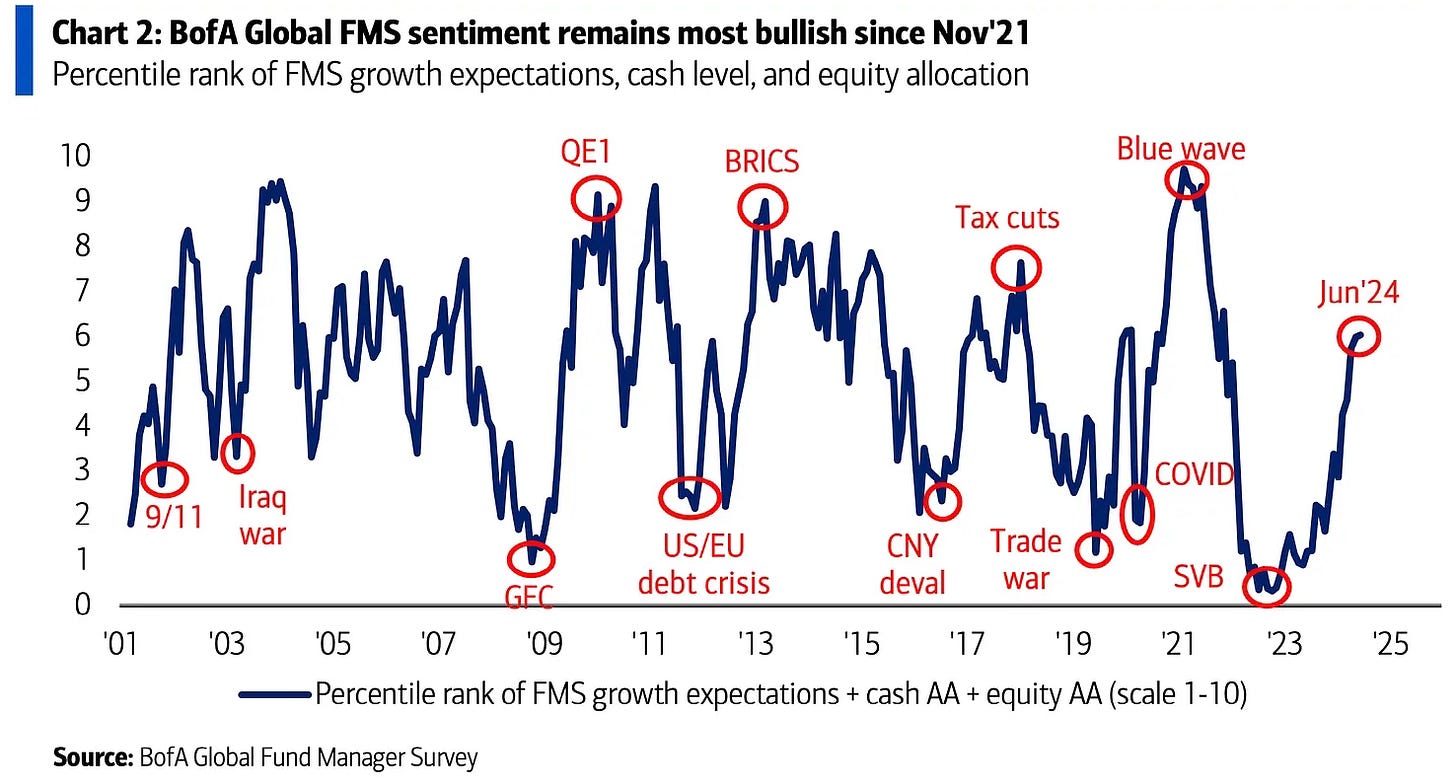
The June Fund Manager Survey shows sentiment at the most bullish level since November 2021. It’s hard not be bullish after continuous new all-time highs.
This comes as the calendar is about to flip to July, which is historically one of the best months of the year. Just how good? Let Ryan Detrick tell you.
July has been up nine years in a row for the S&P 500. Over the past decade? Higher 90% of the time (tied with November for the best) and up 3.1% on avg (second only to Nov).
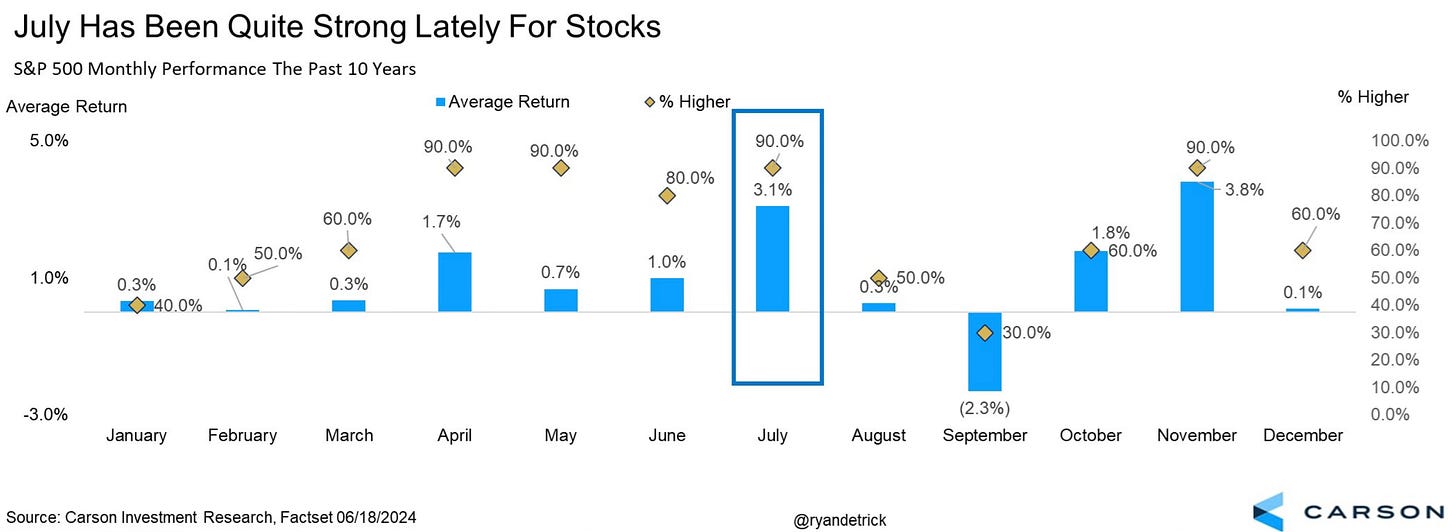
I would say that’s quite bullish as we move into July. But there may be some internals that are signaling otherwise.
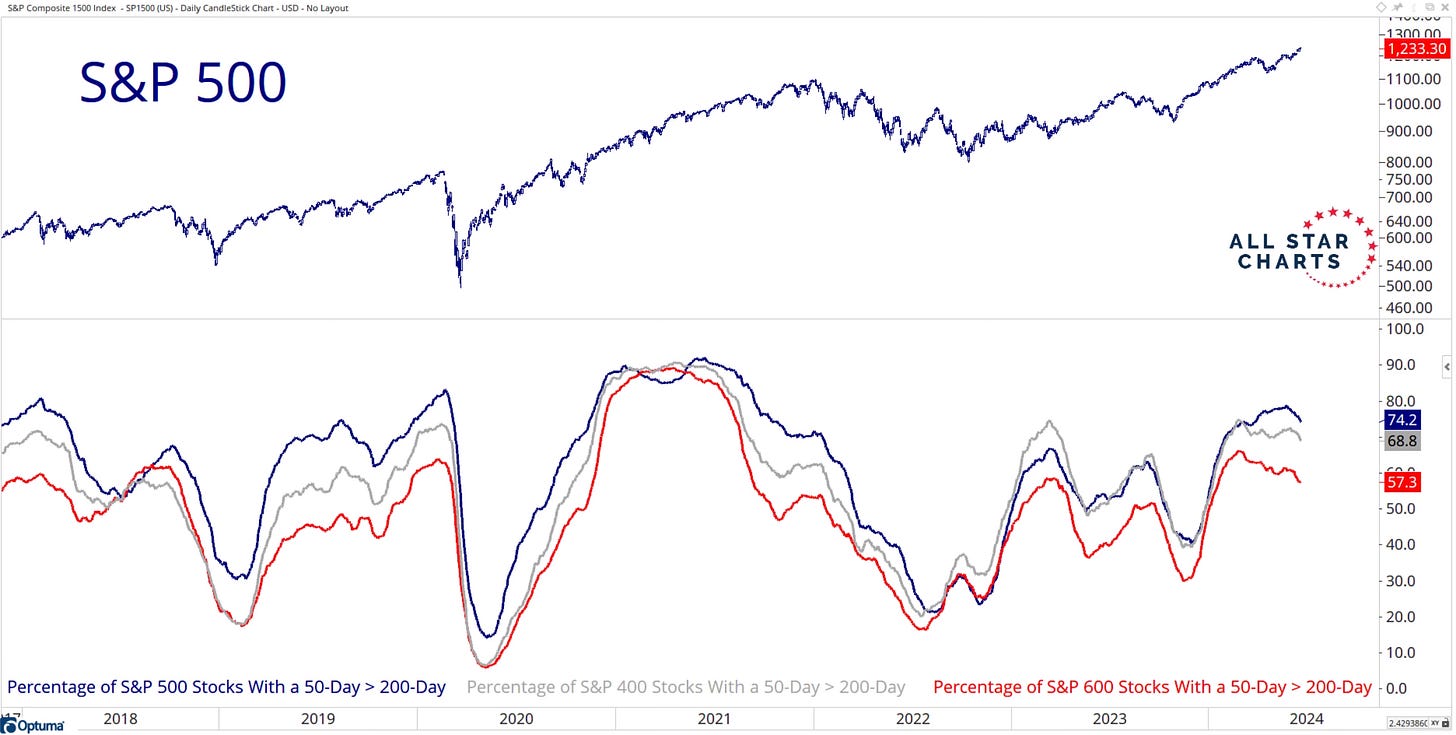
Grant Hawkridge points out that the internals are getting weaker.
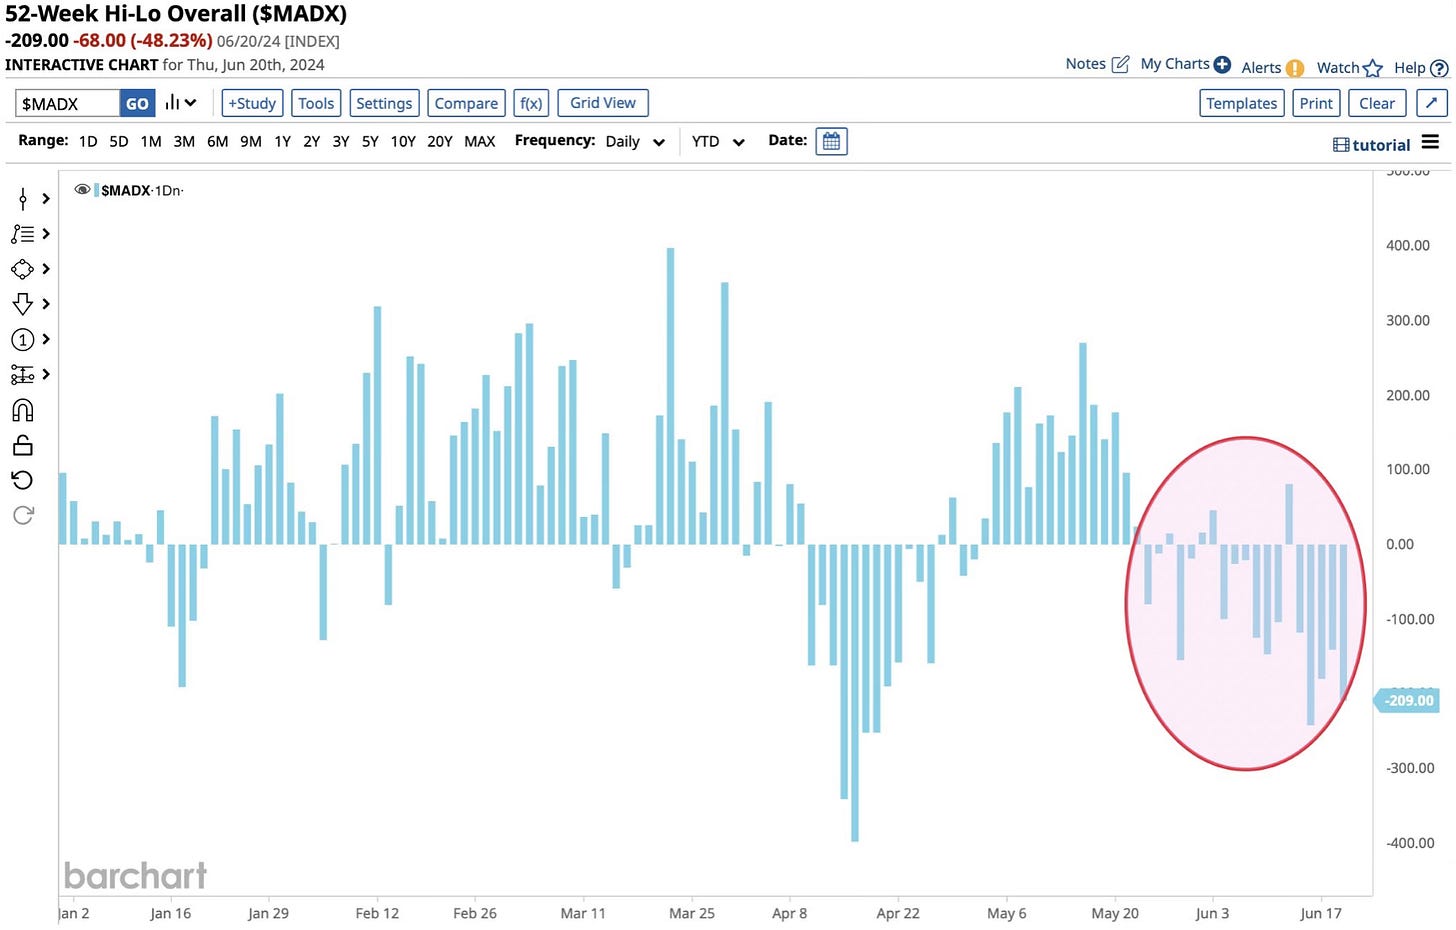
We’re also seeing the number of 52-week lows really start to outnumber the number of 52-week highs.
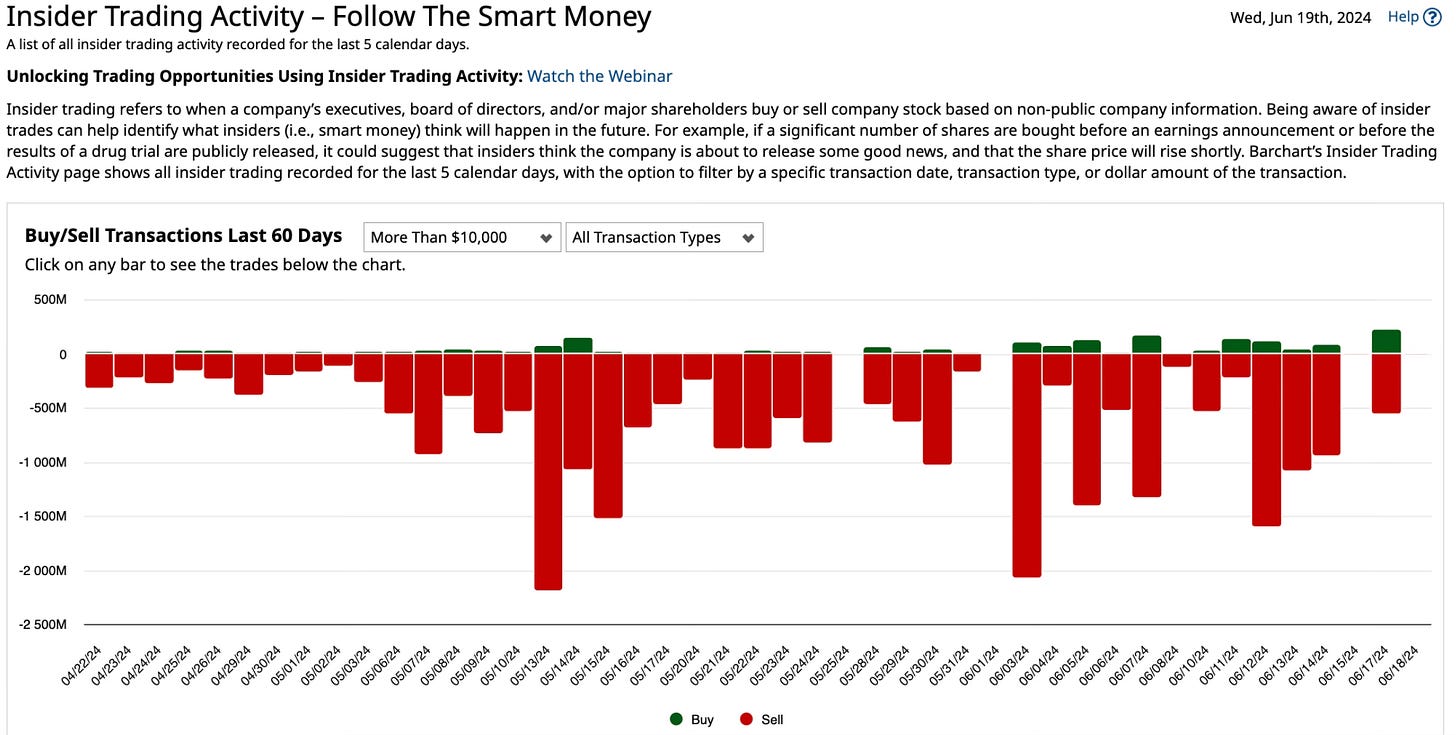
I keep going back go this chart. Does this means anything? Or how much importance do we put into this chart? It’s interesting to me.
If we look back there has been heavy insider selling activity going back to early May. Even as far back as April the selling has far outnumbered the buying. But all this while the market has continued to set new all-time highs. From the start of this chart until today, the S&P 500 is up almost 8%.
The July setup is proving to be quite interesting. You have a white hot stock market continuing to set new record highs, heading into one of the historically best months of the year. Yet the internals are starting to show weakness.
Regional Bank Worries Returning?
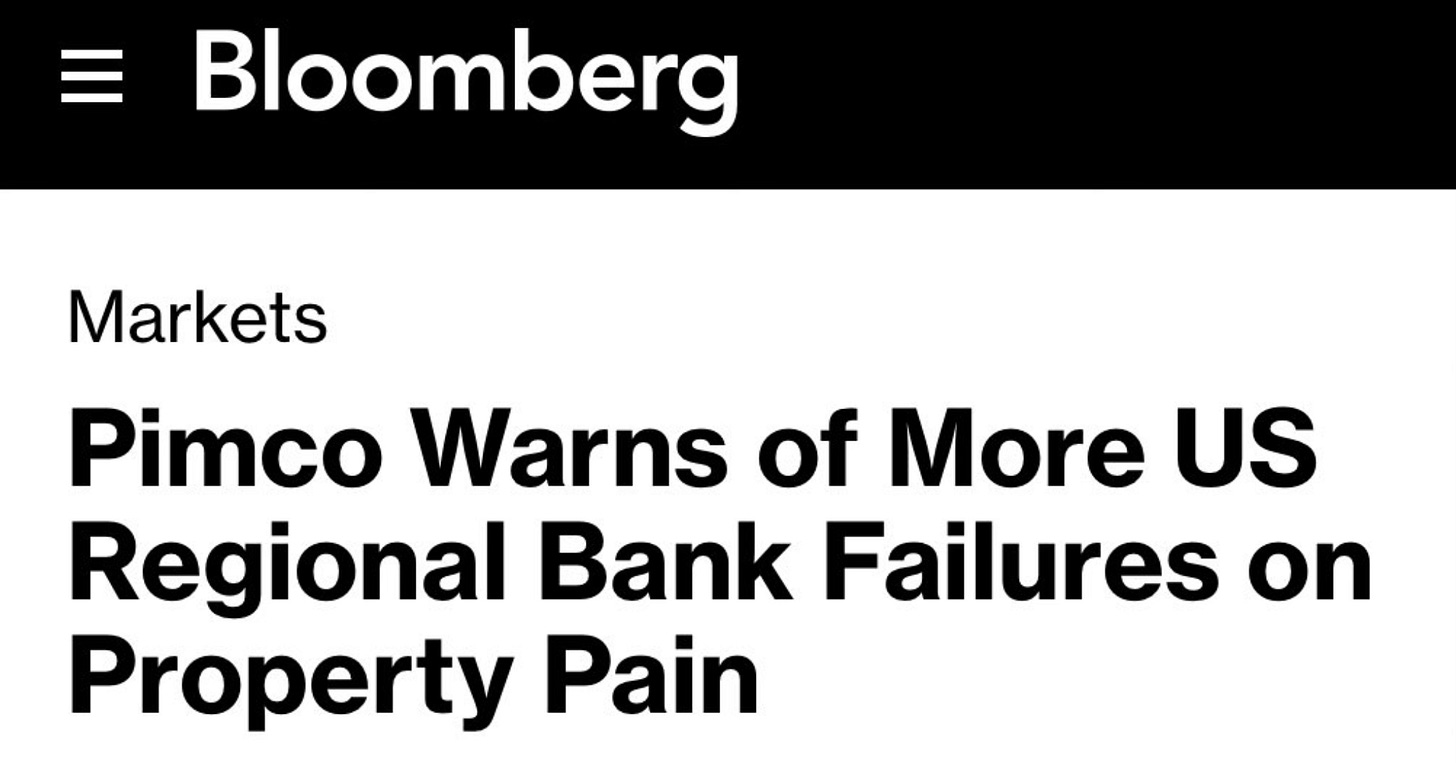
We’re starting to hear about the regional bank worries once again. Bloomberg had an article that stoked the fire and this headline has been making the rounds.
Pimco Warns of More Regional Bank Failures on Property Pain the line that stuck out from Pimco was the following.
“The real wave of distress is just starting.”
Something of note is that the KRE (SPDR S&P Regional Banking ETF) is now underperforming the S&P 500 by the largest margin in history. The previous low was March 2023 which was the SVB collapse.
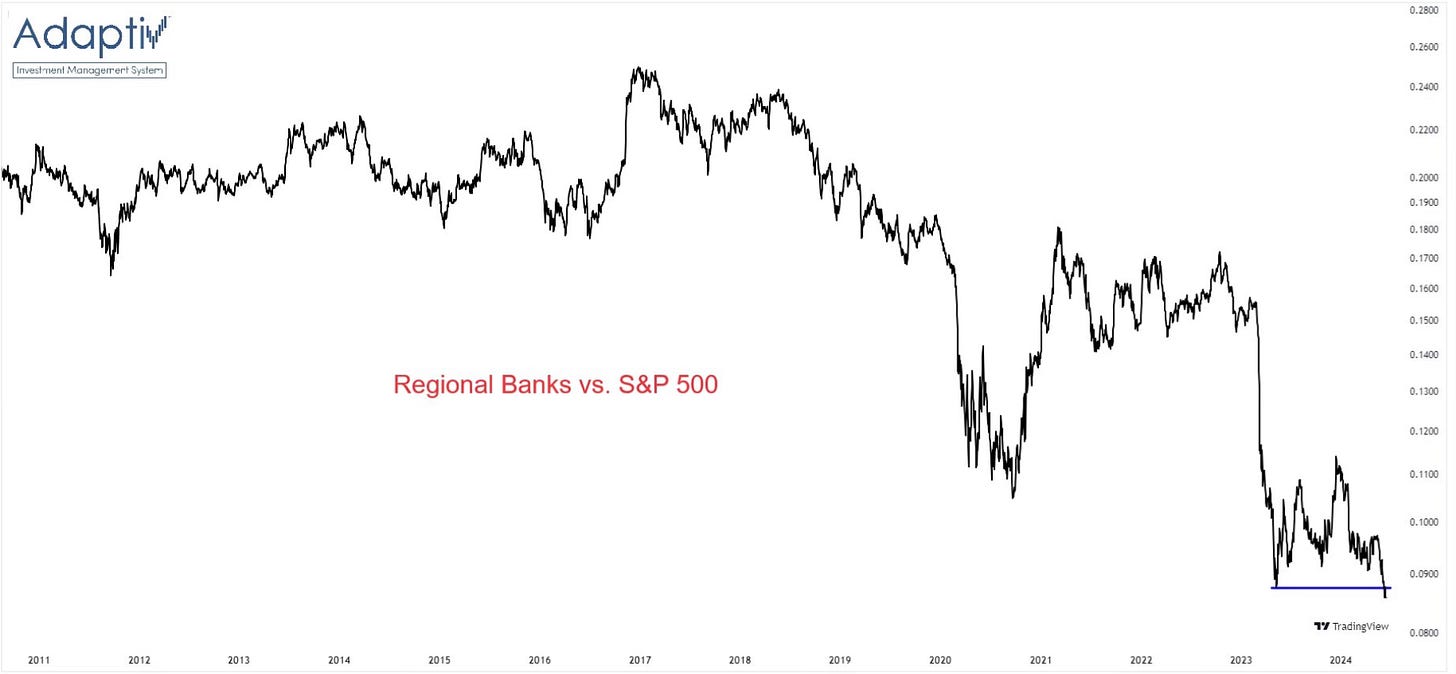
Maybe the fact remains that there are just still too darn many banks. But regardless this has the regional bank worries back at the forefront and where there is smoke there is usually fire.
The Tech Sector Takeoff
The technology sector has been the runaway sector leader this year. Everyone knows that. What stands out though, is how much of a gap has widened between tech and all the other sectors in the last month. It’s been tech and then all the rest.
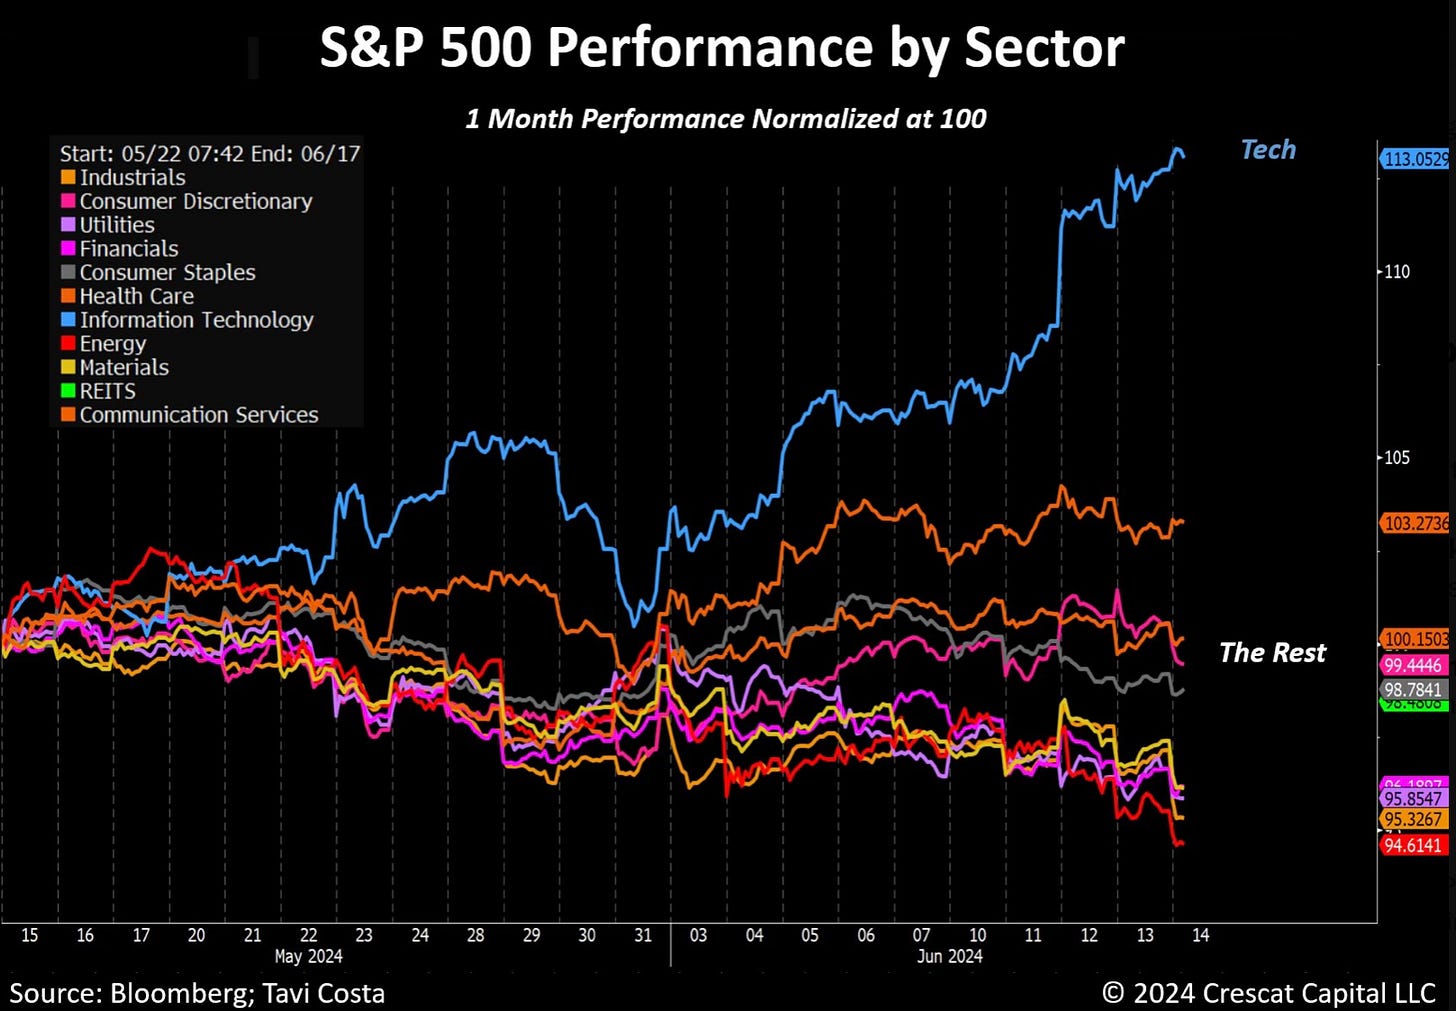
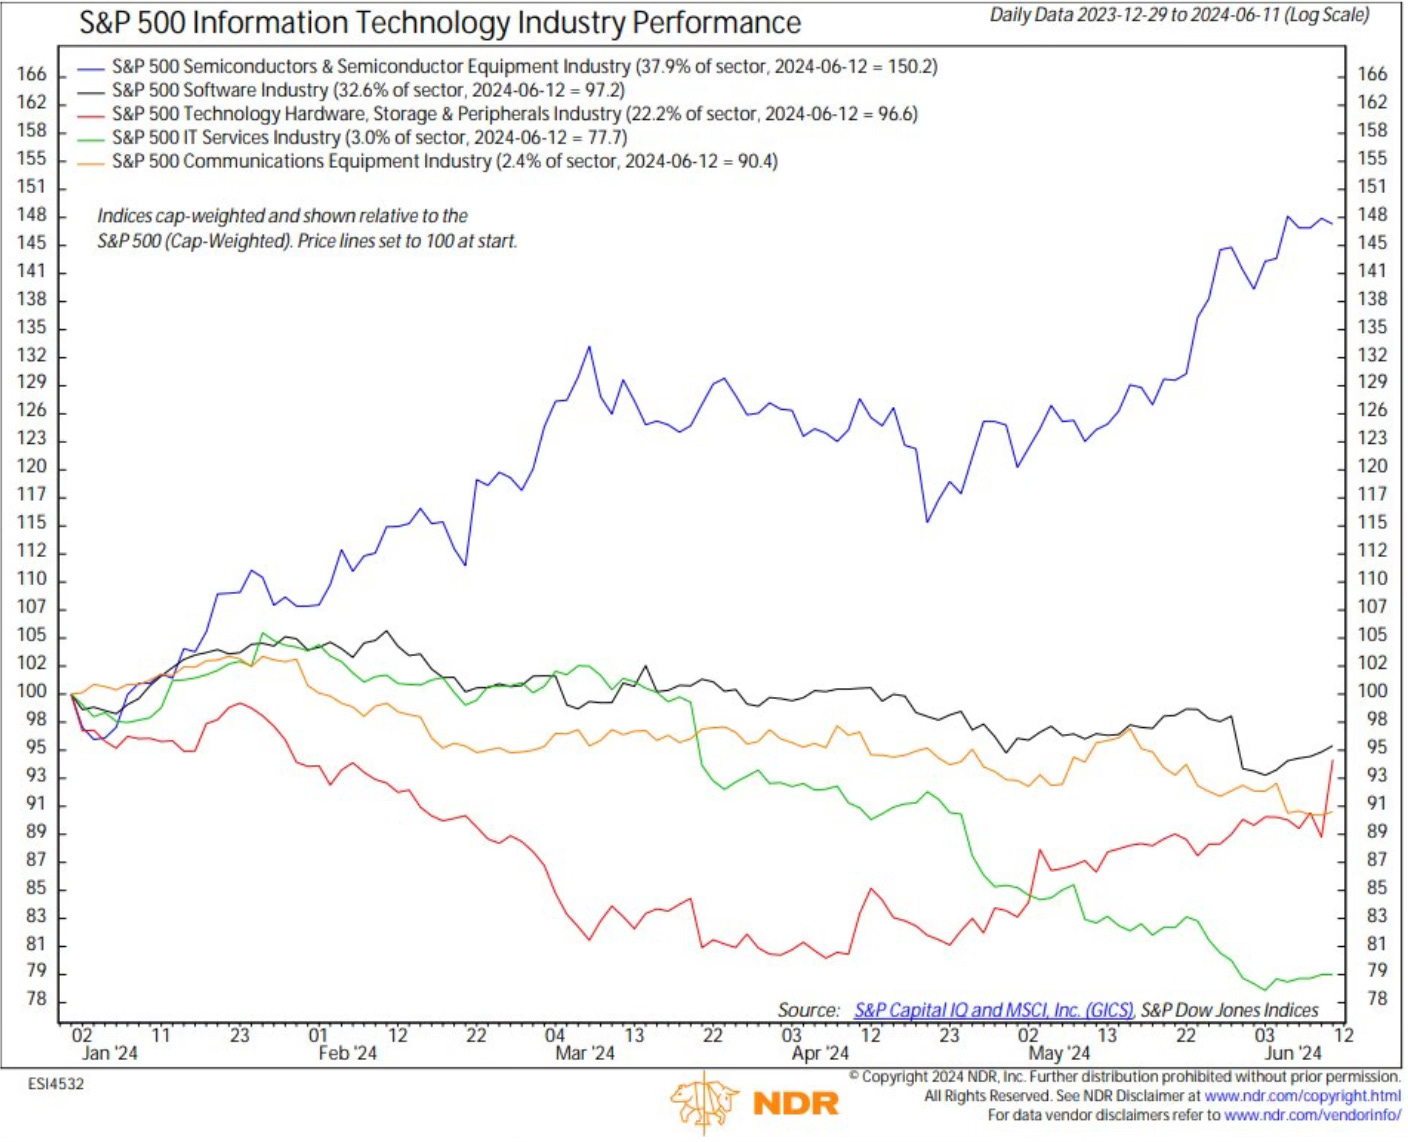
If you peek inside the sector, you can see just how much of a performance gap semiconductors have had over the areas. It’s semis by mile.
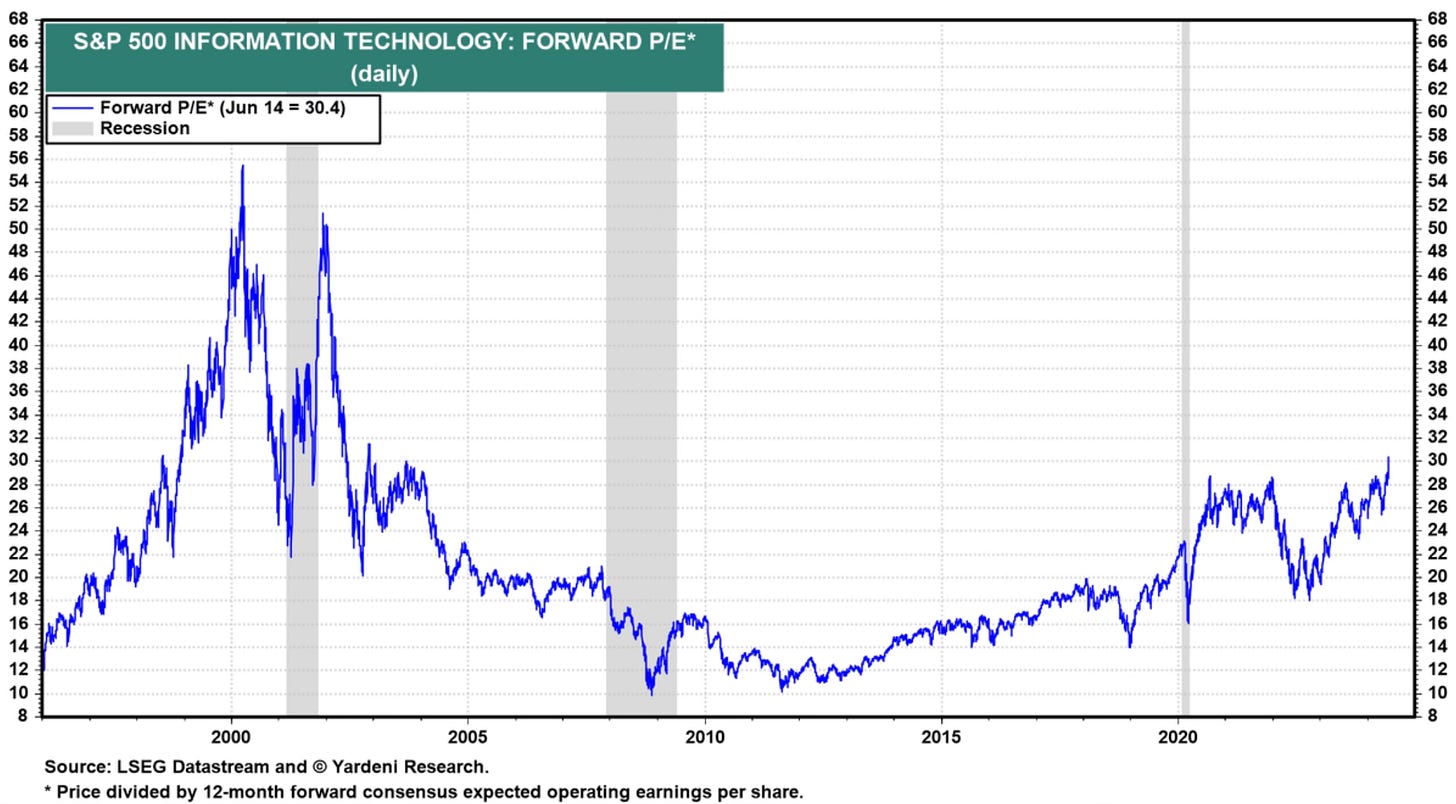
I know you’re thinking it. It’s the Dotcom bubble again, or here comes Tech Wreck 2.0. I touched on this briefly two weeks ago, Investing Update: No This Isn’t A Bubble. With the talk continuing to get louder about this, I may have to do a deeper dive post into the data on this.
We’re simply still not even remotely close to those levels. Sticking just to what we’re discussing here which is the technology sector.
If we look from a forward P/E standpoint. Right now the tech sector is trading at a 30.4 times forward earnings. On March 27, 2000 that number was at 55.5, before it burst.
Individual Stocks Research & Data
Throughout all the numbers, data, charts and research that I dig into, a lot of it entails work on individual stocks. Near the ends of every quarter I go a little deeper in my stock research. I wanted to share some of the more notable information that I’ve found recently on individual stocks. You my find it interesting and helpful.
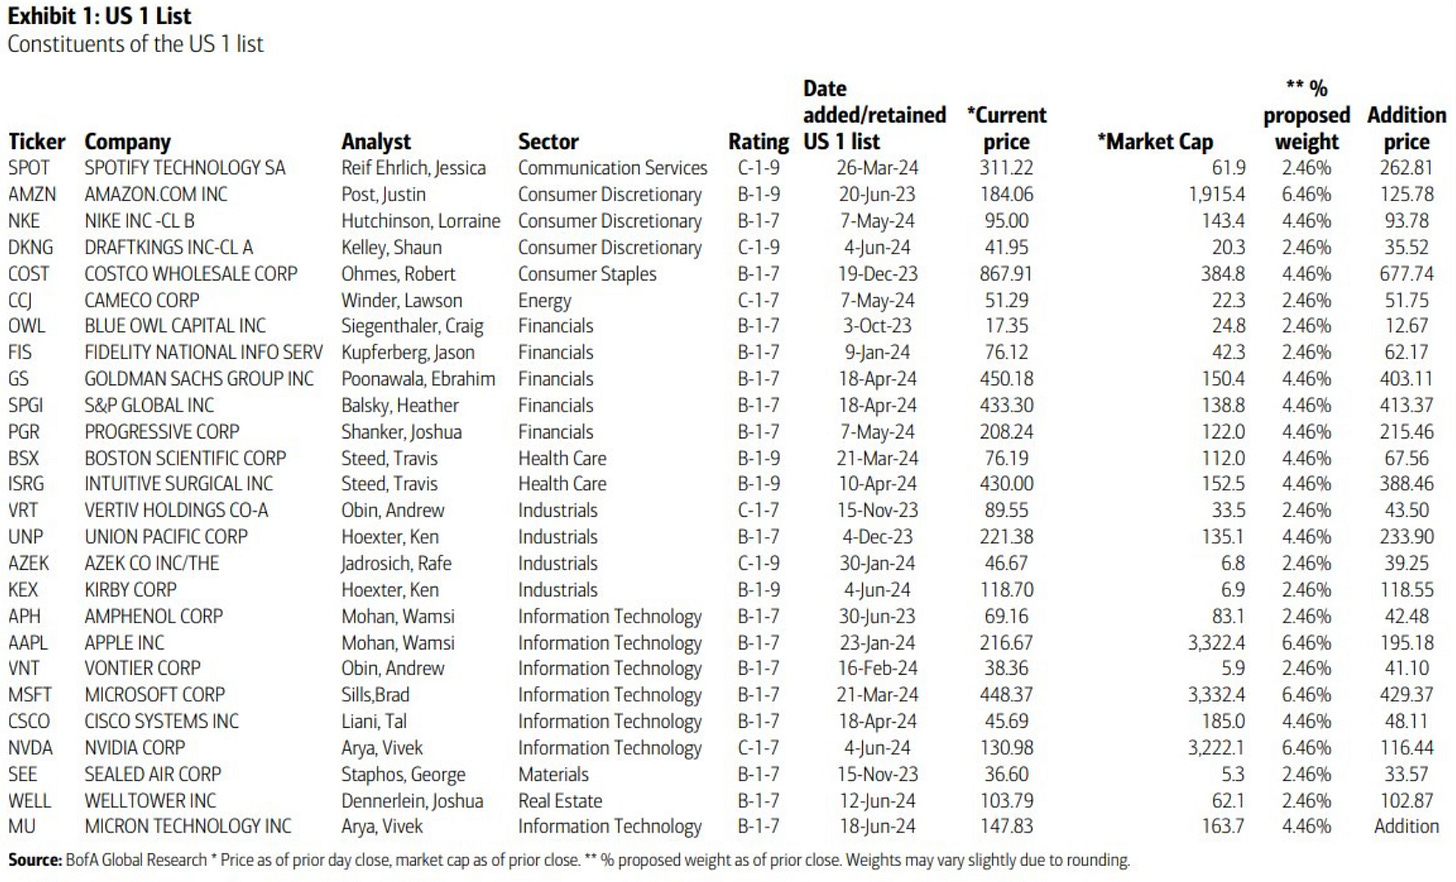
This is the US 1 List from BofA. This is a list of their best investment ideas taken from their list of buy-rated stocks.
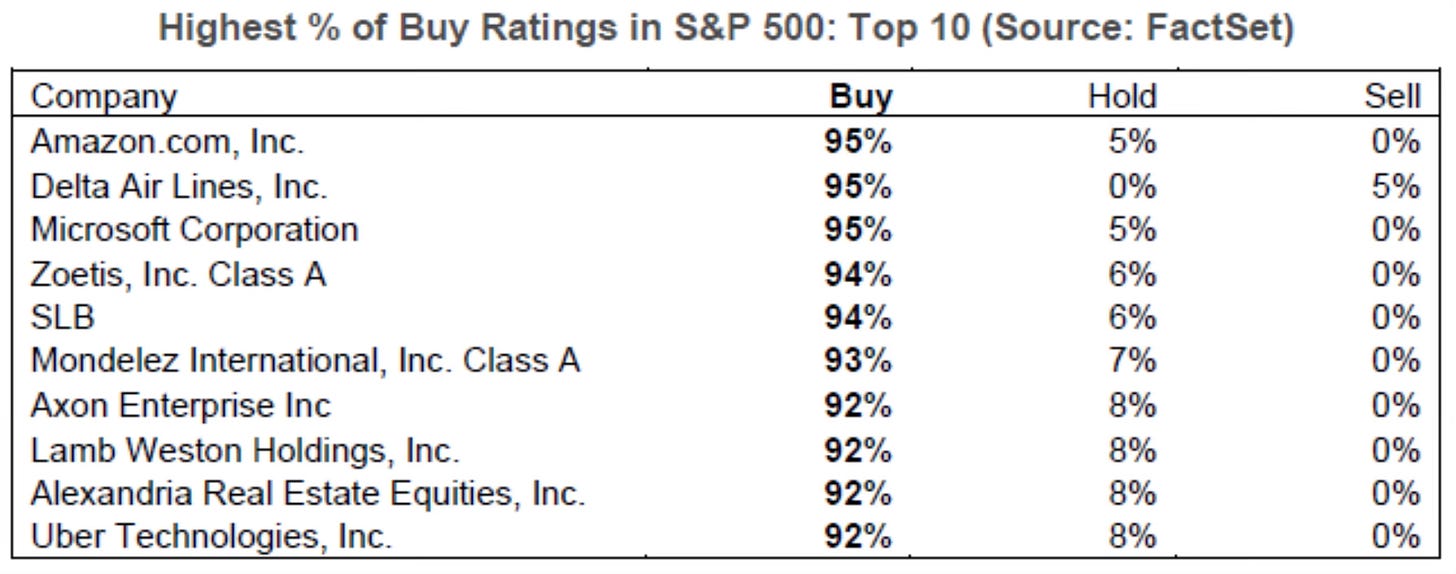
FactSet has a list of the highest percentage of buy rating stocks in the S&P 500.
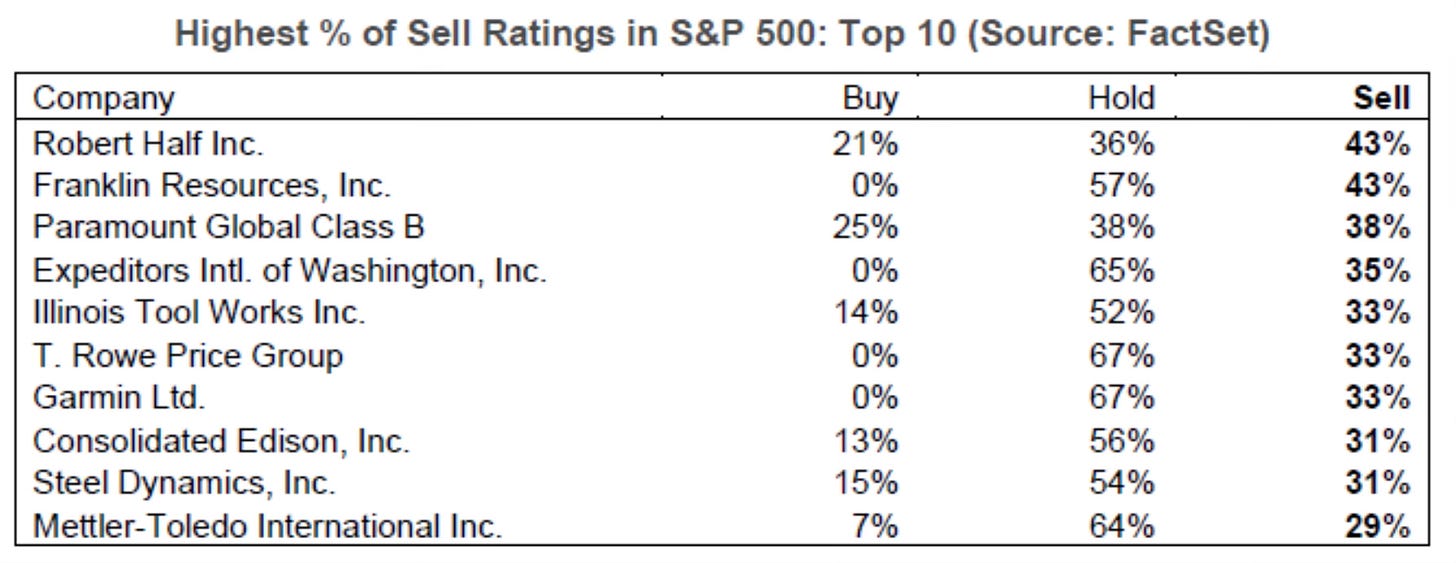
They also have a list of the highest percentage of sell rating stocks in the S&P 500.
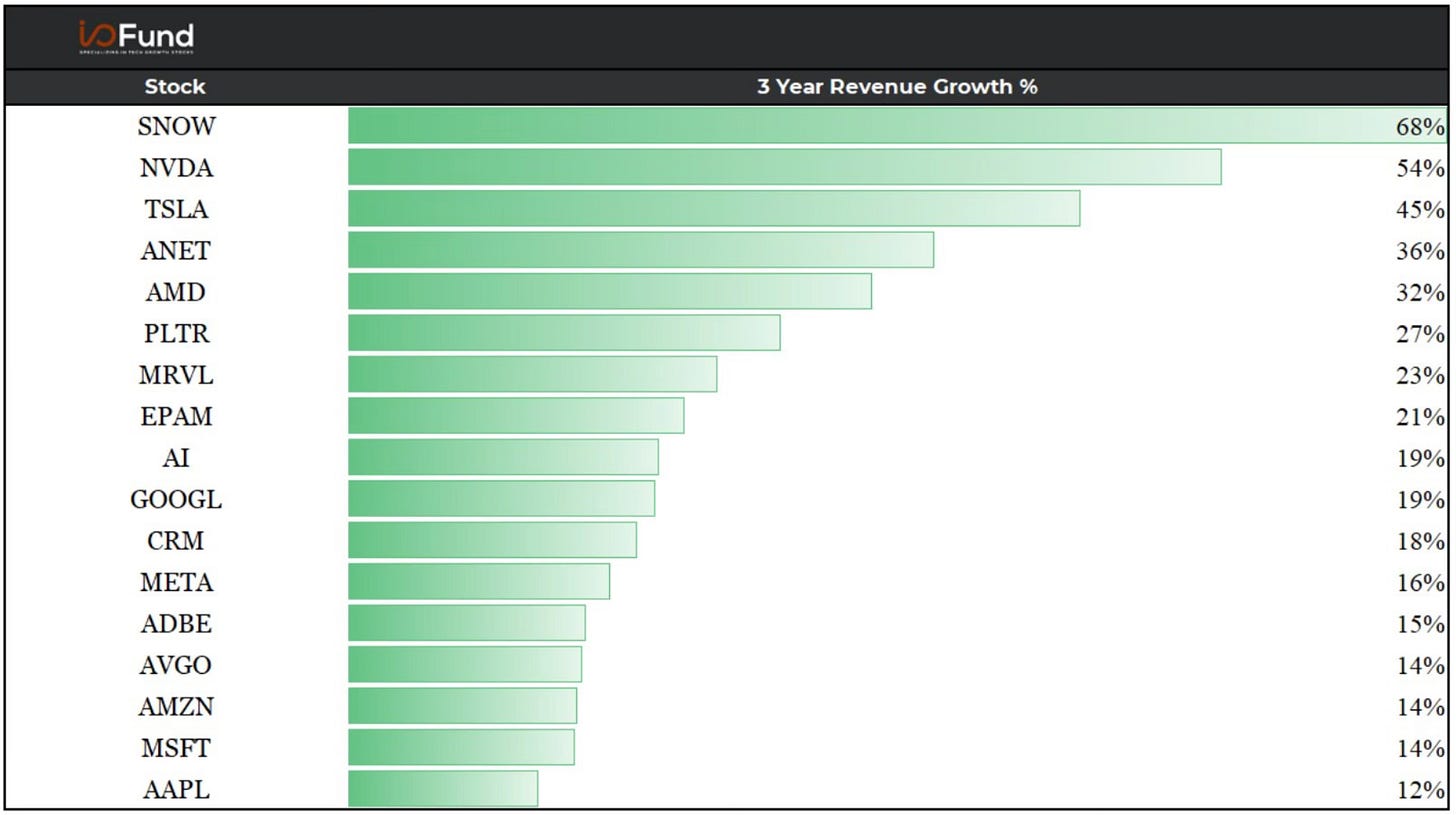
Good chart here from Beth Kindig that shows the AI related stocks that had the highest 3-year revenue growth.
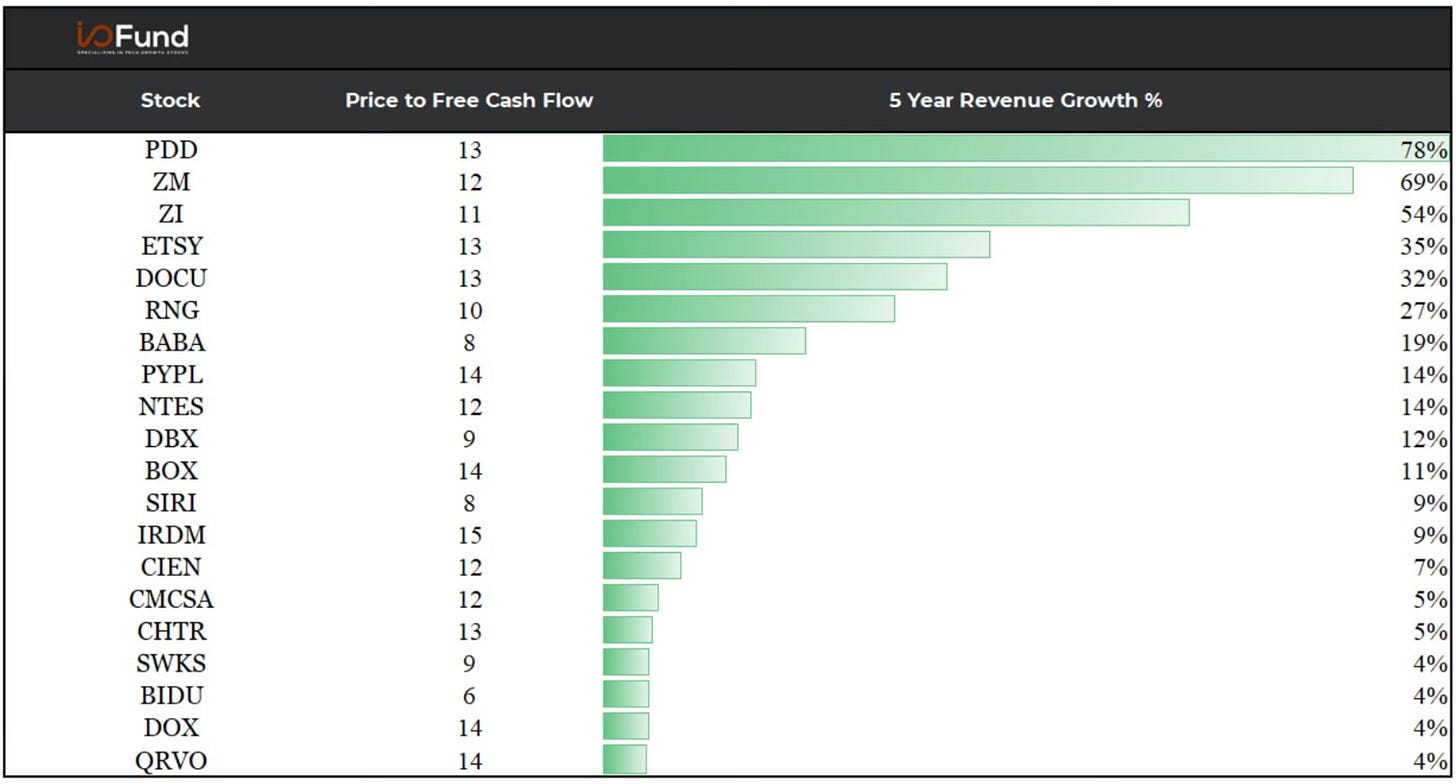
This shows tech stocks that have the highest 5-year revenue growth with a price to free cash flow under 15.
All Star Charts showed an update to their Hall Of Famers list.

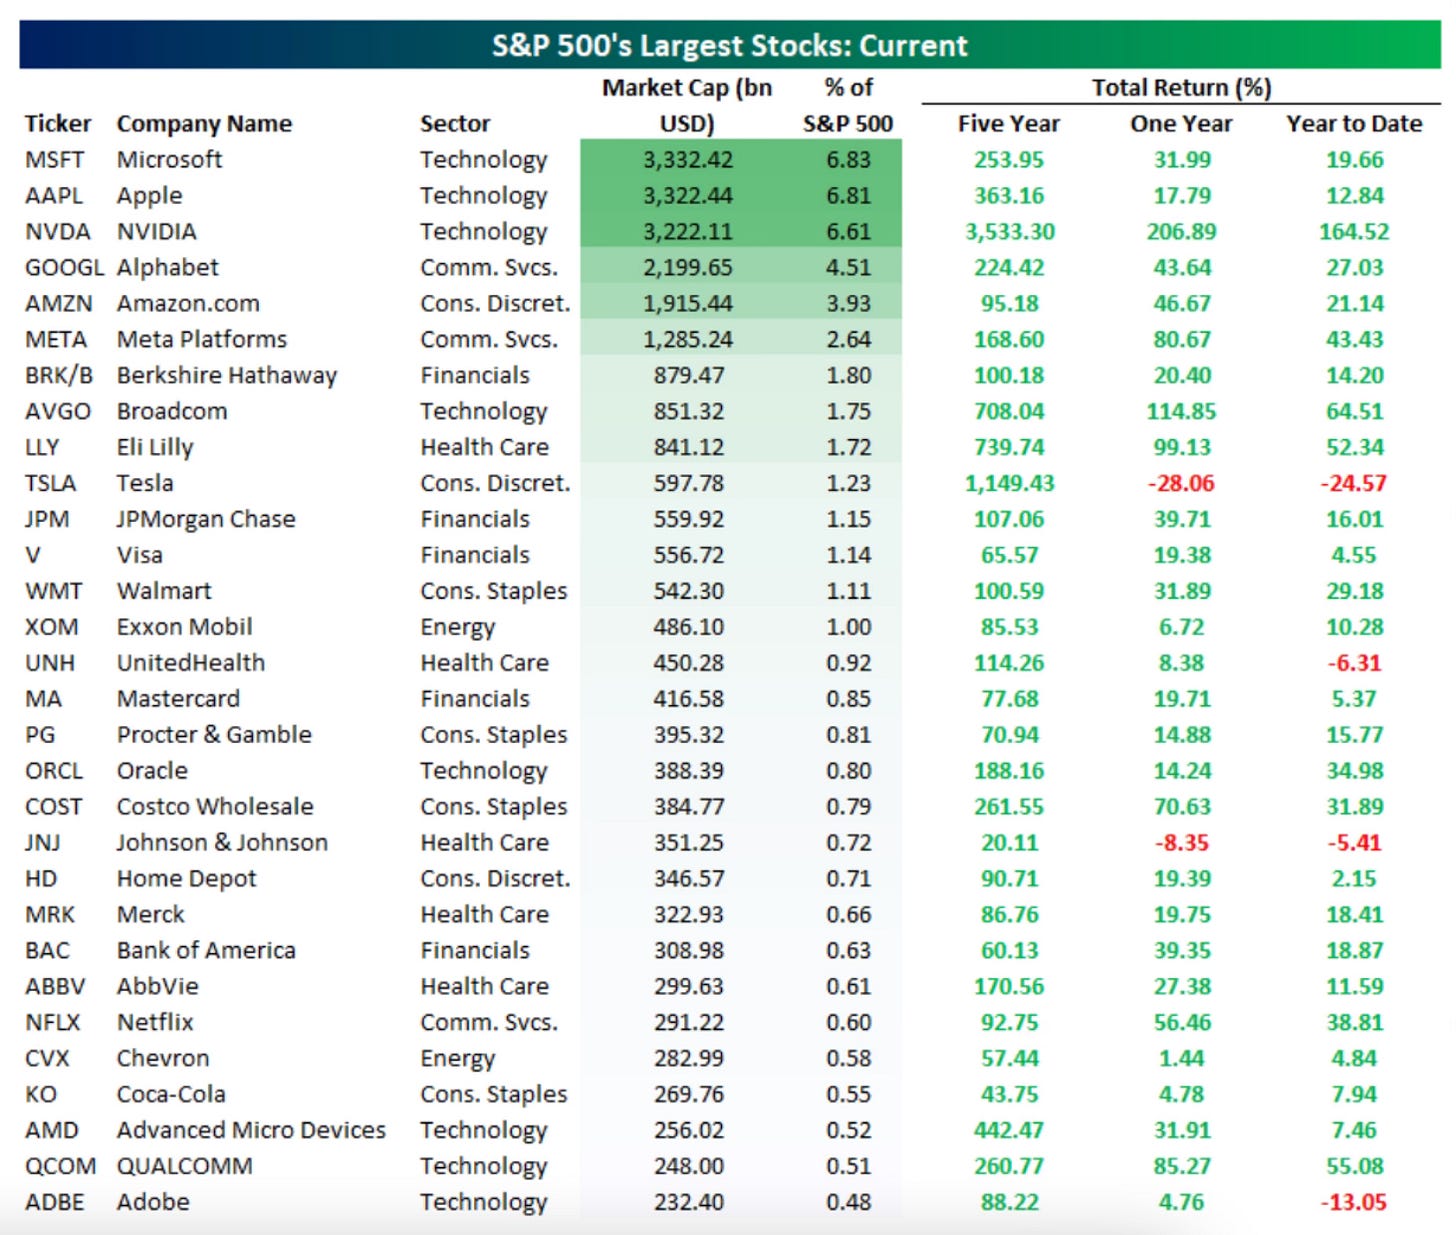
This chart from Bespoke I found very interesting of the 30 largest S&P 500 stocks.
2 Stocks For The 2nd Half
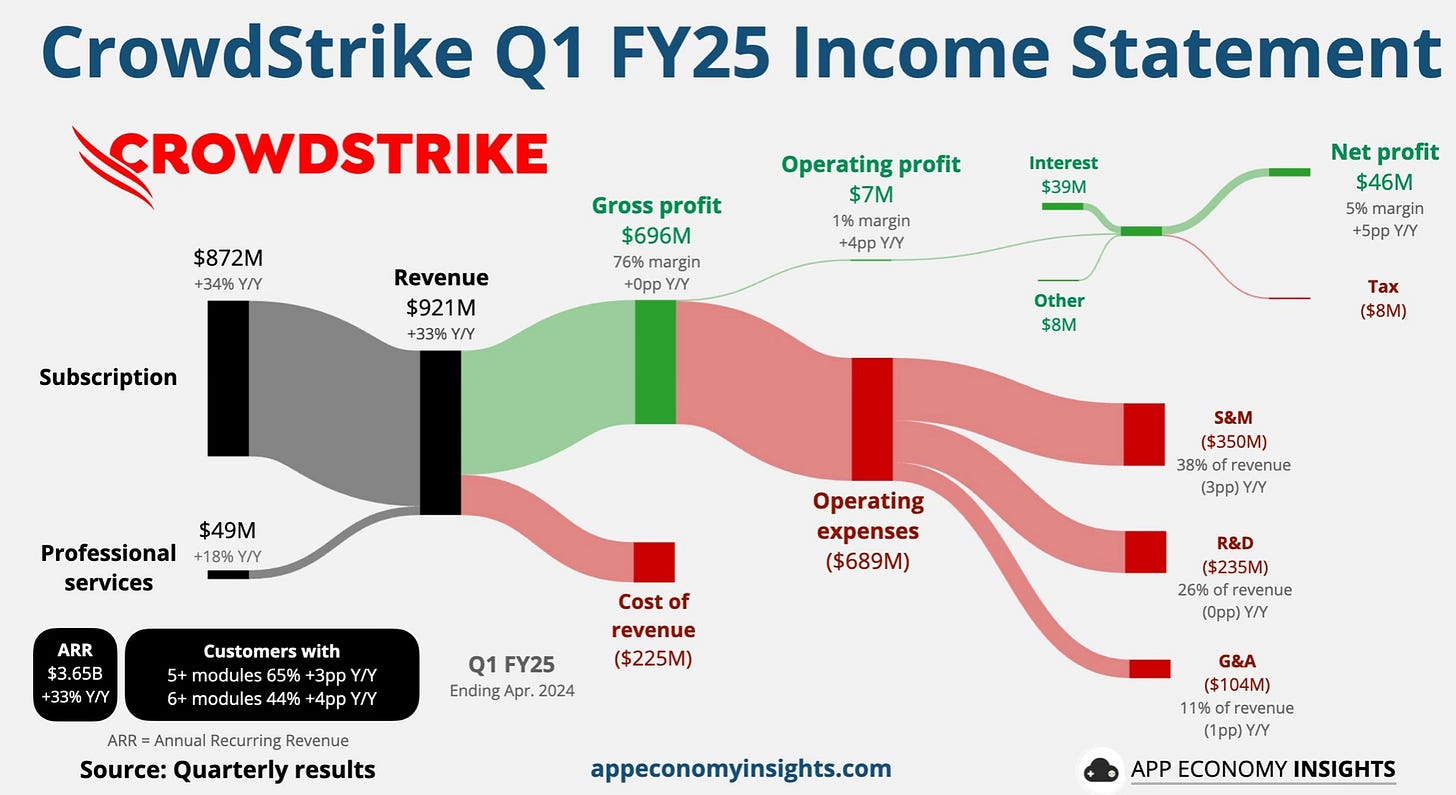
CrowdStrike One of my 3 stock picks for 2024 (Investing Update: 3 Stocks For 2024) was Crowdstrike. YTD it’s up over 54% and it remains one of my favorite stocks as we head into the second half of the year. Cybersecurity is so critical to every company.
If you talk to any CTO (Chief Technology Officer), there are two things they are most worried about. Are they spending enough and keeping up with the AI revolution and defending cyberattacks and the fear of being hacked. These are the two areas where the majority of company spend is going towards. You have to follow the money.
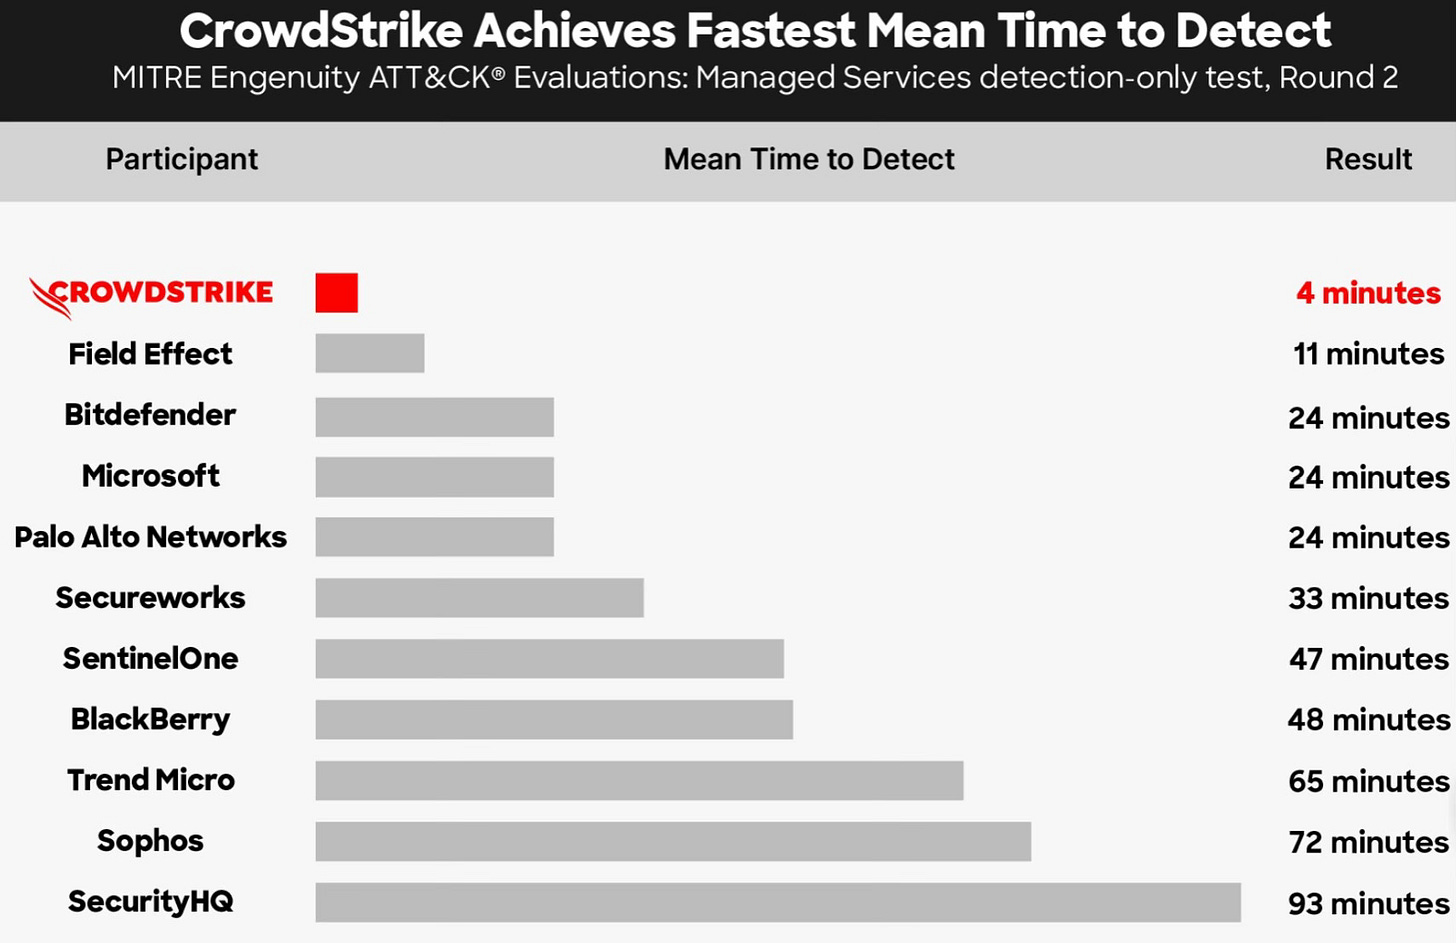
This chart came out this week and I found it to be quite informative on why CrowdStrike remains a leader in the cybersecurity space.
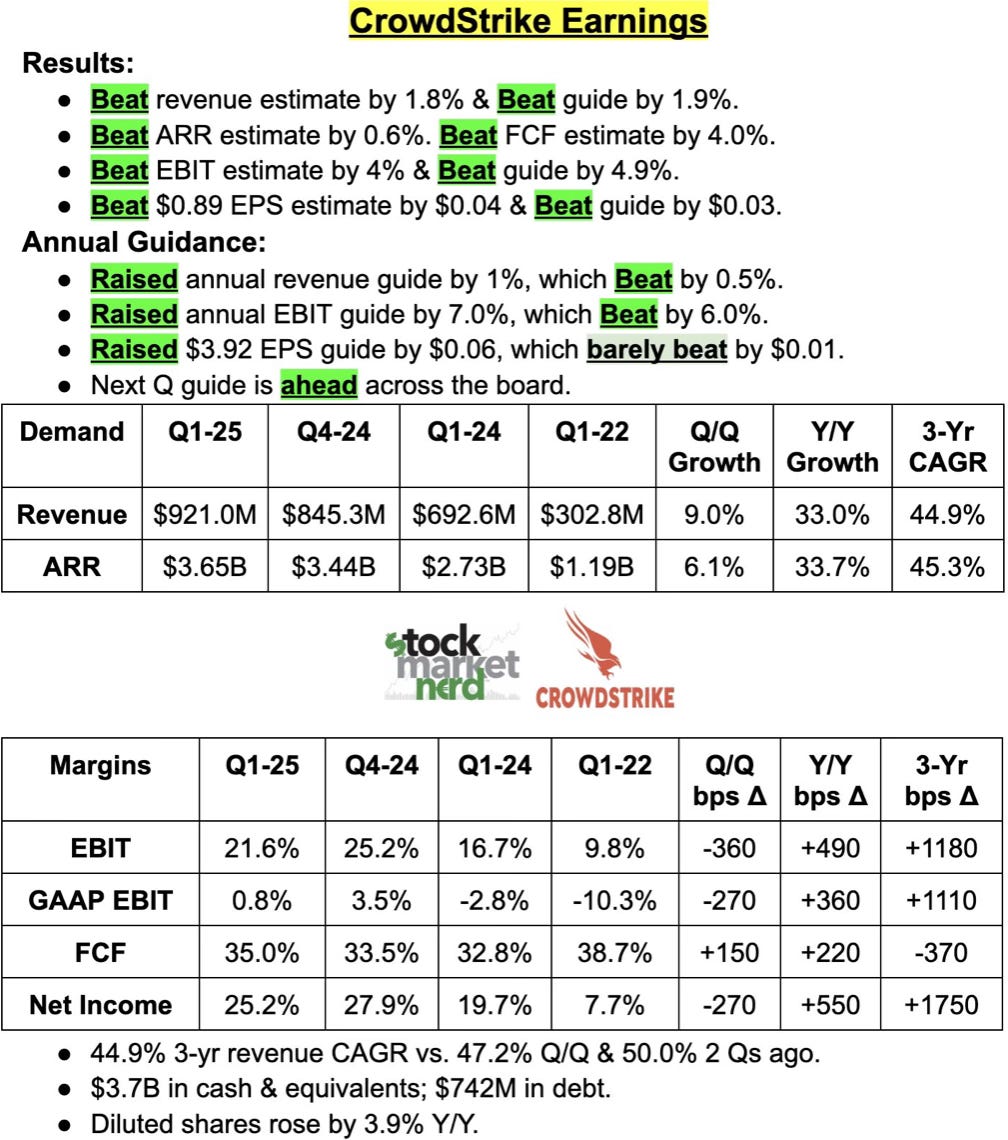
This is from their last earnings June 4th, which beat and the stock has been up 24.5% since. On Monday June 24th it will officially join the S&P 500.
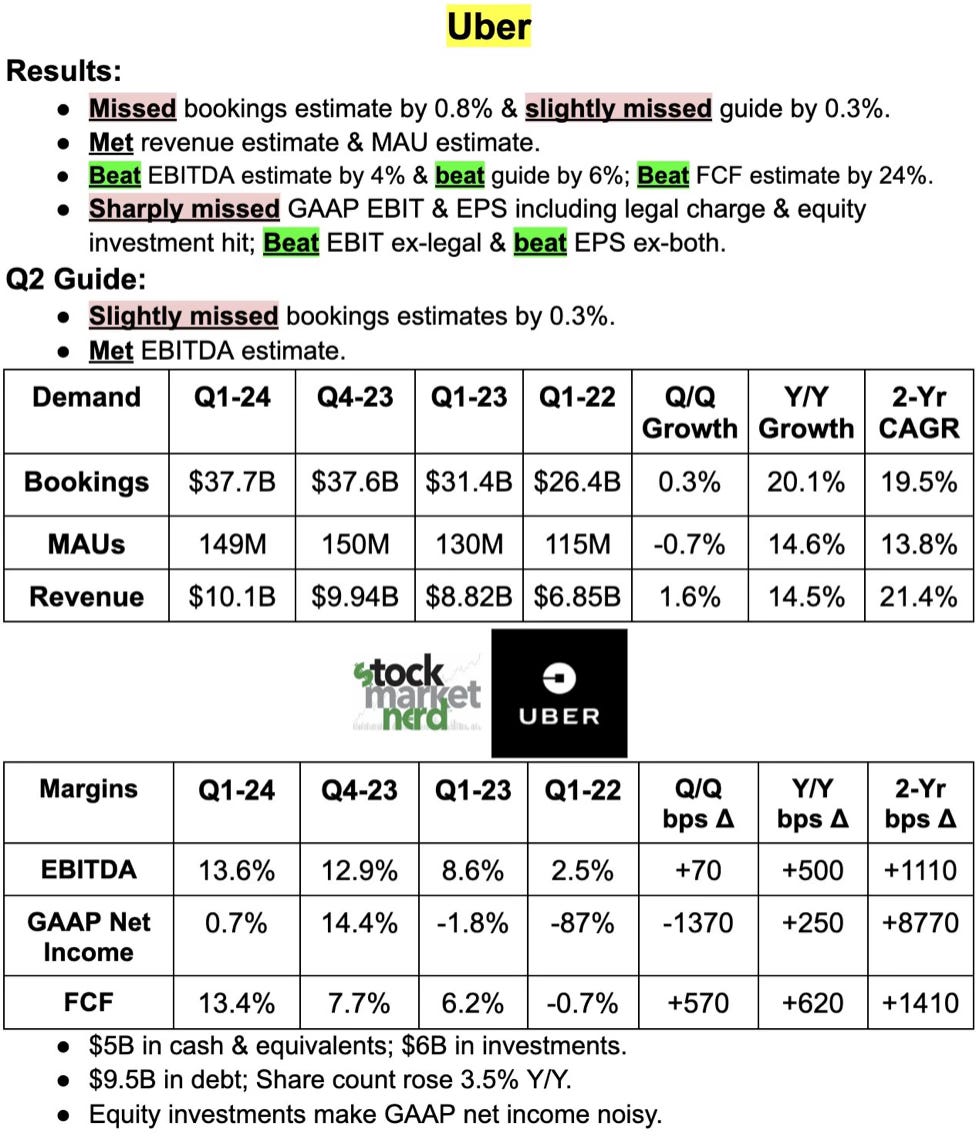
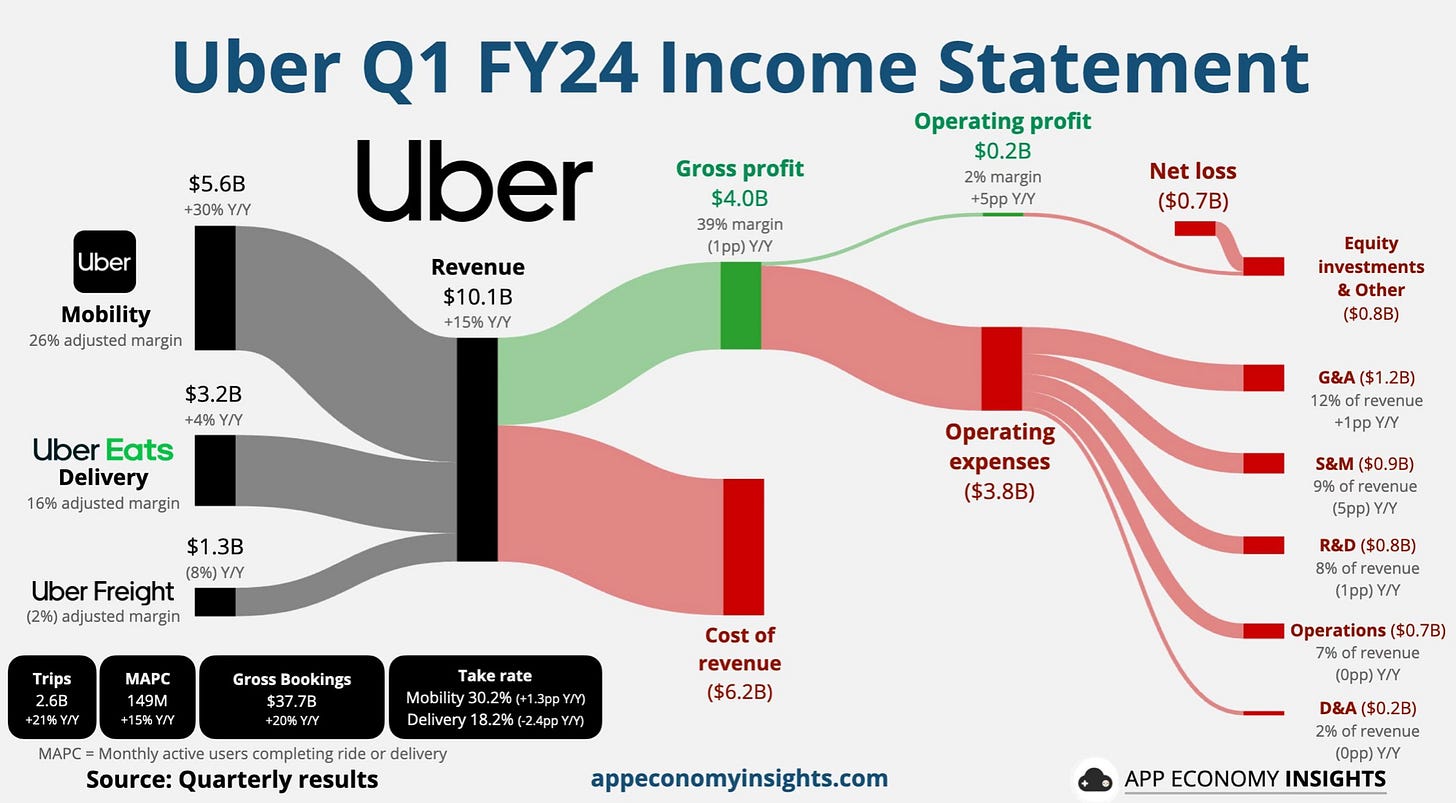
Uber Another of my long time favorite growth stocks is Uber. The last earnings report in May was mixed for Uber. It missed on some spots and did see a selloff. It has regained some of its losses. It held the $62 level that I was watching and has bounced. I expect a great earnings report in August. This future market leader with an excellent management team has room to run in the second half.
Here is the breakdown of the mixed May quarter by Brad Freeman who does great work with earnings breakdowns.
Moves I’ve Made
I’ve actually added to both of my positions in the two stocks I discuss above.
CrowdStrike Added to my position at $373 a share.
Uber Added to my position at $69.99 a share.
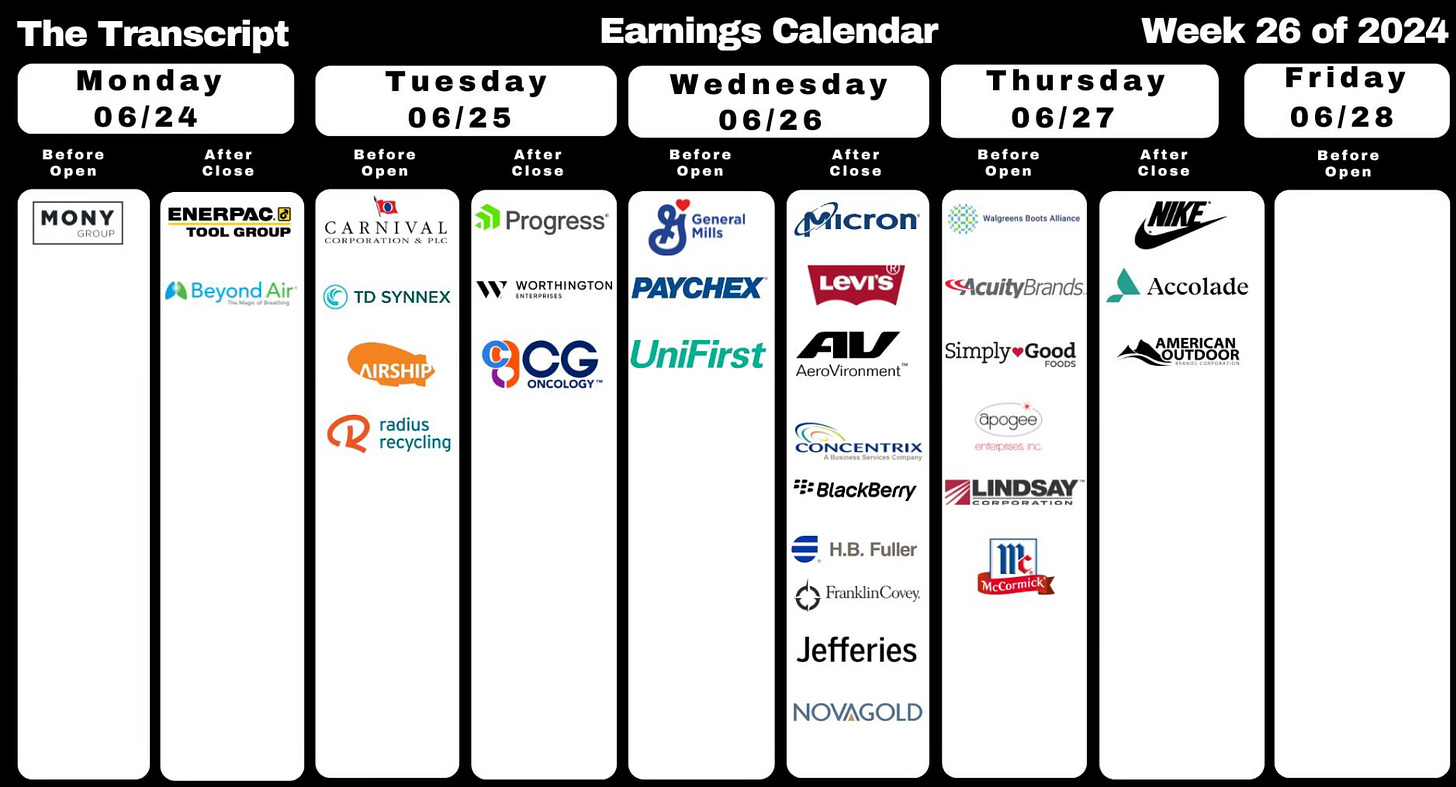
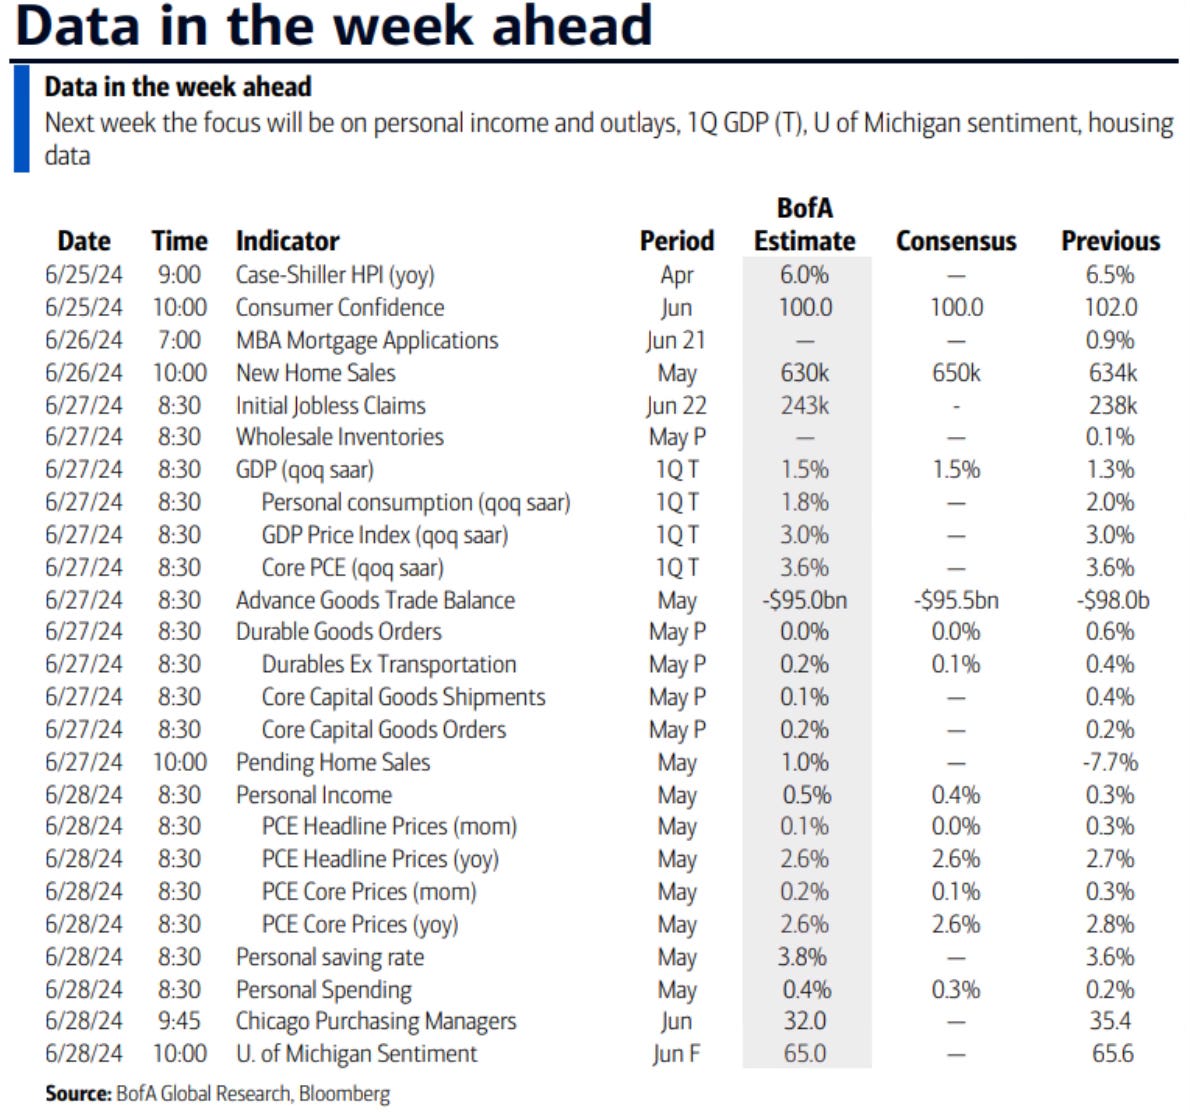
Upcoming Earnings & Data
The last week of earnings for Q2.
The Coffee Table ☕
Josh Schafer wrote a great piece in Yahoo Finance where he speaks with Neil Dutta on the Fed and the need to get with cutting rates. Why the Fed might need to 'get on with it' and cut rates
We’re now hearing about insurance issues with condo associations. Nicole Friedman of the WSJ did some good work on what’s going on with the property insurance cost spikes and insurability with condo associations. Big Jump in Insurance Costs Strikes Condos
I really liked Tony Isola’s post called Envy Is Not An Asset Class. “Comparison is the thief of joy.” I love this line. Social media really robs us of a lot and has created a social comparison. The power of it affects much more than we’re realizing.
Earlier this month I got lucky in a bourbon drawing. With the first pick I was able to get a Blanton’s Gold. Since I tried this a year ago, it has been one of my favorite bourbons. It’s just extremely hard to get a bottle around here. To the nose this comes with loads of vanilla and honey. Kind of like a pancakes and syrup vibe. Yes, that good of a smell! To taste, the honey and vanilla carry through as well as spice, then some sweetness combined with fruity and earthiness to finish. One of the top 5 bourbons I’ve had. If you see this gold horse, be sure to give it a try.
Thank you for reading! If you enjoyed Spilled Coffee, please subscribe.
Spilled Coffee grows through word of mouth. Please consider sharing this post with someone who might appreciate it.
Order my book, Two-Way Street below.


