Investing Update: 1st Half Recap & 2nd Half Outlook
What I'm buying, selling & watching
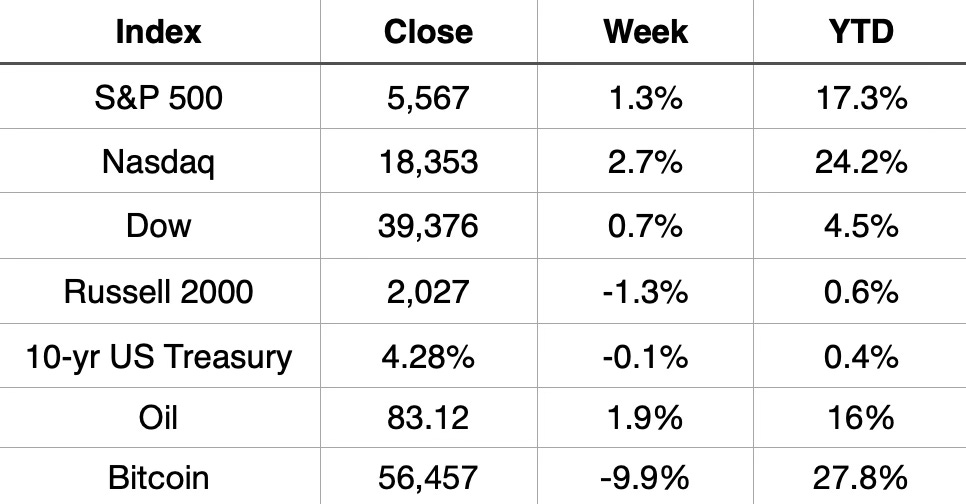
The week finished with the S&P 500 and Nasdaq both at new all-time record highs. This week saw the S&P 500 set three new record highs. It makes 34 new records so far in 2024. YTD the S&P 500 is up 17.3% and Nasdaq up 24.2%.
Market Recap
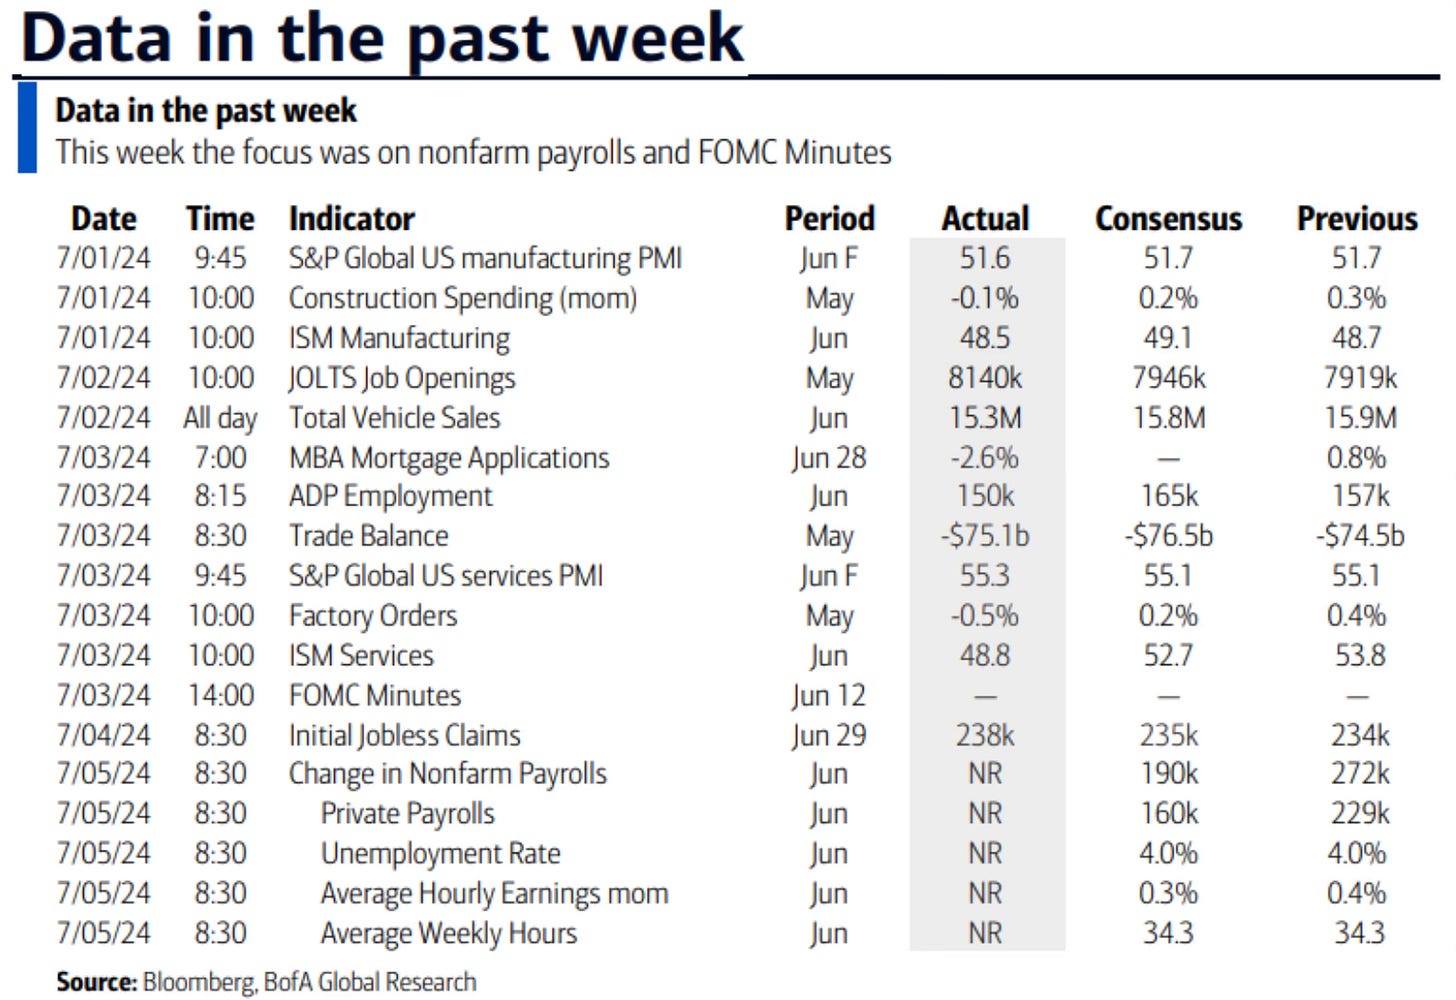
New record highs came on a holiday shortened week which saw some rather worrisome data illustrate a continued cooling of the economy. It furthers the likelihood of the Fed cutting of interest rates is nearing.
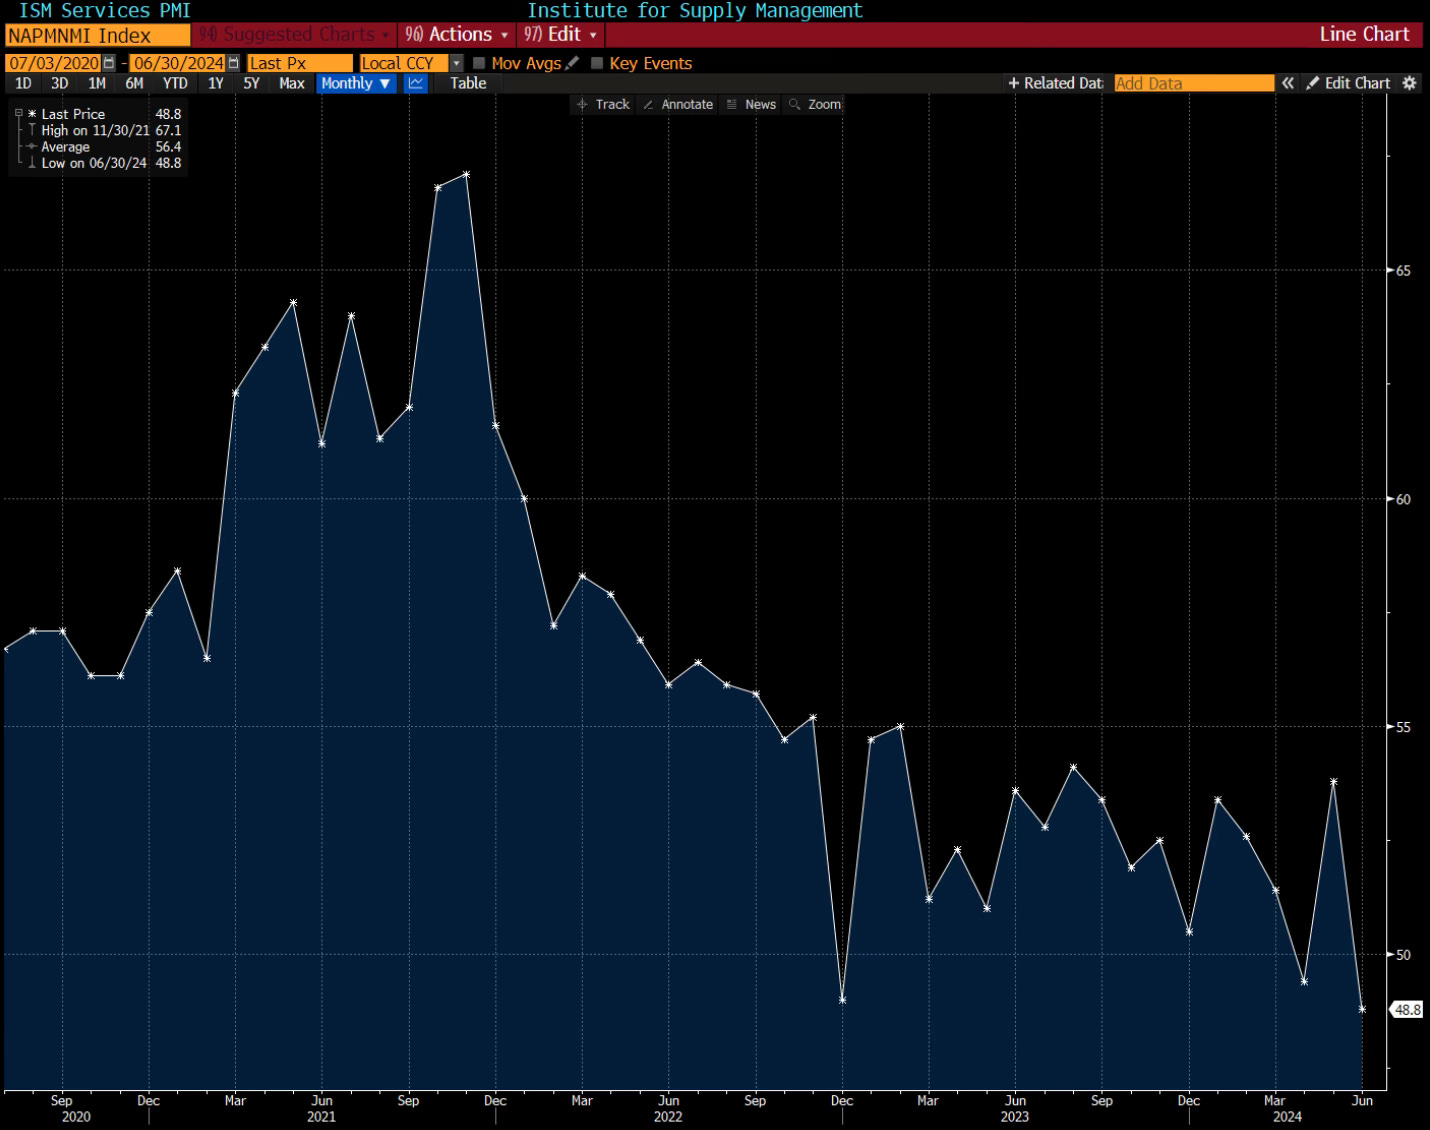
The ISM services PMI reading came in at the lowest level since the pandemic. The 48.8 number which fell from 53.8, is the the lowest since May 2020.
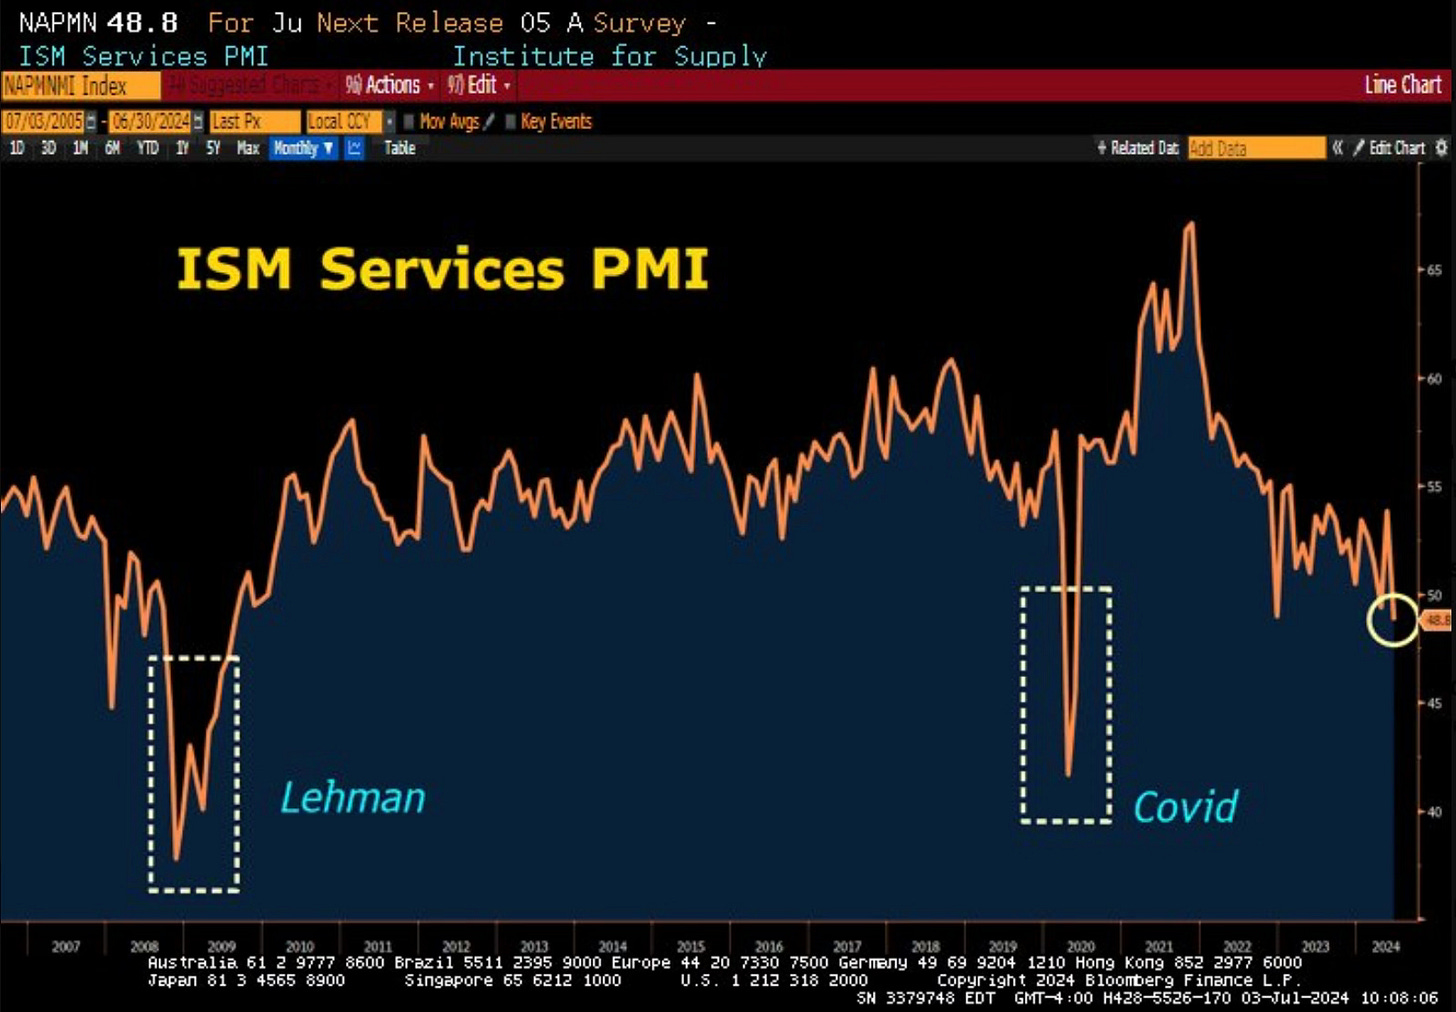
If you zoom out a little farther you can see how low this number is. It’s actually the 8th largest month over month decline since its inception in 1998.
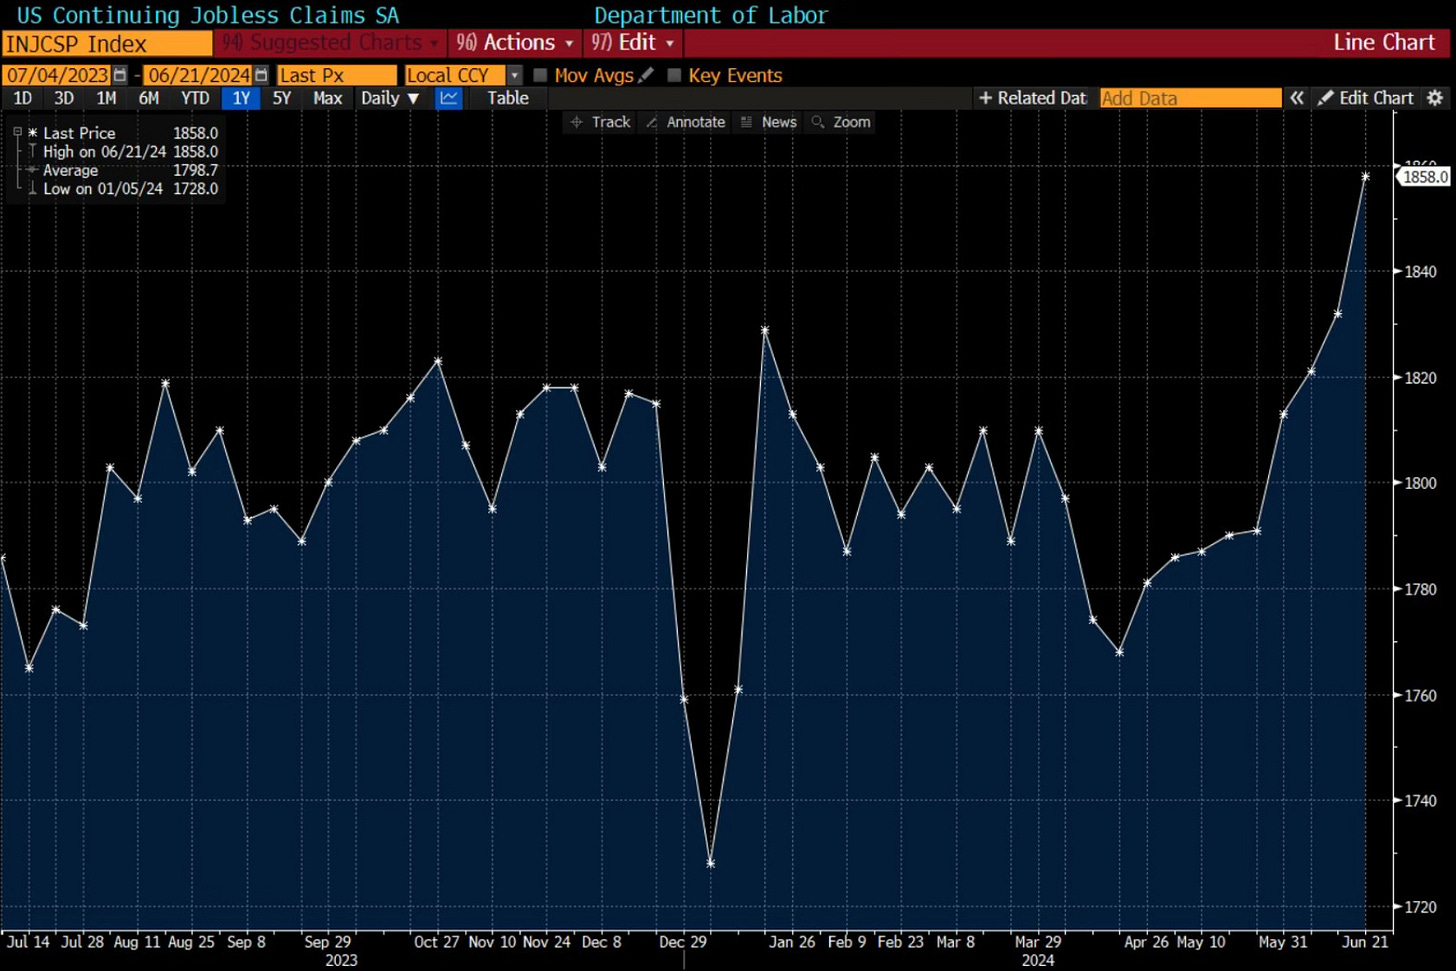
The same day saw the US Continuing Jobless Claims rise. They’ve now risen 9 weeks in a row. This 9 week stretch is the longest since 2018.
Then the week wrapped up on Friday with a rising unemployment rate. The unemployment rate climbed above 4% or the first time since November 2021. It now sits at 4.1%.

There is more data that’s coming out and I will be disucssing the economic cooling more in detail on Wednesday. There is too much data and charts to expand on it in detail in this Investing Update. We will tackle that all in Wednesday’s post.
It’s becoming clear that the economy is losing momentum and starting to cool. The strength was in the labor market and now we’re seeing weakness show up in both employment and spending. This is setting up for the Fed to begin cutting interest rates, likely in September.
1st Half Recap
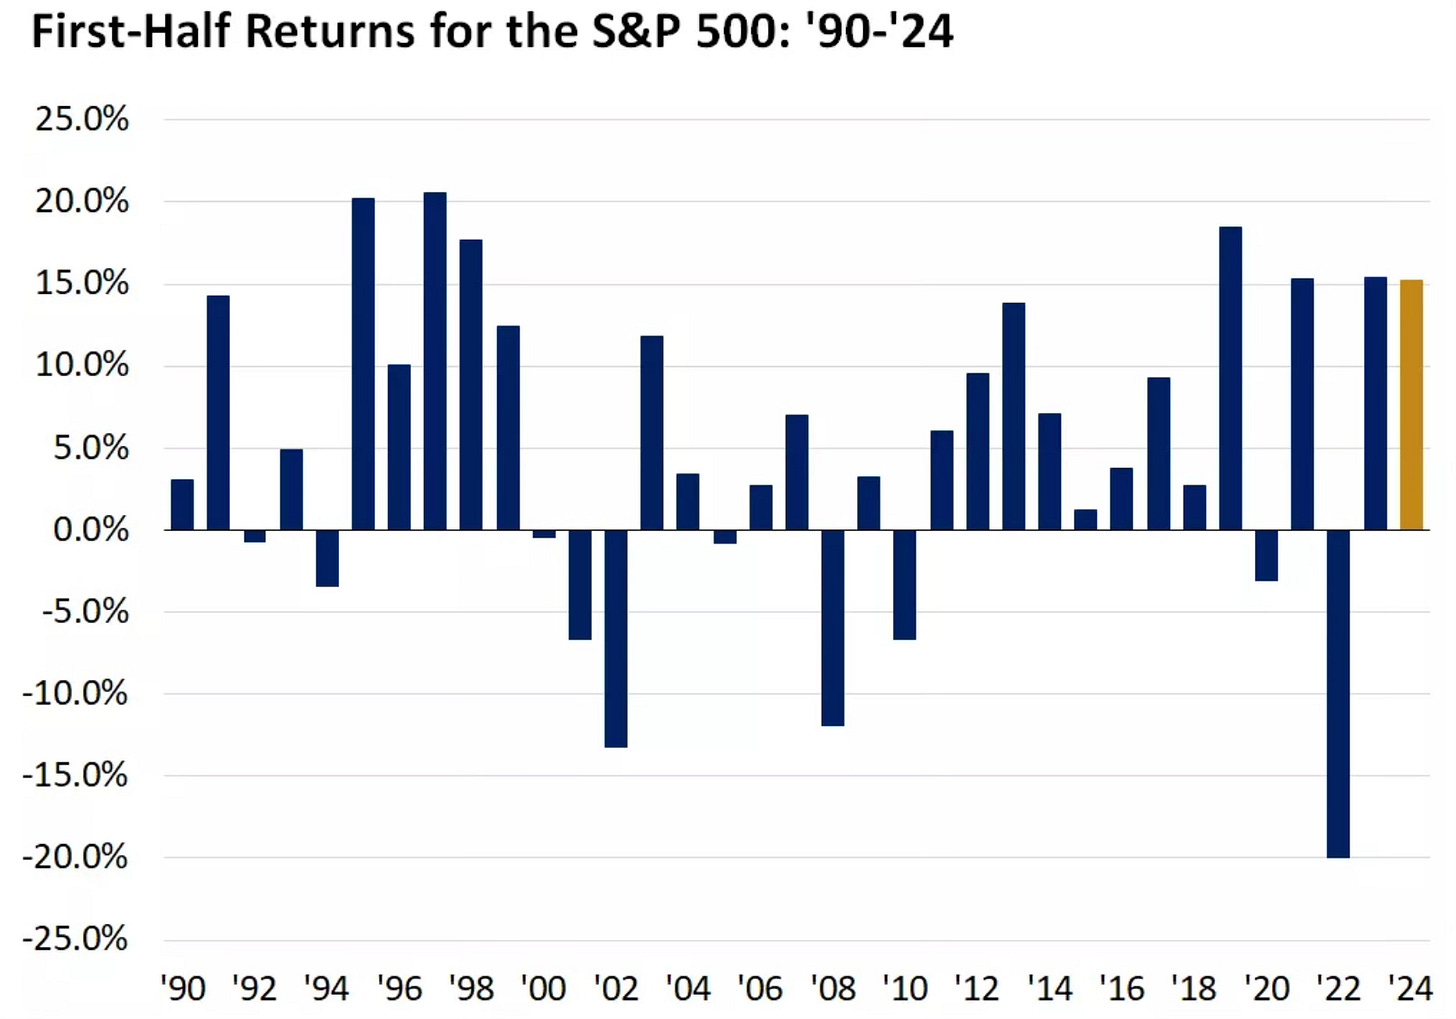
The S&P 500 had the 15th best 1st half to start a year going back to 1928.

Look how closely the start to this year has mirrored the starts in 2023 and 2021. There has only been two negative 1st half returns for the S&P 500 since 2011. 2020 and 2022.
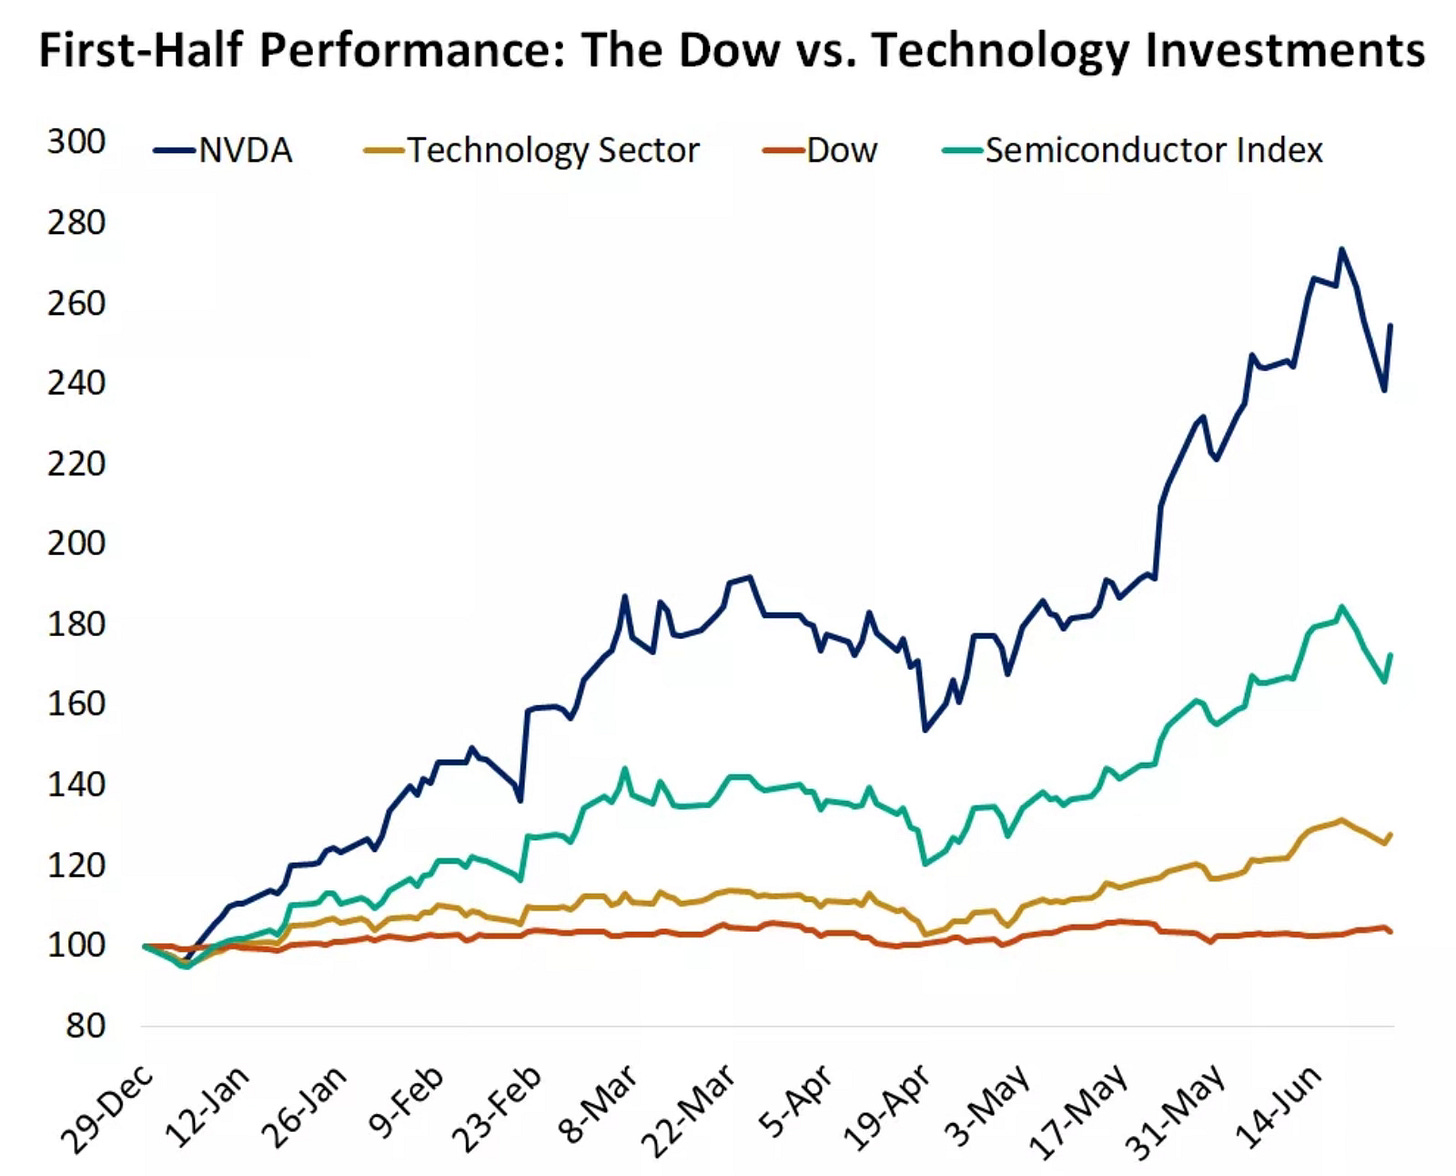
Tech and the AI excitement has led the way in 2024. I like how this chart compares Nvidia, the technology sector, the Dow and semiconductor index performance since the beginning of the year. You can see how the technology related investments have far outperformed.
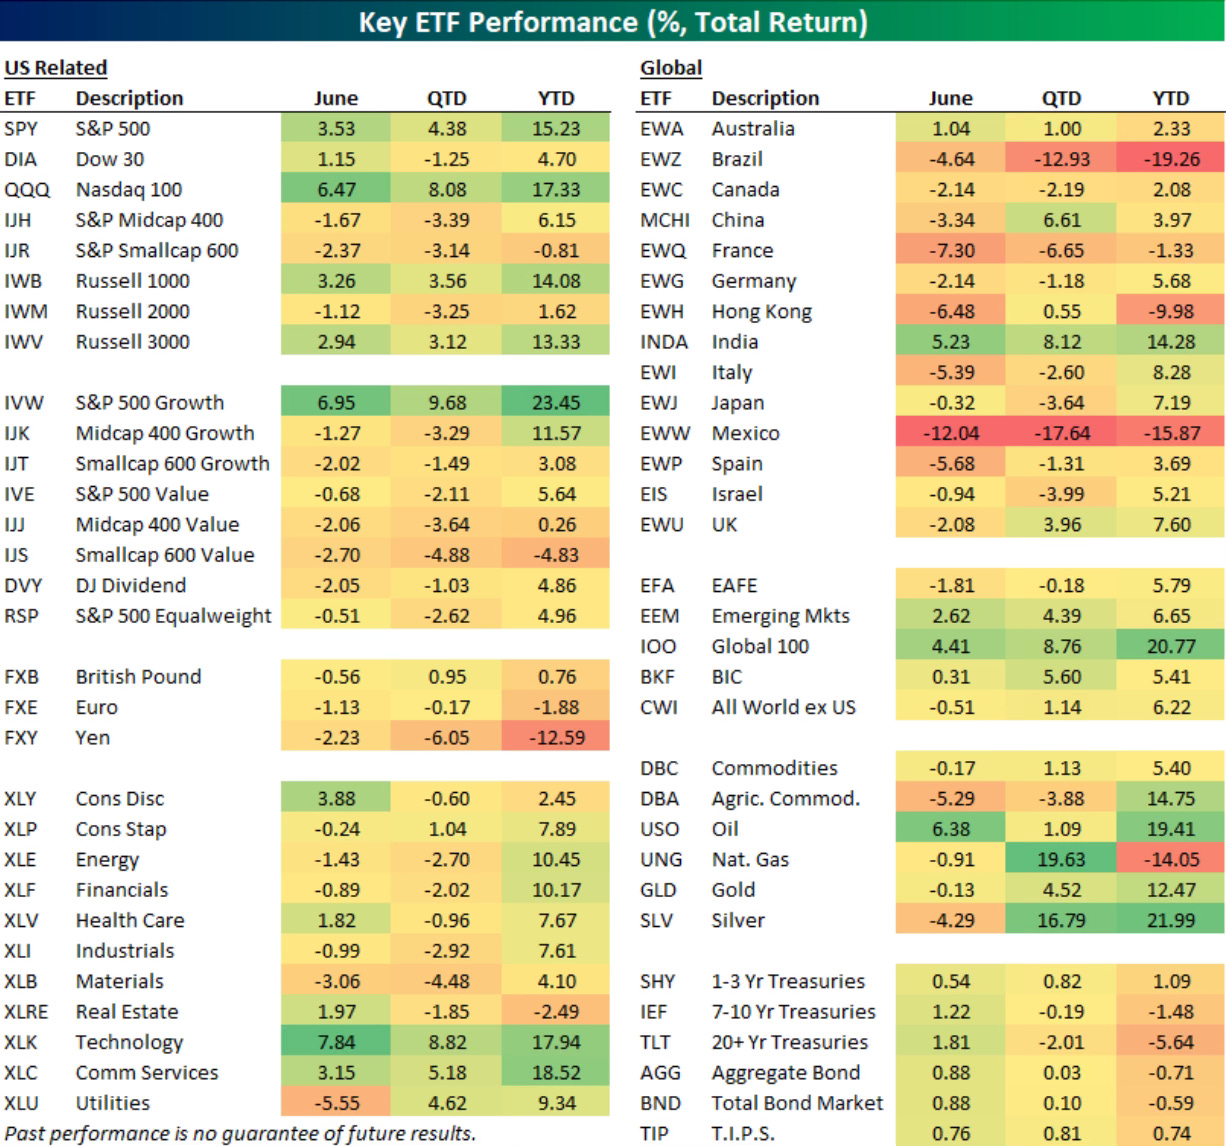
Real estate was the only sector that was negative.
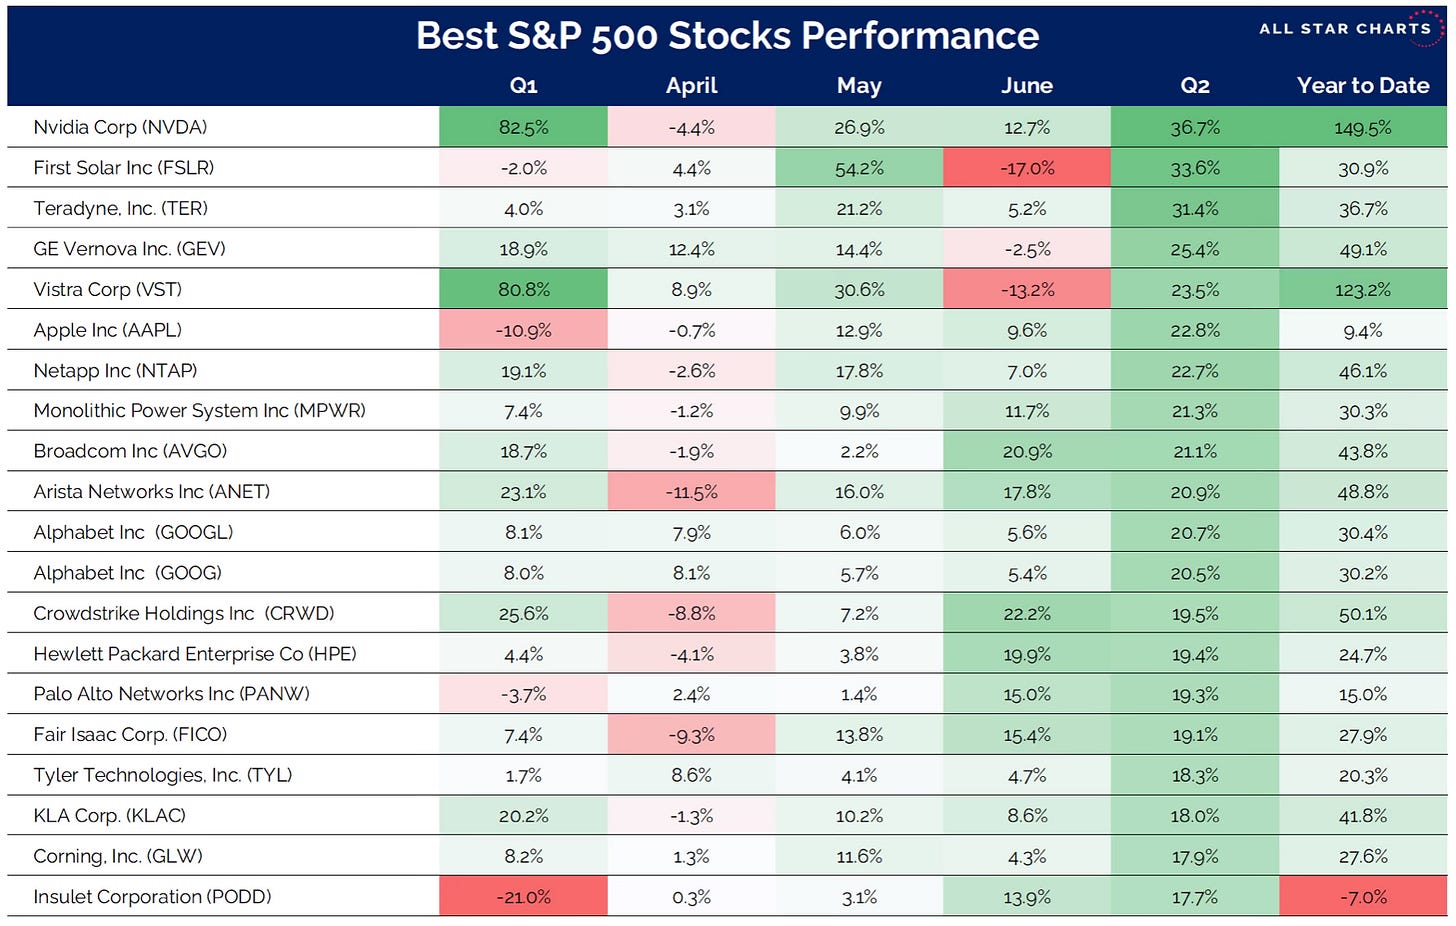
These were the best performing S&P 500 stocks.
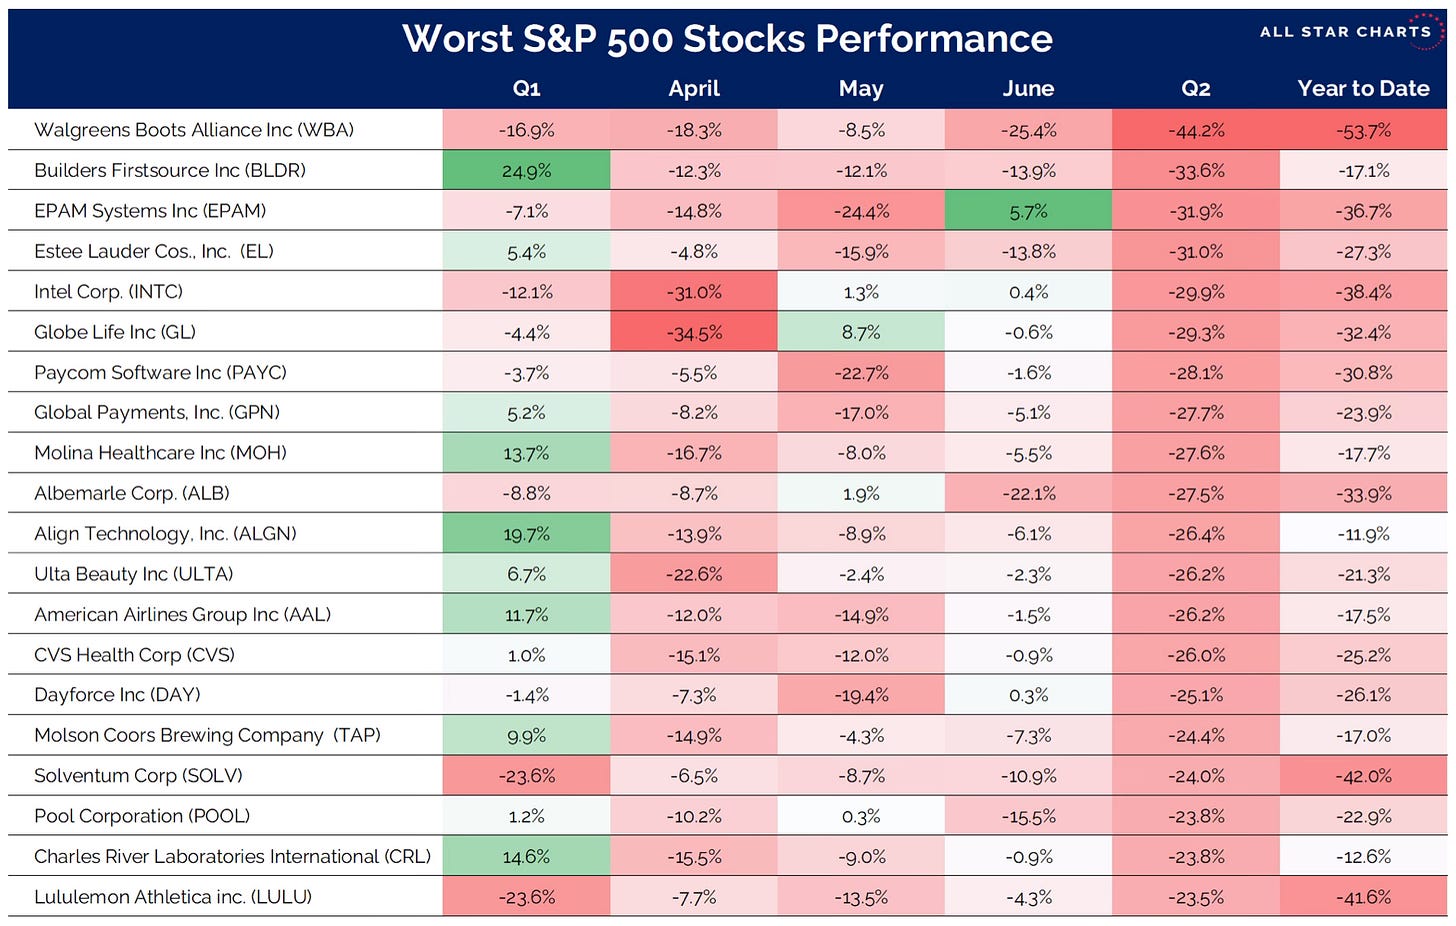
These were the worst performing S&P 500 stocks.
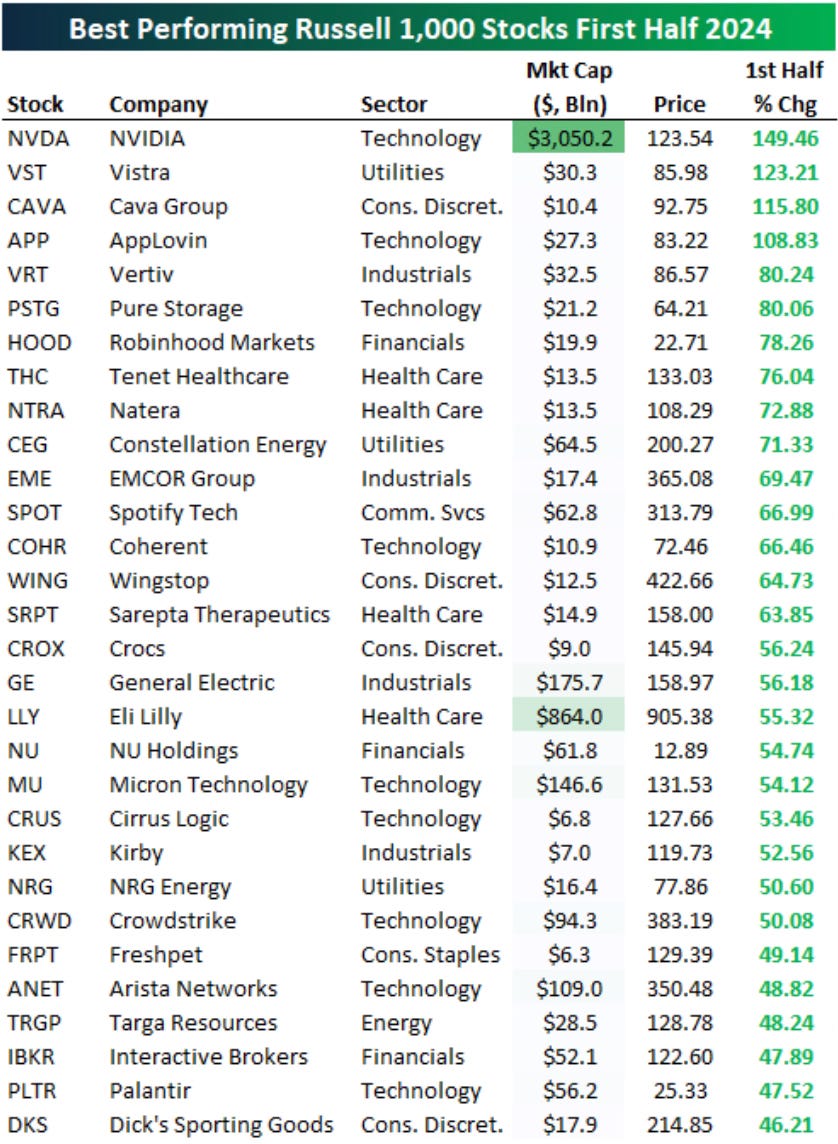
If we expand out a bit, here are the best performing stocks of the Russell 1,000.
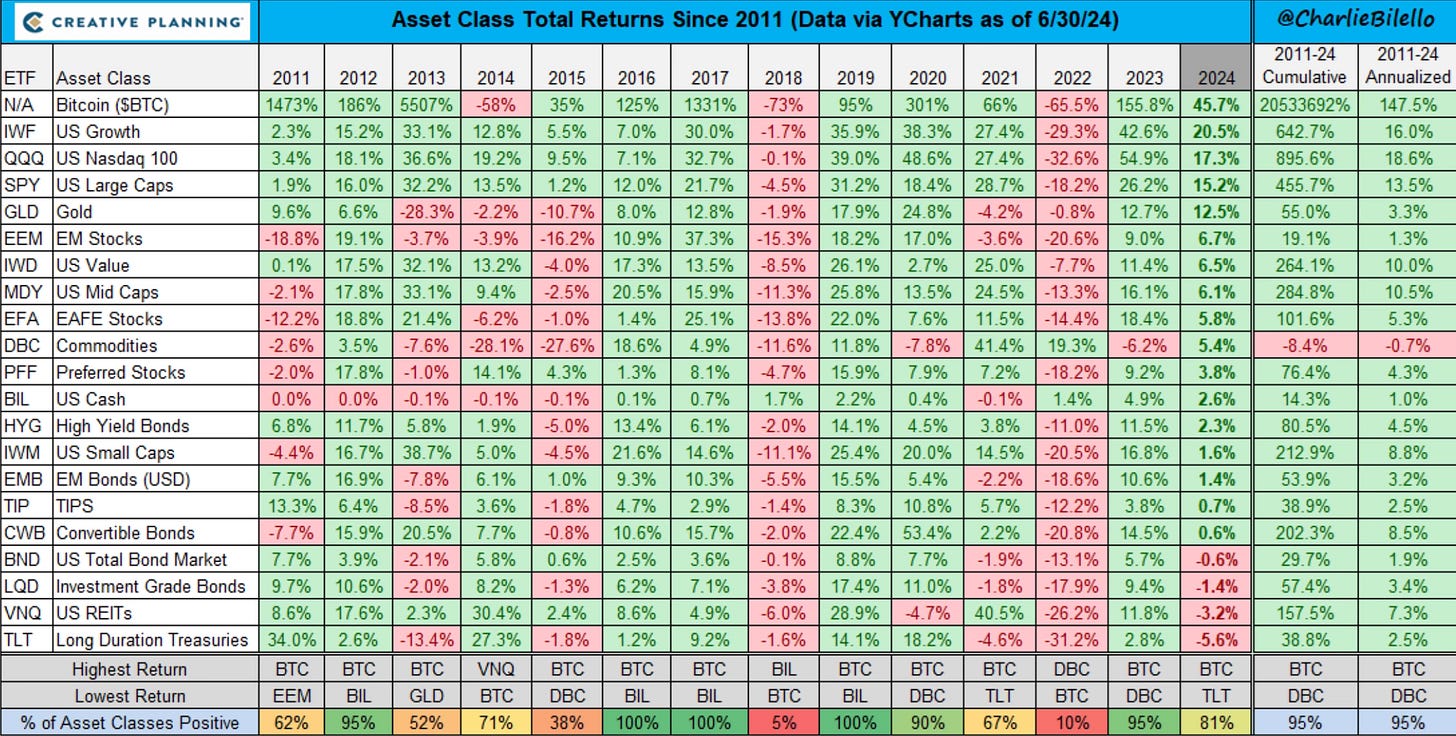
We finish the recap with my favorite ongoing asset class performance chart from Charlie Bilello.
My 1st Half Performance
As the 2nd quarter concludes, I wanted to look at where my portfolio is at, as well as my three stock picks for 2024 versus the major indices. This is all through the first half of the year.
Dow: 3.72%
S&P 500: 15.13%
Nasdaq: 20.09%
My Portfolio (Actively Managed): 34.09%
My 3 Stocks For 2024
Alphabet: 31.83%
CrowdStrike: 55.21%
Home Depot: -0.24%
I’m happy that two of my stock picks (CrowdStrike and Alphabet) are in the top 12 for the biggest S&P 500 gainers YTD.
Here is the link to my 2024 stock picks article. Investing Update: 3 Stocks For 2024
Individual Stock Calls & Data
I found some of BofA’s Top 10 US Ideas for Q3 to be rather interesting. I really like their Palantir call.

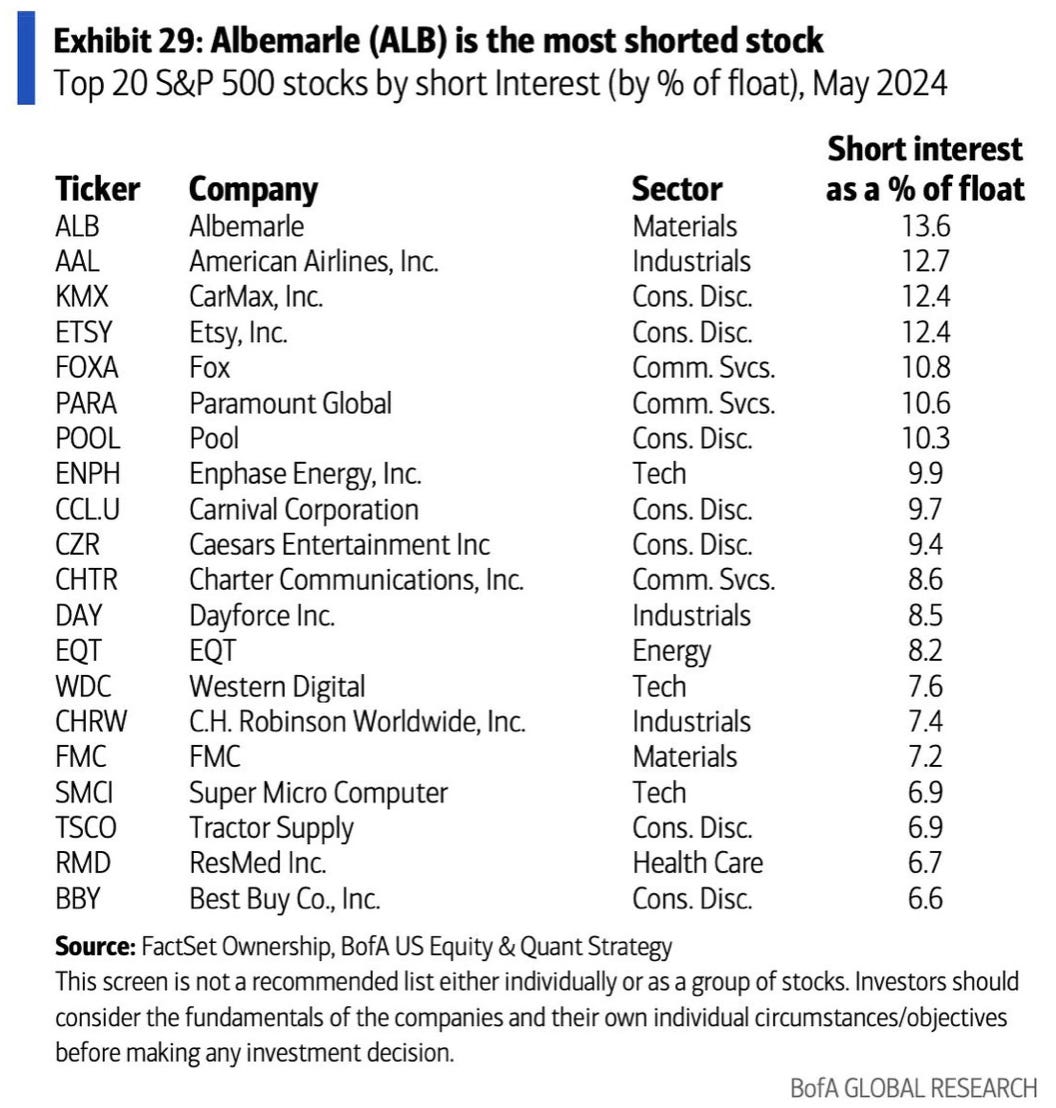
The list of the 20 most shorted stocks through May had a name on it that surprised me. I wasn’t expecting to see Tractor Supply among the stocks with the most short interest.
Will Small Caps Ever Join The Party?
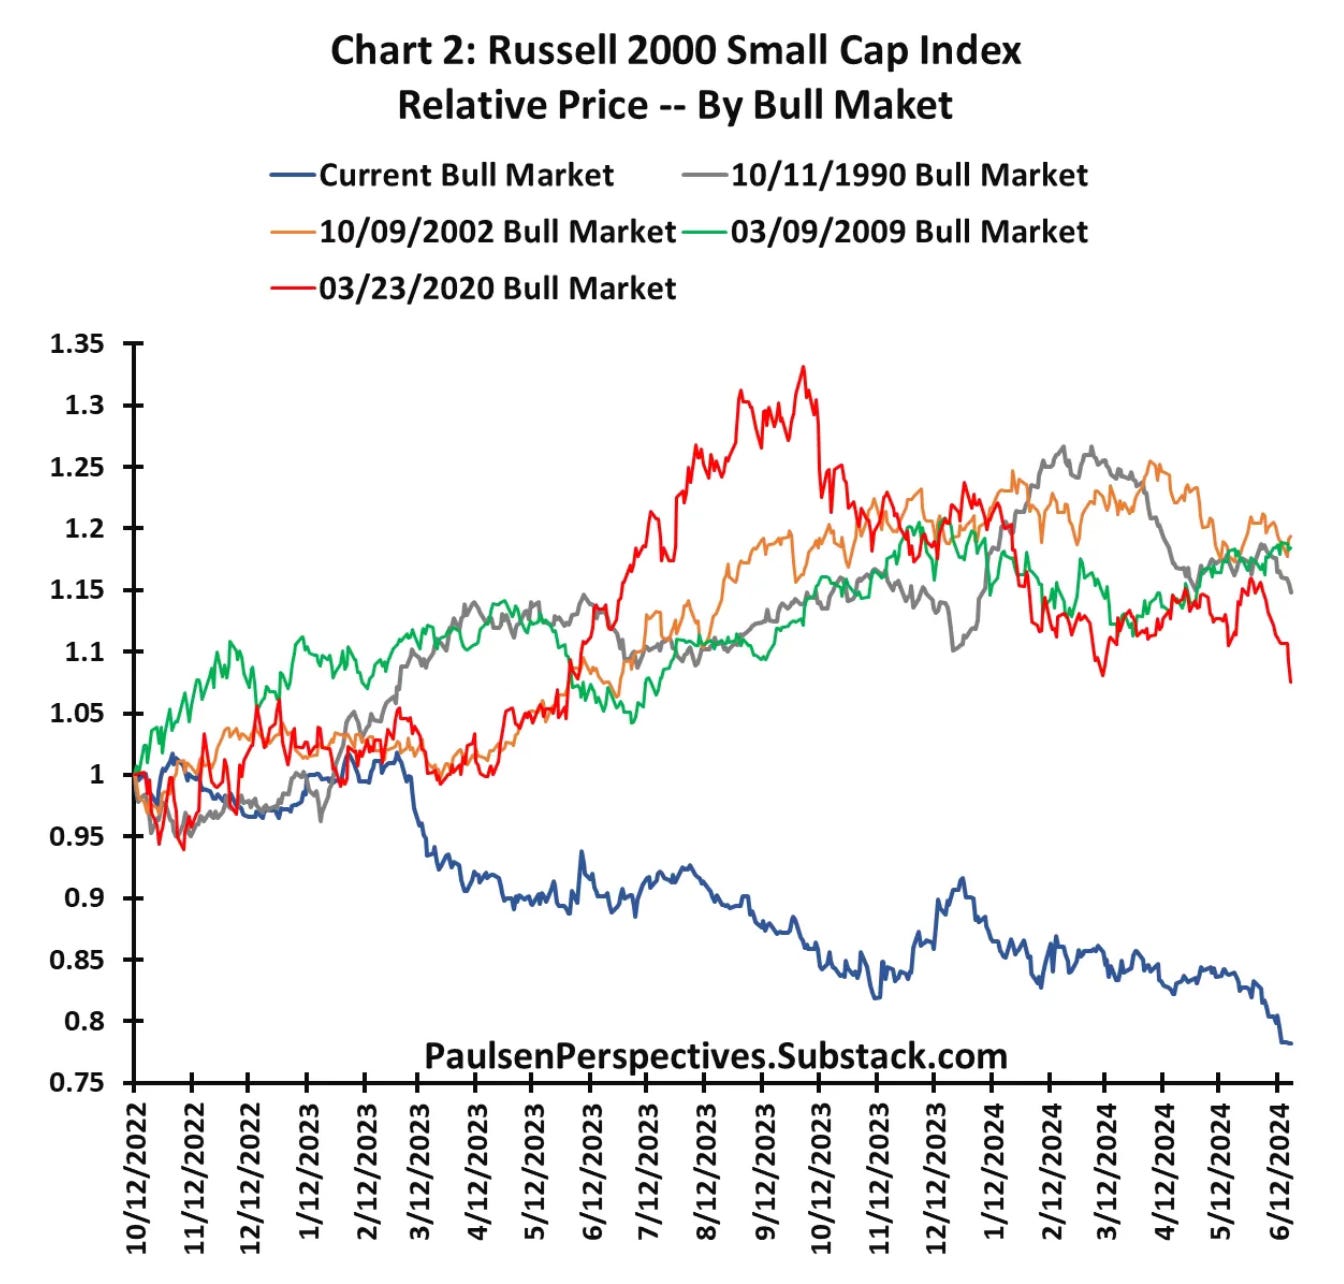
The story of small caps continues to get worse. I’ve stopped looking to small caps for any type of overall market calls or confirmations some time ago. One has to wonder if they’re ever going to join this bull market.
This week saw mega-caps tech stocks now outperforming small by the largest margin since the peak of the dot-com bubble.

Jim Paulsen pointed out just how odd this is historically for small caps during a bull market.
This has been one of the most unique Bulls ever for small cap stocks. Chart 2 demonstrates that the Russell 2000 Small Cap Index has essentially “not” been in a Bull Market! Small Caps left the Bull in early 2023 and have never returned. A complete oddity compared to the other four Bull markets since 1990, the Russell 2000 index has underperformed the S&P 500 by a whopping 22% since the start of this Bull market.
2nd Half Outlook
The S&P 500 was up 15.2% in the 1st half. Nvidia contributed 4.5% of that gain alone. If you then add Microsoft, Amazon, Meta and Alphabet along with Nvidia, the remaining other 495 S&P 500 companies only contributed 5.6%.
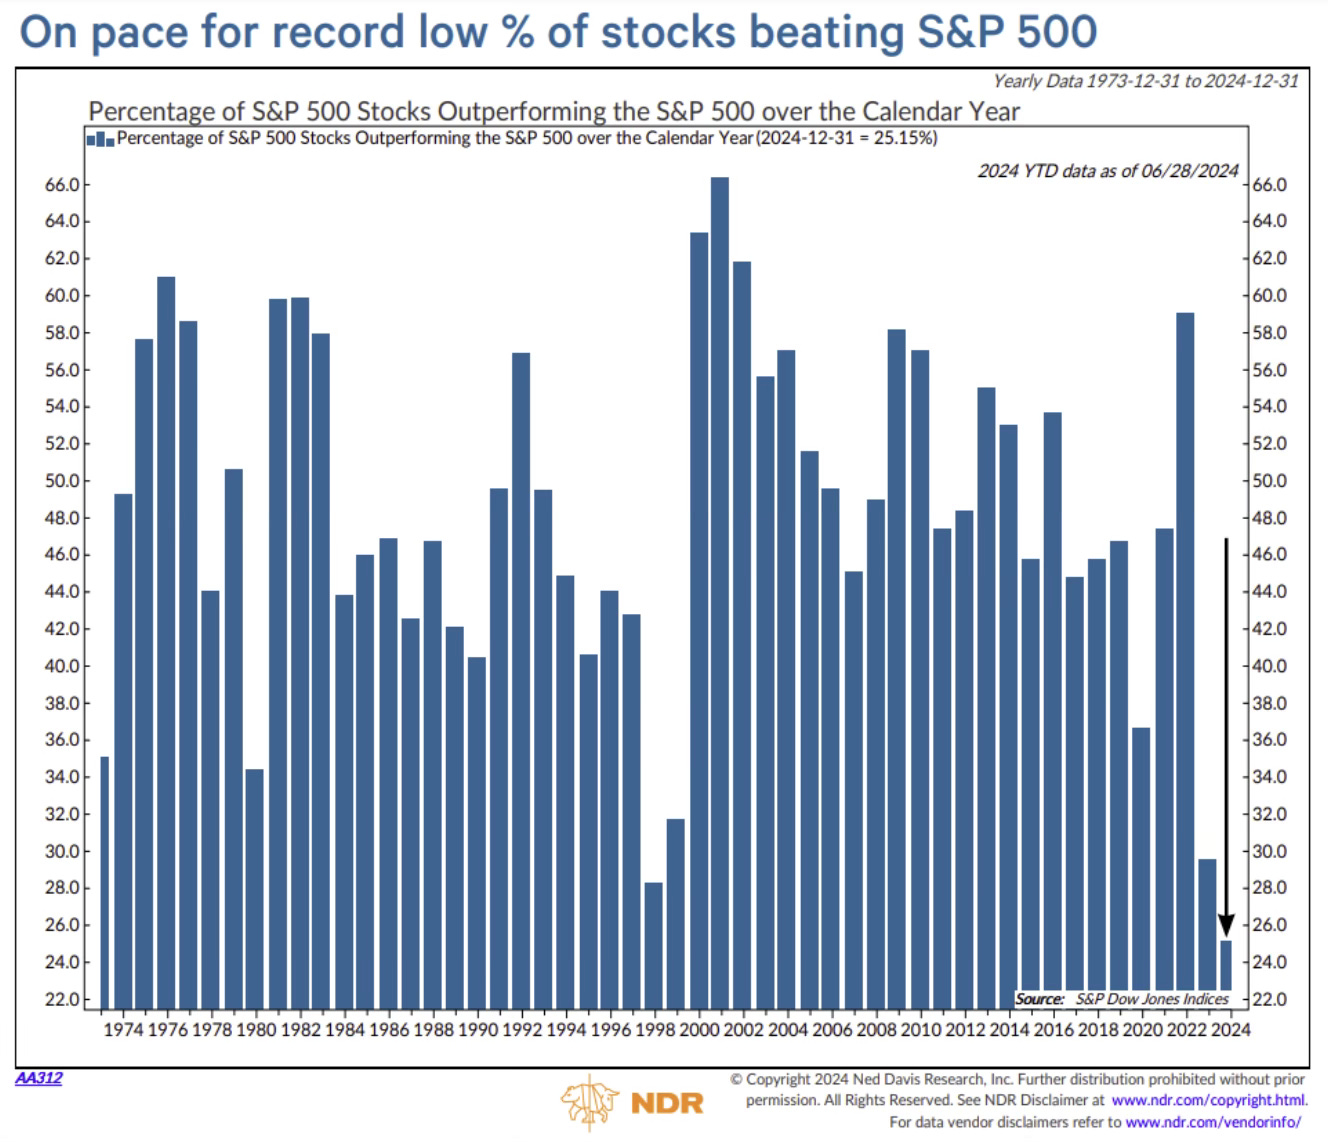
Many call into question if the market can get another leg higher without more contributions outside the biggest mega-cap tech companies. We are after all on pace for a record low number of S&P 500 companies beating the S&P 500 index.
But the fact remains that we saw an unusually smooth first half to the year. One has to really wonder what the 2nd half holds. I mean there hasn’t even been a day down 1% or more since April. I enjoyed this chart from Callie Cox on the history of summer storms and the number of 1% drops in the S&P 500 during the summer months.
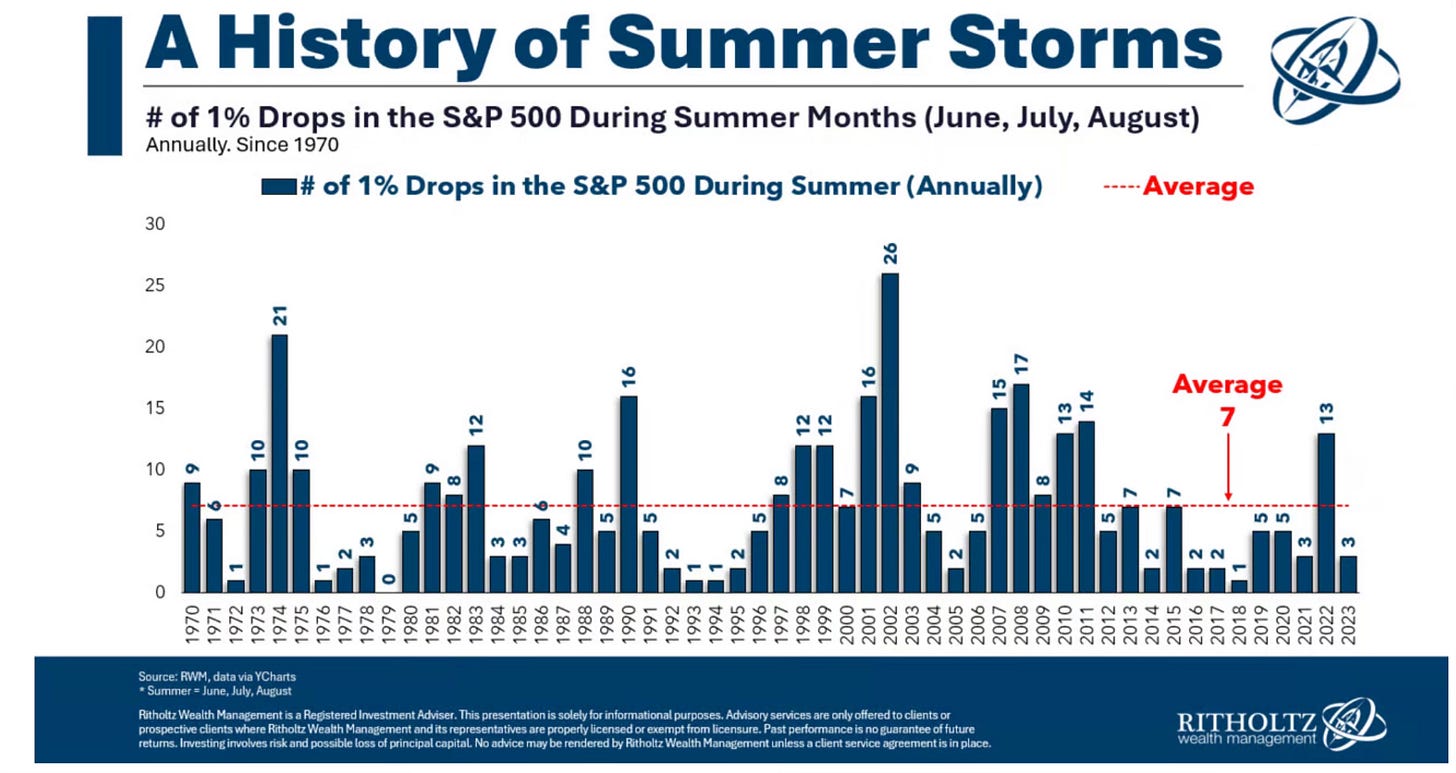
We have to expect some volatility at some point. The road can’t continue to be this smooth. We’re starting to see the labor market and consumer spending cool. A September interest rate hike by the Fed seems highly likely. There is a looming election coming in November which could see a regime change in Washington.
After an over 15% gain for the 1st half who’s complaining? 15% for the entire year would be a welcome yearly return by any investor. So is there much upside as we enter the 2nd half?
I believe that’s going to come down to what the Fed does in the next few months. If there is a cut in interest rates, then I think we could see an over 25% return to end 2024.
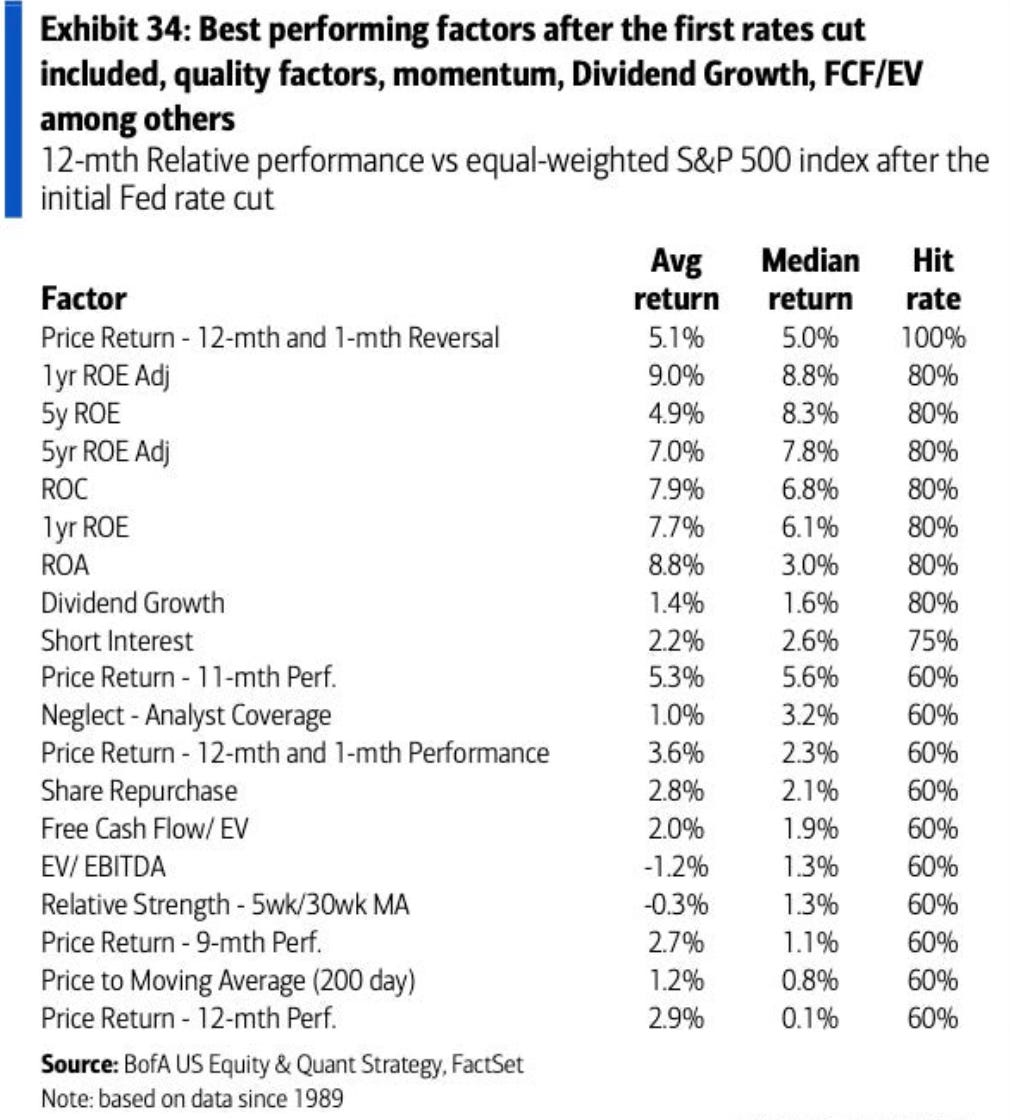
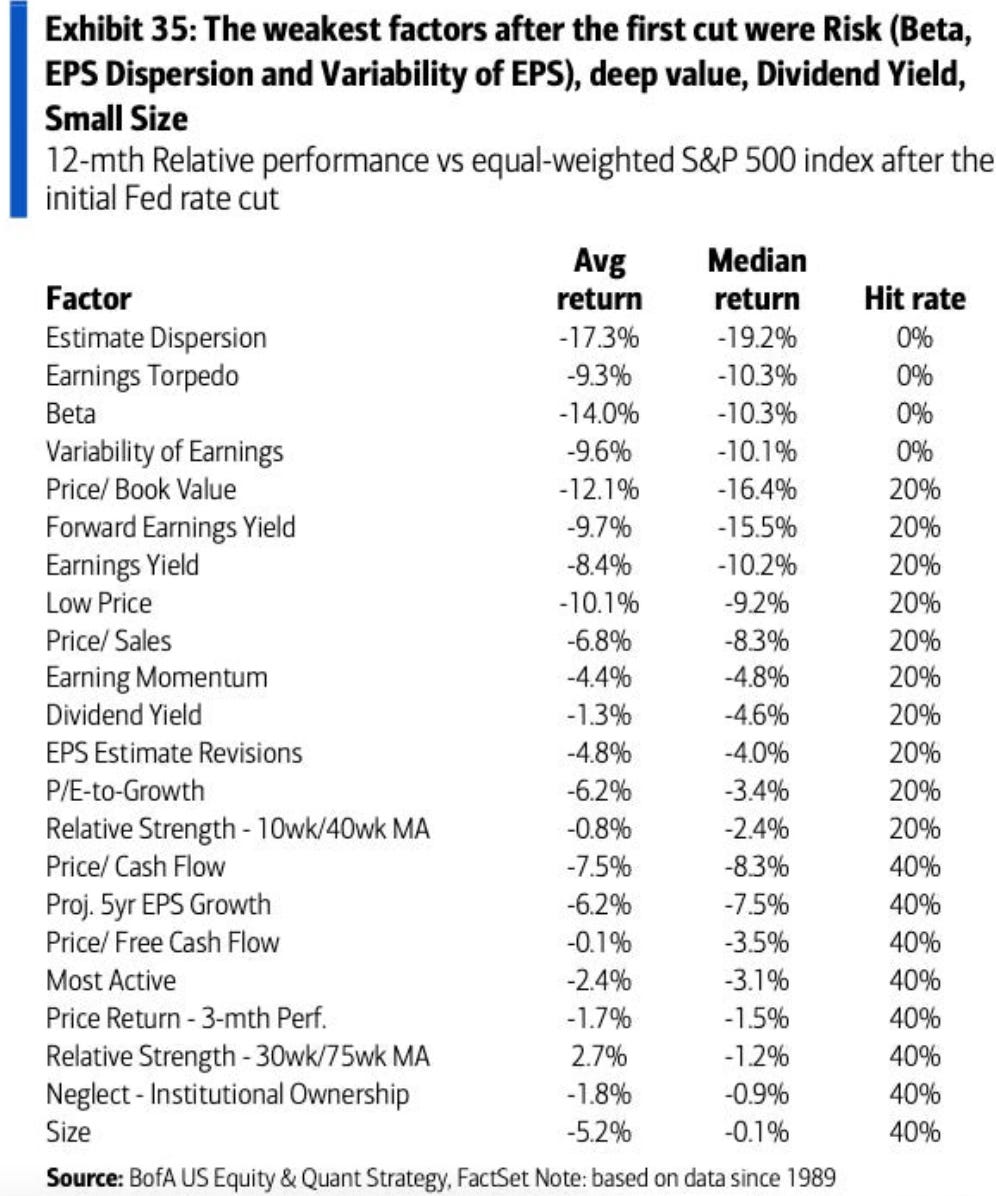
With that being a highly likely scenario in my view, I wanted to see what are the best and worst performing factors after the first rate cuts. This data looks back to 1989.
Here are the best performing factors after the first rate cuts.
On the other side of that are the weakest factors after the first rate cut.
A lot is coming at investors over the next few months as we enter the fall election season. There may even be some surprises along the way. You never know. It’s never dull and it’s never boring. Bring on the 2nd half!
Moves I’ve Made
S&P 500 Index I added to my S&P 500 index position this week.
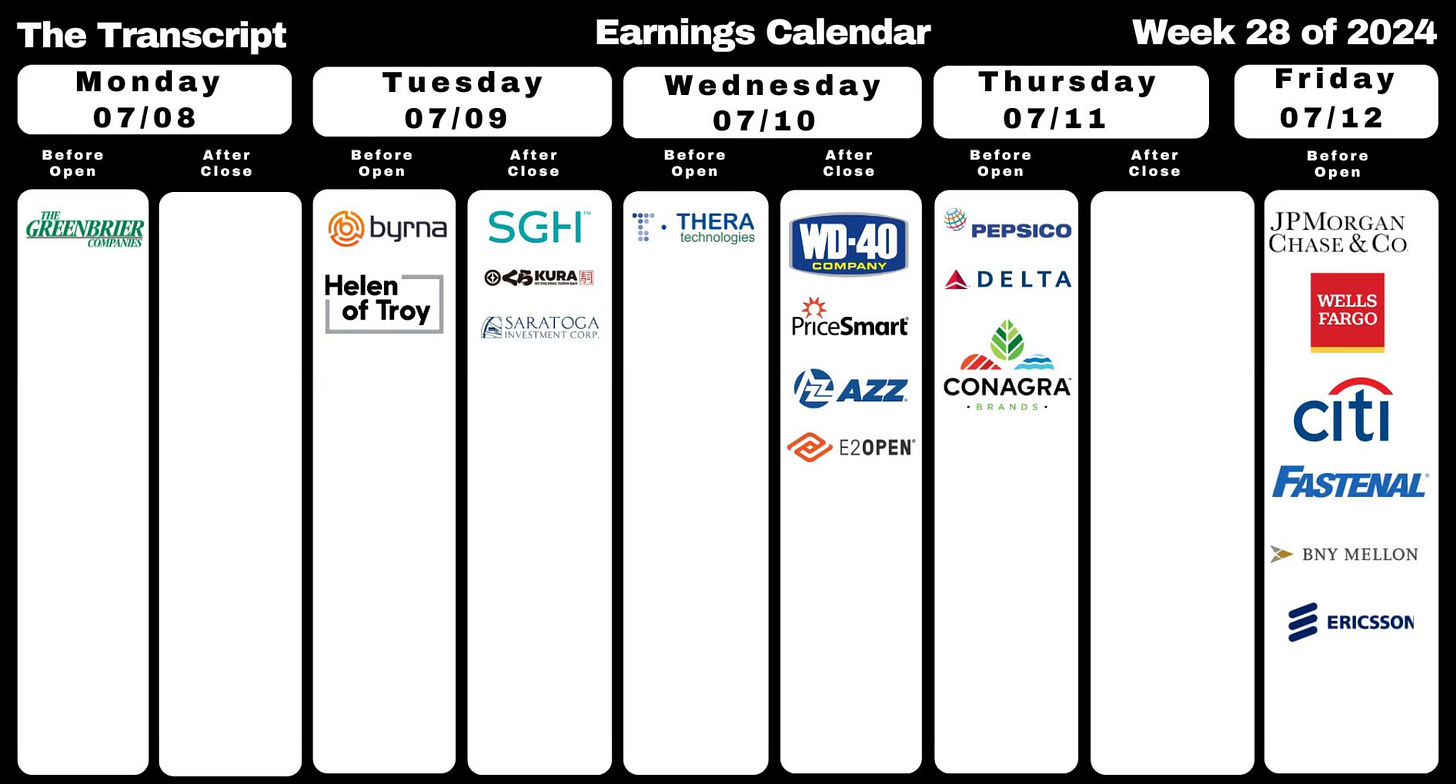
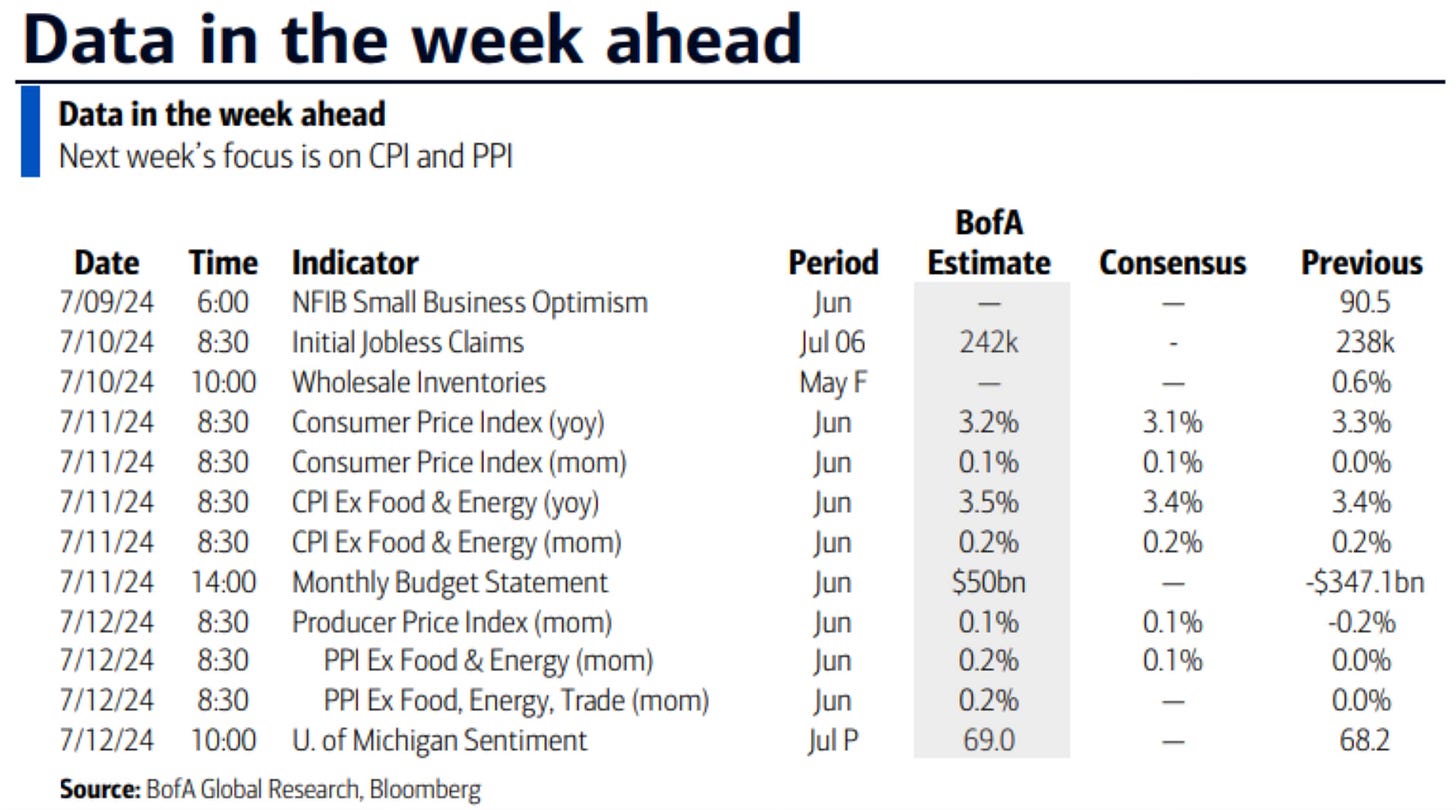
Upcoming Earnings & Data
Earnings season returns next week. Get ready!
The Coffee Table ☕
Brian Sozzi of Yahoo Finance had a good piece on Nvidia and how it now finds itself in uncharted territory. It’s truly a juggernaut and the big question is, how long can it sustain this continued run? Why Nvidia stock is now in treacherous waters: Morning Brief
Ben Henry-Moreland had a very informative post in Kitces on 529-to-Roth IRA rollovers called 529-To-Roth IRA Rollovers: Taking Advantage Of The New Option To Move Education Savings To Retirement Savings. He covers this topic extremely well and relays it simply to the reader.
I enjoyed Jason Zweig’s story in the WSJ Why Your Fund Manager Can’t Beat Today’s Stock Market. It’s such a great reminder from one of the best finance writers ever, of just how hard it is for professionals to beat the S&P 500.
"Stock pickers are doing even worse than usual. In the first half of 2024, according to Morningstar, only 18.2% of actively managed mutual funds and exchange-traded funds that compare themselves to the S&P 500 managed to outperform it."
Here is a visual of the retail vs institutional ownership of the S&P 500 stocks. Visa is far and away the most owned by institutions. Tesla and Exxon are owned the most by retail.
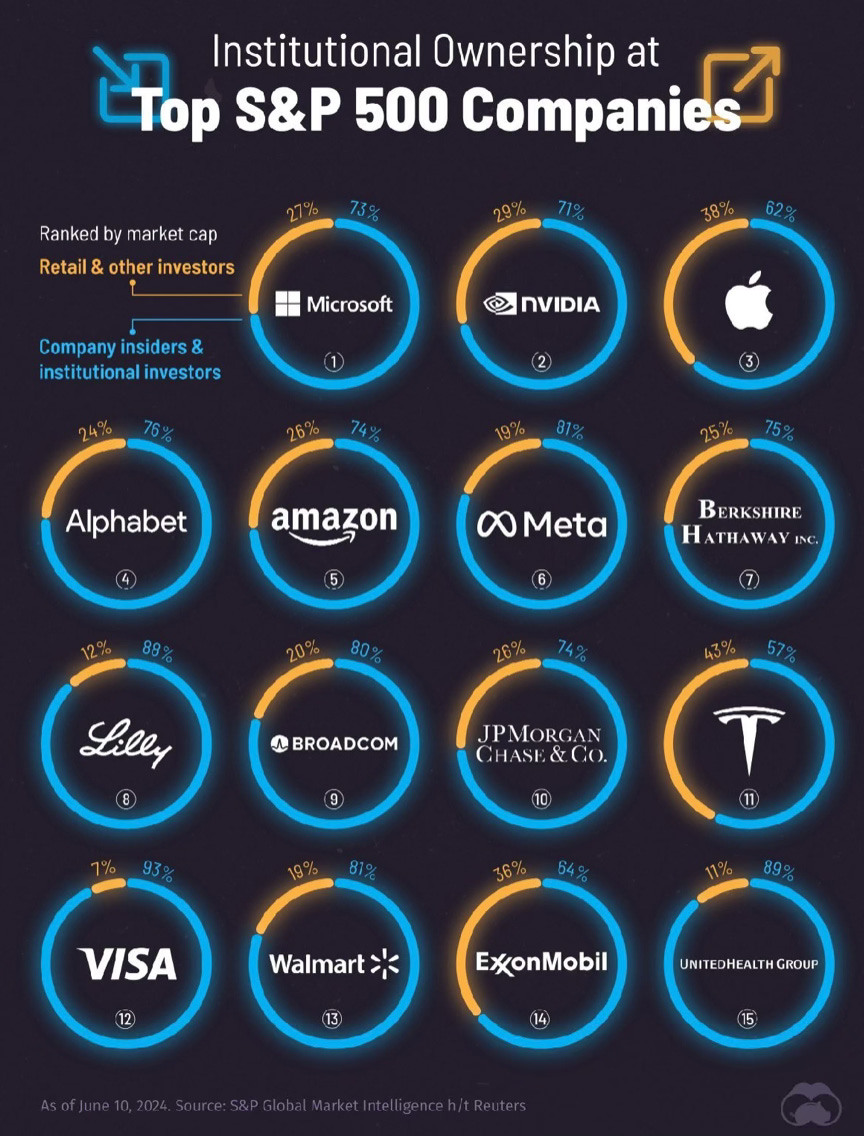
Source: Blossom
Thank you for reading! If you enjoyed Spilled Coffee, please subscribe.
Spilled Coffee grows through word of mouth. Please consider sharing this post with someone who might appreciate it.
Order my book, Two-Way Street below.

