
Can this market go higher? Can this bull market continue?
You’ve heard it. And I know you’ve thought it too. Don’t deny it.
Thursday was a historic day for the stock market. The S&P 500 crossed 7,800 for the first time, making its 27th all-time high of 2026.
Yes, there will eventually be a top. The bull market will eventually end. They all do.
But the key word in that sentence is eventually. That makes it a great time to look at what history actually says about bull markets like this one.
A new all-time high sounds rare. They aren’t. At least in bull markets.
Look at all the zeros. 2001 through 2006 are all goose eggs. 2009 through 2012. Nothing!
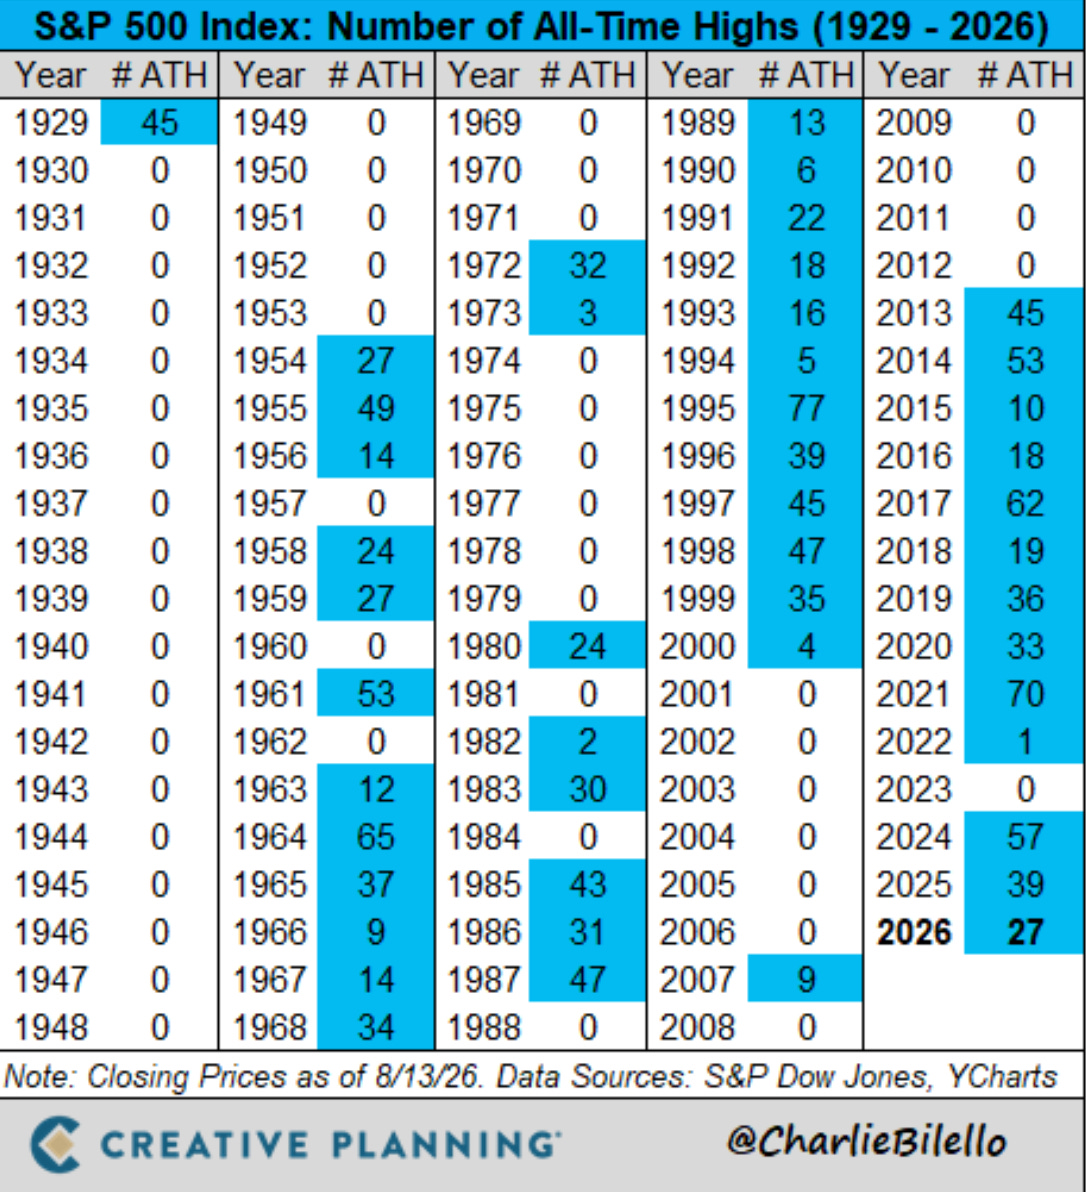
Bear markets are where all-time highs go to die. Bull markets are where they pile up. 27 all-time highs in 2026 during a bull market isn’t unusual. It’s what bull markets do.
This bull market turned 3.8 years old this year. That’s not old. It’s actually younger than the historical average.
The average bull market since 1949 has run for 5.6 years. And there is a pattern here worth knowing. Once a bull gets past 3 years old, it tends to have a lot of road left. This bull market has already cleared that mark.
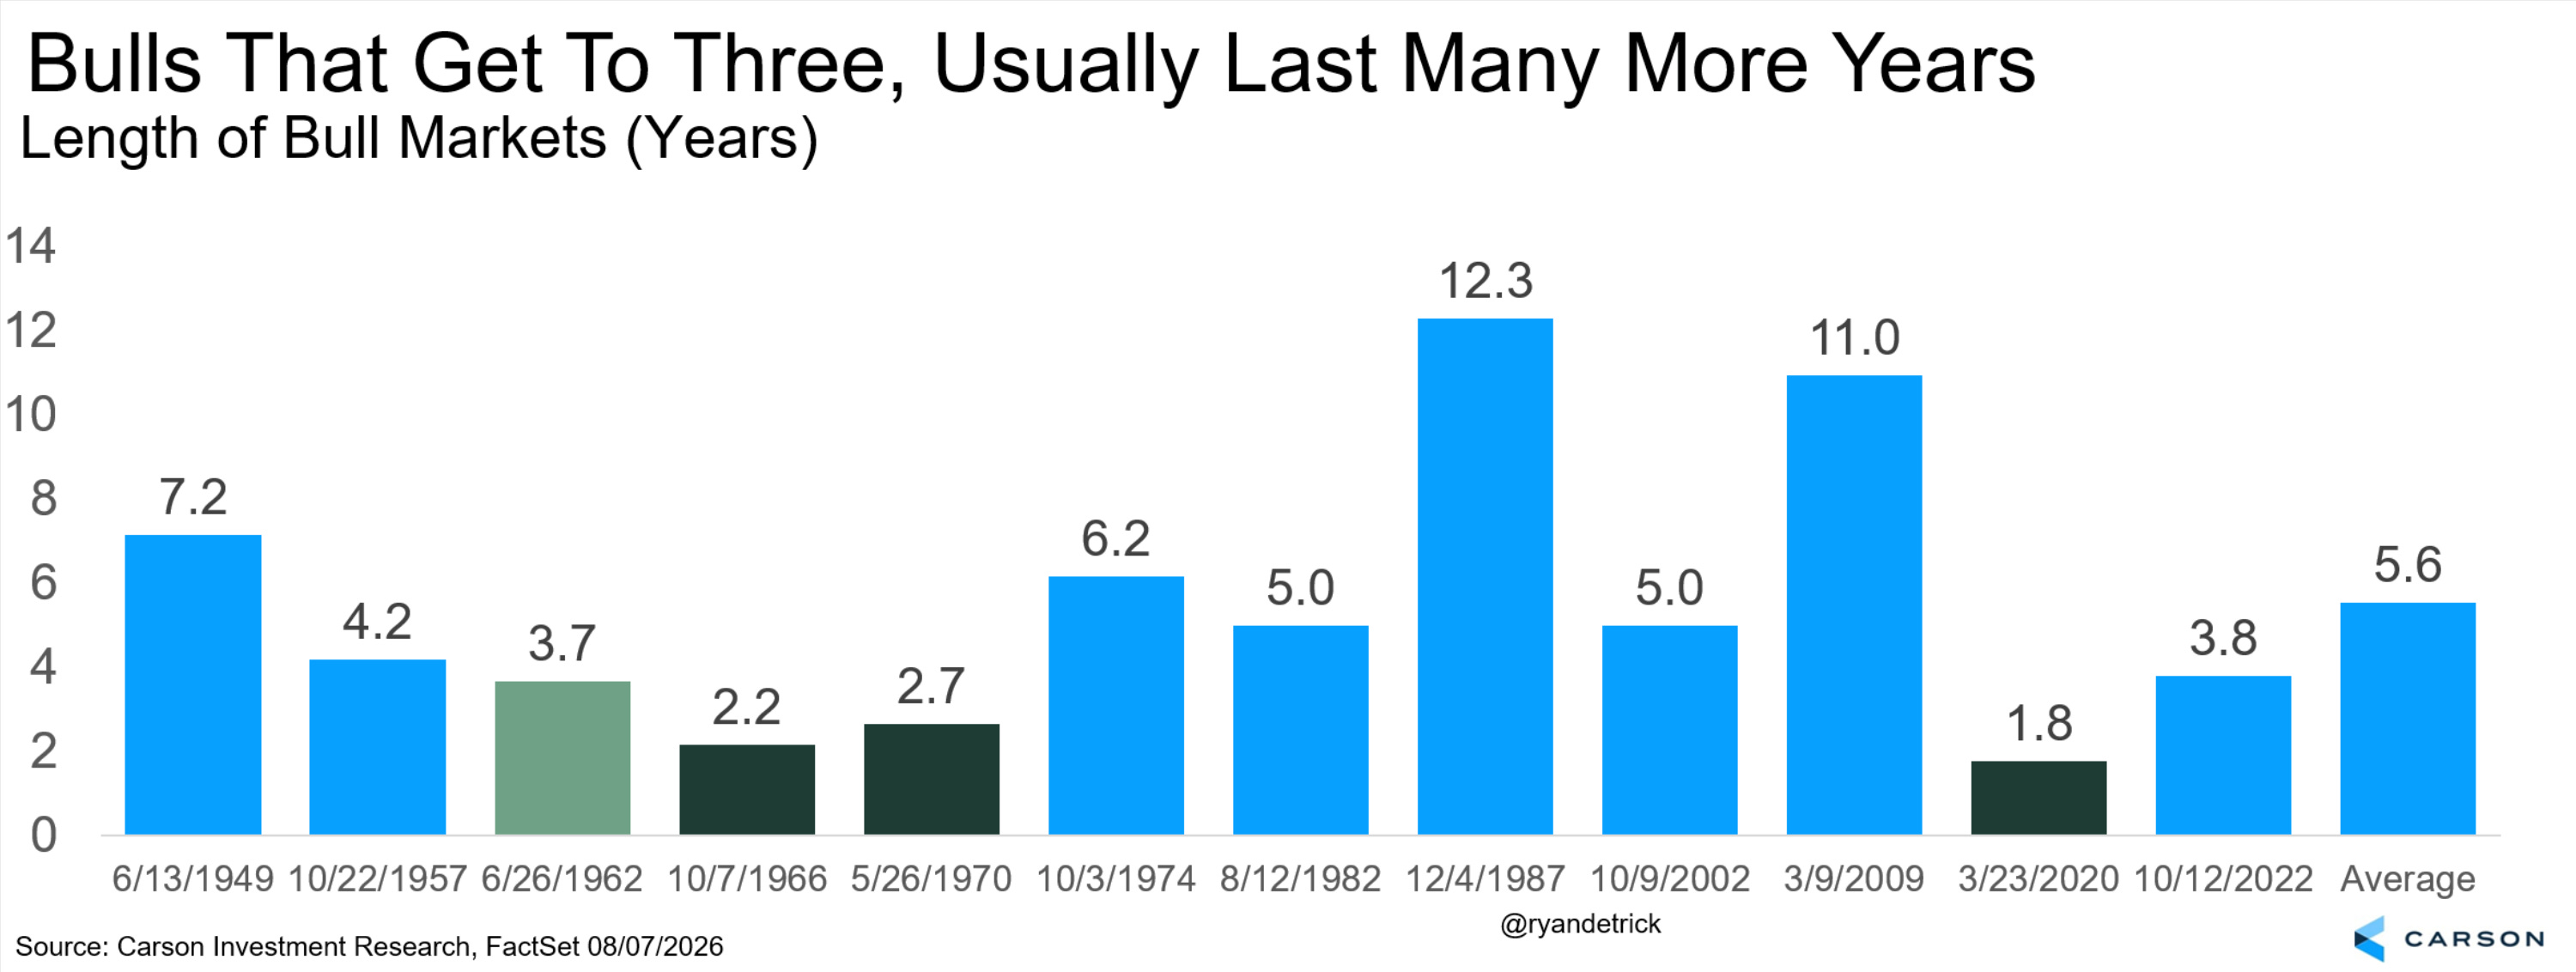
Want a chart to pull out at the dinner table for all the doomer and gloomers? Or for all the permabears out there?
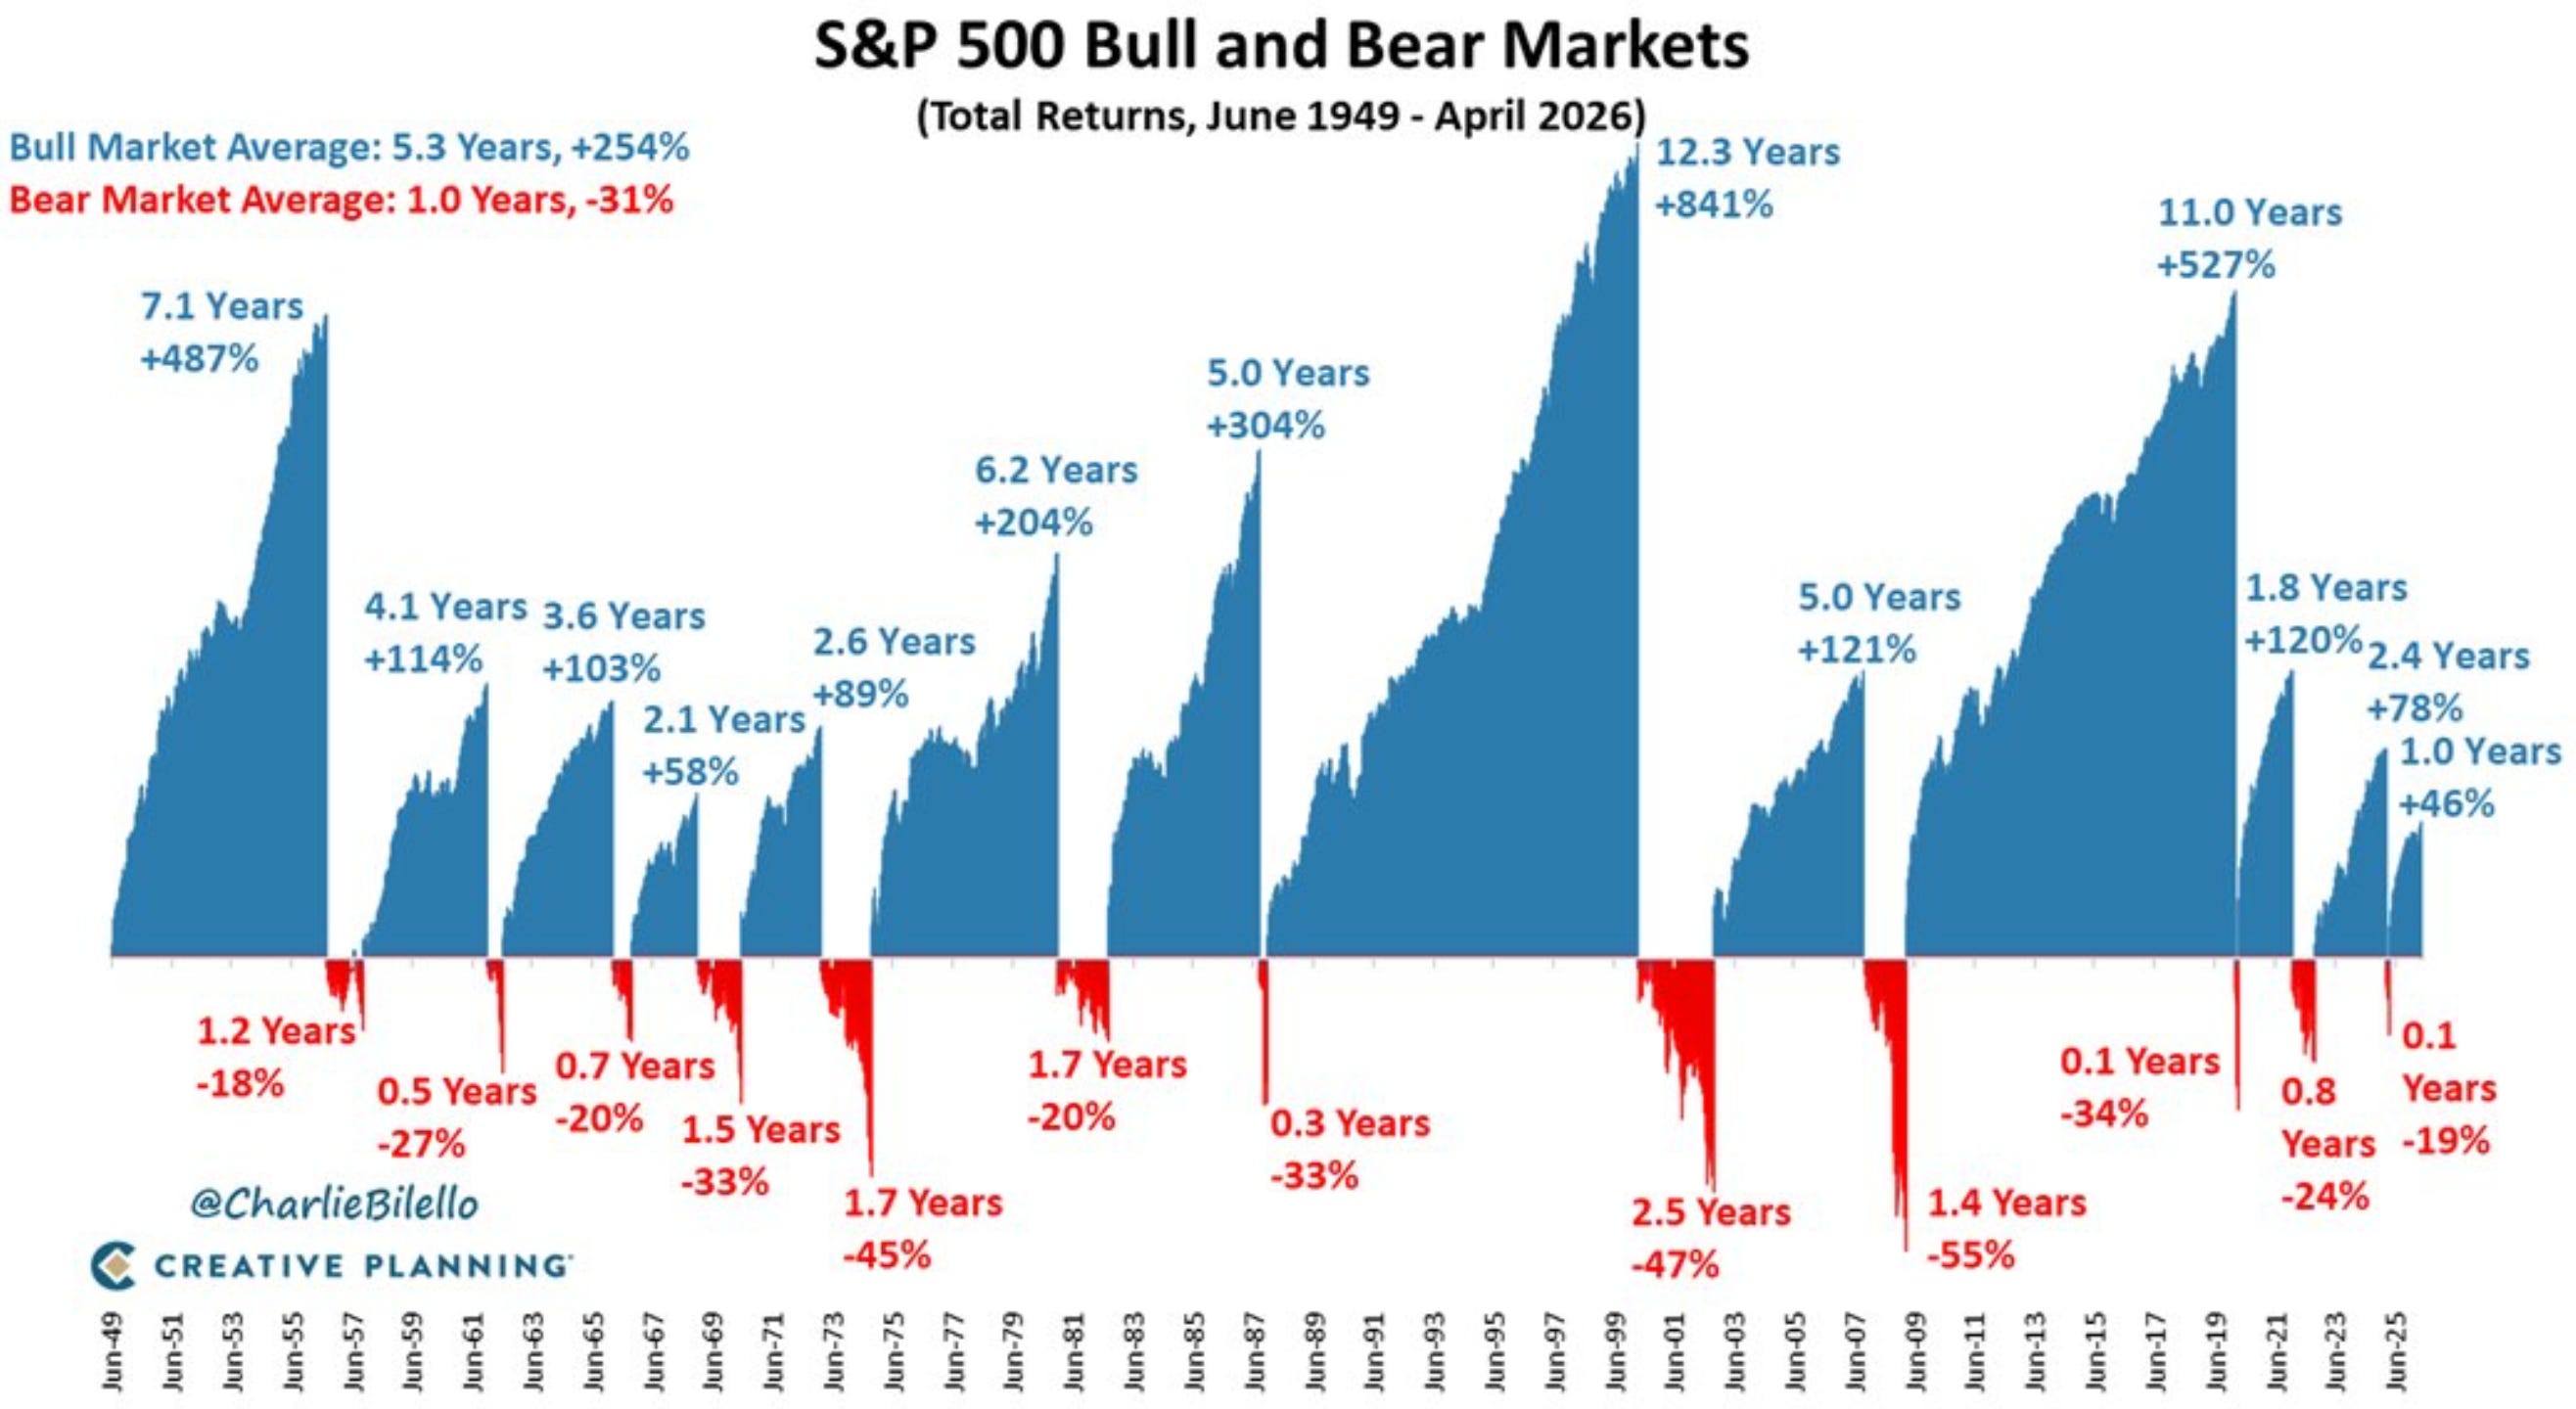
Bear markets have made up roughly 21 of the past 95 years in S&P 500 history. That means that stocks have been in a bull market roughly 78% of the time. Call it 4 years out of every 5. That’s not a coin flip. That’s a deck stacked in your favor, if you can stay invested.
Age is one measure. Magnitude is another.
The S&P 500 is up almost 117% since the bull market began on October 12, 2022. That ranks 5th of the 8 bull markets since 1966.
A 117% gain sounds enormous. And it is. But history says that doesn’t necessarily mean the bull market is running on borrowed time.
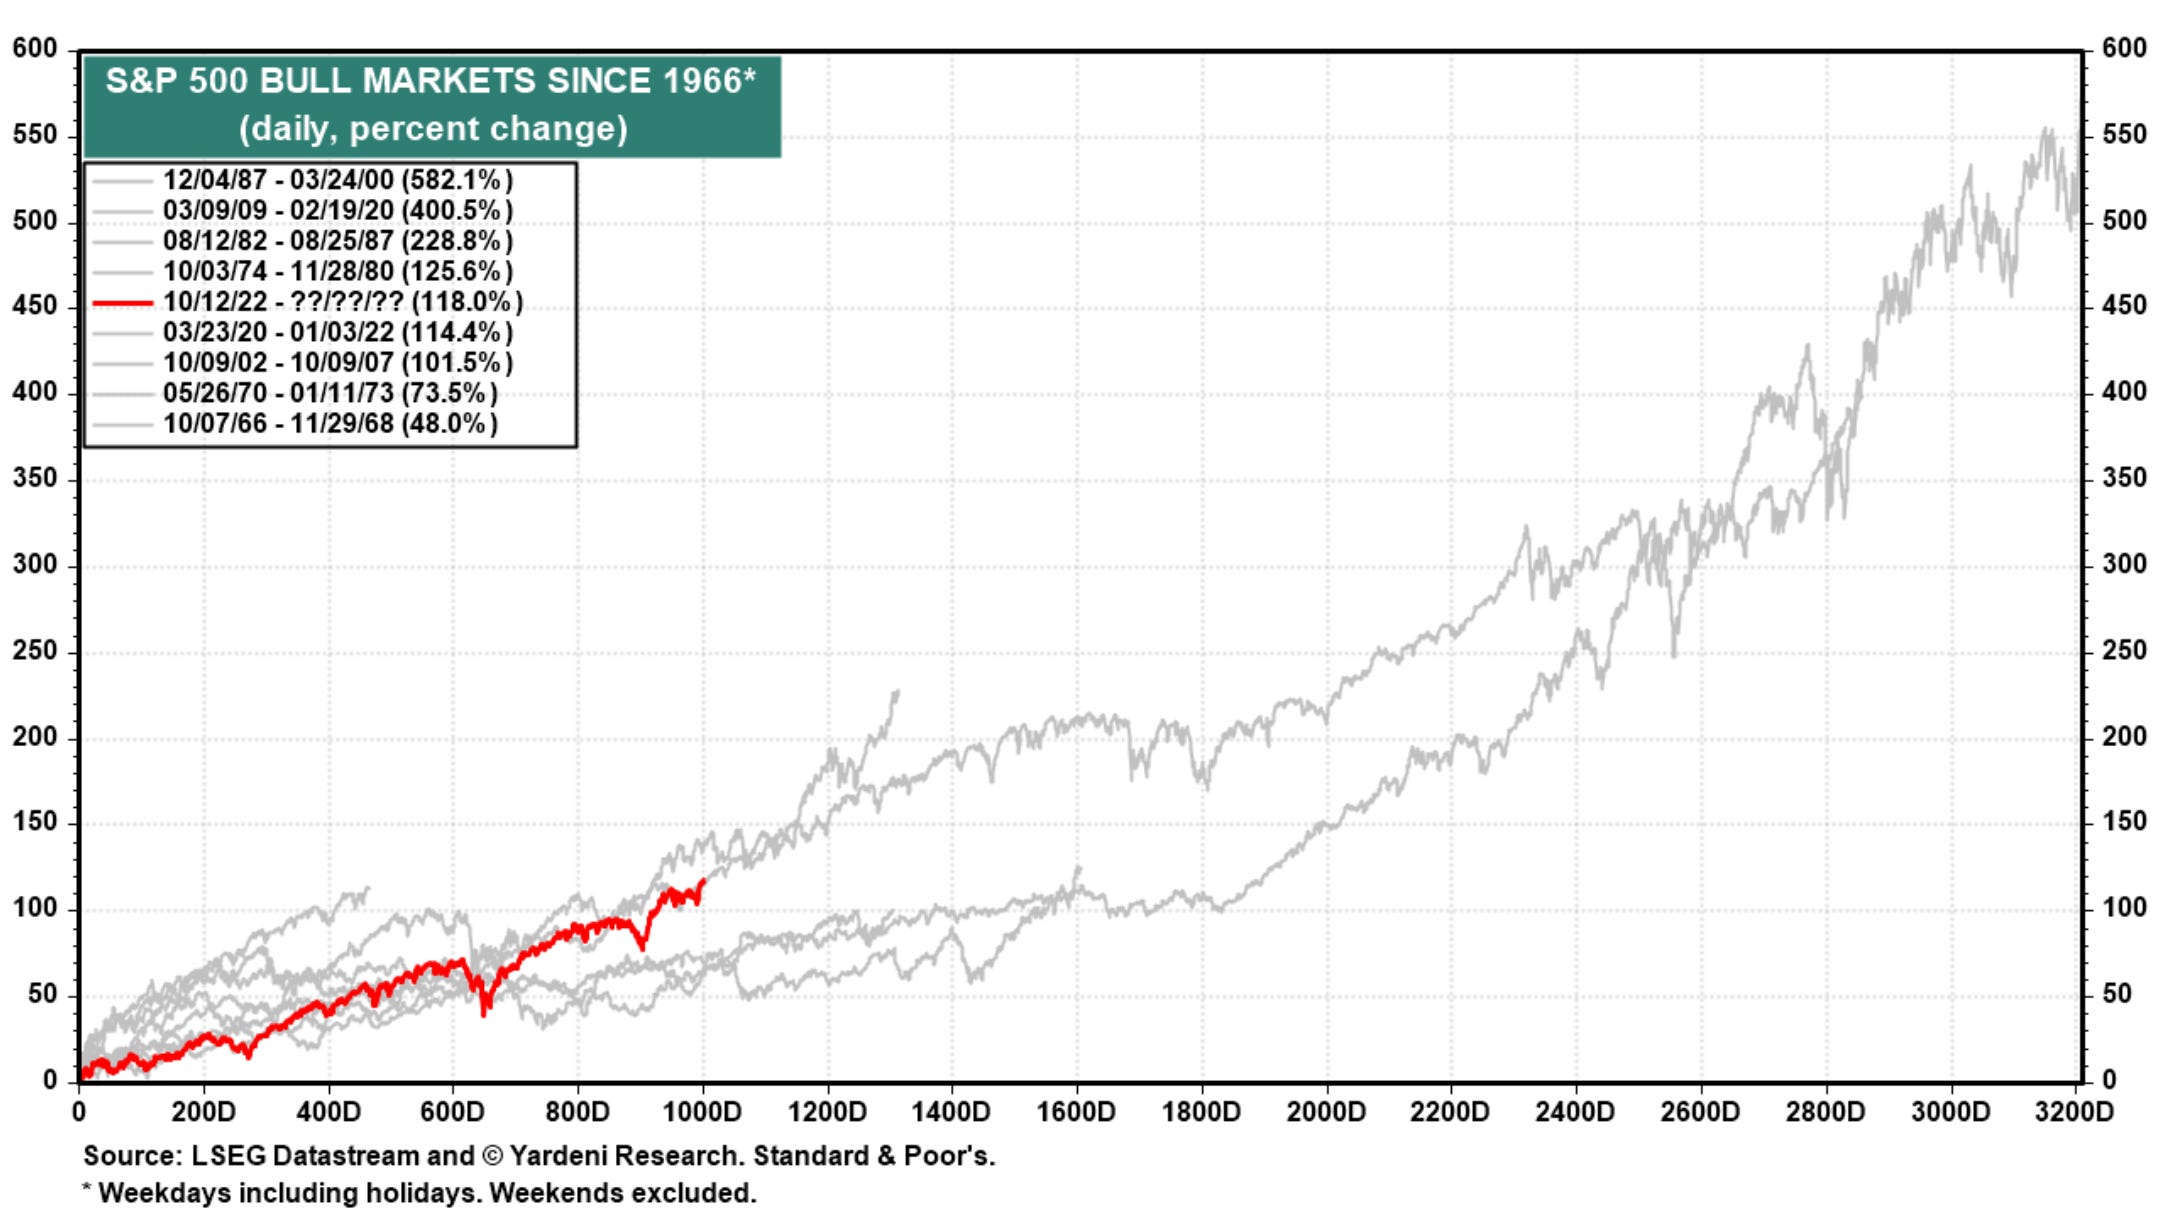
The chart above covers every individual bull market run. If we zoom out a bit father, it gets more interesting.
This chart shows the length and magnitude of bull and bear markets.
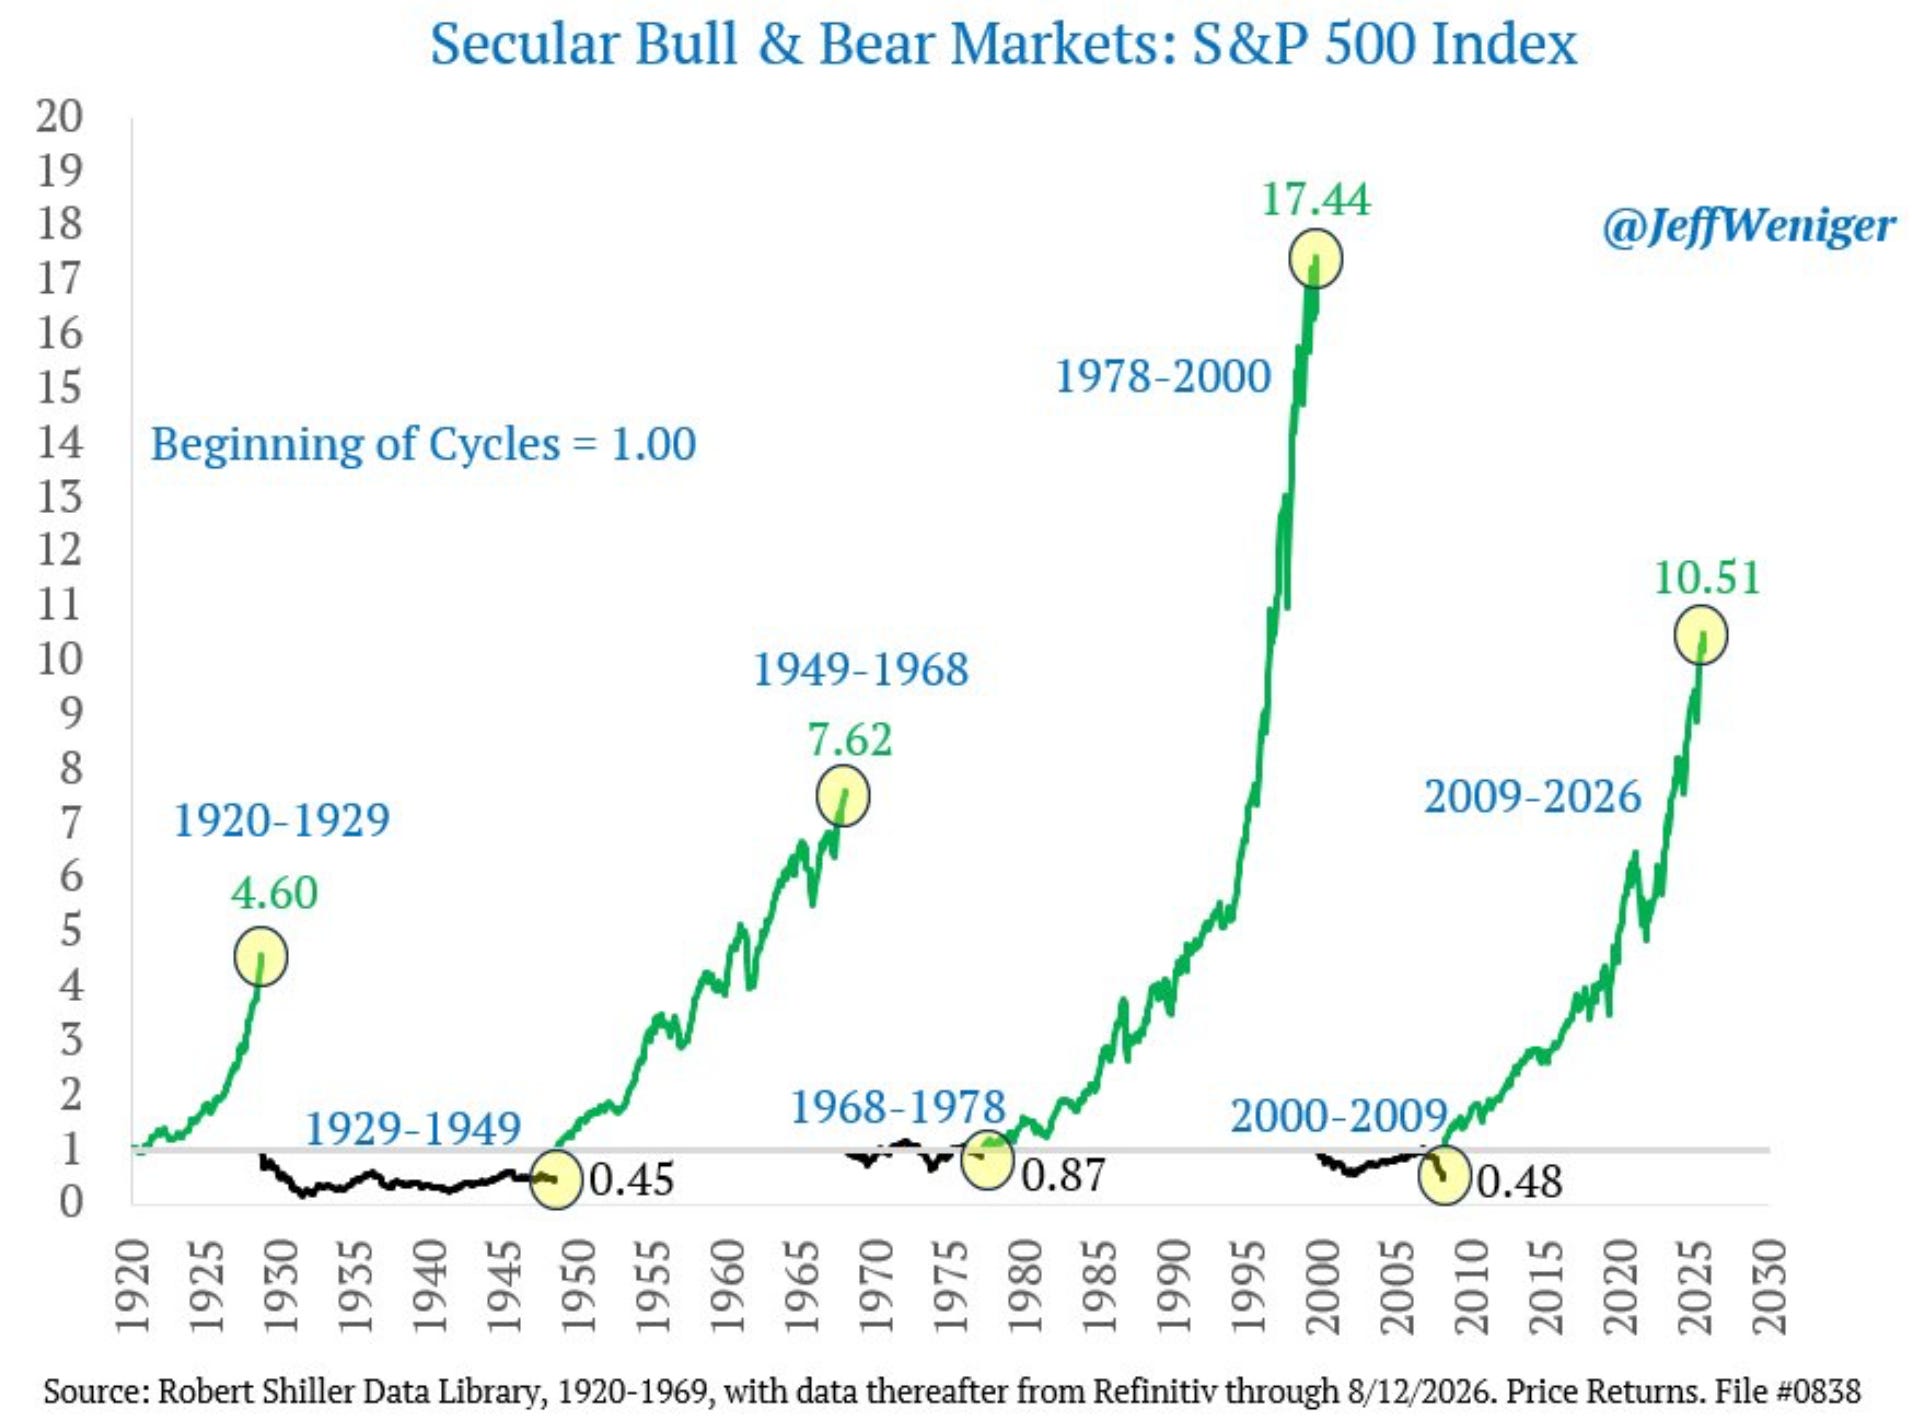
We’re not just in a cyclical bull market. We’re also in a secular bull market that began back in 2009. That’s 17 years and still counting.
Even at 17 years this secular bull market is only up 10.51x from where it started. The last one 1978 to 2000 ran to 17.44x before it topped.
We know that this doesn’t mean smooth sailing. That doesn’t exist in investing. Corrections will always happen.
Just don’t mistake new all-time highs as warning signs. Being bullish in a bull market doesn’t label you as a permanent bull. It just means that you know history.
So then what actually stops a bull market?
Not age.
Not S&P 7,800.
Not S&P 8,000.
Not even a 100% gain.
Something more important does.
I’ll go over that next Wednesday.
Thank you for reading! If you enjoyed Spilled Coffee, please subscribe.
Spilled Coffee grows through word of mouth. Please consider sharing this post with someone who might appreciate it.