
Concerns Brewing?
Worrisome data emerges
There has been an overwhelming amount of data that I feel needs to be shared and discussed.
It’s not about being bearish or bullish. It’s not about trying to find the scariest charts and data. Nor is about finding charts that only show positive and bullish data. It’s about looking at the all the data so we can make the most educated and informed decisions.
Right now there is more data that has come up that’s worrisome to me and I wanted to discuss it. I’ve also done similar when there is so much positive and bullish data in the past.
These aren’t unprecedented times or anything out of the ordinary. It’s normal. Nothing is signaling a crash or a black swan event. Things are always changing and nothing is ever a straight line. Things can change quickly in every which direction. We must remember that.
Here is what’s catching my eye. Let’s dig in.
We start with what’s happening with housing. Right now housing just isn’t working.
It all starts with where mortgage rates are at. The 30-year mortgage rate just hit 7.64%. That’s the highest level since May.
Take a look at this chart of the 30-year mortgage but notice what has happened to rates since the Fed started to cut.
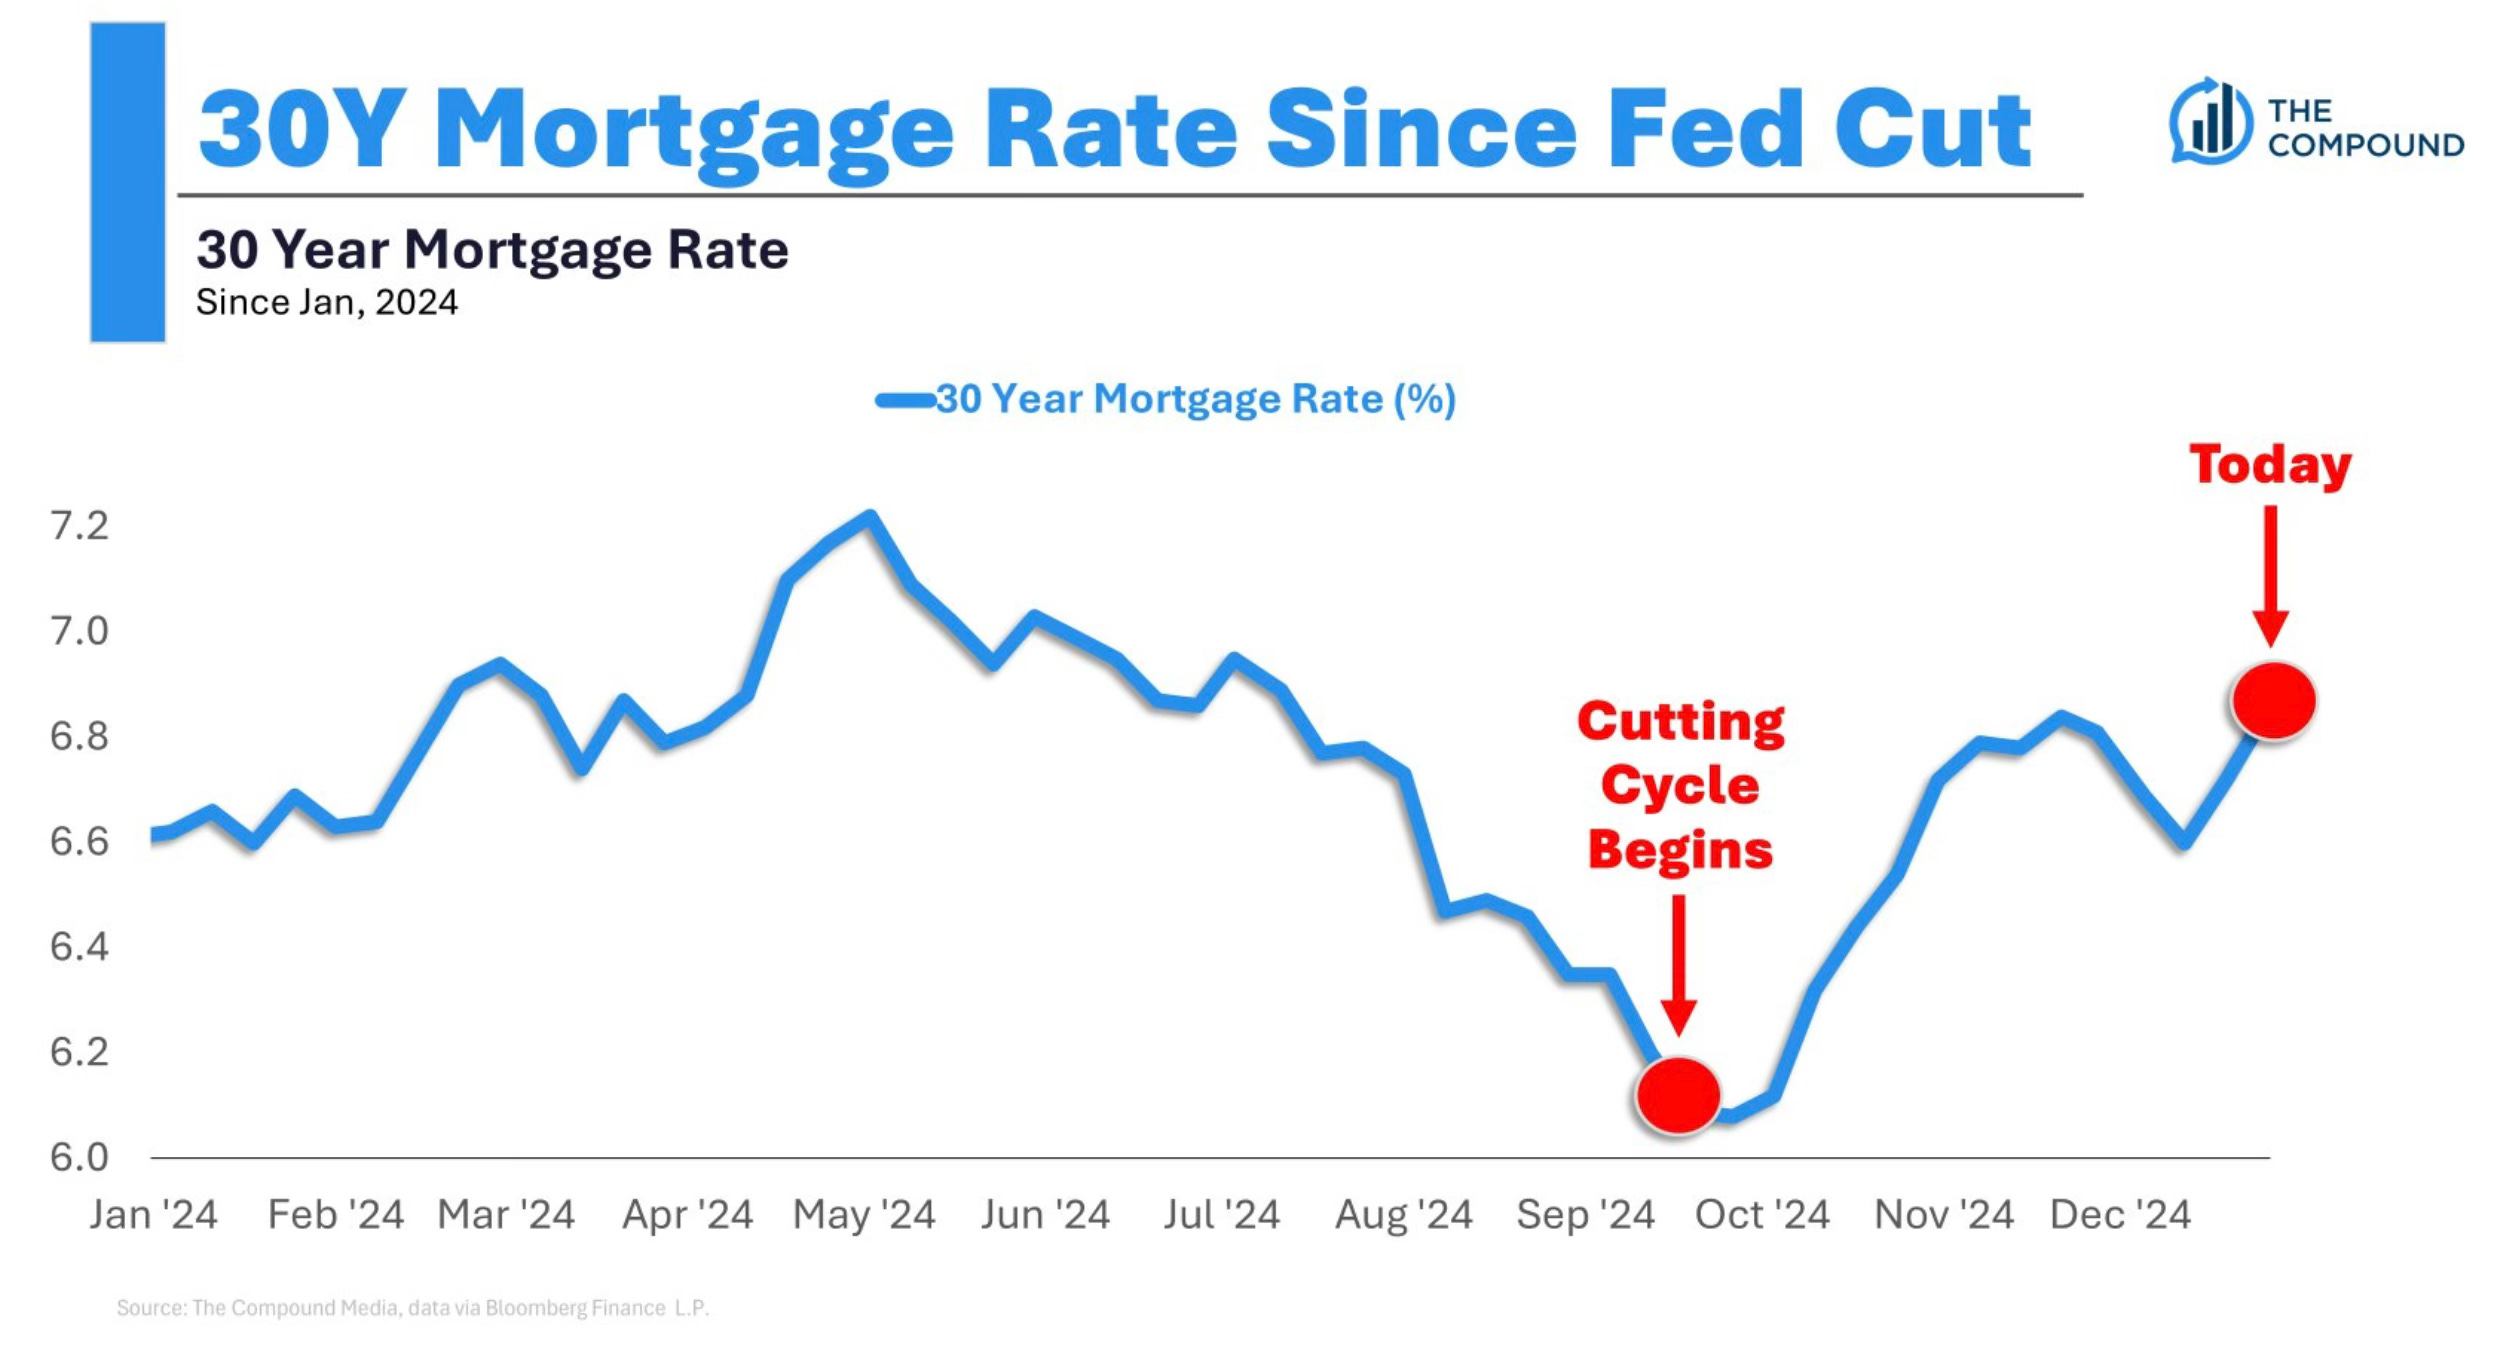
This has essentially turned off mortgage demand. Last week saw single-family home applications fall for the 4th consecutive week. U.S mortgage demand is at the lowest since 2011.
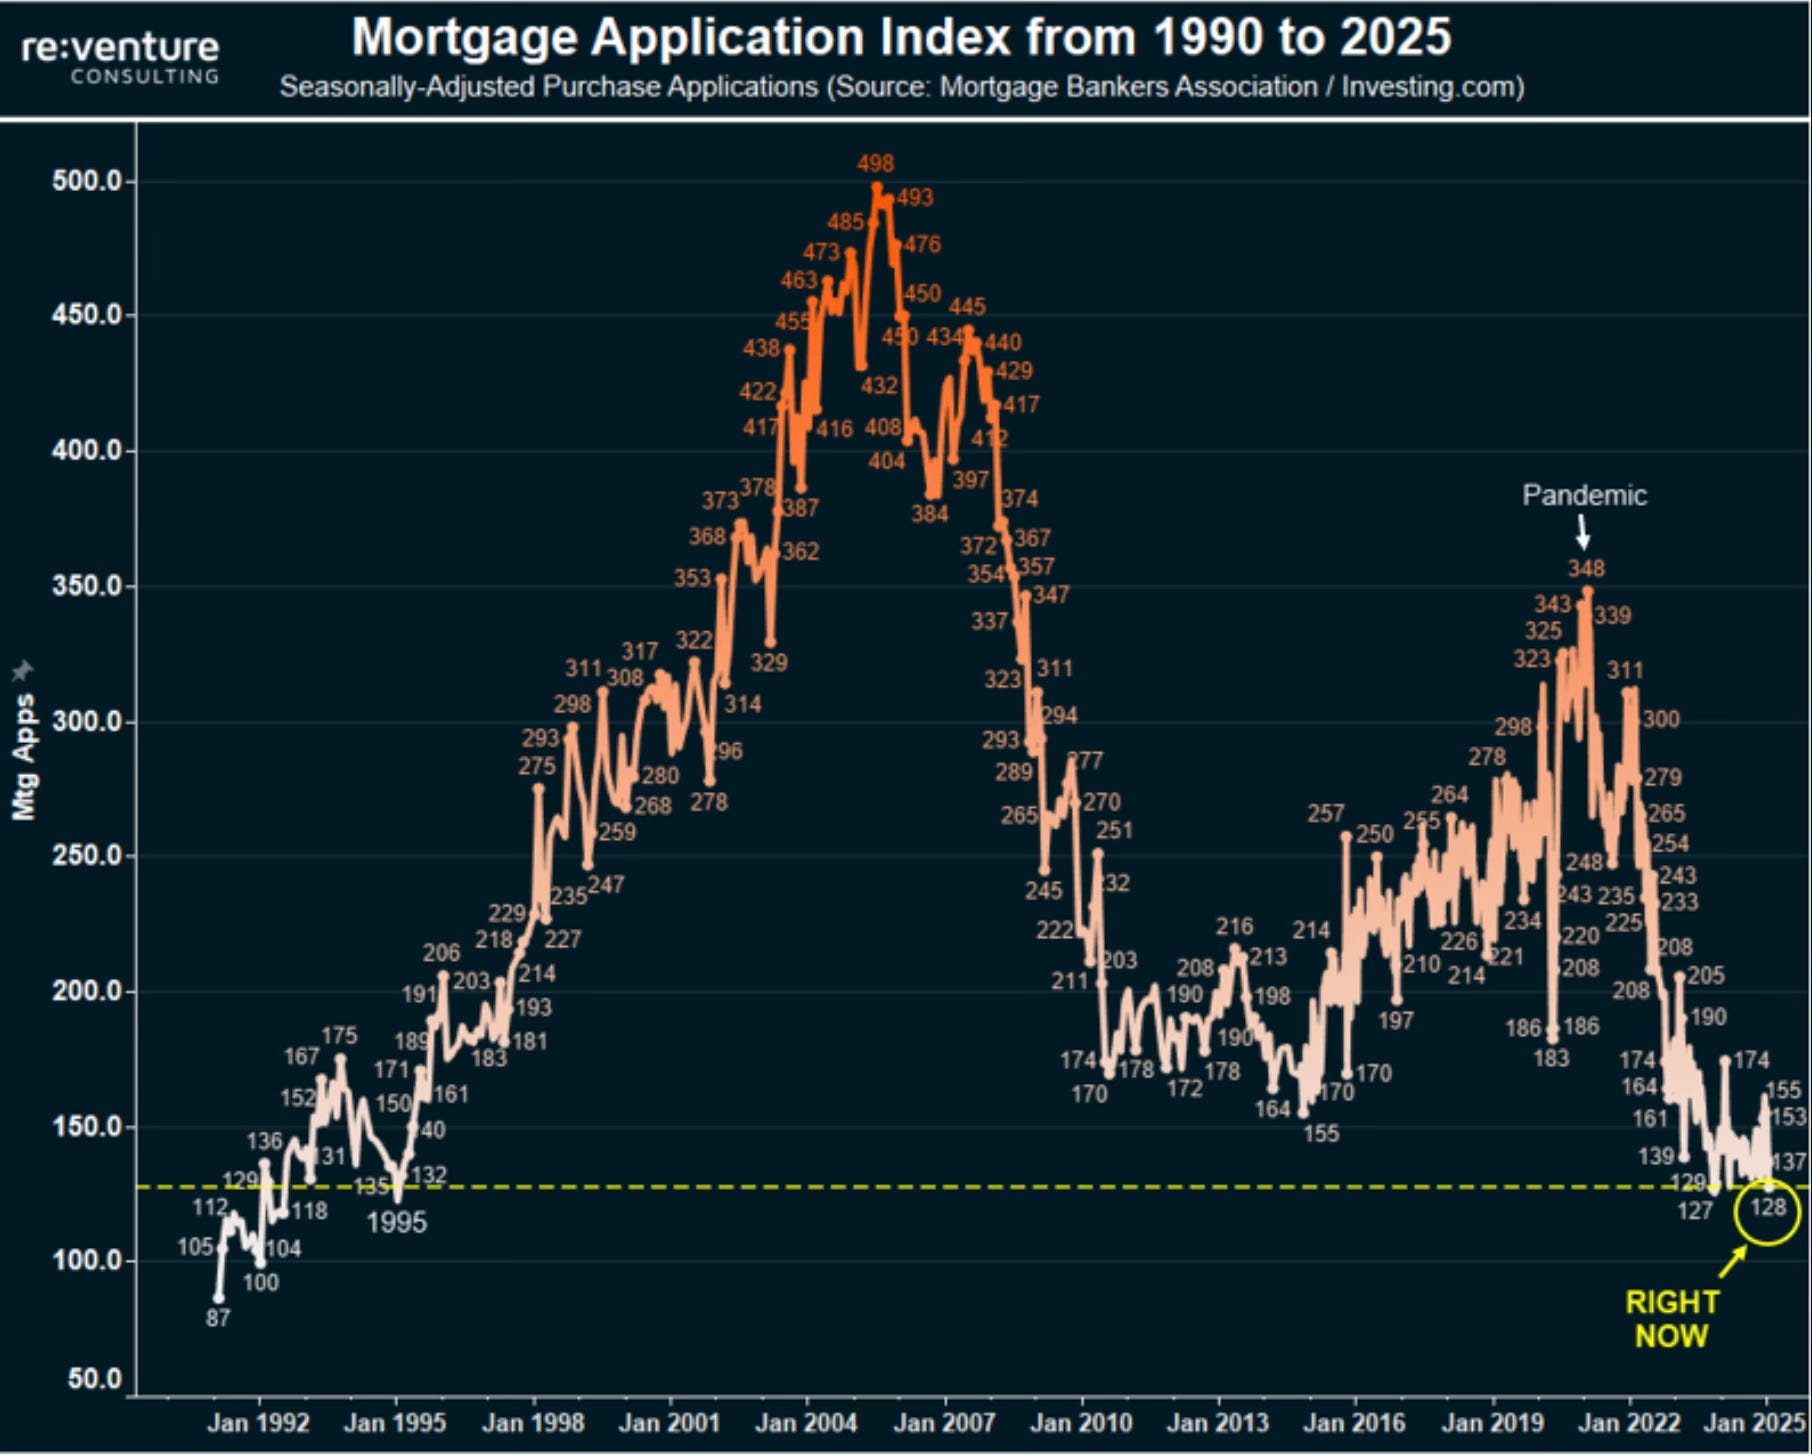
The mortgage demand index has now fallen to the lowest since February 2004. That’s the 3rd lowest level in the past 30 years.
If 7% mortgage rates are going to be the new normal, it’s very hard to see housing working in that environment.
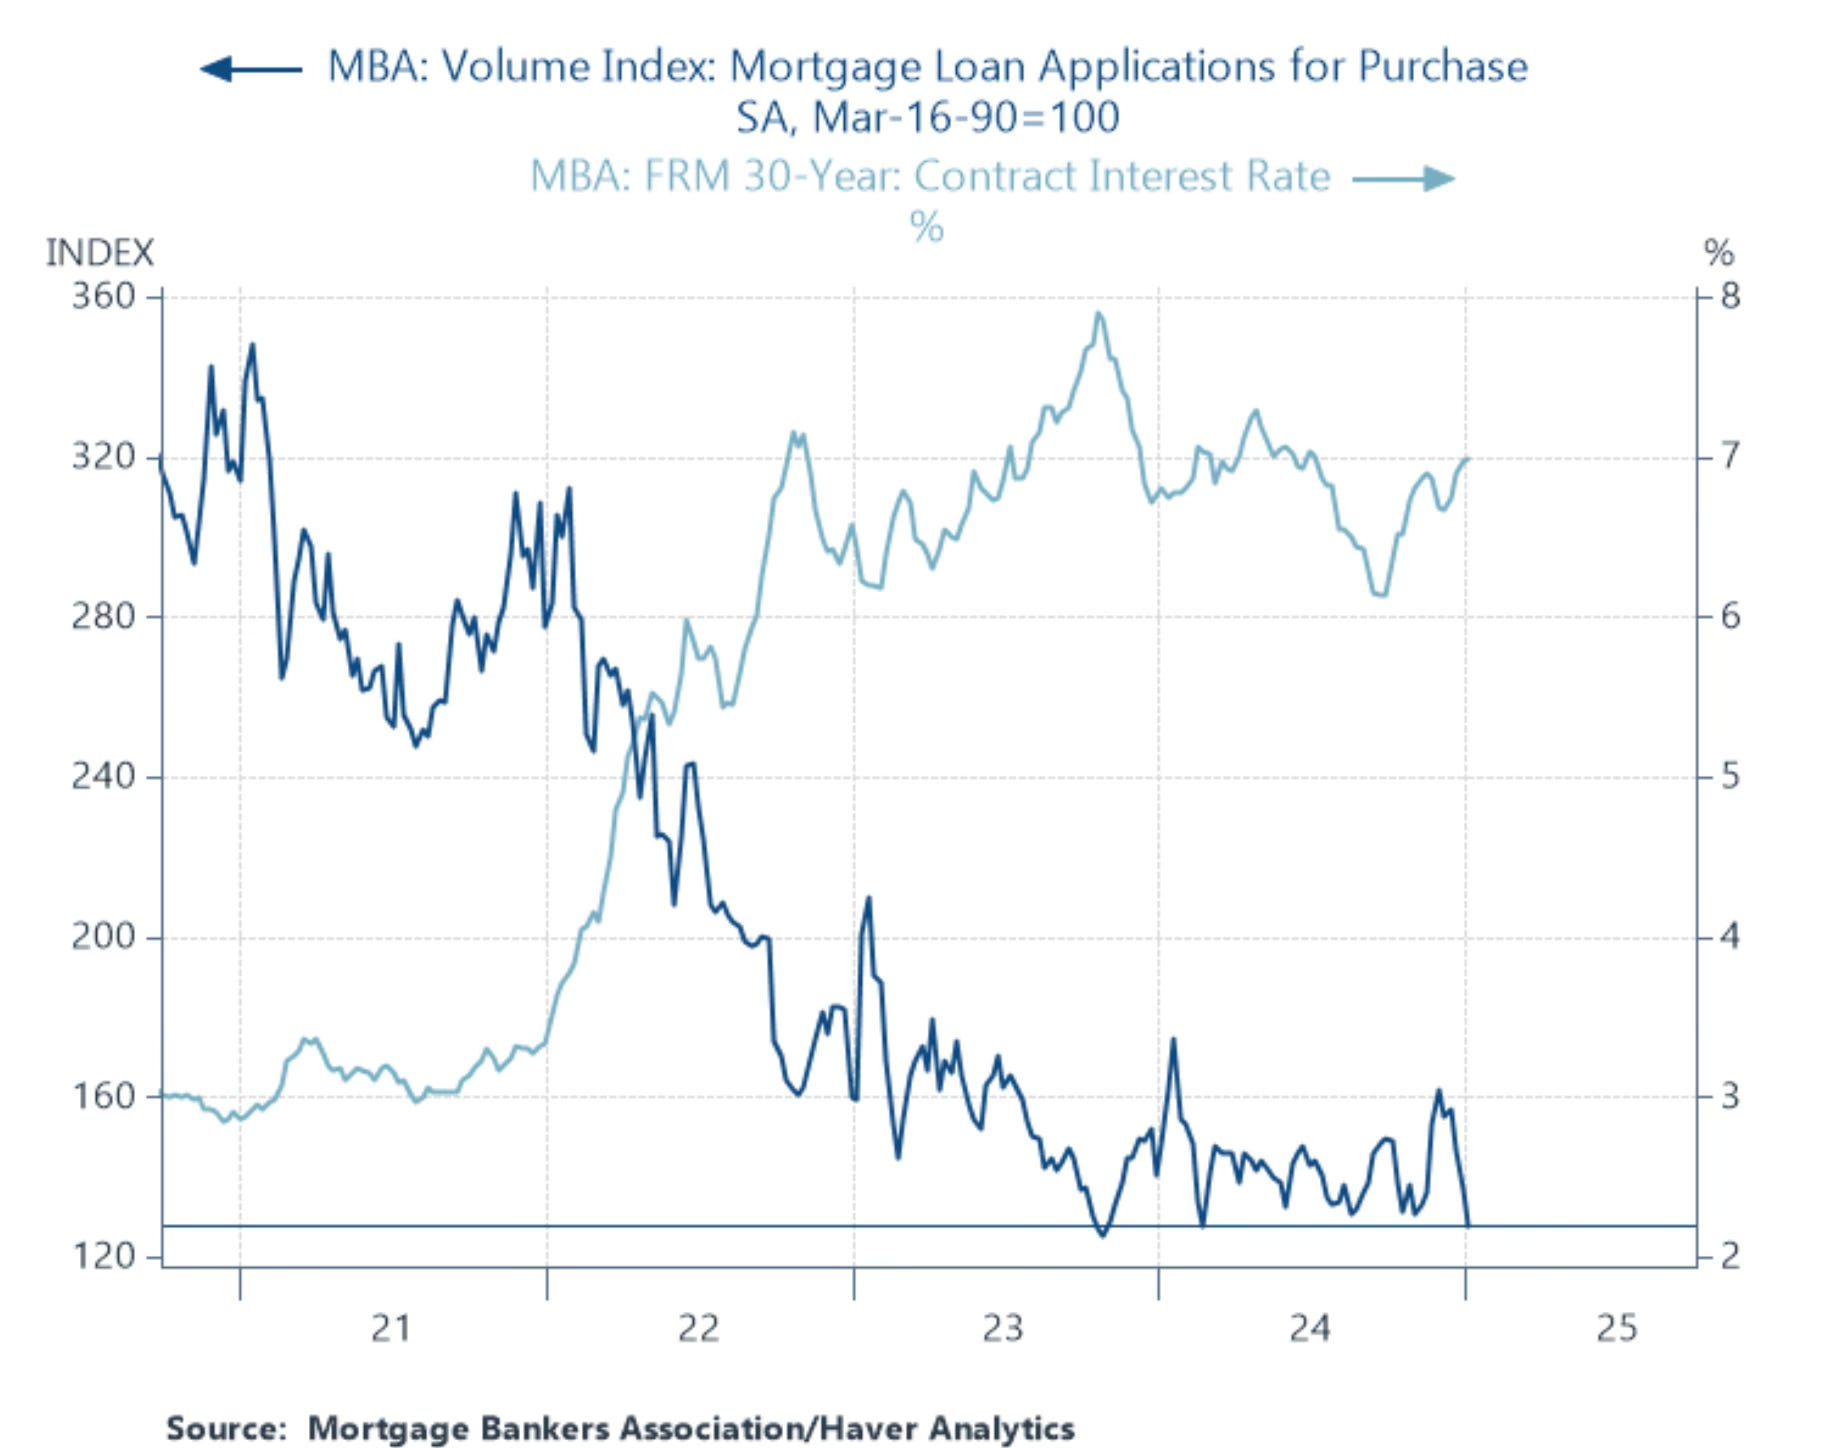
This chart shows just what has happened to mortgage loan applications since mortgage rates have started to rise.
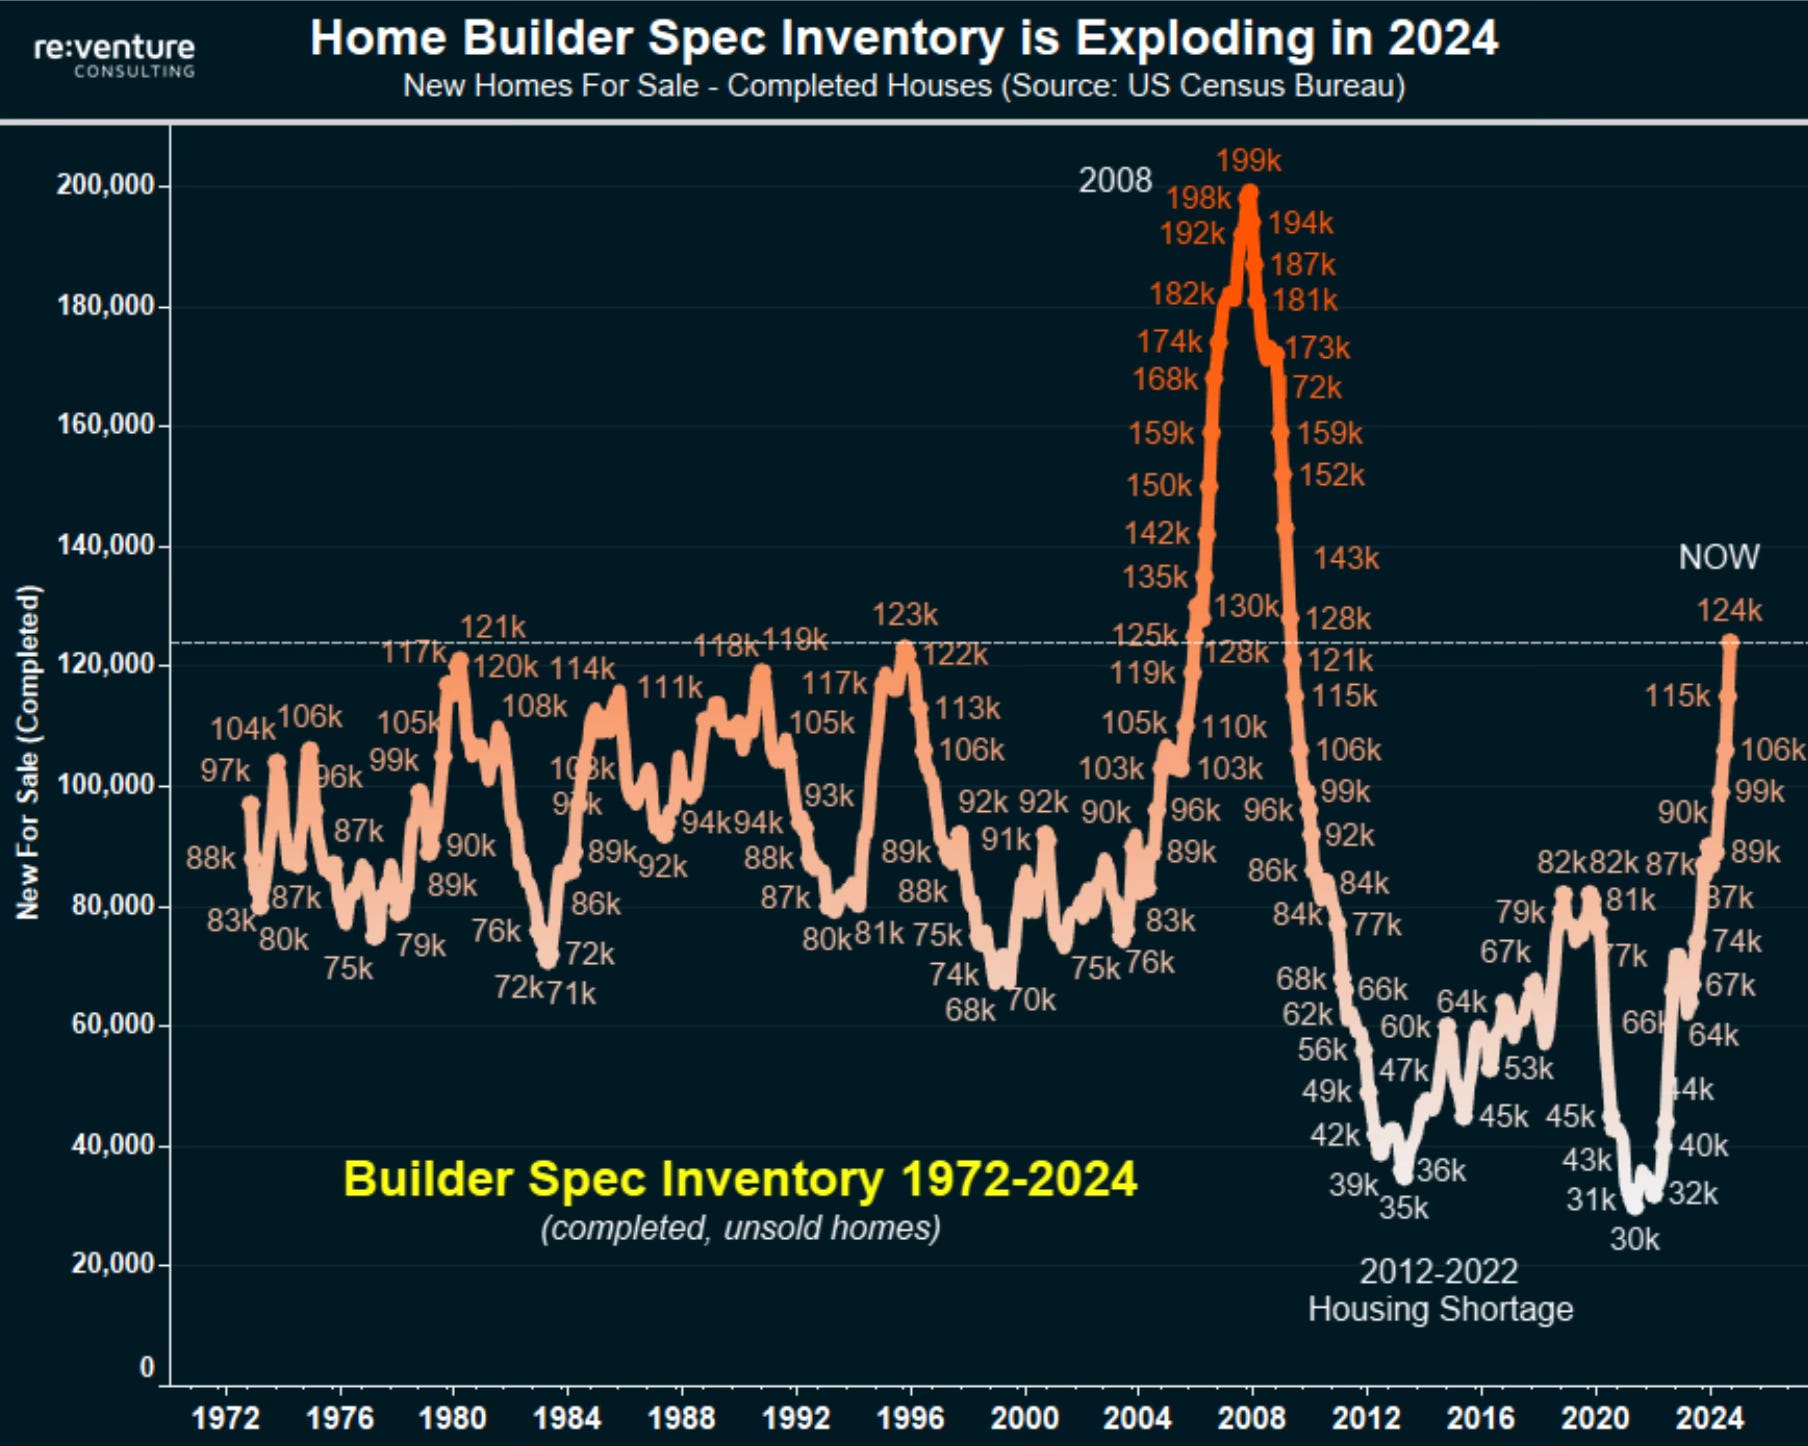
You can guess what this has done to home construction.
Home builder spec inventory, which are homes that get built without a buyer ready to buy it are at the 2nd highest level going back to 1972. Only the 2008 housing bubble had a higher inventory than today.
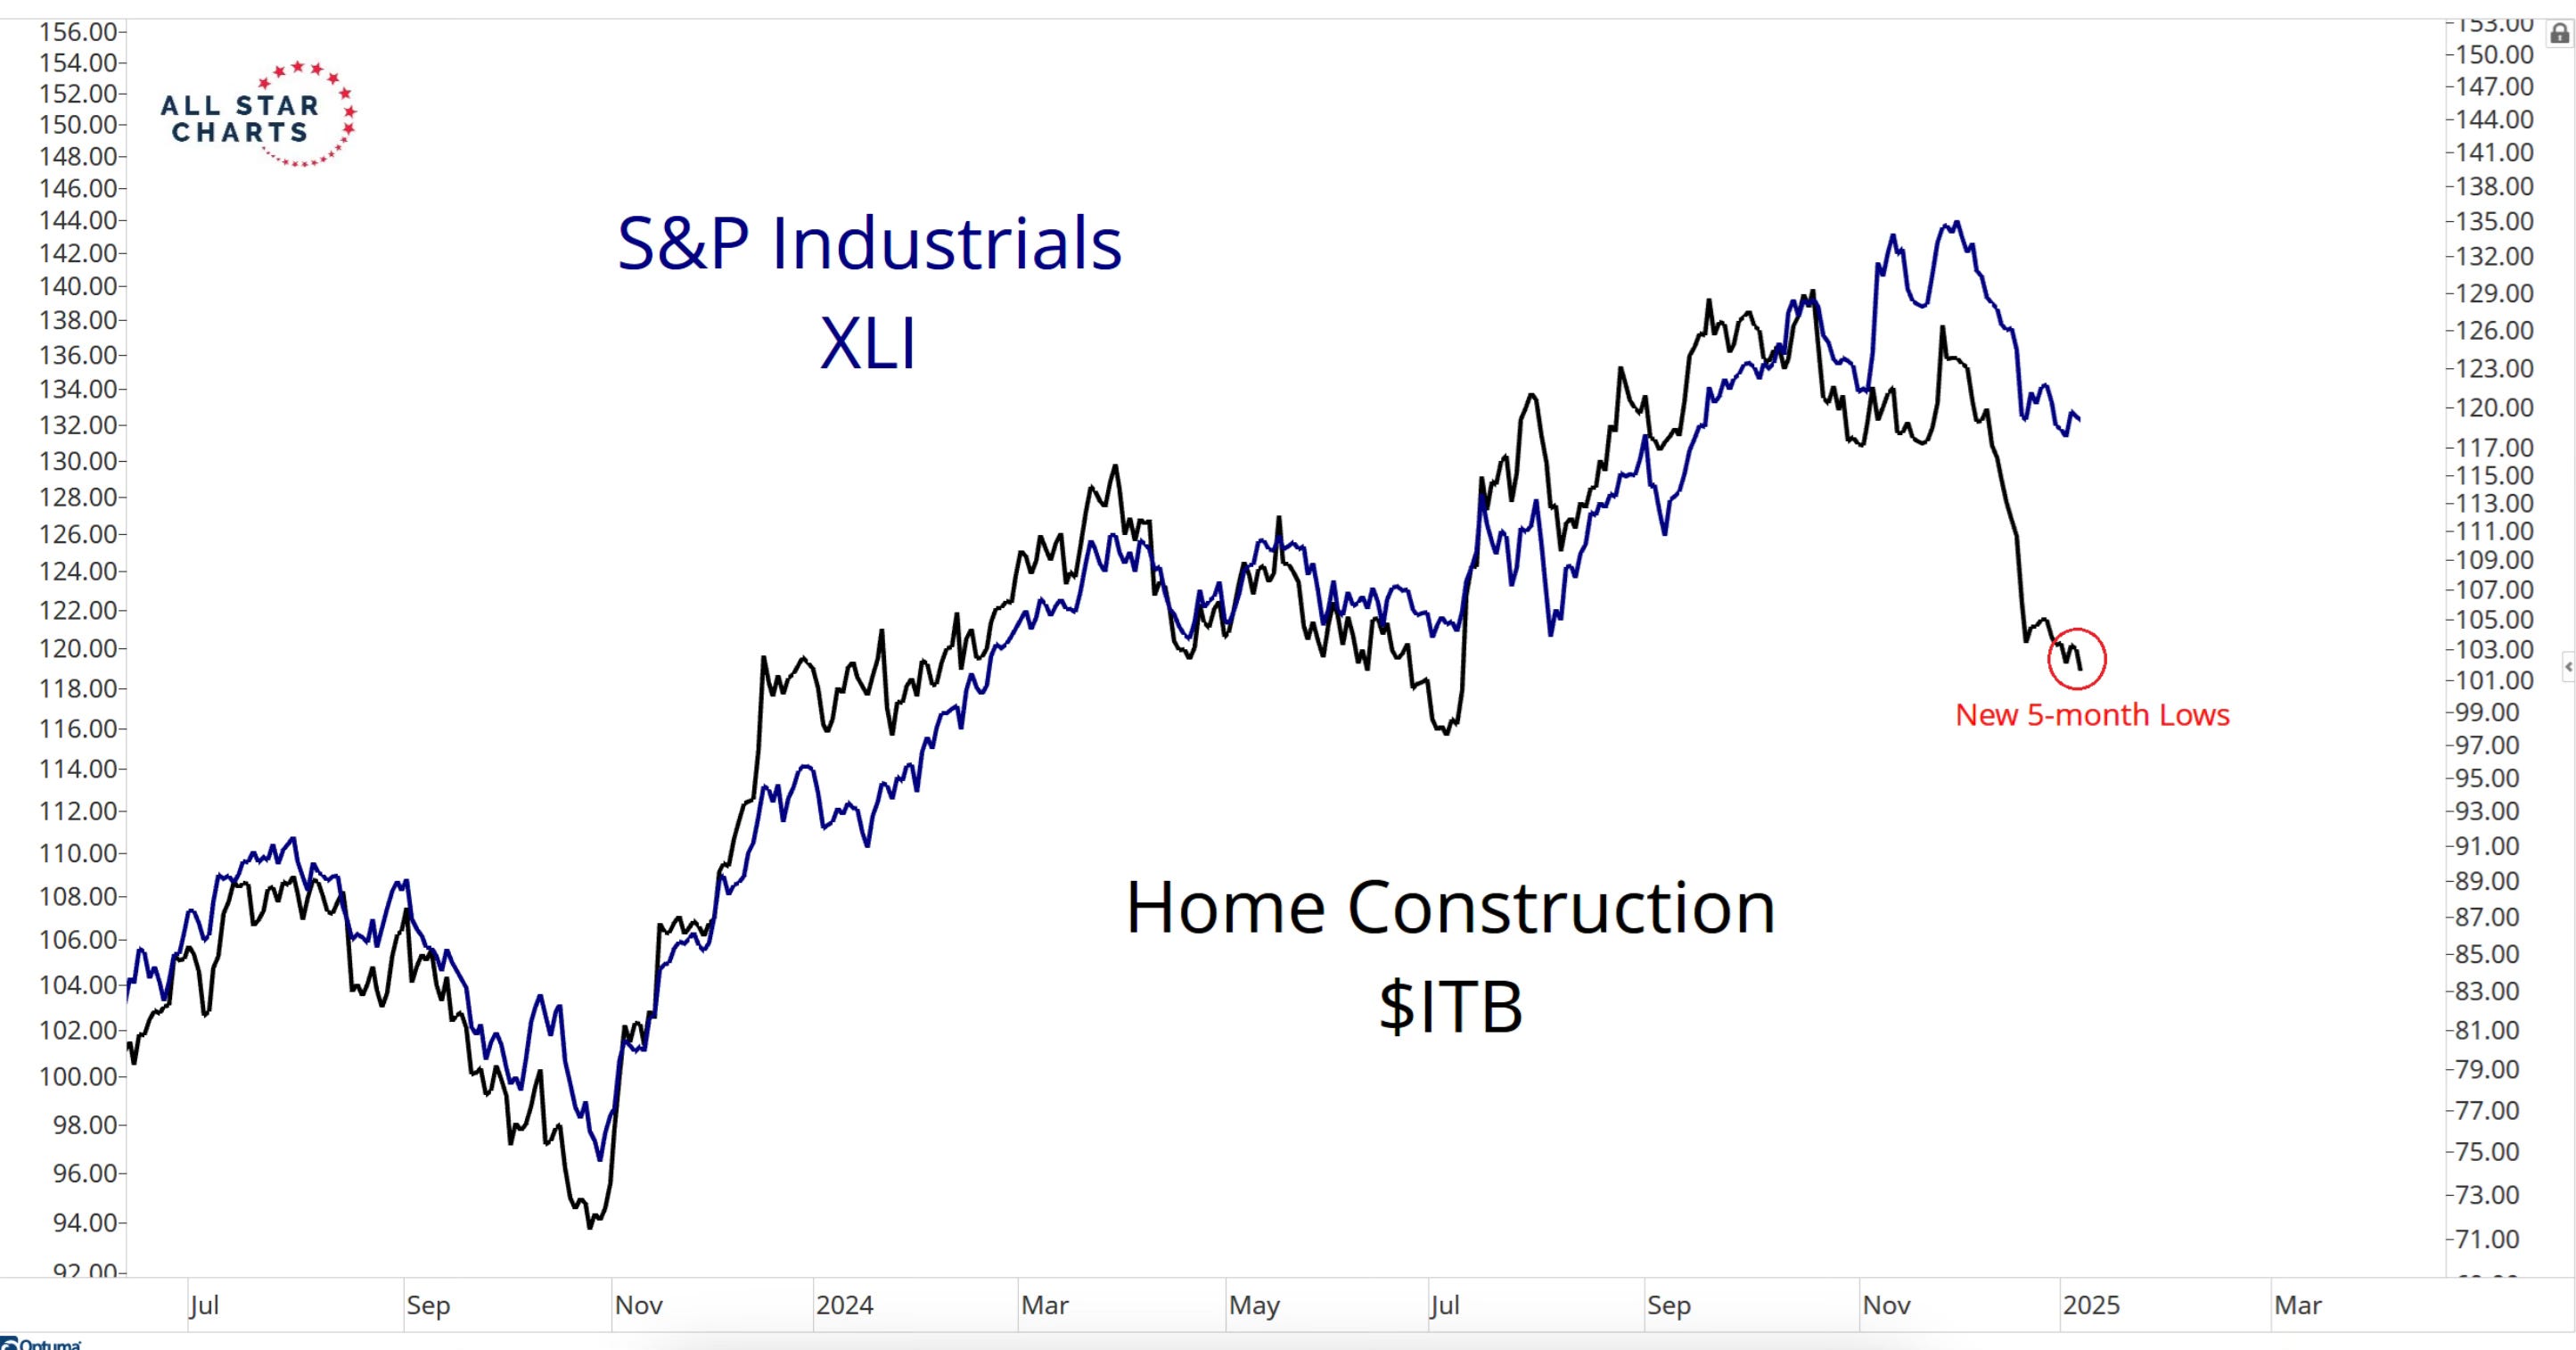
Home construction stocks (ITB - iShares US Home Construction ETF) is now at a 5 month low. This is an important industry reading that I watch as it’s important to the overall health of the economy and stock market.
J.C. Parets does a great job showing just how closely industrials (XLI - Industrial Select Sector SPDR Fund) another very important industry and home construction have been so closely correlated.
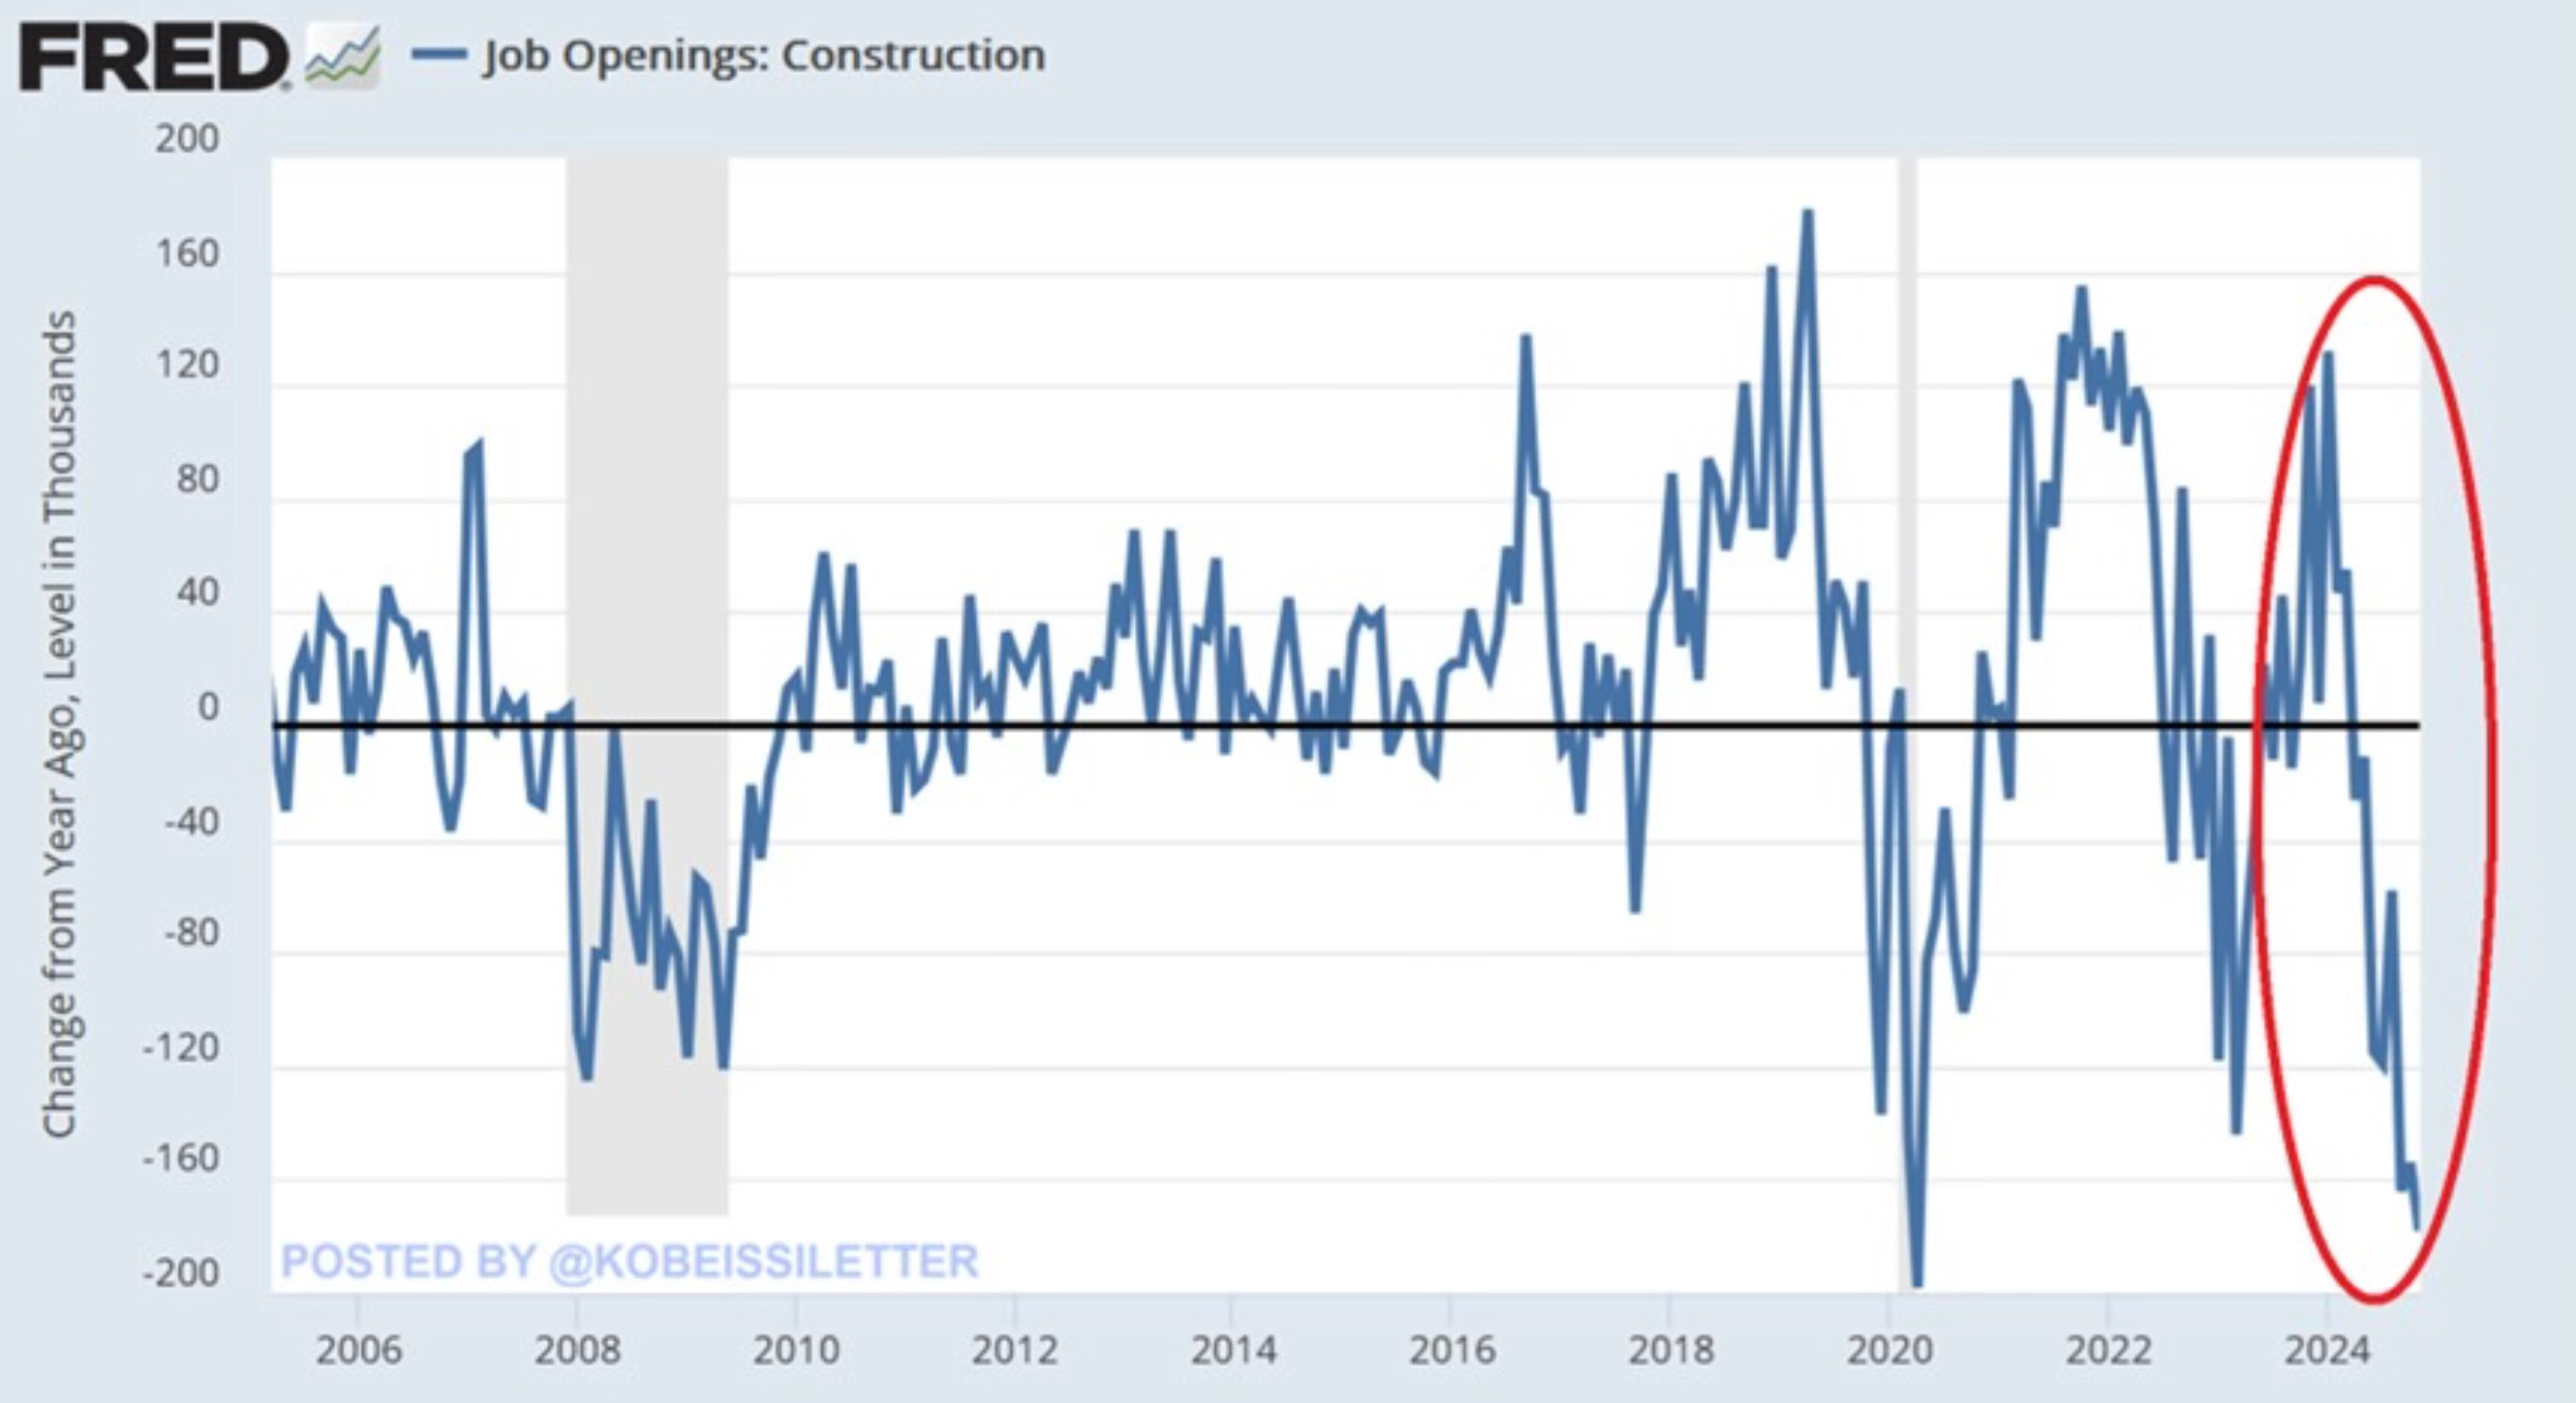
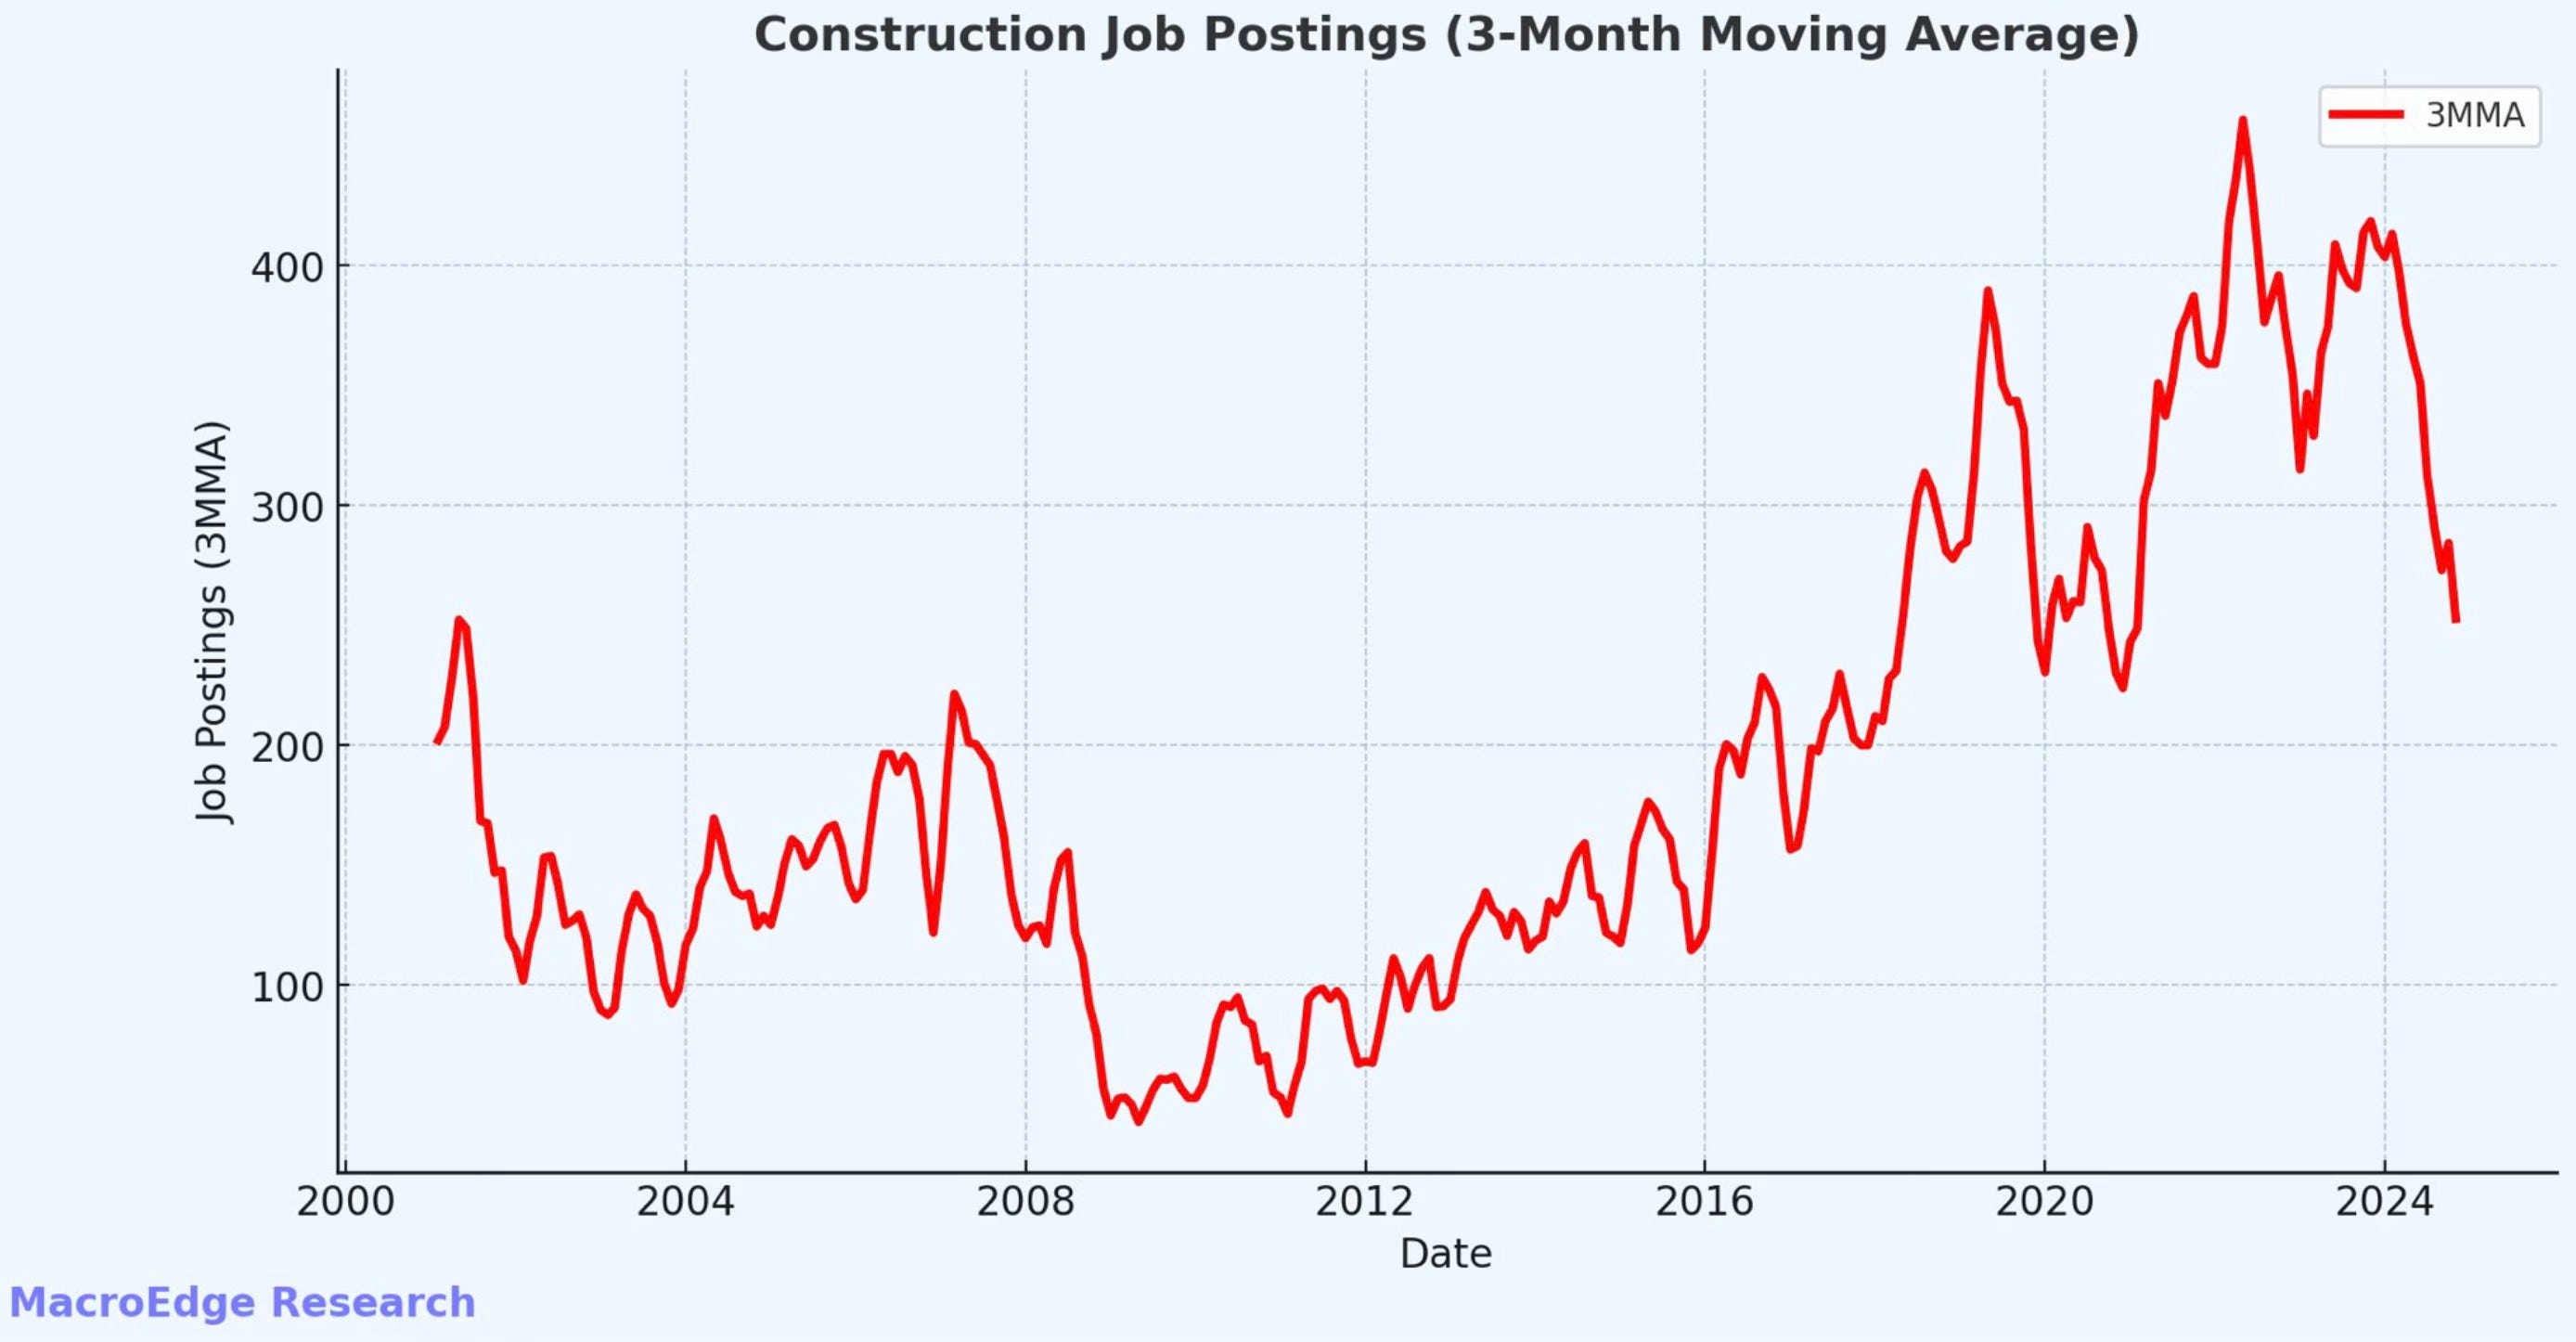
You now exactly where this is then leading for construction sector jobs. This real estate slowdown is now reflected in these two charts that show construction job openings and postings. They’re about back to 2020 levels.
Next let’s take a look at some worrying signs around the stock market, inflation and the labor market.