
Every week I get sent charts. A lot of them lately. Readers forward me something they saw on social media or in a research note and ask what I think.
Lately the pile has been leaning one direction. Bearish.
I started saving them. Not because I’ve flipped. Regular readers know where I stand. I’ve had a 7,900 S&P target on the board all year and I’m still holding my Mag 7 names. But a chart shows up in my inbox often enough and it earns a second look.
So here they are. All in one place. No spin, no cherry picking to make a point. Just the data that’s been landing in my inbox, organized so you can see it the way I’ve been seeing it.
Let’s start with the one that got the most attention.
The Money Is Changing Hands
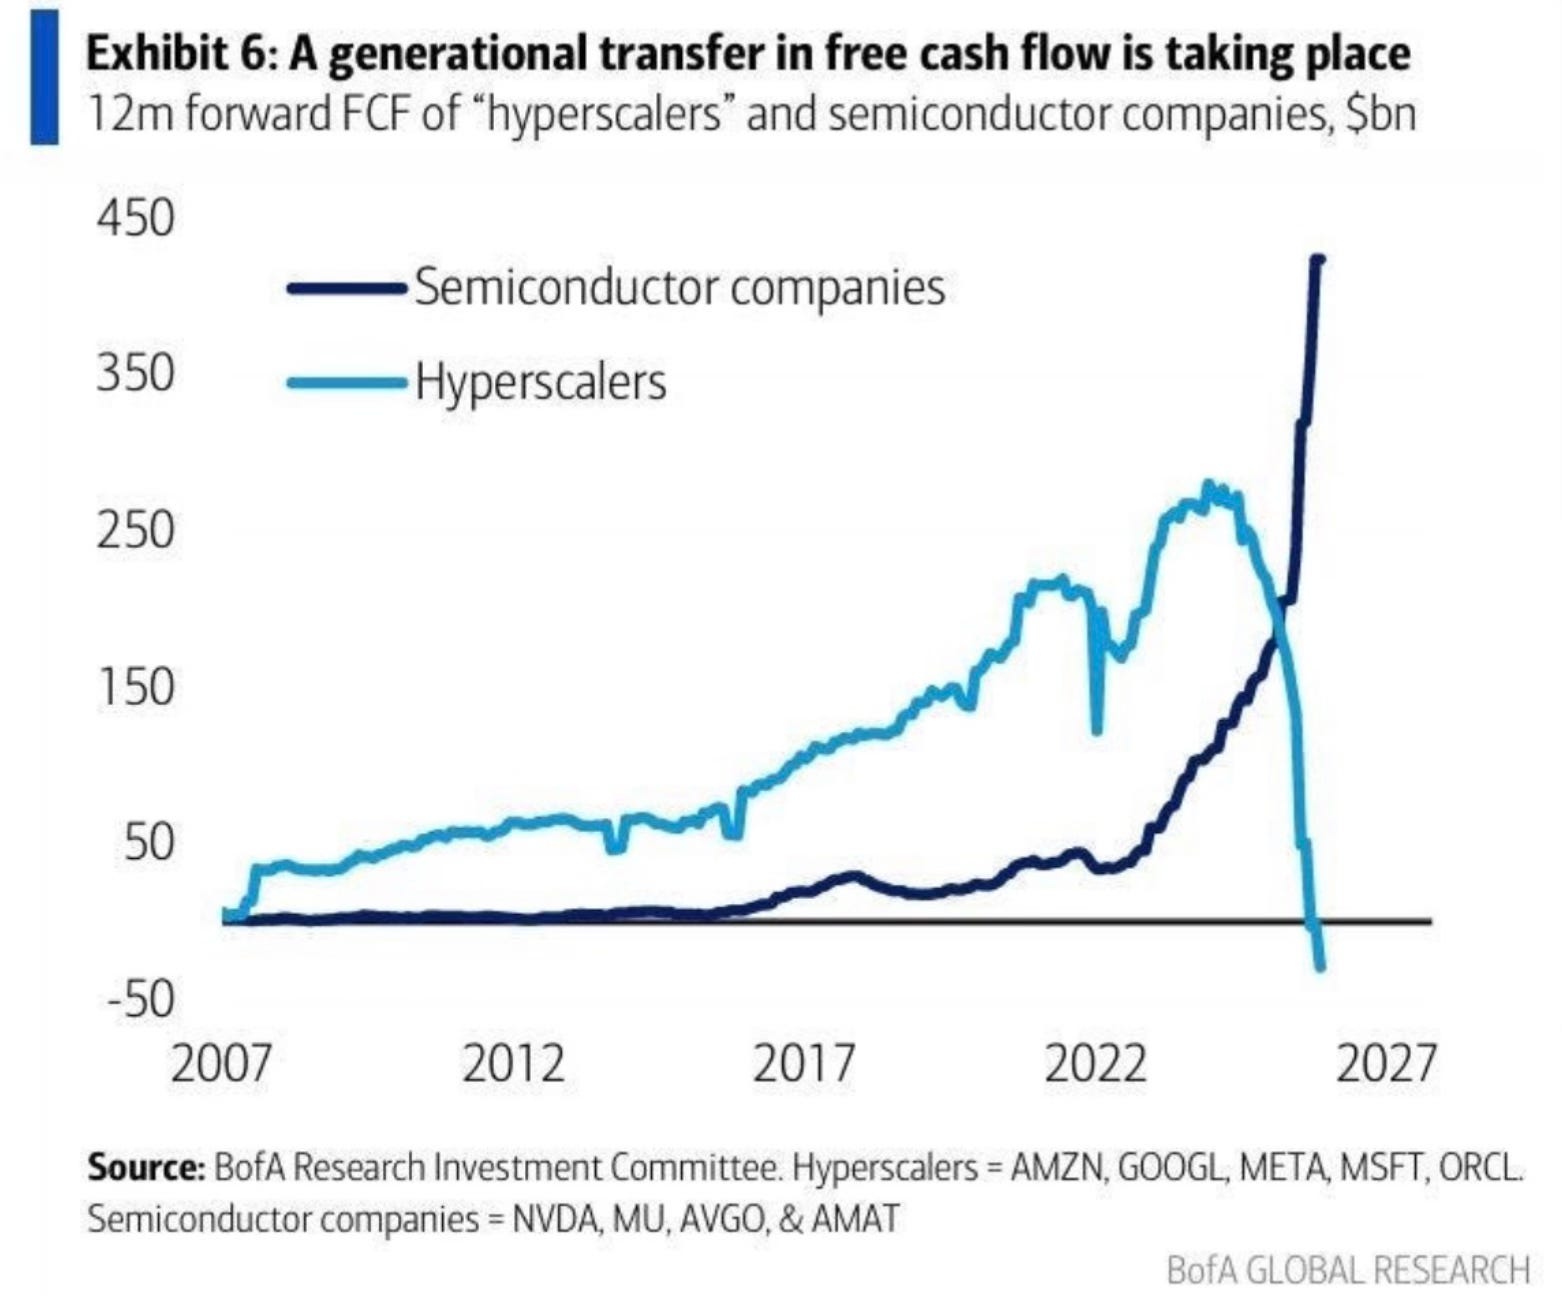
The chipmakers building the AI boom and the companies paying for it are heading in opposite directions on the one number that matters most. Cash.
Nvidia, Micron, Broadcom, and Applied Materials are on pace for a combined $430 billion in free cash flow over the next year. That’s more than triple what they generated two years ago.
Meanwhile Amazon, Alphabet, Meta, Microsoft, and Oracle are about to see their combined free cash flow go negative. First time that’s ever happened. Two years ago these same five companies were throwing off $260 billion.
The chipmakers are getting paid. The hyperscalers are the ones paying, and it’s showing up on their books.
Most of that hyperscaler spending is going right back to each other. Buying compute, leasing data centers, funding partnerships. It’s a lot of capital moving in a circle. That works great as long as the demand on the other end shows up. If it slows even a little, a lot of balance sheets get exposed at the same time.
And that spending isn’t a side story anymore. It’s holding up the whole economy.
AI investment, meaning software, data centers, R&D, and equipment, is now responsible for more than a quarter of US GDP growth. That’s the biggest share on record. For every four dollars the economy grows, better than a dollar of that is AI capex.
AI spending itself is running near 8% of GDP. During the Dot Com bubble, tech spending topped out around 6.5%.
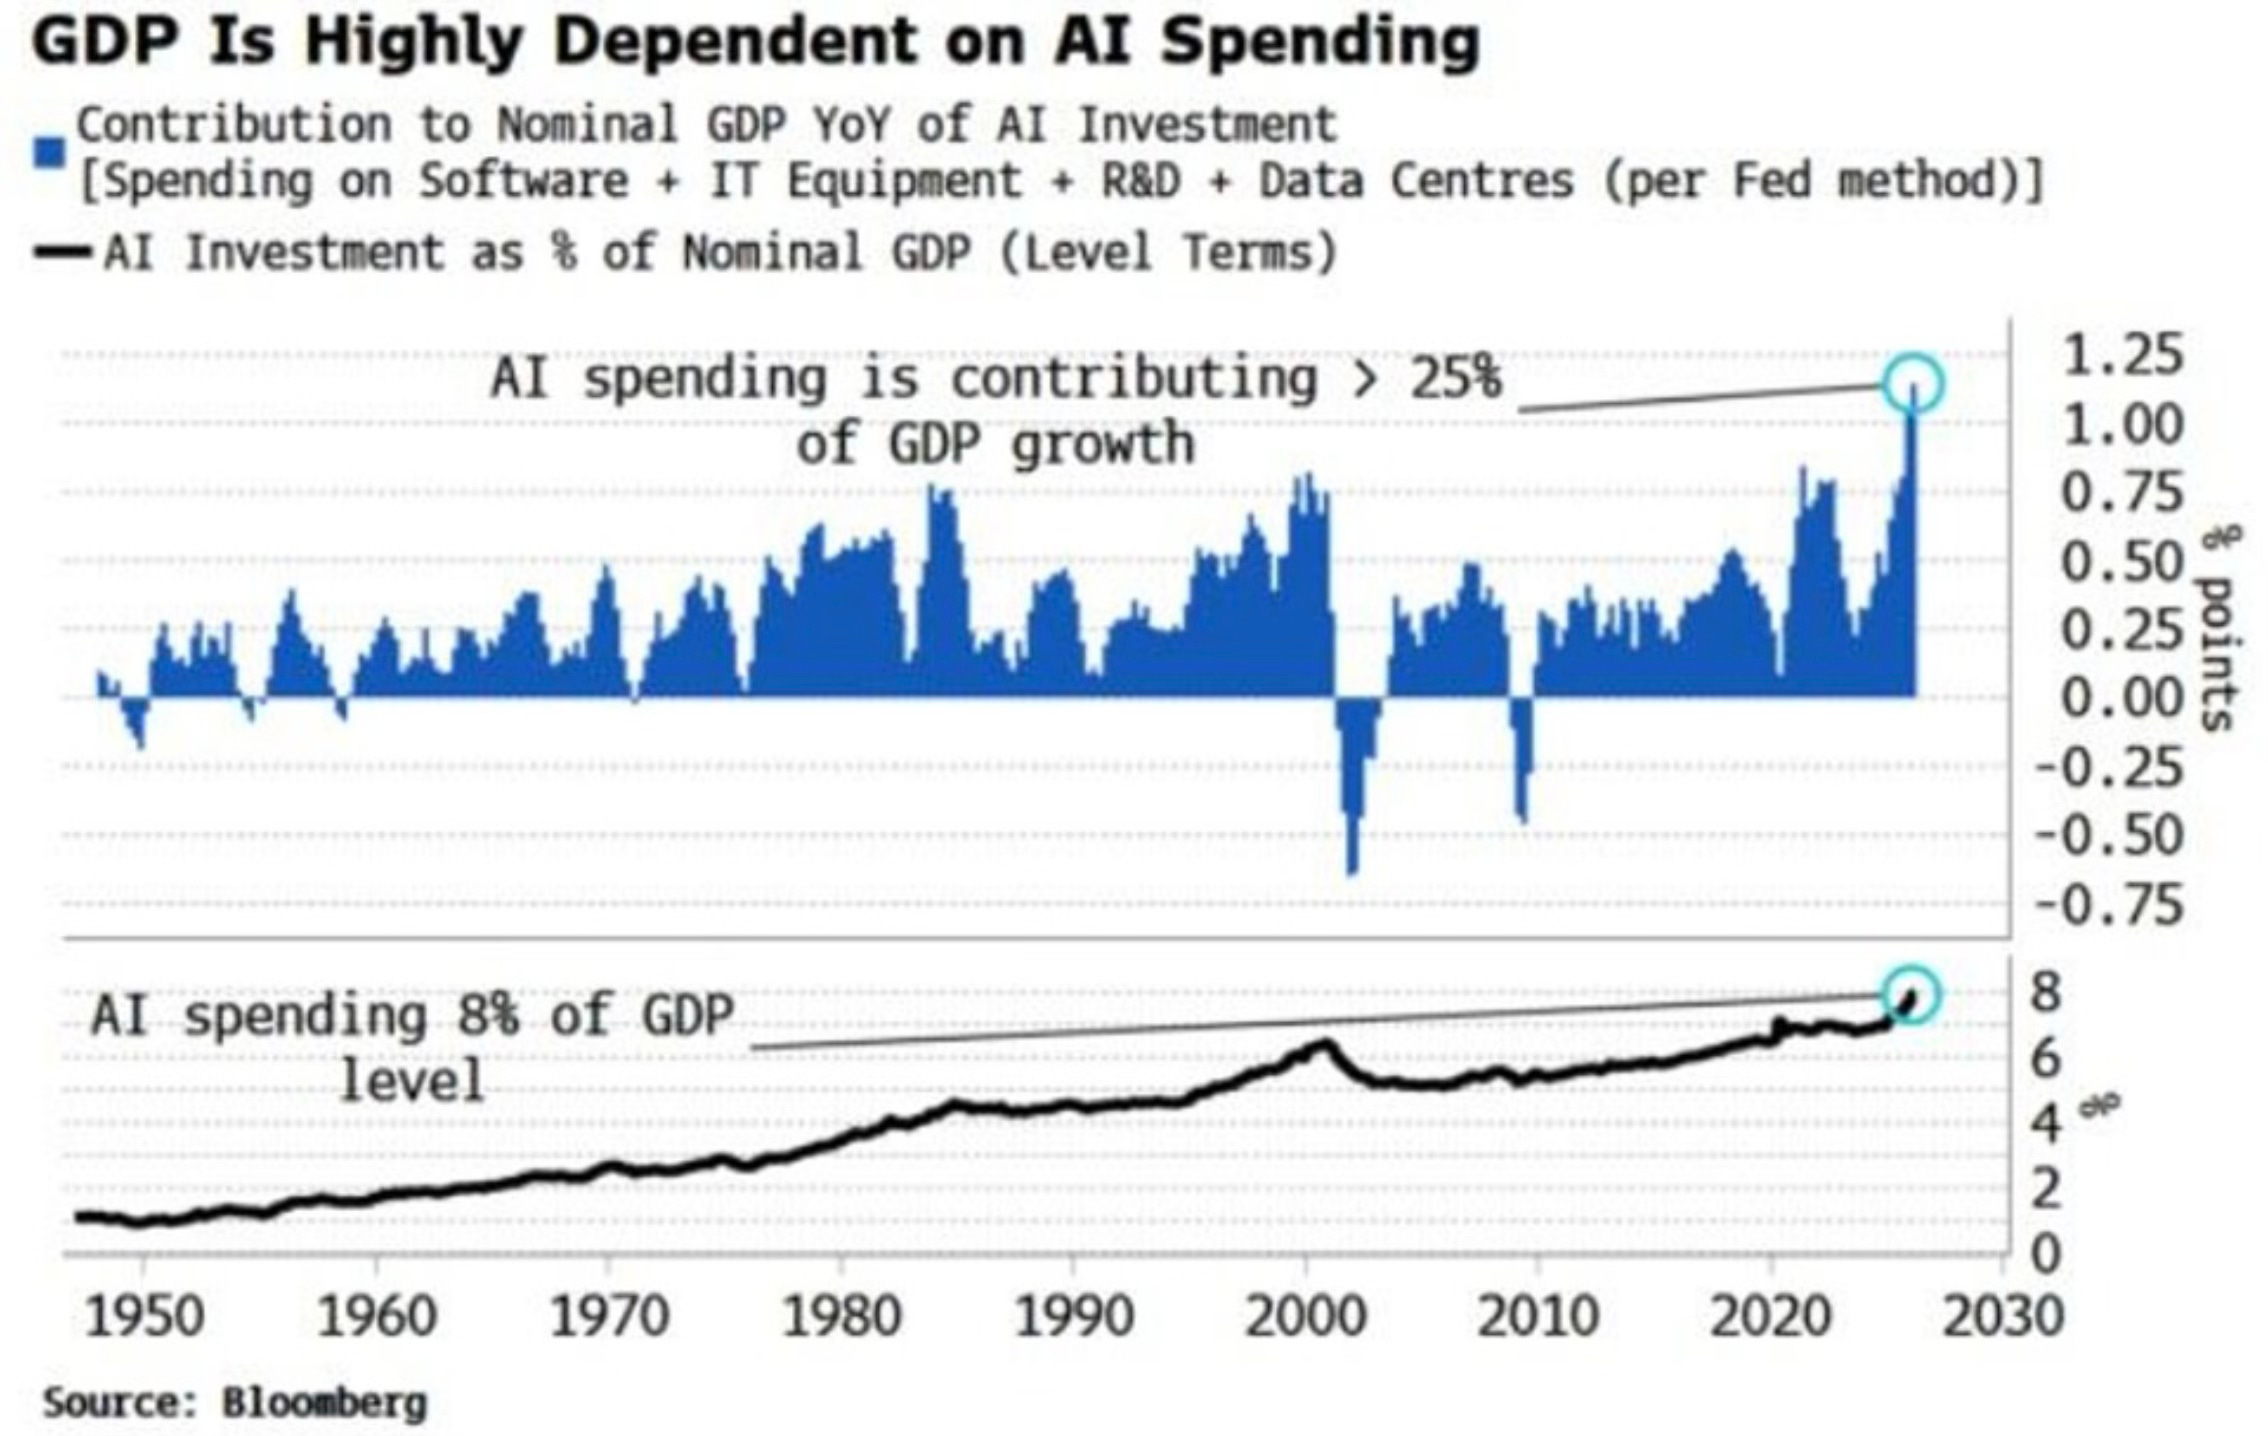
The US economy has quietly become an AI spending story. If that spending slows, this stops being a stock market conversation and becomes a GDP conversation.
The Technicals Are Getting Loud
Semiconductors have led this entire market higher. They’ve also gotten extended in a way that’s only happened a handful of times in history.
Over the last 50 trading days, the Philadelphia Semiconductor Index has moved an average of 3.36% a day. Up or down, doesn’t matter, that’s just how much it’s swinging daily. The only other stretches with this much daily movement were the runup and crash of the Dot Com bubble, the depths of the Financial Crisis in 2008, and the COVID crash in 2020.
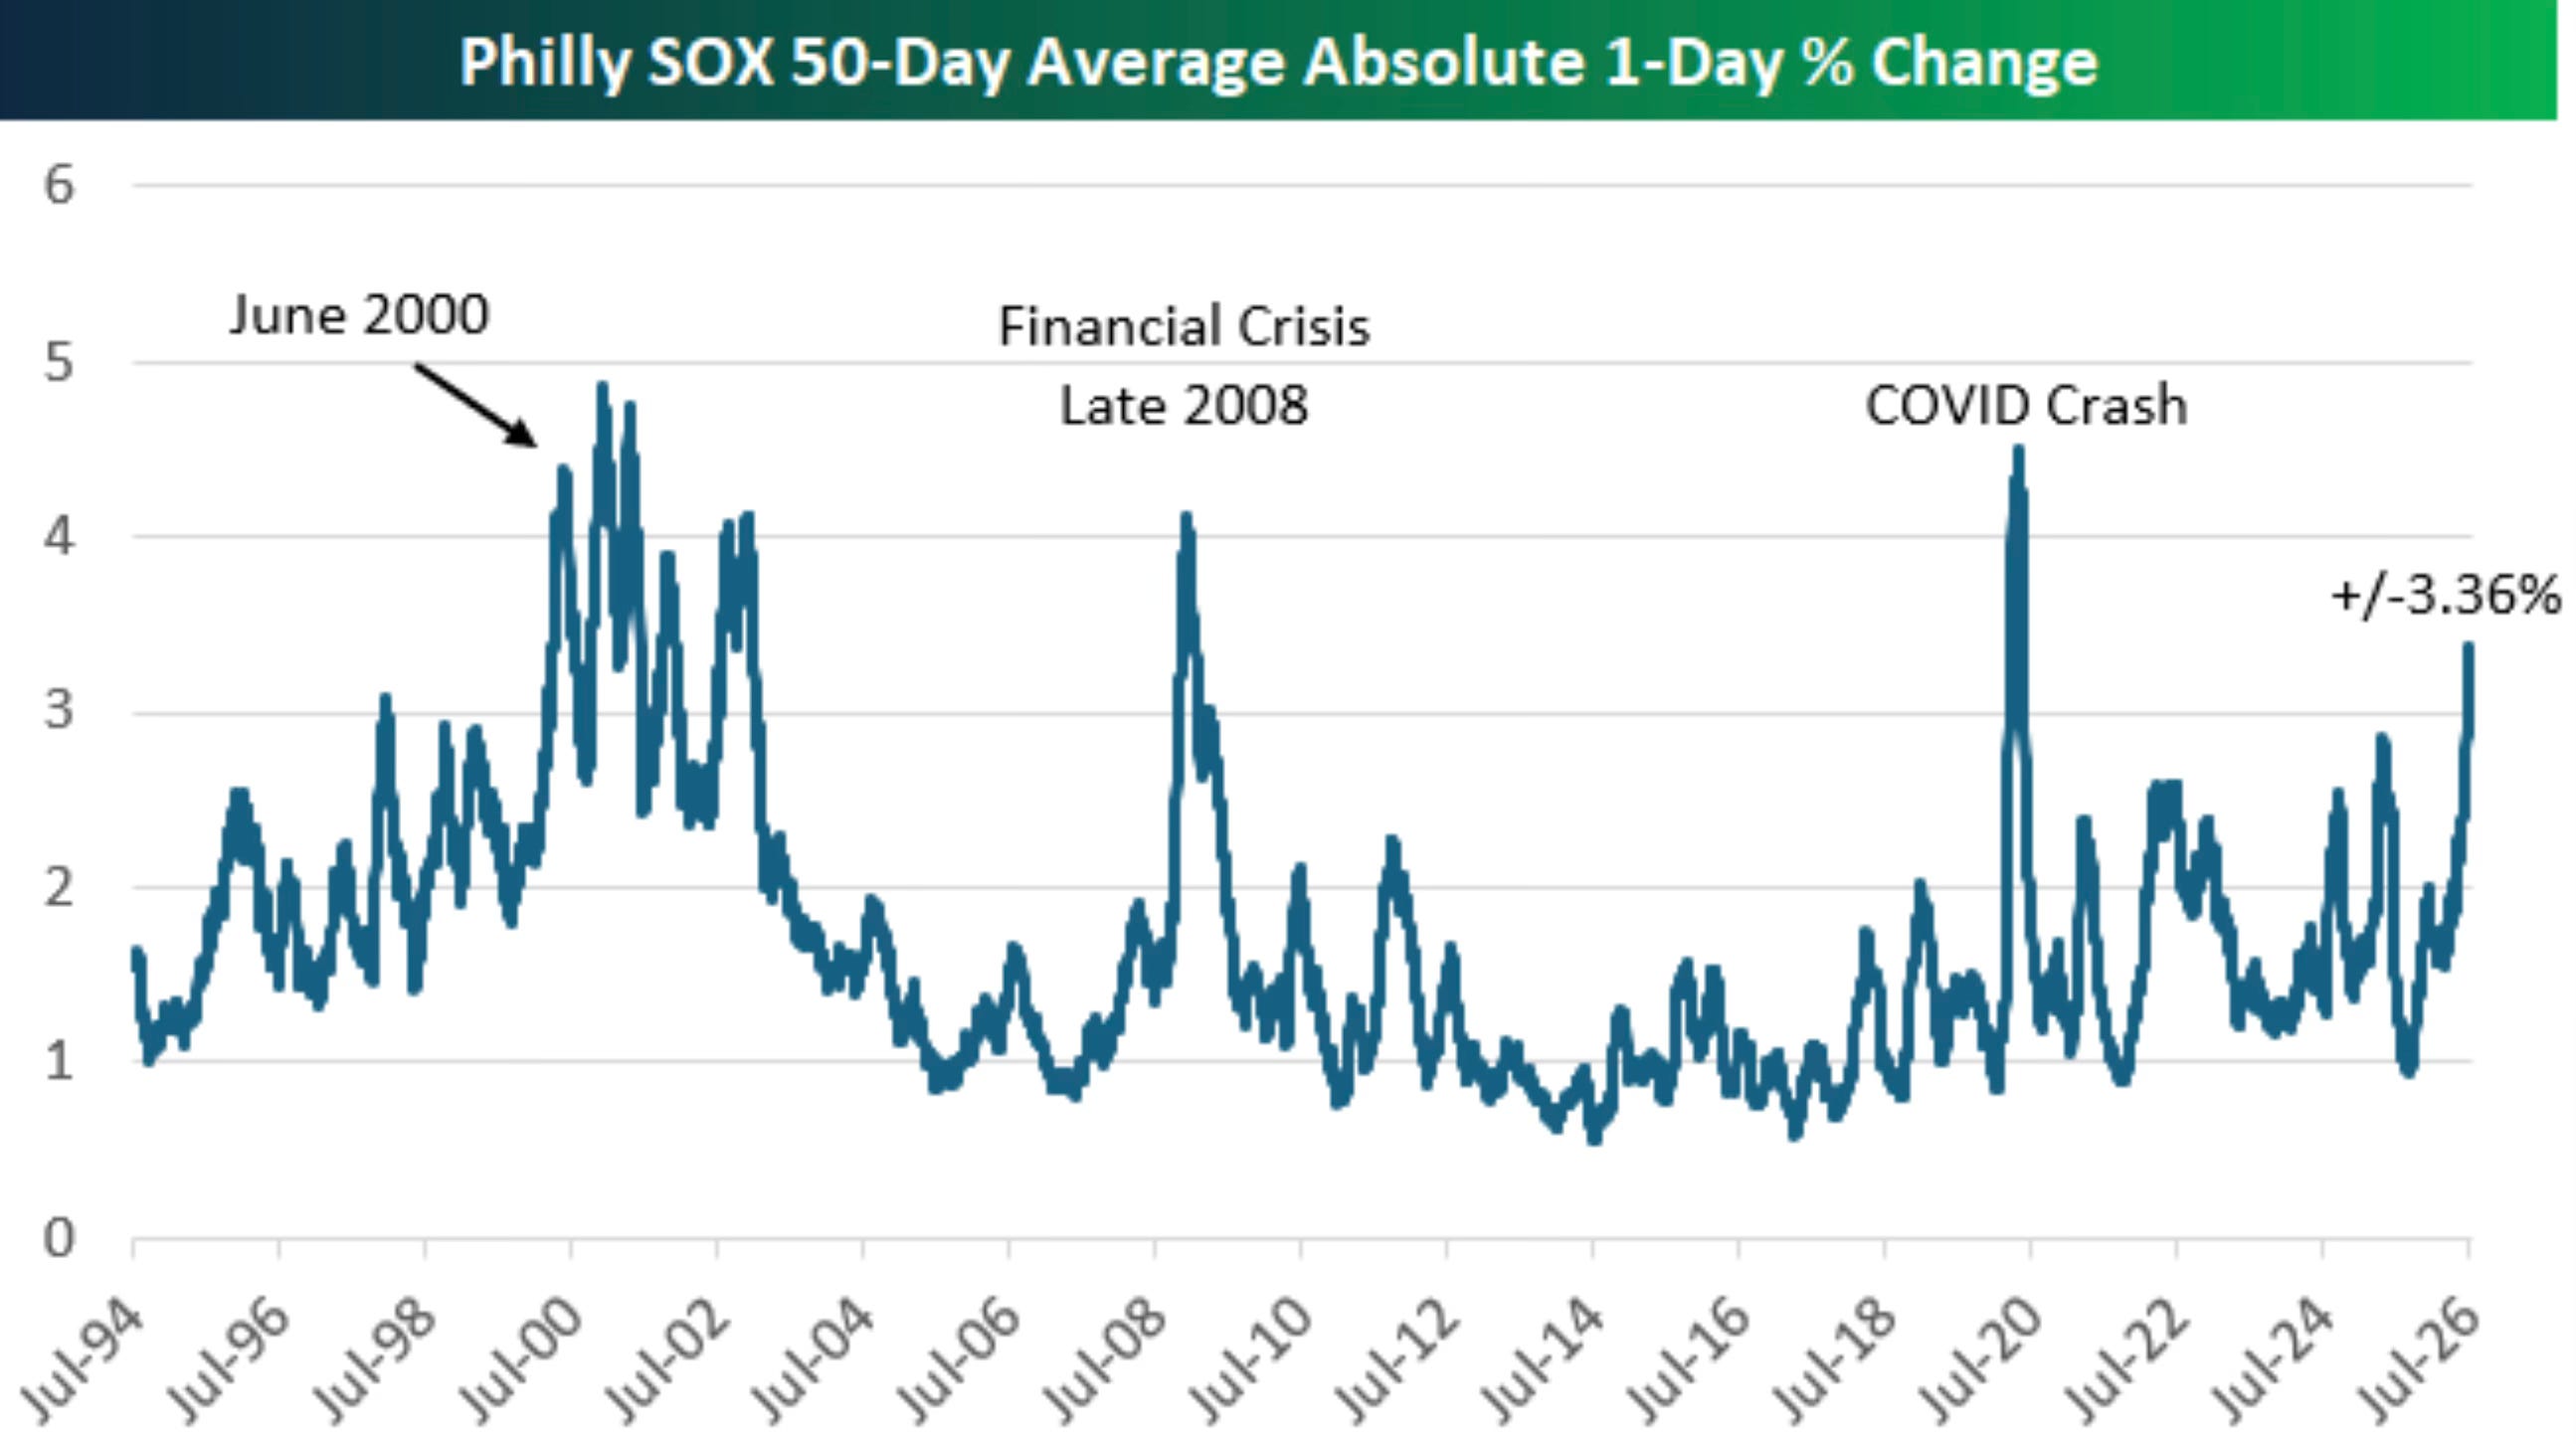
Big swings aren’t inherently bearish. But this is the company this chart keeps. Every other time we’ve seen this level of daily chop, something big was already breaking.
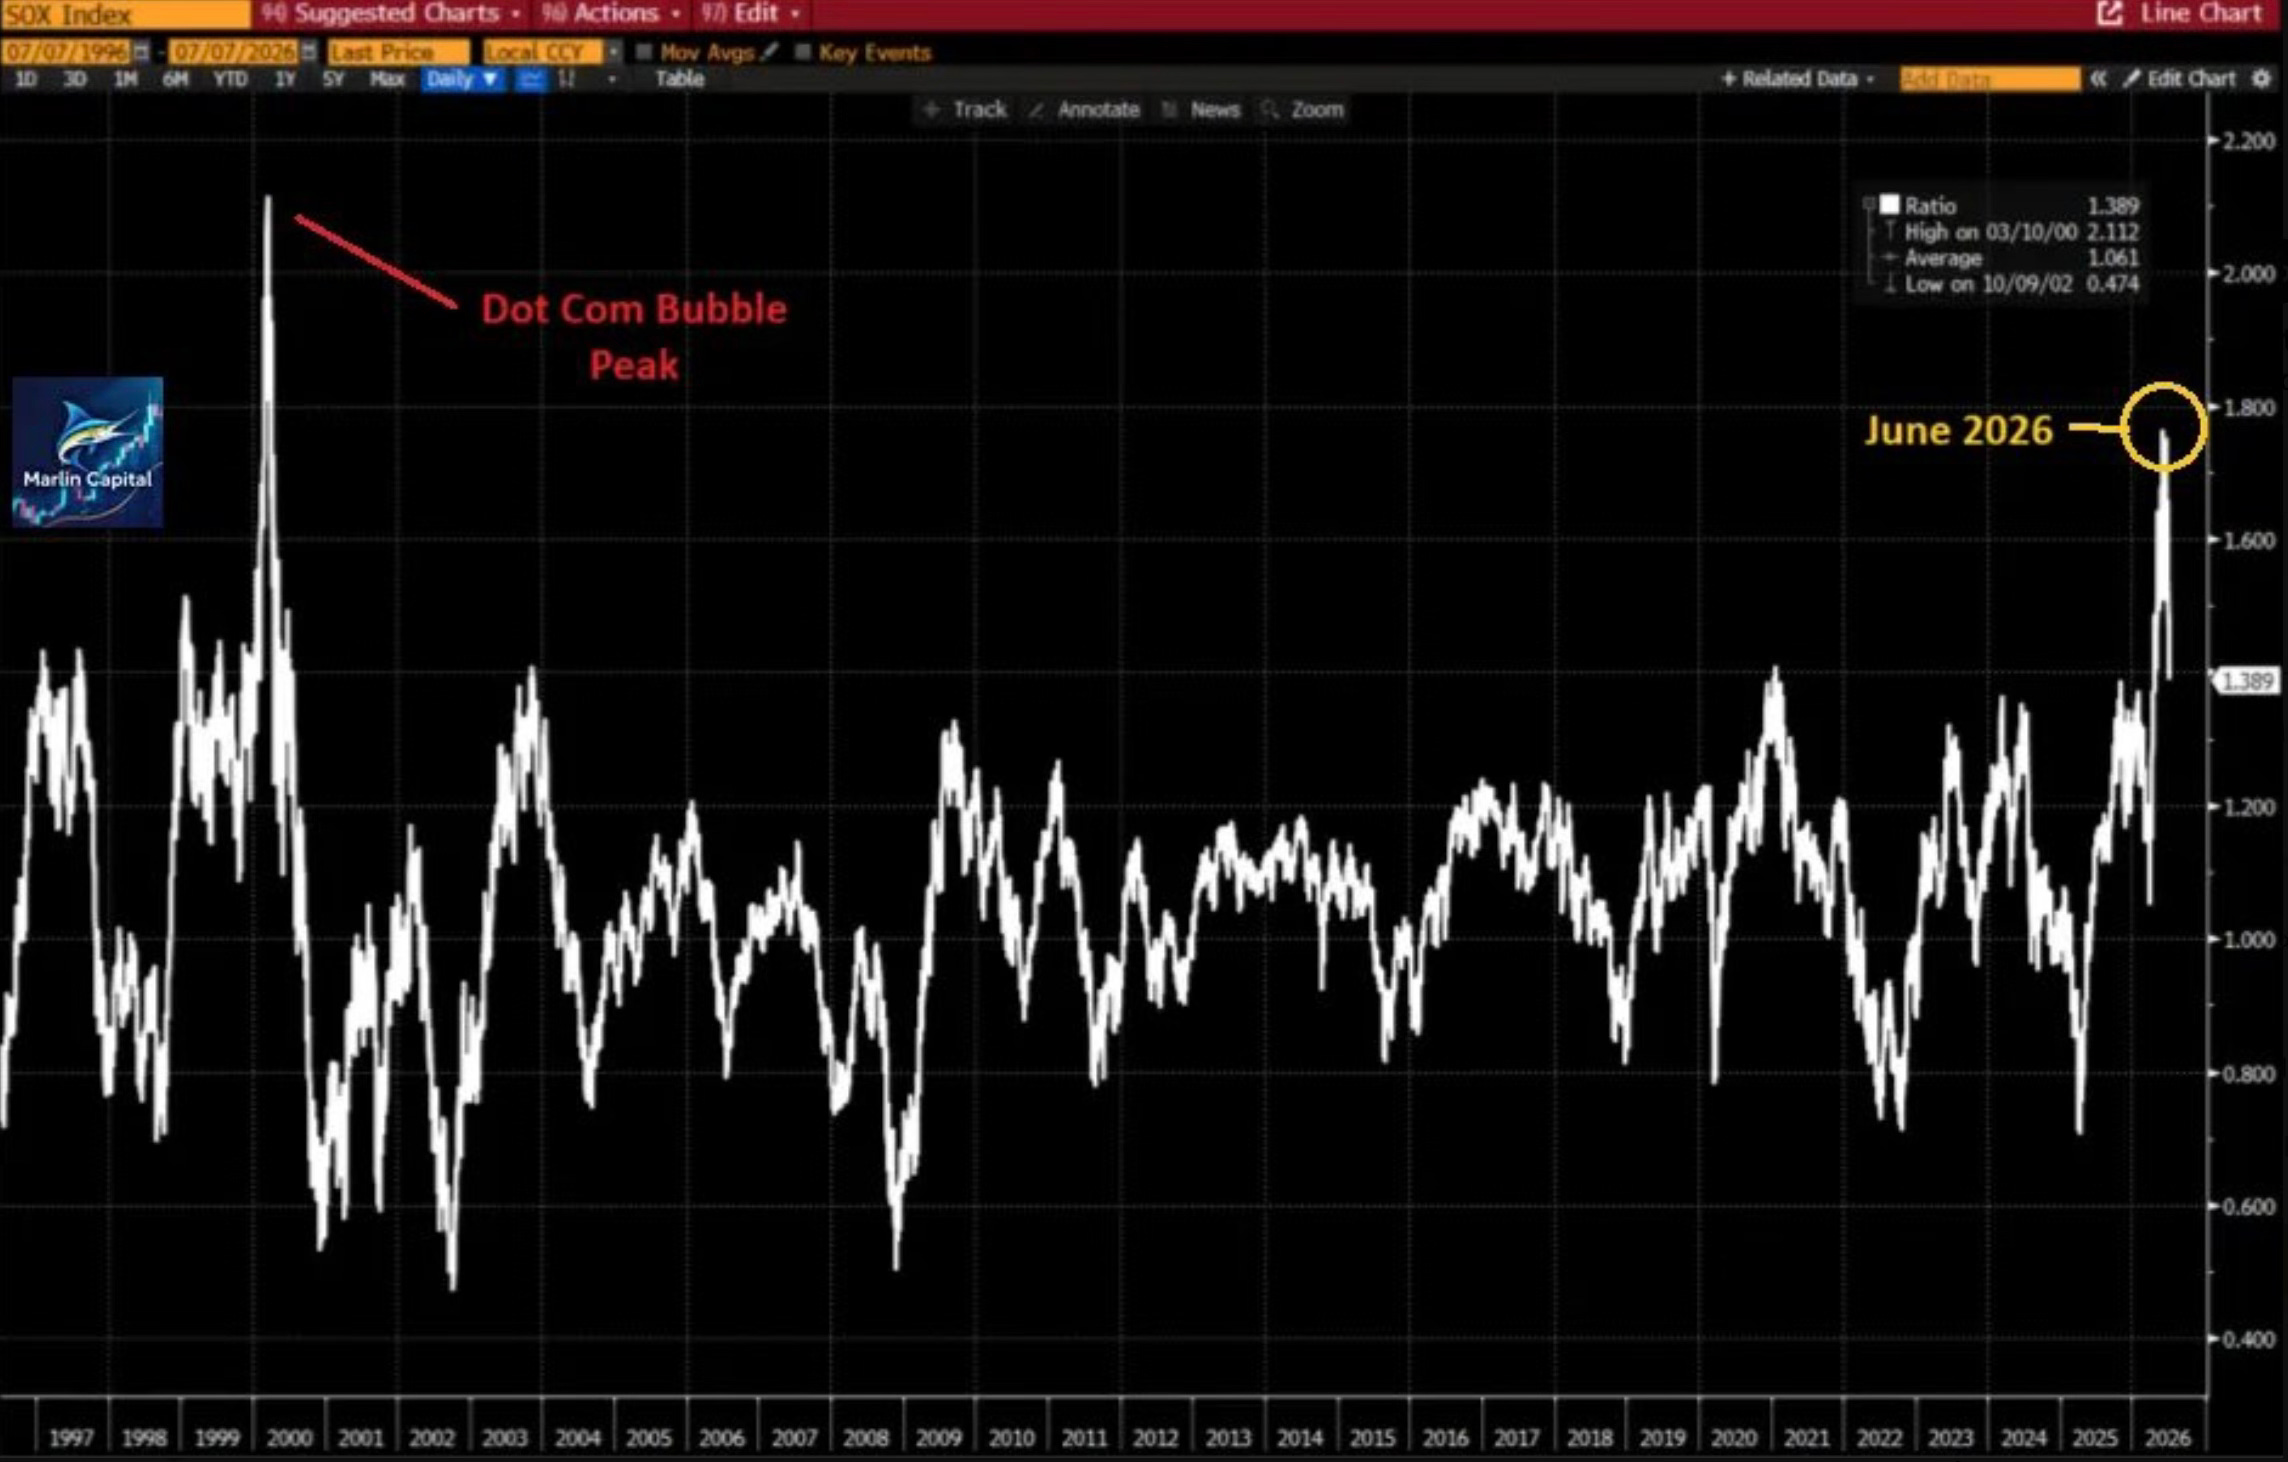
On top of that, semis are trading well above their own trend, at a level that’s only really been matched once before. Right at the top in 2000.
And the smart money knows it’s stretched, they’re piling in anyway. Hedge funds bought more US semiconductor stocks last week than in any week in at least three and a half years. That followed the two biggest weeks of selling since 2024. Semis now make up 10% of total hedge fund exposure, double where it was a year ago, though still shy of the 14% peak hit back in May.
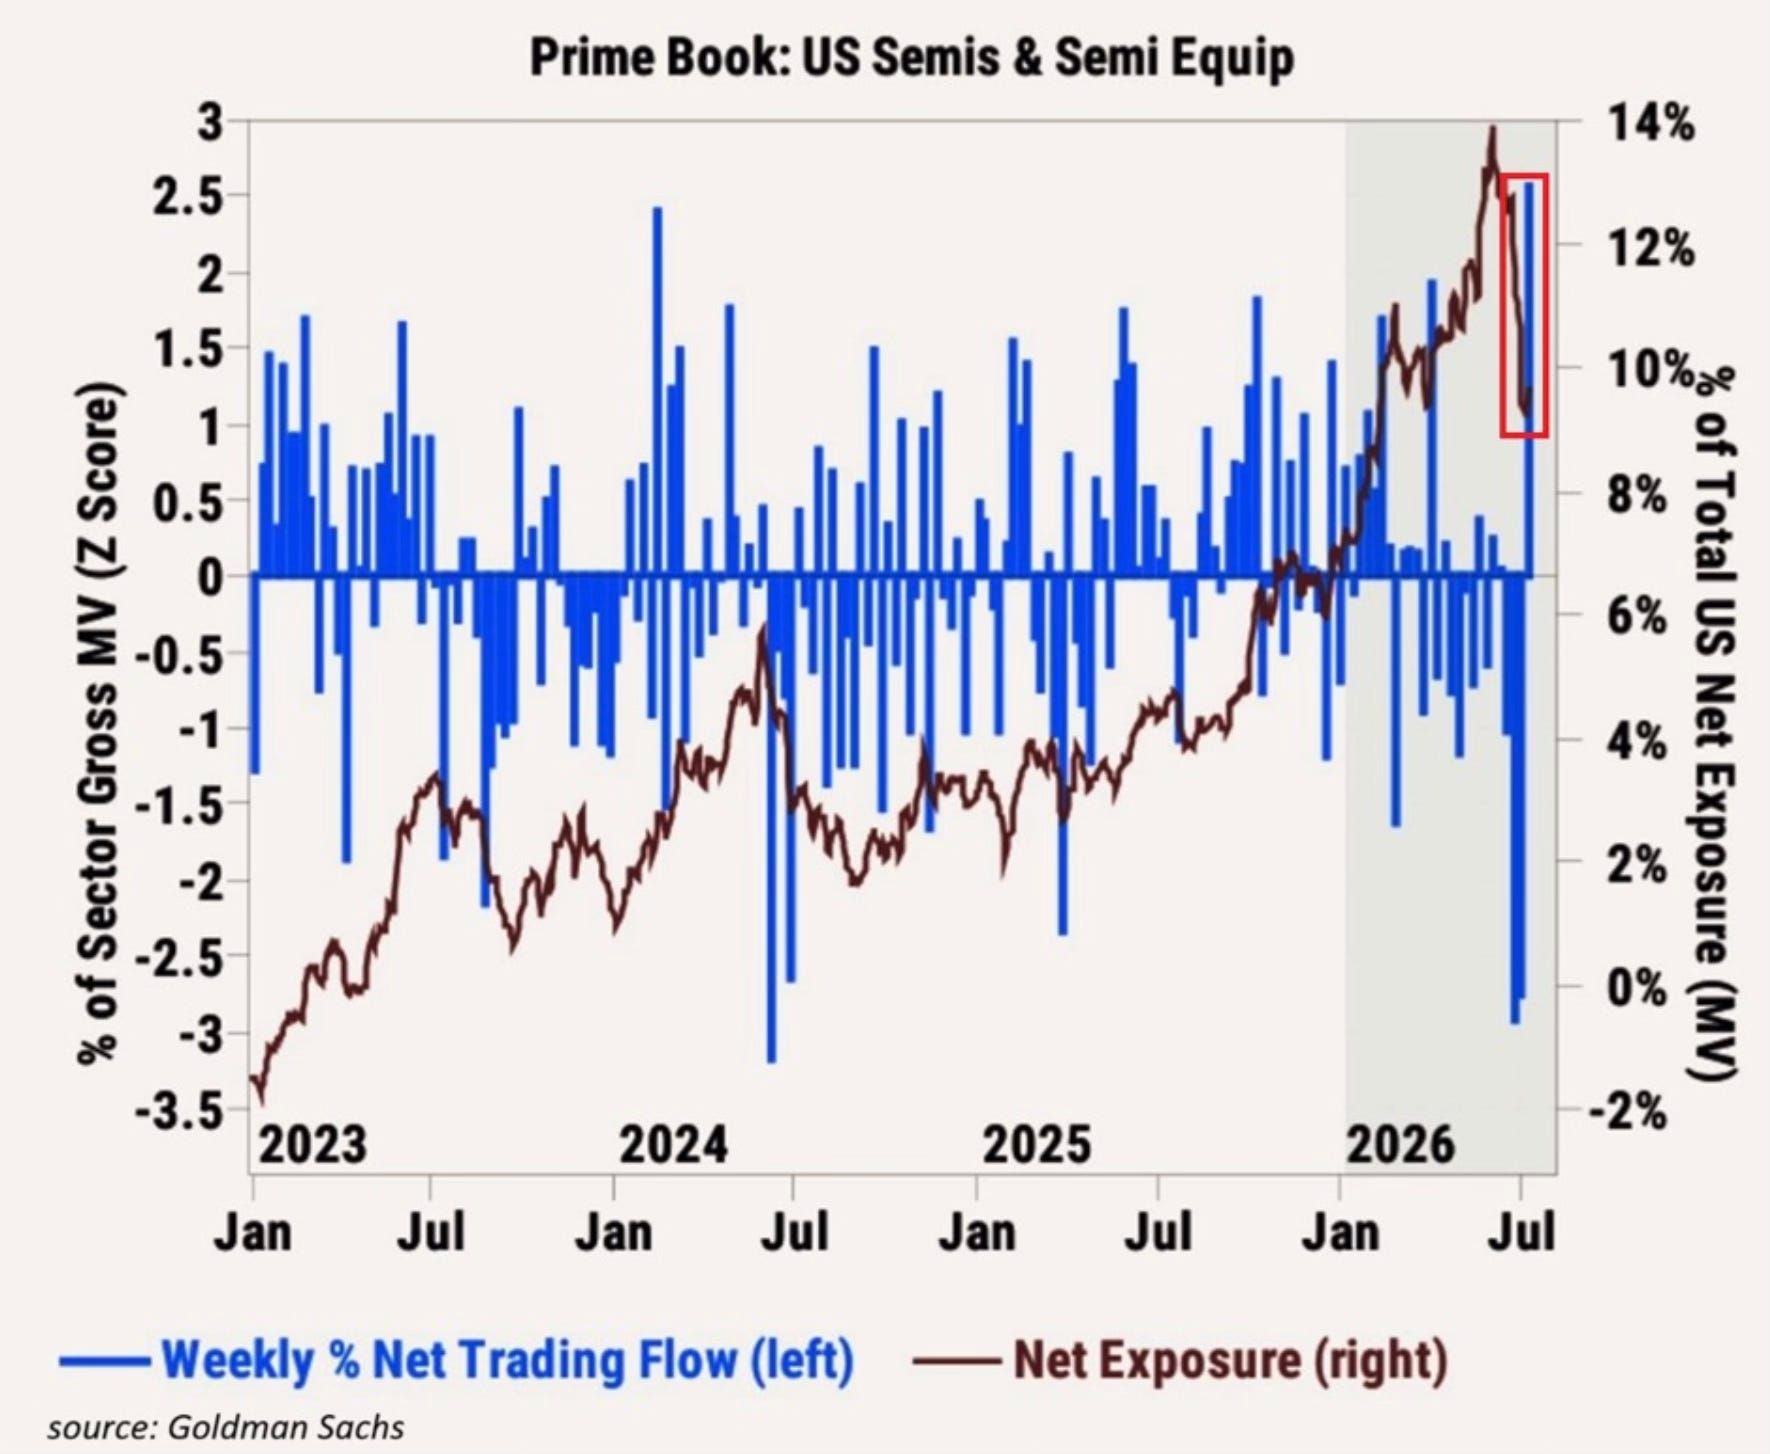
Hedge funds are betting the selloff already happened and it’s over. That’s a crowded bet either way it goes.
One more worth sitting with here. Margin debt, going back to 1960, tells a strange story. It’s not the level of margin debt that’s ever marked the top. It’s the turn.
Look at 1972, 2000, 2007, 2021. In each case, margin debt growth climbed into a danger zone, then rolled over. That rollover is what lined up with the market topping out, not the high reading itself.
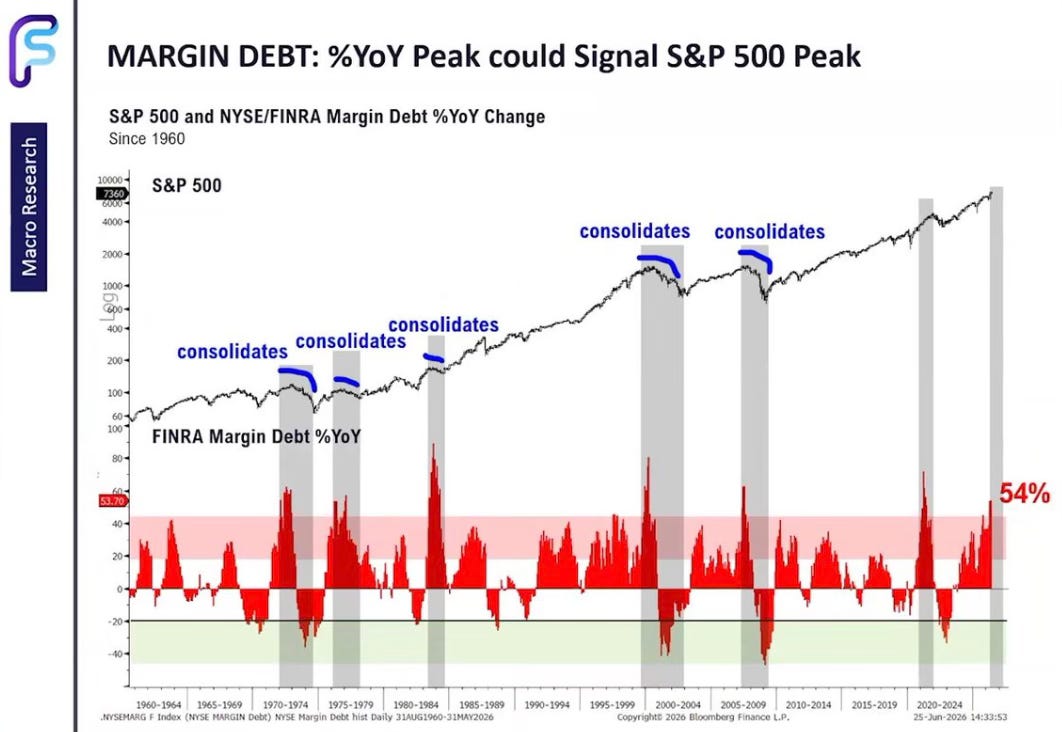
Right now margin debt growth is sitting at 54%, deep in that same danger zone that’s preceded every major consolidation on this chart. It hasn’t rolled over yet. History says that’s the number to watch, not the one we’re looking at today.
Valuations Have Stopped Being a Footnote
Here’s the one I keep getting sent more than any other. The Shiller PE ratio, which smooths earnings out over ten years to strip out the noise, is one tick away from taking out its all time high. Set during the Dot Com bubble.
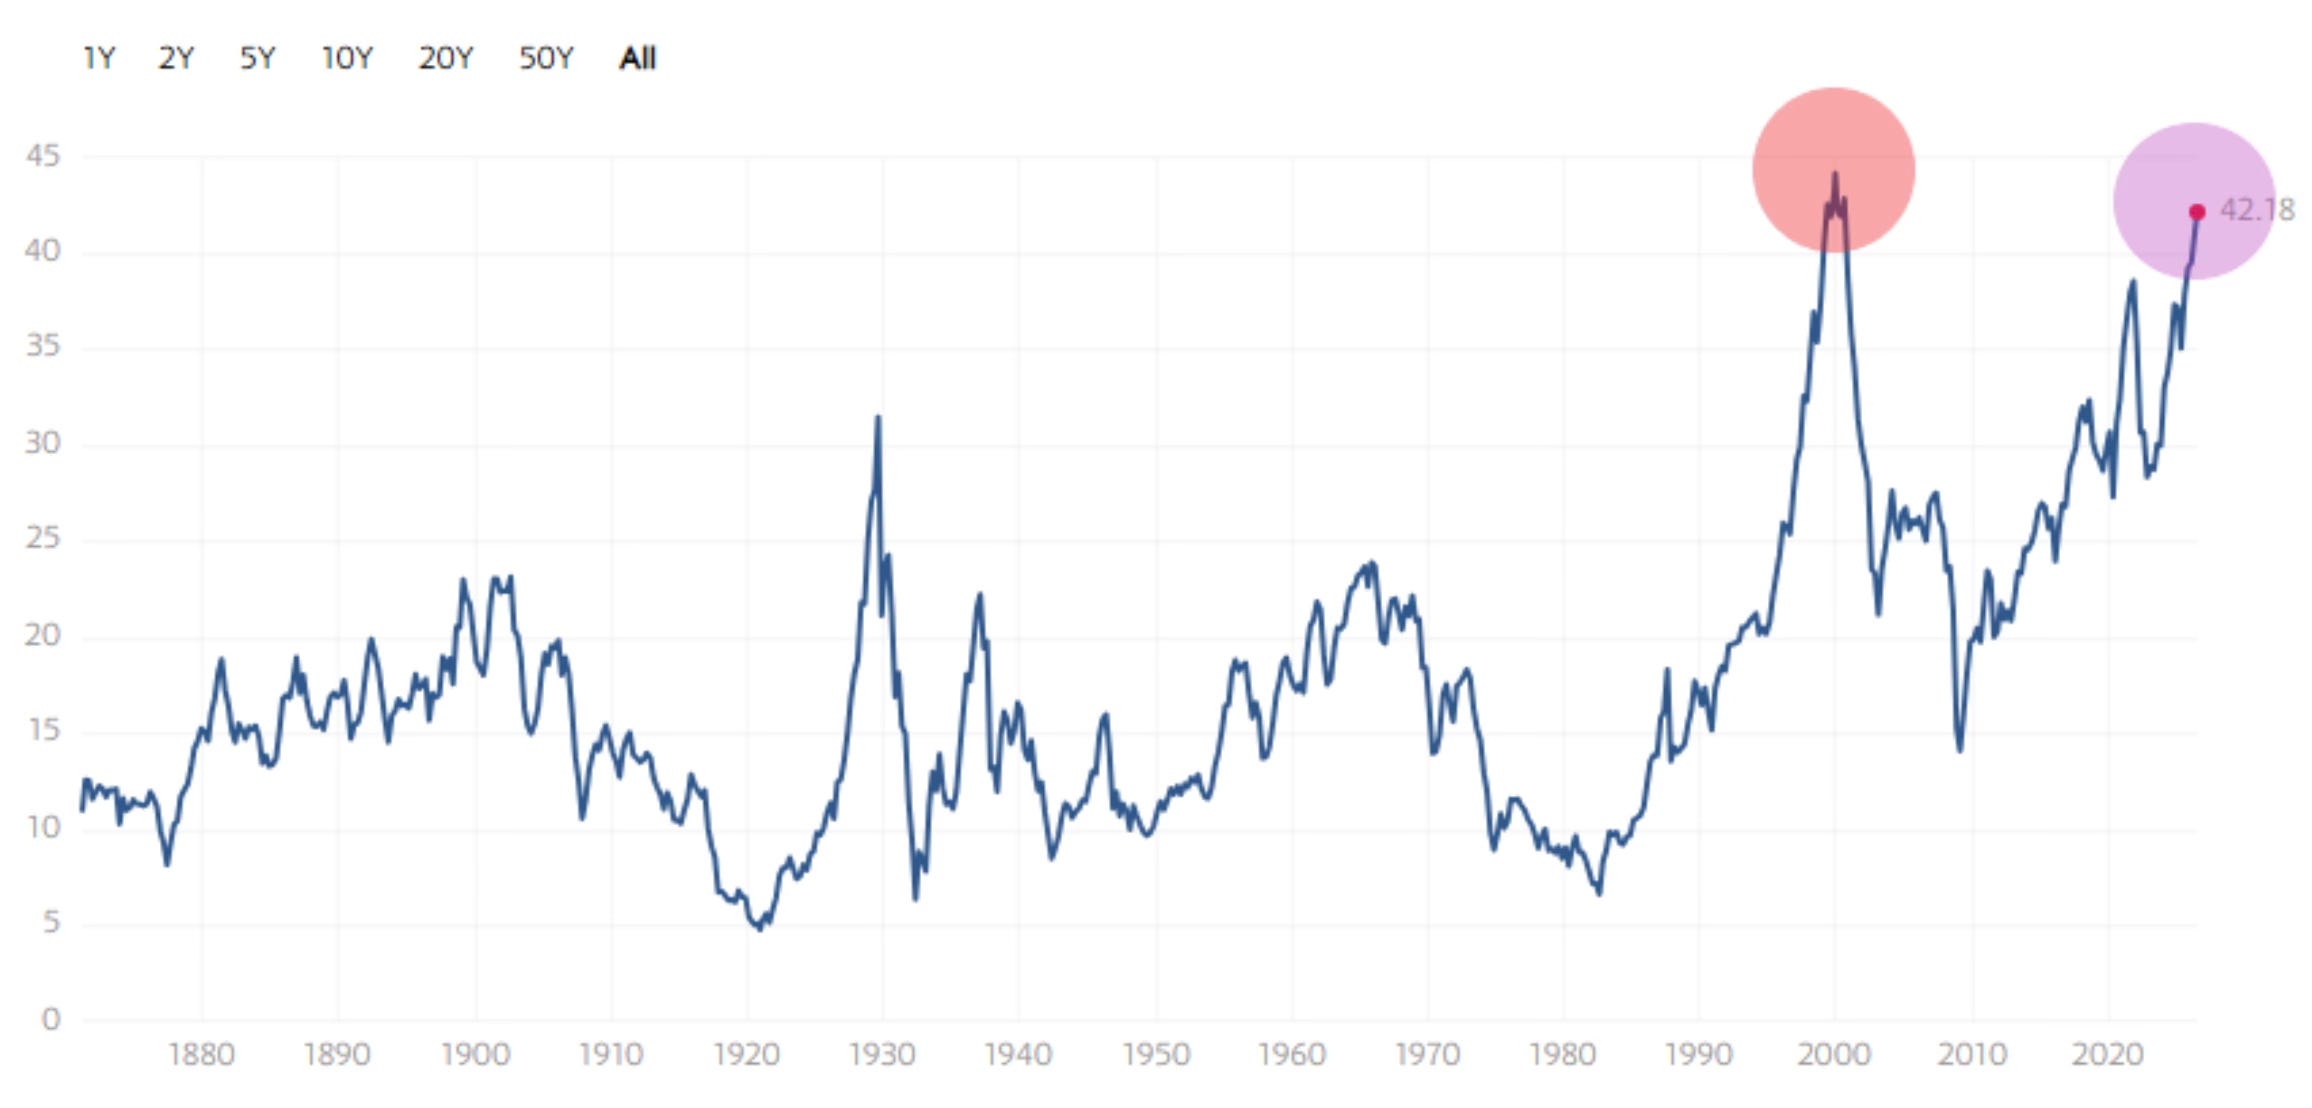
Valuation alone has never been a great timing tool. Stocks can stay expensive for a long time before anything happens. But expensive and as expensive as the most infamous bubble in modern market history are two different conversations.
The gap between what the market is trading at today versus what it’s projected to earn next year is also about as wide as it’s ever been. Trailing PE sitting near 28x while forward PE sits closer to 21x. That spread has only been this wide twice before. The Dot Com peak, and the 2022 bear market.
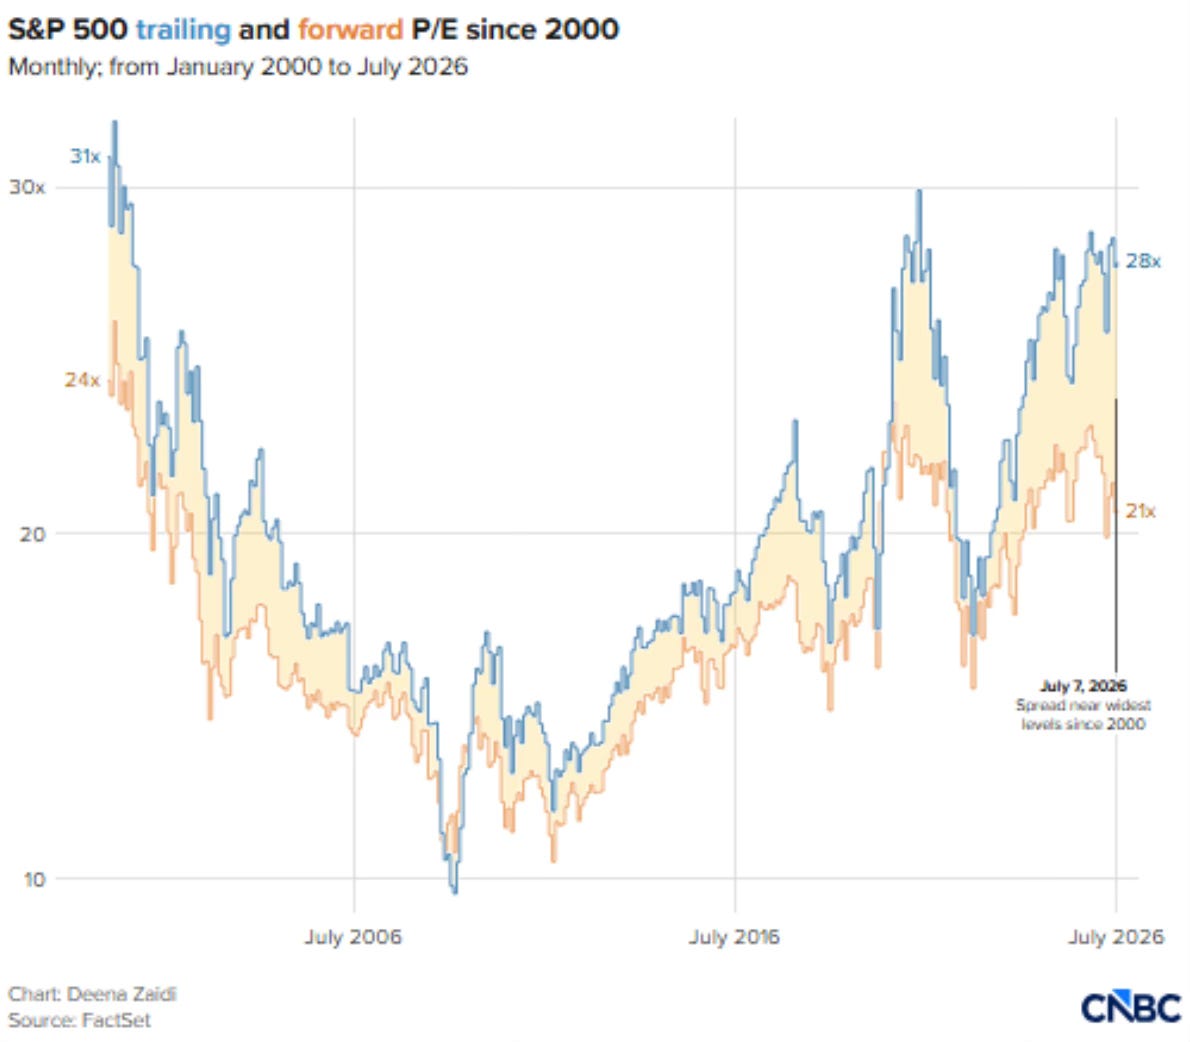
A wide gap like that means the market is pricing in a lot of earnings growth that hasn’t shown up yet. Sometimes it shows up. Sometimes that’s exactly the setup for disappointment.
Households have noticed the run and piled in right alongside it. Equities as a share of total household financial assets are sitting near an all time high, tracking almost perfectly with the Shiller CAPE ratio. When everyone’s already in, there isn’t a lot of dry powder left to keep pushing prices higher.
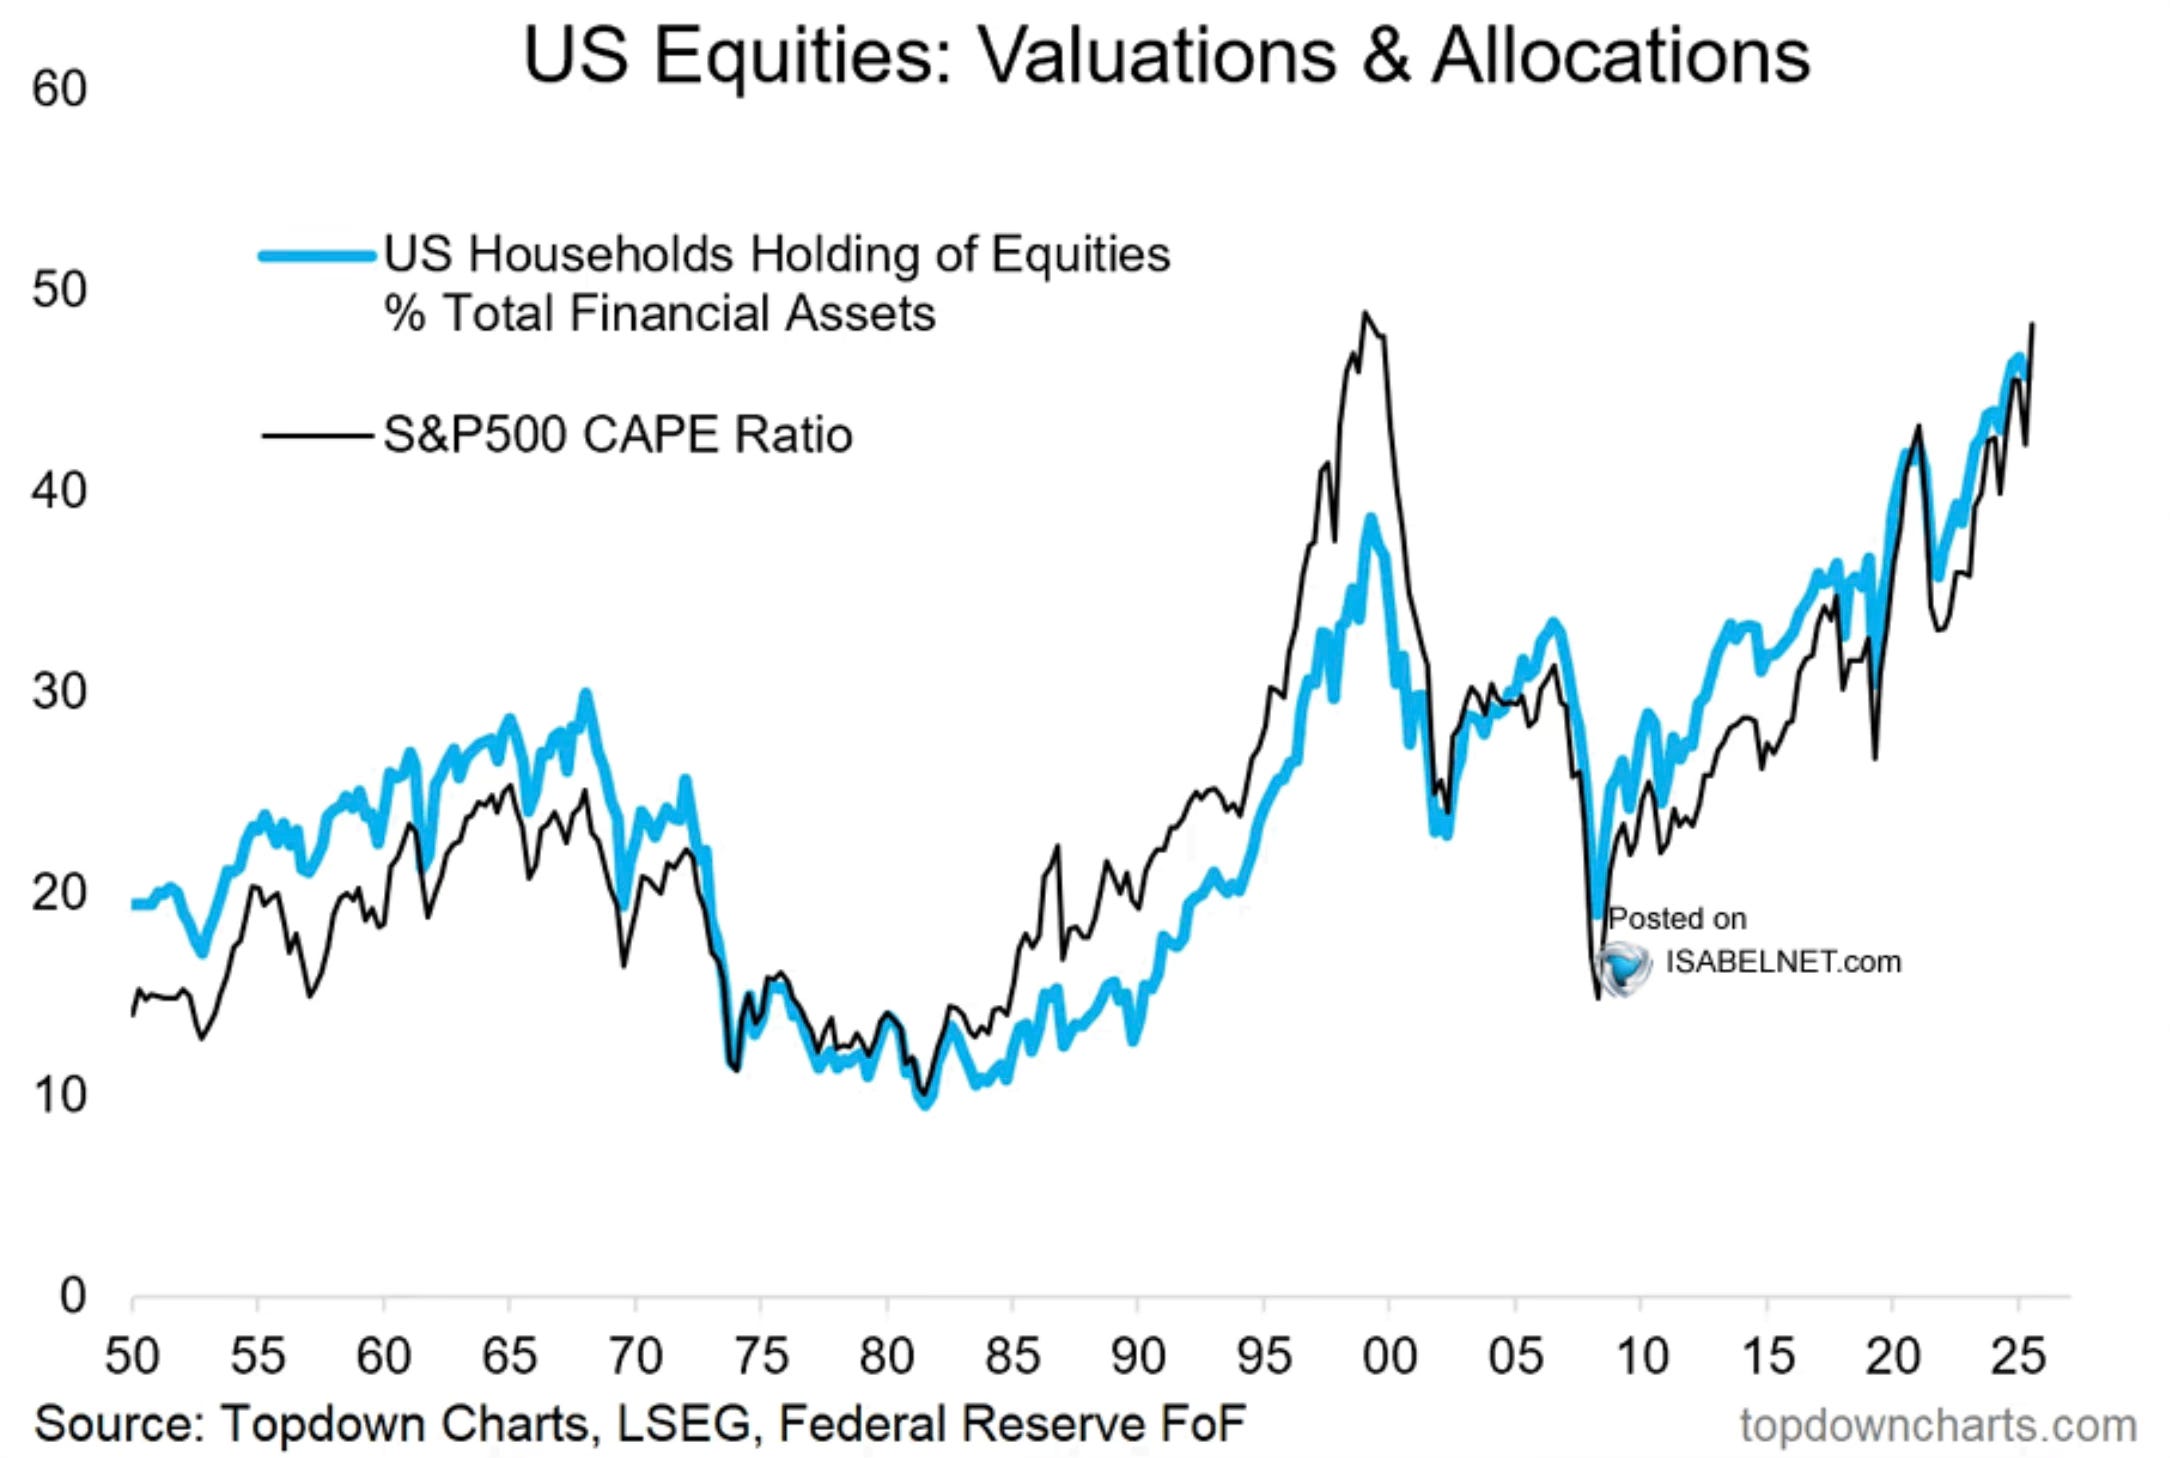
None of this means a crash is required. Valuation isn’t a clock. But it’s worth remembering how this usually works. Valuation doesn’t matter, until suddenly it’s the only thing that matters.
If you want the chart that’s been making the rounds and giving people a genuine chill, it’s this one. It overlays the current S&P 500 on top of the 1995 through 2003 run, bubble and bust included. The two lines have tracked each other closely enough that it’s hard to unsee once you look at it.
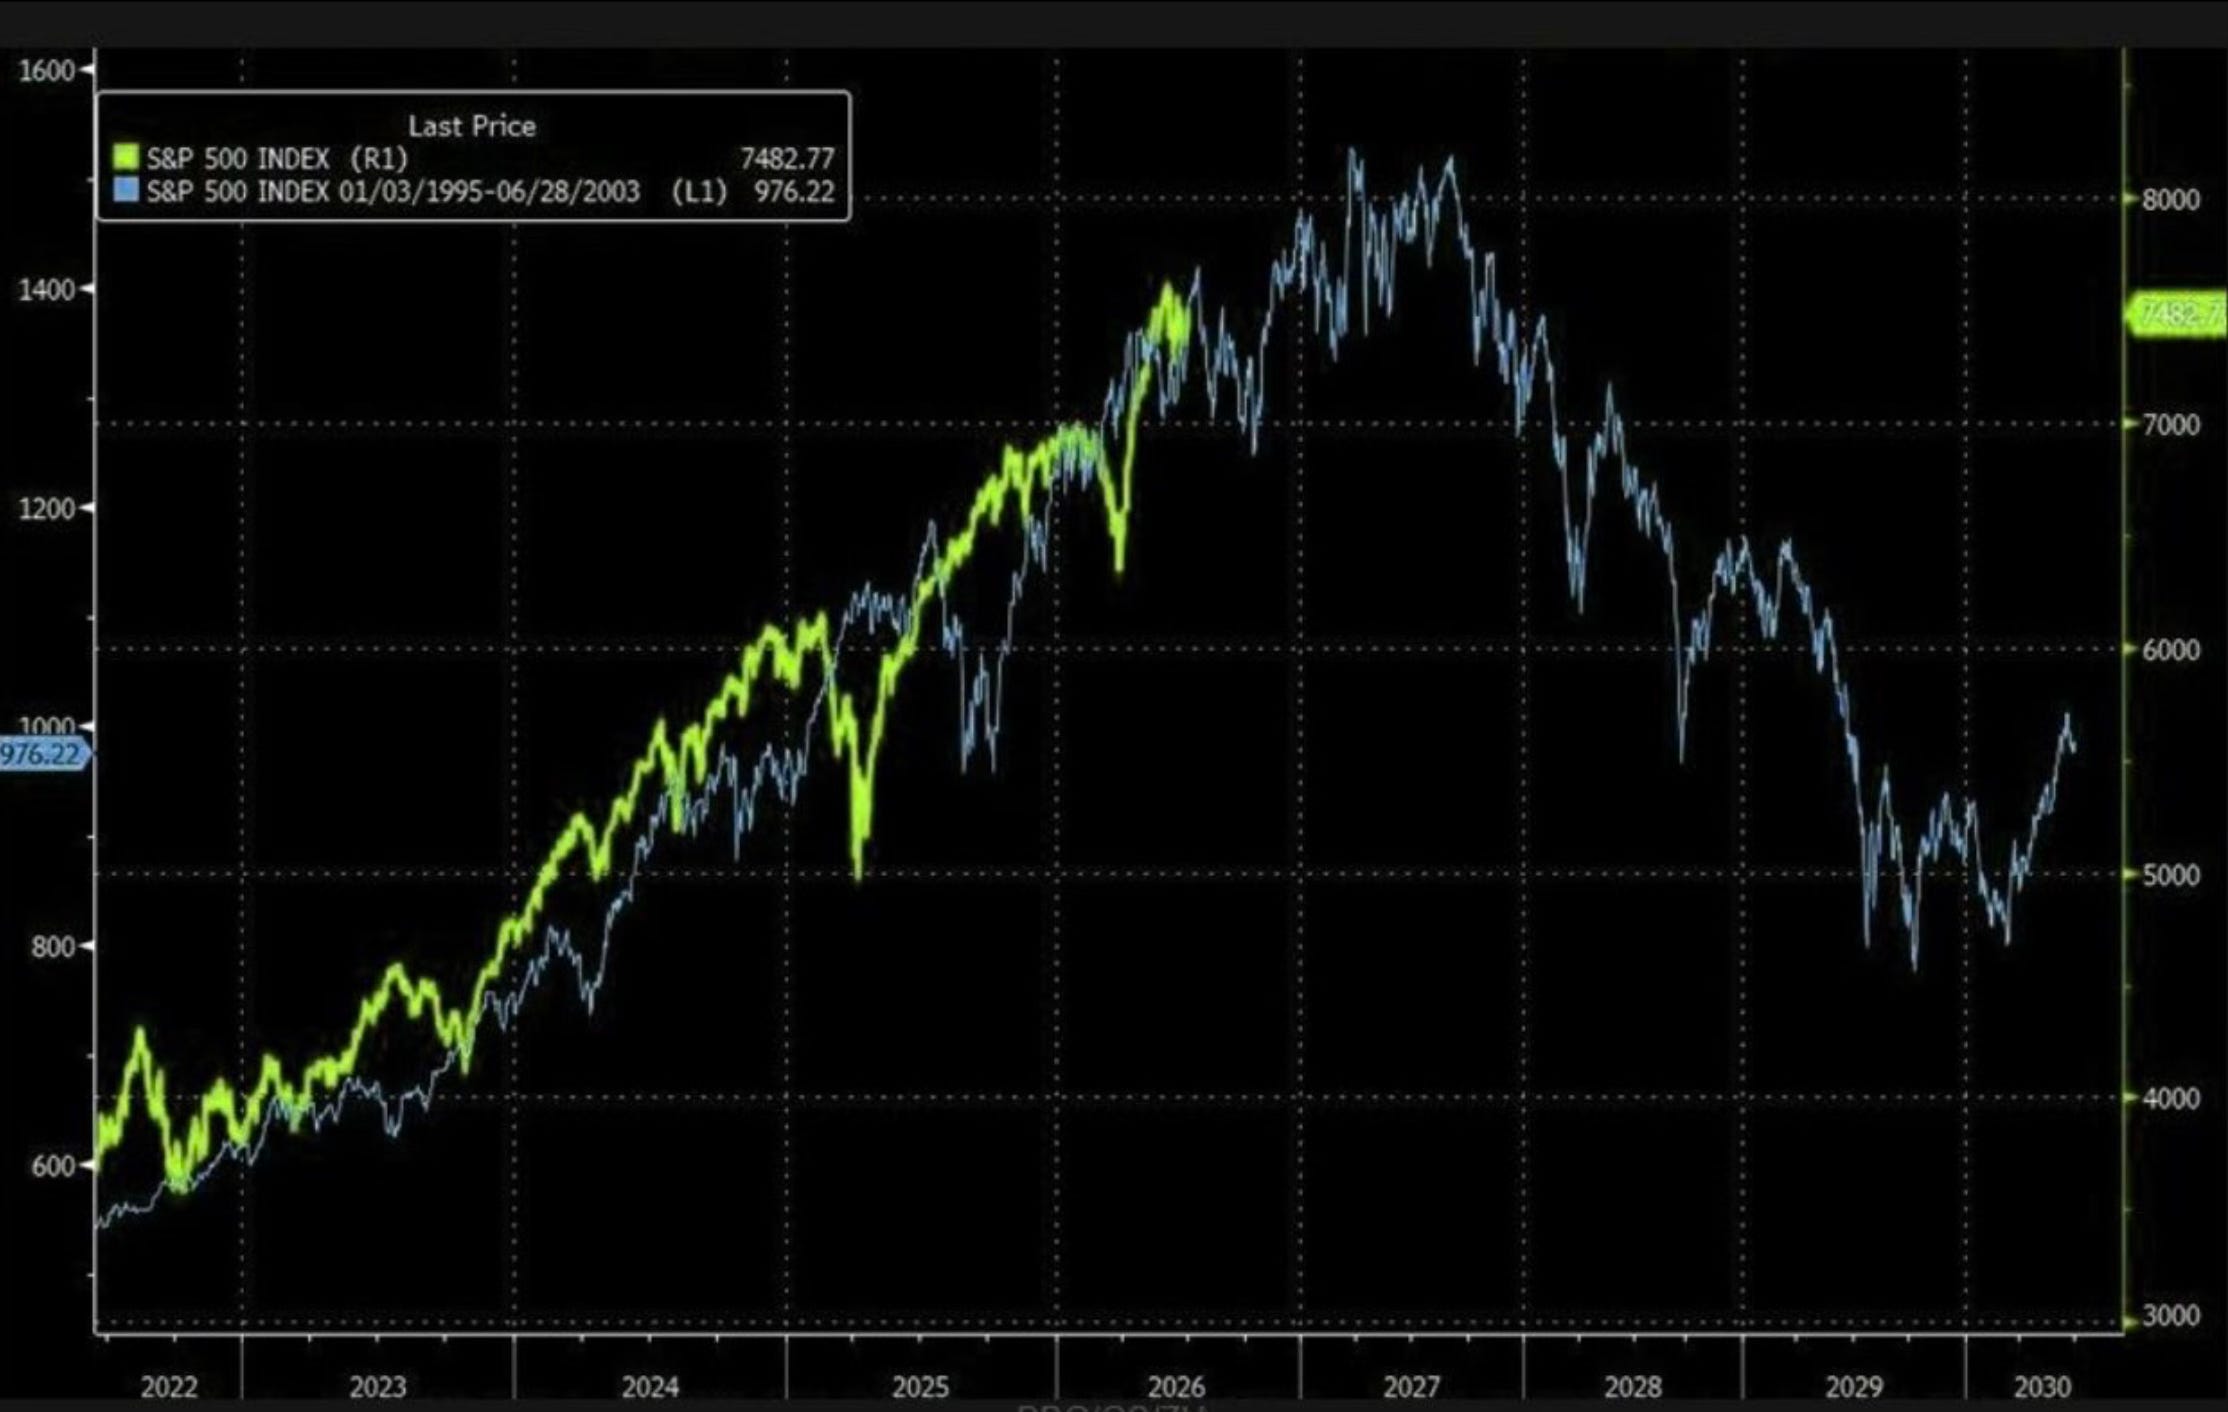
I want to be careful here. Overlay charts are seductive and they’re not a forecast. Two lines can rhyme for a while and then completely diverge the moment you screenshot it. But it’s the kind of chart that explains why so many smart people have one eye on the exits.
The Money Flow Doesn’t Match the Story
For most of the last five years, companies have been buyers of their own stock. That’s flipped. Companies are now issuing more shares than they’re buying back for the first time in five years. Secondary offerings, IPOs, and new issuance to fund AI buildouts and acquisitions are outpacing buybacks.
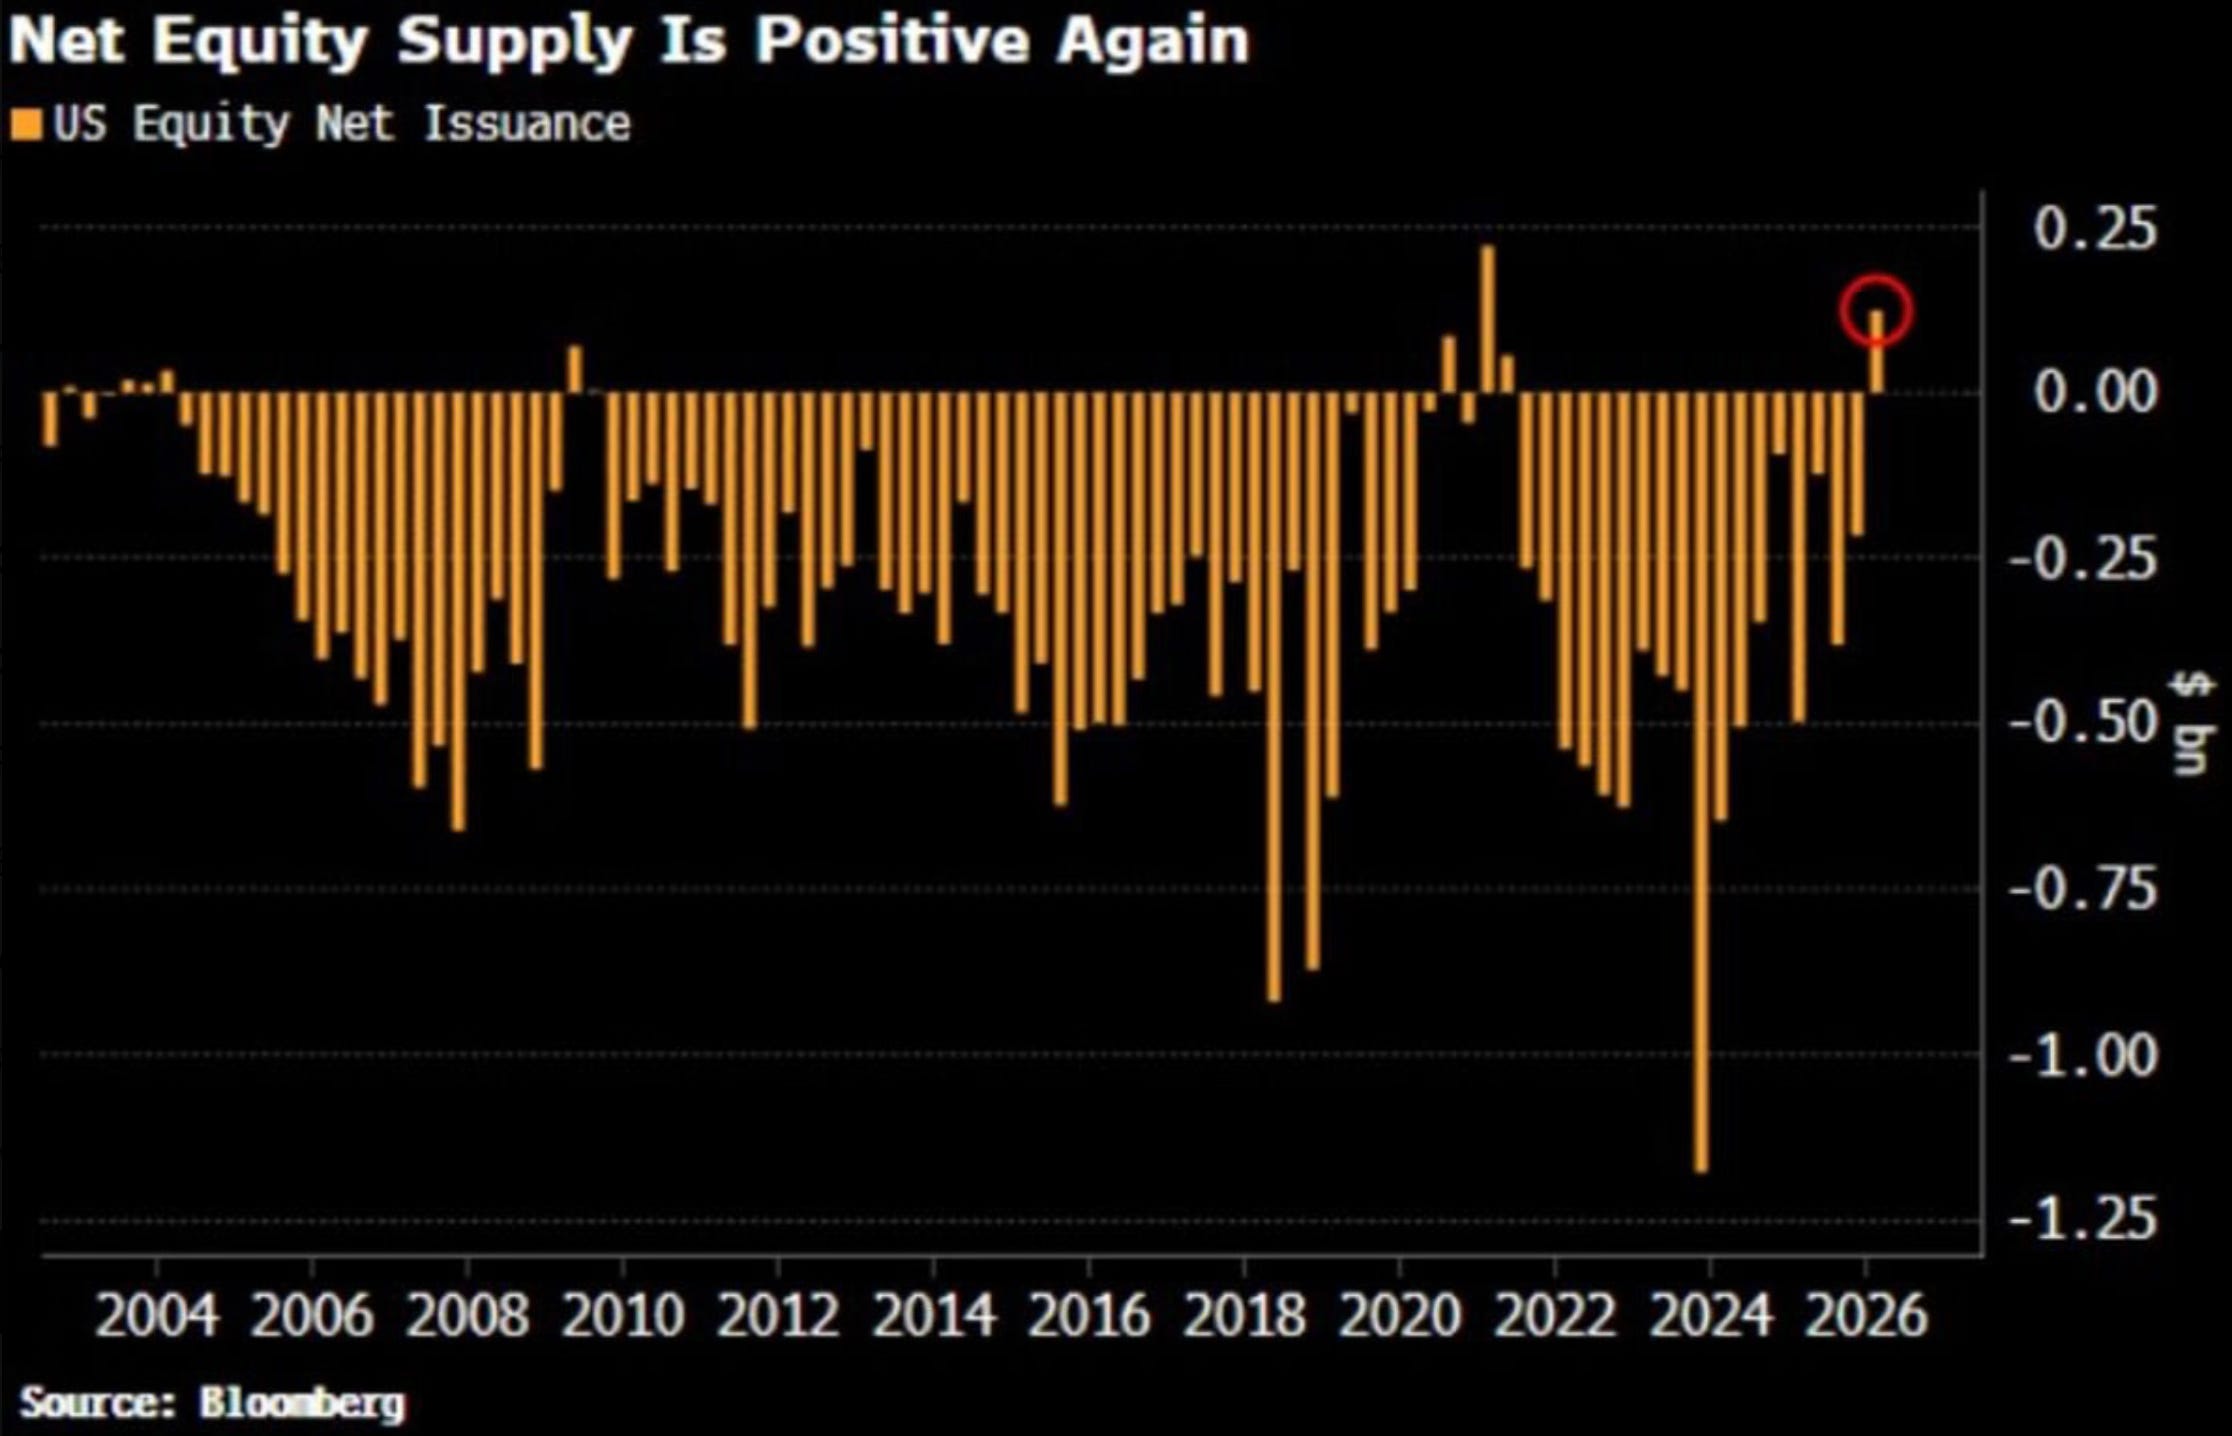
For years, buybacks were a quiet source of support underneath stock prices. Fewer shares outstanding, higher earnings per share, a built in bid. That support is fading right as valuations sit near record highs. Historically, stretches of heavy net issuance have shown up right around market tops.
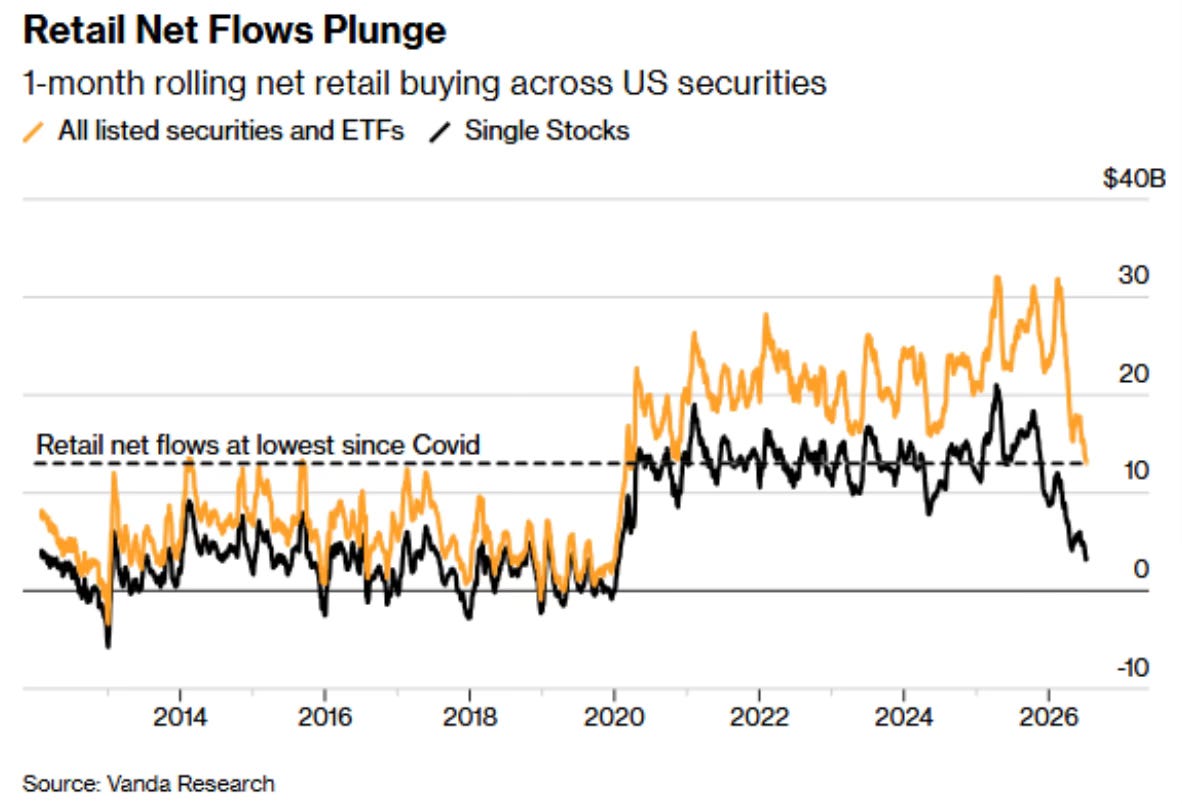
At the same time, the retail crowd that’s been a reliable source of buying power the last few years has pulled back hard. One month rolling retail buying across US stocks just hit its lowest level since Covid.
And this next one might be the strangest of the bunch. Consumer sentiment and the stock market used to move together. They don’t anymore. Sentiment has been sliding since 2021 while the S&P has kept grinding to new highs. The gap between how people feel and what their portfolios are doing has never been wider.
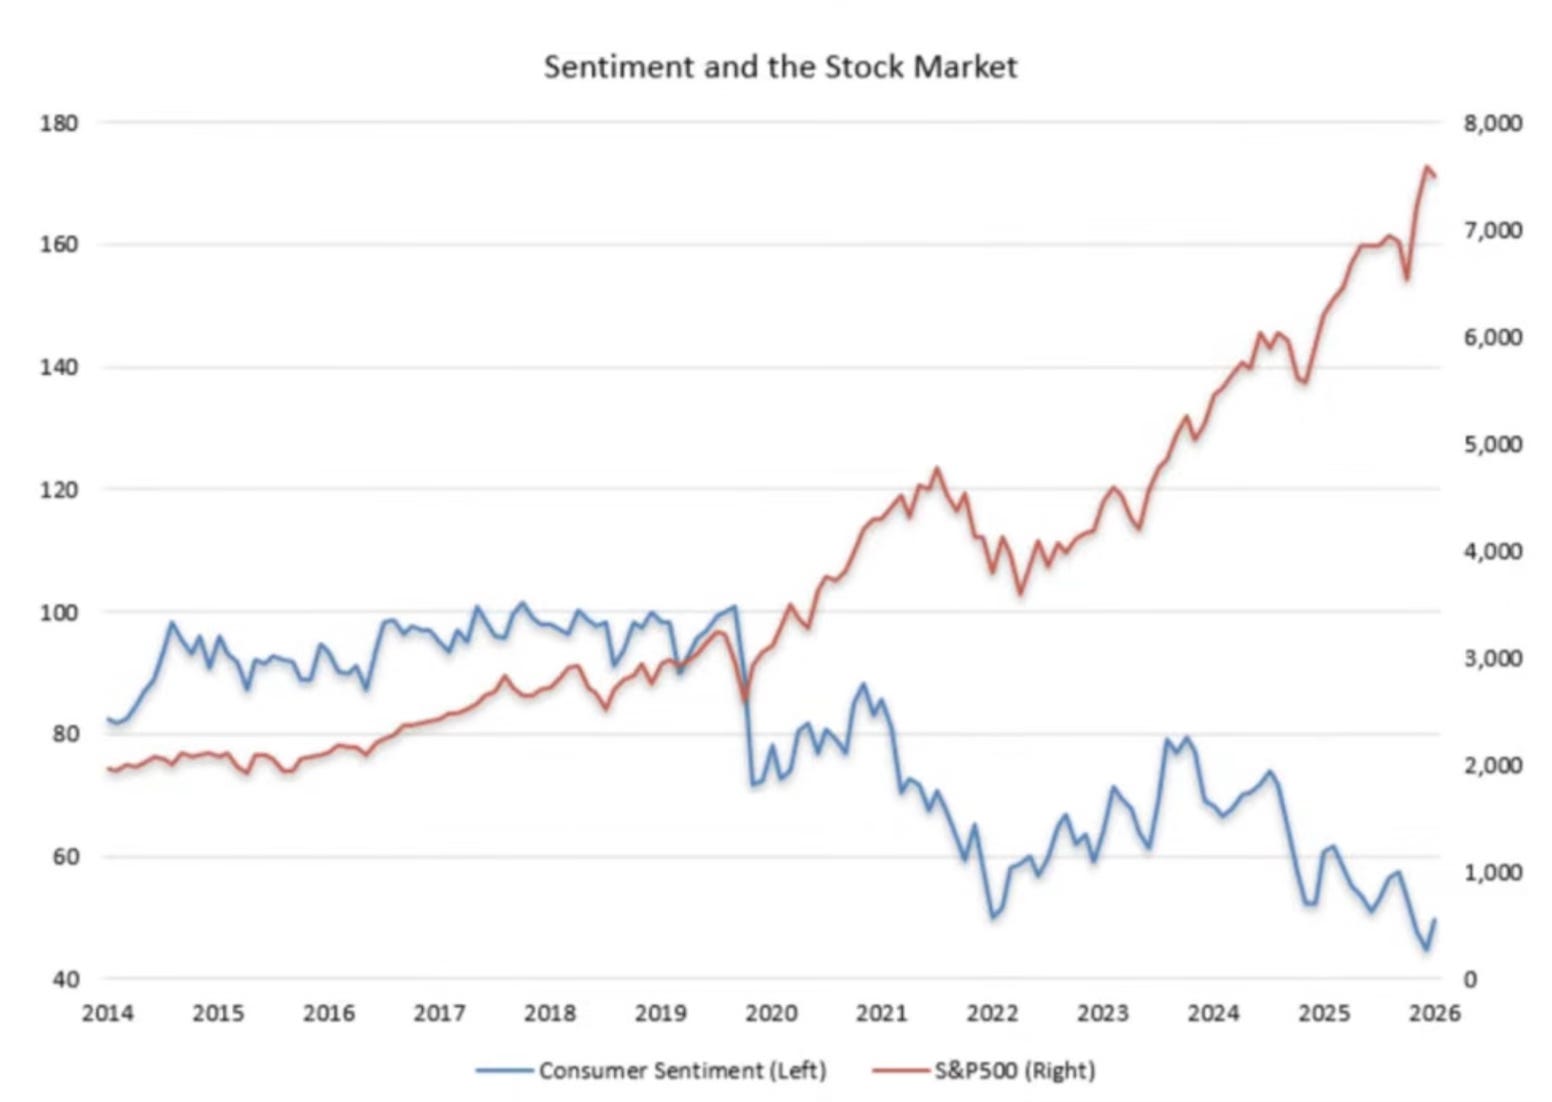
People don’t feel good about the economy. Their portfolios have never told them to feel better. That disconnect has to resolve somehow. Either sentiment catches up to the market, or the market catches up to sentiment.
The Backdrop Nobody Can Fix Quickly
Last one, and it’s less about the market and more about the ground it’s all standing on. US debt held by the public just crossed back toward levels not seen since World War Two, relative to the size of the economy.
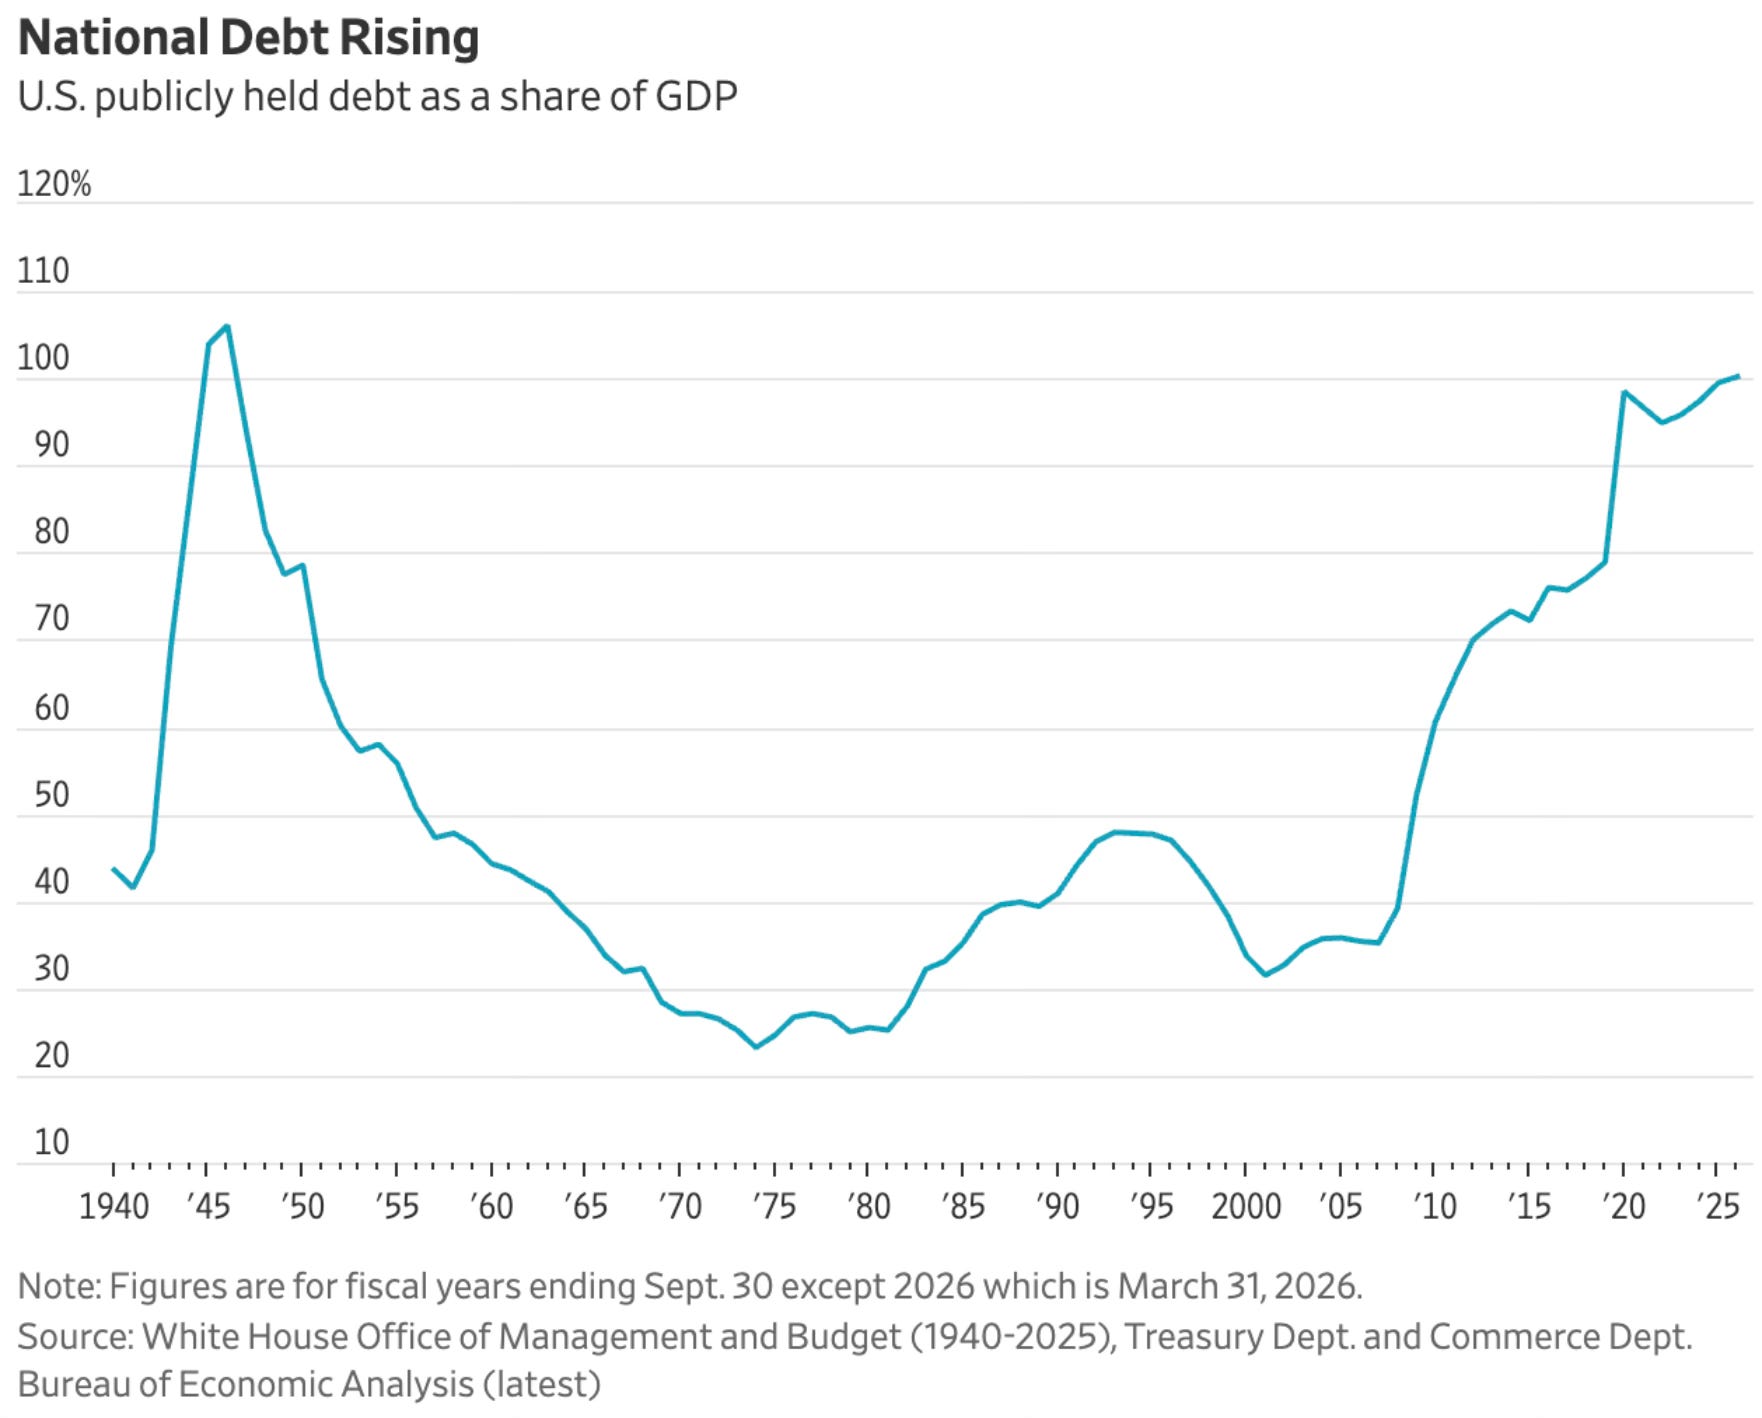
This is a slow moving story, not a this week story. But it sets the table for everything else. Higher debt levels mean less room for the government to step in and cushion the next slowdown the way it has in the past.
Where I Land
So. Are these reasons to be bearish?
Some of them, sure. Taken together, they’re at minimum reasons to stay disciplined. Stretched valuations, fading buyback support, retail pulling back, and a market that’s leaning harder on a handful of AI names than it has in 25 years. That’s not nothing.
But I’m still not bearish. I still think the long term winners in this AI buildout are worth owning through the noise, and I laid out exactly why, along with the names I’m sticking with, in my 2nd Half Outlook last week. If you haven’t read it yet, that’s the natural next stop after this one.
I’ll keep collecting these as they land in my inbox. If the pile keeps growing, you’ll be the first to know.
👉 Read the 2nd Half Outlook here
Thank you for reading! If you enjoyed Spilled Coffee, please subscribe.
Spilled Coffee grows through word of mouth. Please consider sharing this post with someone who might appreciate it.